Article

Transcriptome Analyses of In Vitro Exercise Models by Clenbuterol Supplementation or Electrical Pulse Stimulation

Department of Nutritional Physiology, Institute of Medical Nutrition, Tokushima University Graduate School, 3-18-15 Kuramoto-cho, Tokushima 770-8503, Japan
*
Author to whom correspondence should be addressed.
Appl. Sci. 2021, 11(21), 10436; https://doi.org/10.3390/app112110436
Submission received: 15 September 2021 / Revised: 1 November 2021 / Accepted: 4 November 2021 / Published: 6 November 2021
(This article belongs to the Special Issue Advances in Skeletal Muscle)

Abstract

:
Exercise has beneficial effects on human health and is affected by two different pathways; motoneuron and endocrine. For the advancement of exercise research, in vitro exercise models are essential. We established two in vitro exercise models using C2C12 myotubes; EPS (electrical pulse stimulation) for a motoneuron model and clenbuterol, a specific β2 adrenergic receptor agonist, treatment for an endocrine model. For clenbuterol treatment, we found that Ppargc1a was induced only in low glucose media (1 mg/mL) using a 1-h treatment of 30 ng/mL clenbuterol. Global transcriptional changes of clenbuterol treatment were analyzed by RNA-seq and gene ontology analyses and indicated that mitogenesis and the PI3K-Akt pathway were enhanced, which is consistent with the effects of exercise. Cxcl1 and Cxcl5 were identified as candidate myokines induced by adrenaline. As for the EPS model, we compared 1 Hz of 1-pulse EPS and 1 Hz of 10-pulse EPS for 24 h and determined Myh gene expressions. Ten-pulse EPS induced higher Myh2 and Myh7 expression. Global transcriptional changes of 10-pulse EPS were also analyzed using RNA-seq, and gene ontology analyses indicated that CaMK signaling and hypertrophy pathways were enhanced, which is also consistent with the effects of exercise. In this paper, we provided two transcriptome results of in vitro exercise models and these databases will contribute to advances in exercise research.

1. Introduction

Exercise has beneficial effects in the prevention and treatment of a number of diseases, such as metabolic diseases, psychiatric diseases, neurological diseases, cardiovascular diseases, musculo-skeletal disorders, and cancer [1,2,3,4]. Skeletal muscles, which are one of the major tissues used to perform exercise, are also affected by exercise causing increased insulin sensitivity, myokine secretion, muscle fiber type shifts, and increased muscle mass. In particular, mimicking physical exercise, achieved by neuromuscular electrical stimulation, has been shown to improve skeletal muscle regeneration in the elderly [5,6]. During exercise, motoneuron firing induces intramyofibrillar Ca2+ release from the sarcoplasmic reticulum to trigger muscle contraction through myosin heavy chain ATPase activity, while systemic conditions, such as increased sympathetic nervous system activity, release of fatty acids, and glucocorticoid secretion, are changed. These stimuli synergistically or additively induce transcriptomic activation or repression in skeletal muscles [7,8,9]. Transcriptomic modification is classified by the expression patterns of two groups: acute response genes and slow response genes. Acute response genes are induced shortly after exercise and this gene induction does not last for a long time. Ppargc1a is a well-known acute exercise induced gene [10]. On the other hand, chronic reactive genes are not induced by a single bout of exercise; however, once the gene expression is modified, it is maintained for longer period of time, such as with Myh genes [11].
Calcium released from the sarcoplasmic reticulum acts as an important transcriptional regulator, which activates calcineurin, a calcium/calmodulin-regulated protein phosphatase, and CaMK, calcium- and calmodulin-dependent protein kinase. Calcineurin induces translocation of NFAT proteins to the nucleus and causes transcriptional activation. The calcineurin-NFAT pathway increases Myh2 expression in fast-type muscles and Myh7 in slow-type muscles. CaMK phosphorylates HDAC (histone deacetylase) to induce nuclear export, which complexes with MEF2 proteins to repress MEF2-dependent genes, such as Myh7. Both calcium-induced transcriptions lead fiber-type shifts to a slow type [12].
Adrenalin secretion is increased during exercise to satisfy the energy demand via increased heart rate, respiration, glycogenolysis in the liver, and lipolysis in white adipose tissue. Adrenaline acts through adrenoreceptors, which are found in skeletal muscles, cardiac muscle, smooth muscle, and the brain [13]. In particular, skeletal muscles express β2-adrenoceptor, which plays a role in vasodilation and increased contraction velocity in skeletal muscle, as well as in carbohydrate degradation [14]. Clenbuterol is a specific agonist of β2-adrenoceptor and is usually used as a bronchodilator for airway obstructive disorders, such as bronchial asthma and chronic bronchitis; clenbuterol is also an anabolic steroid, which is a banned drug and has been designated by the World Anti-Doping Agency (WADA) as being used for doping. Clenbuterol has been shown to induce skeletal muscle hypertrophy and a type change from a slow to fast muscle type by increasing IGF-1 expression [15,16,17]. Ppargc1a has been shown to also be under the control of clenbuterol in in vivo treatments [18].
To elucidate the molecular mechanisms of transcriptional regulation of in vivo exercise, we factored the exercise into muscle contraction induced by motoneuron activity and the effect of endocrines. As an in vitro muscle contraction model, electrical pulse stimulation (EPS) has been widely used [19,20]. EPS induces calcium release from the sarcoplasmic reticulum, therefore EPS enables analysis of calcium signaling in vitro. Global transcriptional analyses of EPS have recently been published by two different groups [21,22]. Both experiments focused on relatively short-term EPS treatments. In this paper, we performed global transcriptome analyses of 24 h of continuous EPS treatment as a model of muscle contraction. In addition, global transcriptional analyses of 1 h of clenbuterol treatment were also performed as a model of endocrine stimulation.

2. Materials and Methods

2.1. Cell Culture

The C2C12 cell line was obtained from Dr. Shinichiro Hayashi. Mouse C2C12 cells were maintained in Dulbecco’s Modified Eagle’s Medium-high glucose (DMEM) (4.5 mg/mL) (D6429-500ML, Sigma-Aldrich, St. Louis, MO, USA) containing 10% heat-inactivated fetal bovine serum (FBS) (10099-141, Thermo Fischer Scientific, Waltham, MA, USA) and 1% penicillin–streptomycin mixed solution (PS) (26253-84, Nacalai Tesque, Kyoto, Japan). For the EPS experiments and clenbuterol treatment, cells were seeded at 2 × 10⁵ in an 8-well cell culture plate (167064, Thermo Fischer Scientific) and grown in DMEM, 10% FCS, 1% PS in a 5% CO2 atmosphere at 37 °C. Two days later, culture medium was replaced with DMEM containing 2% heat-inactivated horse serum (HS) (16050-122, Thermo Fischer Scientific) and 1% PS. The medium was changed every two days. Seven days later, the fully differentiated myotubes were utilized for EPS experiments or clenbuterol treatment. For clenbuterol treatment, the medium was changed to DMEM-low glucose (1 mg/mL) (D6046-500ML, Sigma-Aldrich) containing 2% HS, 1% PS and 30 ng/mL clenbuterol (032-20441, FUJIFILM Wako Pure Chemical, Osaka, Japan). One hour later, cells were lysed with ISOGEN reagent (319-90211, Nippon Gene, Tokyo, Japan) and stored in a freezer at −80 °C.

2.2. Electrical Pulse Stimulation (EPS)

EPS experiments were performed with a commercially available C-Dish (CLD8WN, IonOptix, Westwood, MA, USA), a function generator (FGX-2220, Texio, Kanagawa, Japan) and an amplifier (T-HVA03, Turtle Industry, Ibaraki, Japan). In the EPS experiment, the medium was changed to DMEM-low glucose (1 mg/mL) containing 2% HS and 1% PS. EPS was applied with one or ten 20-V, 5 ms electrical pulses at 1 Hz (one pulse per second or 10 continuous pulses per second) for 24 h. EPS-induced muscle contraction was confirmed using an optical microscope. The cells were lysed with ISOGEN reagent (319-90211, Nippon Gene) and stored in a freezer at −80 °C.

2.3. RNA Extraction

Total RNA was extracted using ISOGEN Reagent, according to the manufacturer’s instructions and quantified using a Nanodrop 1000 Spectrophotometer (Thermo Fischer Scientific); the purity of the resulting RNA was assessed according to the 260 nm/280 nm ratio.

2.4. Quantitative Real-Time PCR Analysis (qRT-PCR)

A total of 500 ng of total RNA was utilized for reverse transcription to cDNA using PrimeScript RT Master Mix (RR036A, Takara, Shiga, Japan) according to the manufacturer’s instruction. qRT-PCR was performed with a StepOneTM Real Time PCR System (Applied Biosystems, Waltham, MA, USA). The sequences of the used primers are shown in Table 1. Relative gene expression was normalized with Actb.

2.5. RNA-Sequence

Libraries were generated from 1 μg of total RNA using an Illumina TruSeq stranded mRNA LT Sample Prep Kit (Illumina, San Diego, CA, USA) according to the manufacturer’s instructions. Each library was sequenced on a Novaseq 6000 (Illumina) with a NovaSeq 6000 S4 Reagent Kit v1.5 (Illumina, San Diego, CA, USA) using 101 base pair end. The reads were mapped on the mouse genome (mm10) with HISTAT2 and read numbers were counted by Stringtie. Differentially expressed genes were determined by exactTest using edgeR after normalization. RNA sequencing data were deposited in the Gene Expression Omnibus under accession no. GSE183159. Pathway analysis was performed using DAVID Bioinformatics Resources [23,24] and Ingenuity Pathway Analysis (IPA).

2.6. Statistical Analysis

All graphs represent mean values ± SD. Unpaired Student’s t tests were used when the two groups were analyzed. One-way ANOVA were used for three or more groups.

3. Results

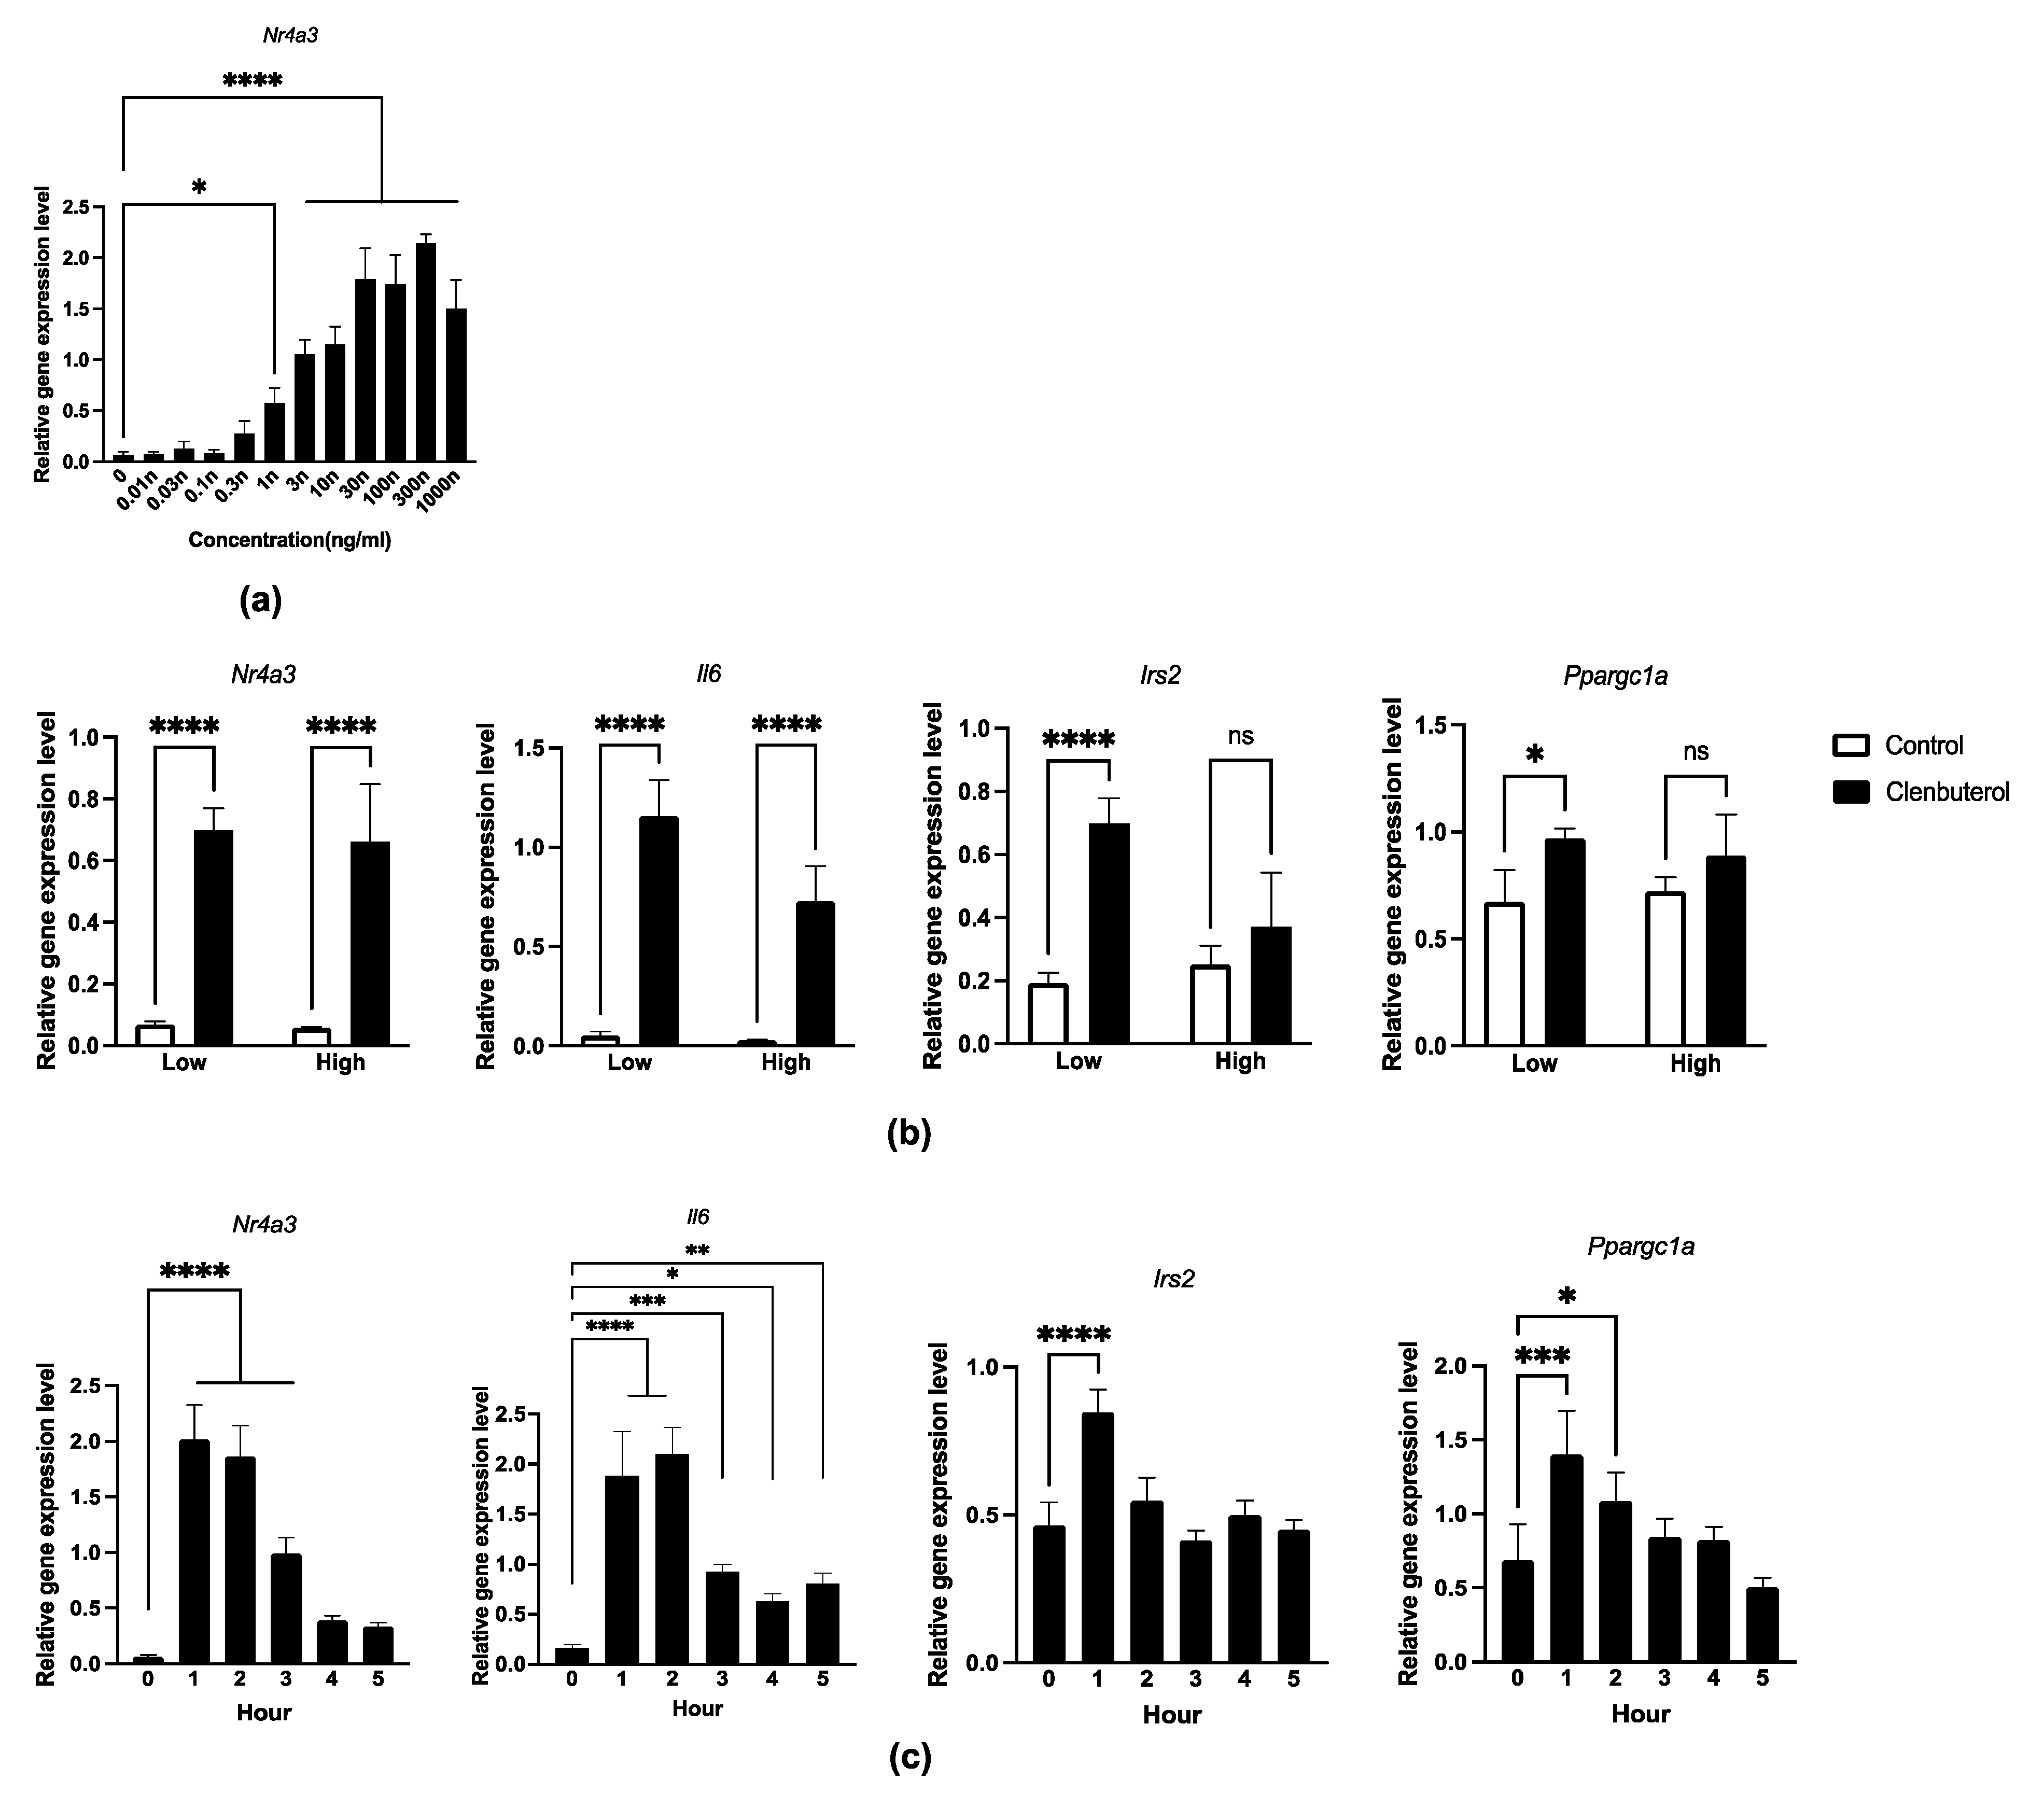
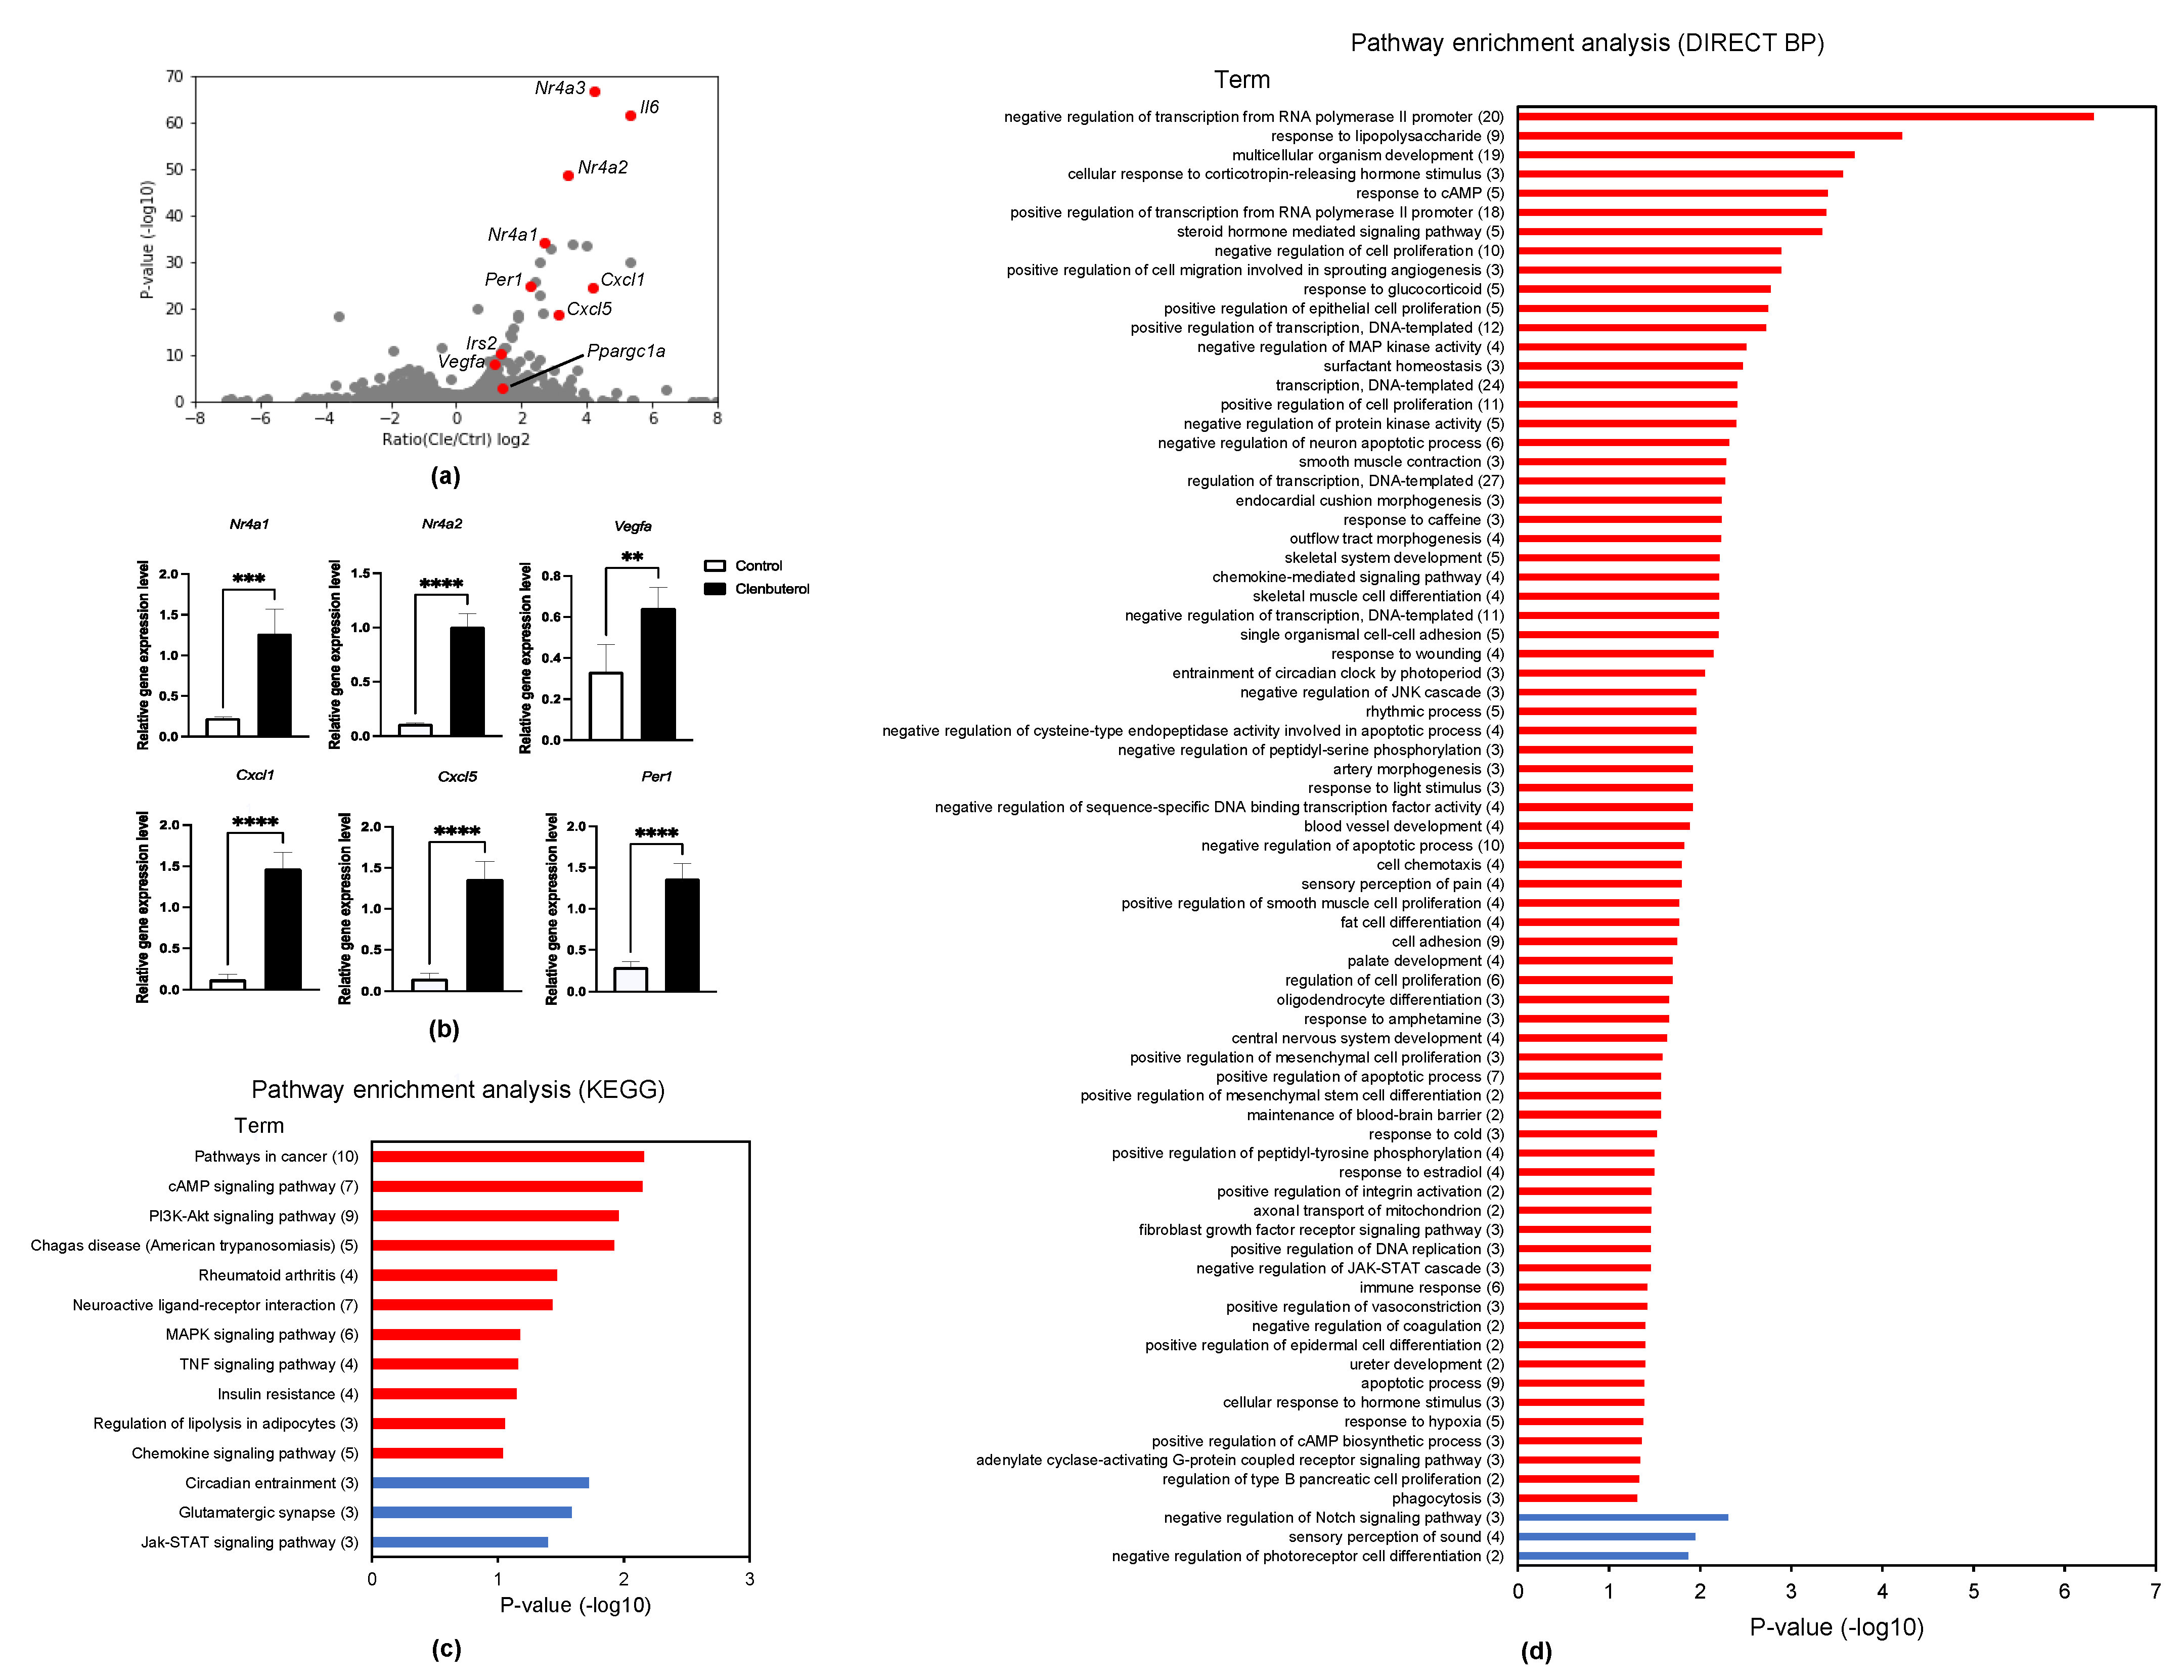
3.1. Acute Transcriptional Induction by Clenbuterol Supplementation

To establish an in vitro acute exercise model, we determined the clenbuterol treatment protocol in C2C12 myotubes. Acute transcriptional induction by exercise was observed at one hour after exercise [25,26]; therefore, the duration of clenbuterol treatment was determined to be one hour. Different concentrations of clenbuterol were supplemented and Nr4a3 gene induction, a stable target of β2-adrenergic signaling in multiple tissues [27], was examined (Figure 1a). A total of 30 ng/mL clenbuterol significantly and reliably induced Nr4a3 gene expression; thereafter we used 30 ng/mL of clenbuterol. To evaluate whether exercise-induced genes were also induced by clenbuterol treatment, Irs2, Nr4a3, Ppargc1a, and Il6 were determined at two different glucose concentrations: low glucose (1 mg/mL) and high glucose (4.5 mg/mL) (Figure 1b). Nr4a3 and Il6 expressions were increased by more than 10-fold, both in low glucose and in high glucose conditions. In contrast, interestingly, Irs2 and Ppargc1a induction was observed only in the low glucose condition. This result indicated that standard high glucose DMEM media impaired gene induction by clenbuterol; therefore, we used low glucose DMEM for gene expression analysis. In fact, the 4.5 mg/mL glucose level was too high compared with physiological blood glucose concentrations.
Acute aerobic exercise promotes gene expression in skeletal muscle, which does not last for a day [28]. Thus, we next examined gene expression at different times after clenbuterol supplementation. Expression levels of Nr4a3, Il6, Ppargc1a, and Irs2, were increased significantly within 1 h of clenbuterol supplementation and the expression levels gradually decreased over time (Figure 1c). These results indicated that the clenbuterol treatment model was consistent with acute gene response by exercise.

3.2. RNA-Seq Analysis in Clenbuterol-Supplemented Myotubes

To clarify global transcriptional regulation in clenbuterol treatment, clenbuterol-treated C2C12 myotubes were analyzed using RNA-seq (Figure 2a). Four-hundred-and-two genes were identified as differentially expressed genes (DEGs) with statistical significance (exactTest raw p < 0.05) and a fold change greater than 2-fold. We validated nuclear receptor subfamily 4 group A member 1 (Nr4a1), nuclear receptor subfamily 4 group A member 2 (Nr4a2), vascular endothelial growth factor A (Vegfa), C-X-C motif chemokine ligand 1 (Cxcl1), C-X-C motif chemokine ligand 5 (Cxcl5), and period circadian regulator 1 (Per1) using qPCR experiments, in which expression levels were greatly increased in the clenbuterol-supplemented myotubes (Figure 2b). Cxcl1 and Cxcl5 were identified as a new target of clenbuterol. The enriched pathways are analyzed using the Kyoto Encyclopedia of Genes and Genomes (KEGG) [29] (Figure 2c) and DIRECT BP (Figure 2d). Adrenaline is known to activate cAMP signaling, therefore, enrichment of cAMP signaling pathway by KEGG analysis and by DIRECT BP analysis was consistent. PI3k-Akt signaling, downstream of IGF-I, is also important for muscle hypertrophy. It is noted that adrenaline can regulate circadian rhythm.

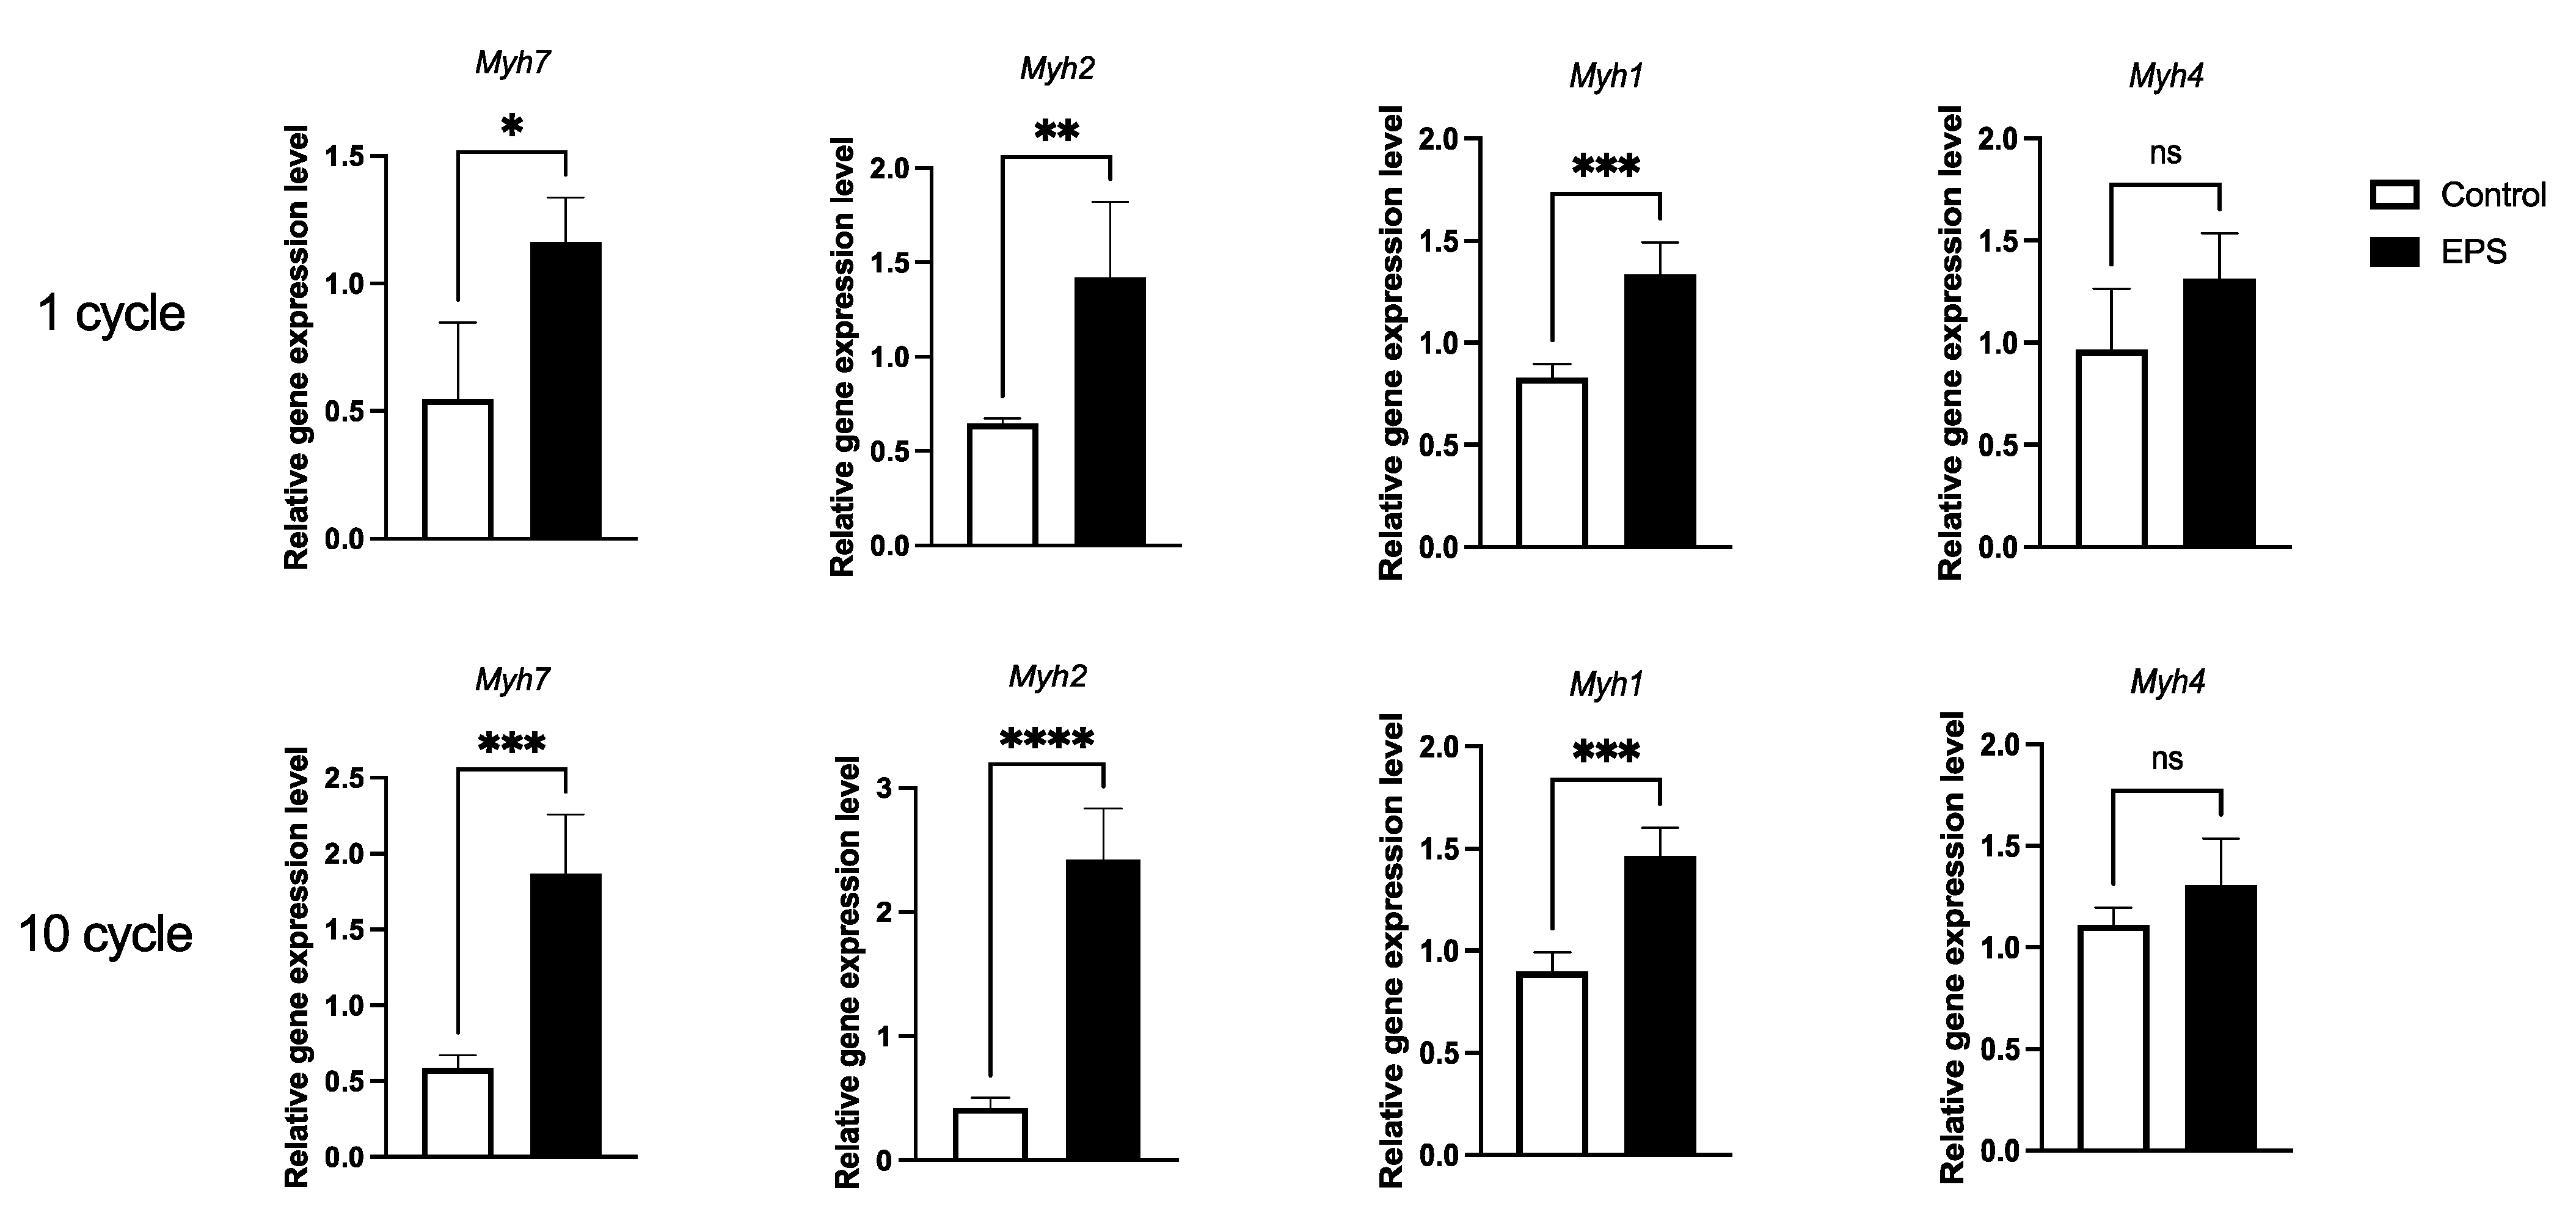
3.3. Twenty-Four-Hour Electrical Pulse Stimulation in C2C12 Myotubes Induced Myh7 and Myh2

Electrical pulse stimulation (EPS) experiments have been performed by several researchers, using slightly different protocols regarding duration, voltage, frequency and pulse number [19,30,31,32]. We used the most standard EPS conditions (24-h duration, 20 voltage and 1 Hz frequency) and compared two pulse number conditions; 1 or 10 pulses (Figure 3). Obvious cell death was observed neither with the 1-pulse condition nor with the 10-pulse condition. Myh7 gene expression is known to be induced by EPS; therefore, we also examined Myh gene expression to evaluate EPS efficiency on transcription. Myh7, Myh2 and Myh1 were significantly induced, both by 1 pulse and 10 pulses, whereas Myh4 was not induced. Comparing the 1-pulse condition with the 10-pulse condition, 10 pulses induced Myh7 and Myh2 more strongly compared with 1 pulse. We further analyzed global transcriptional modification via RNA-sequencing.

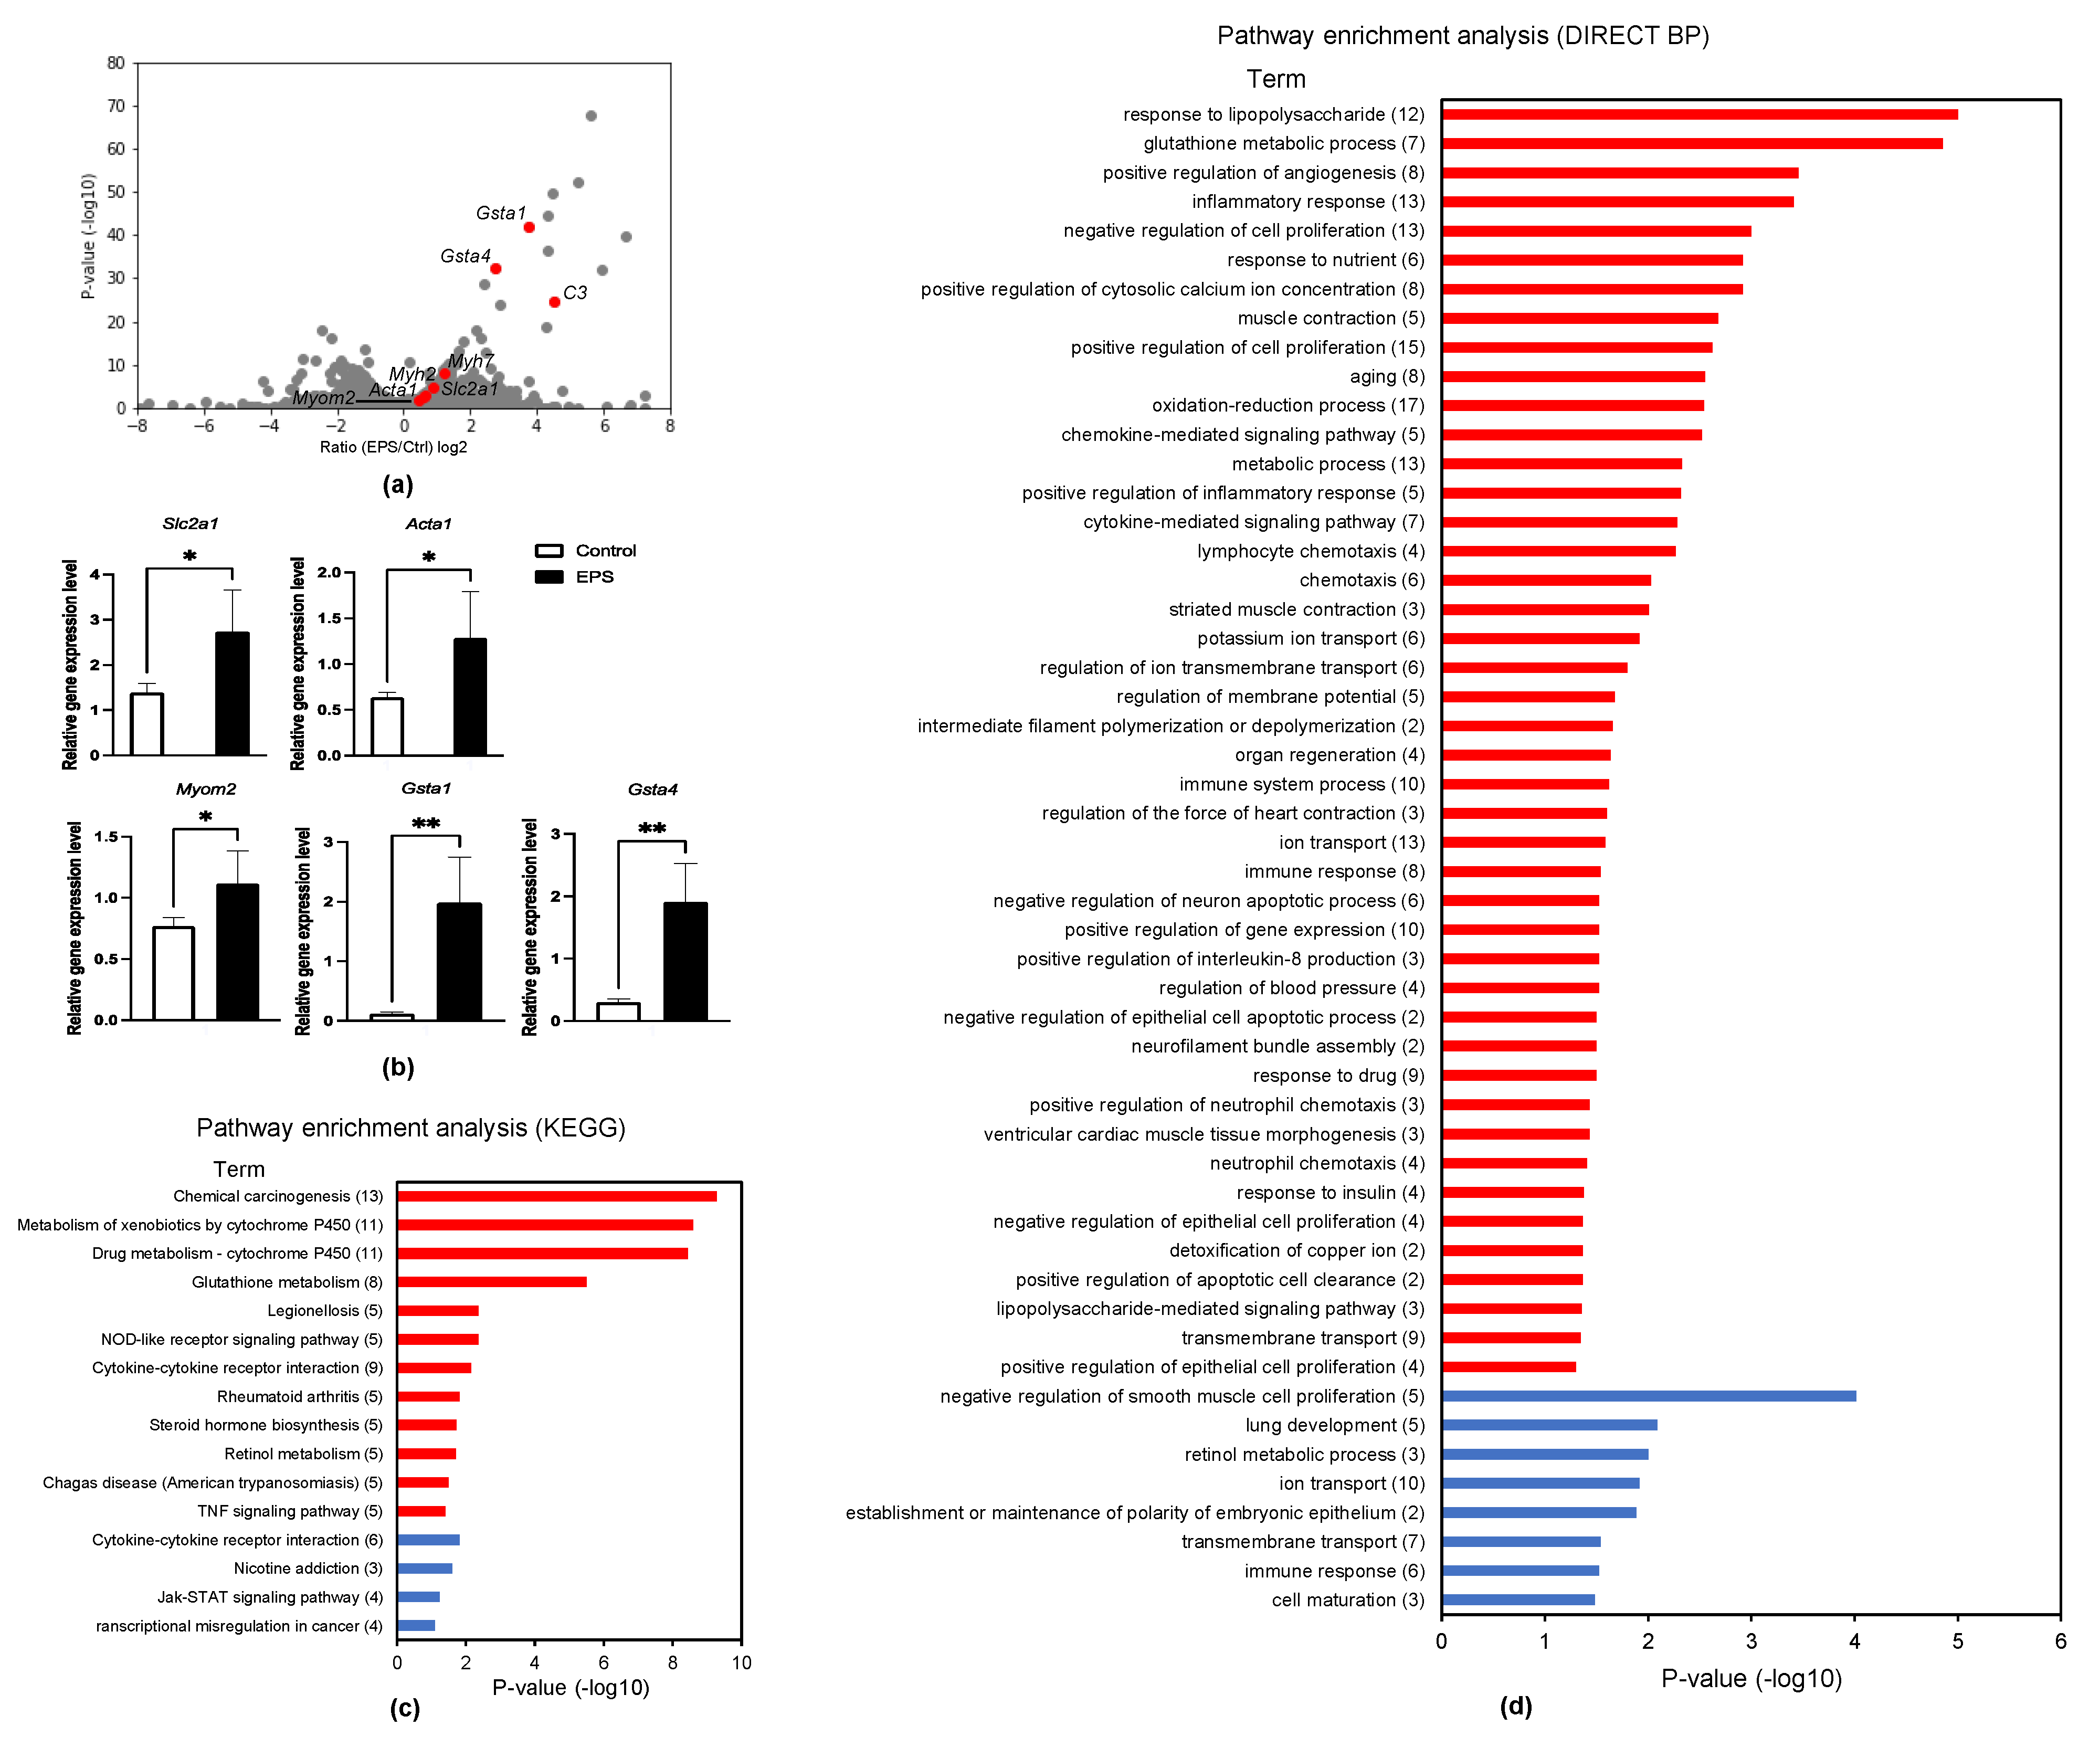
3.4. RNA-Seq Analysis in EPS Myotubes
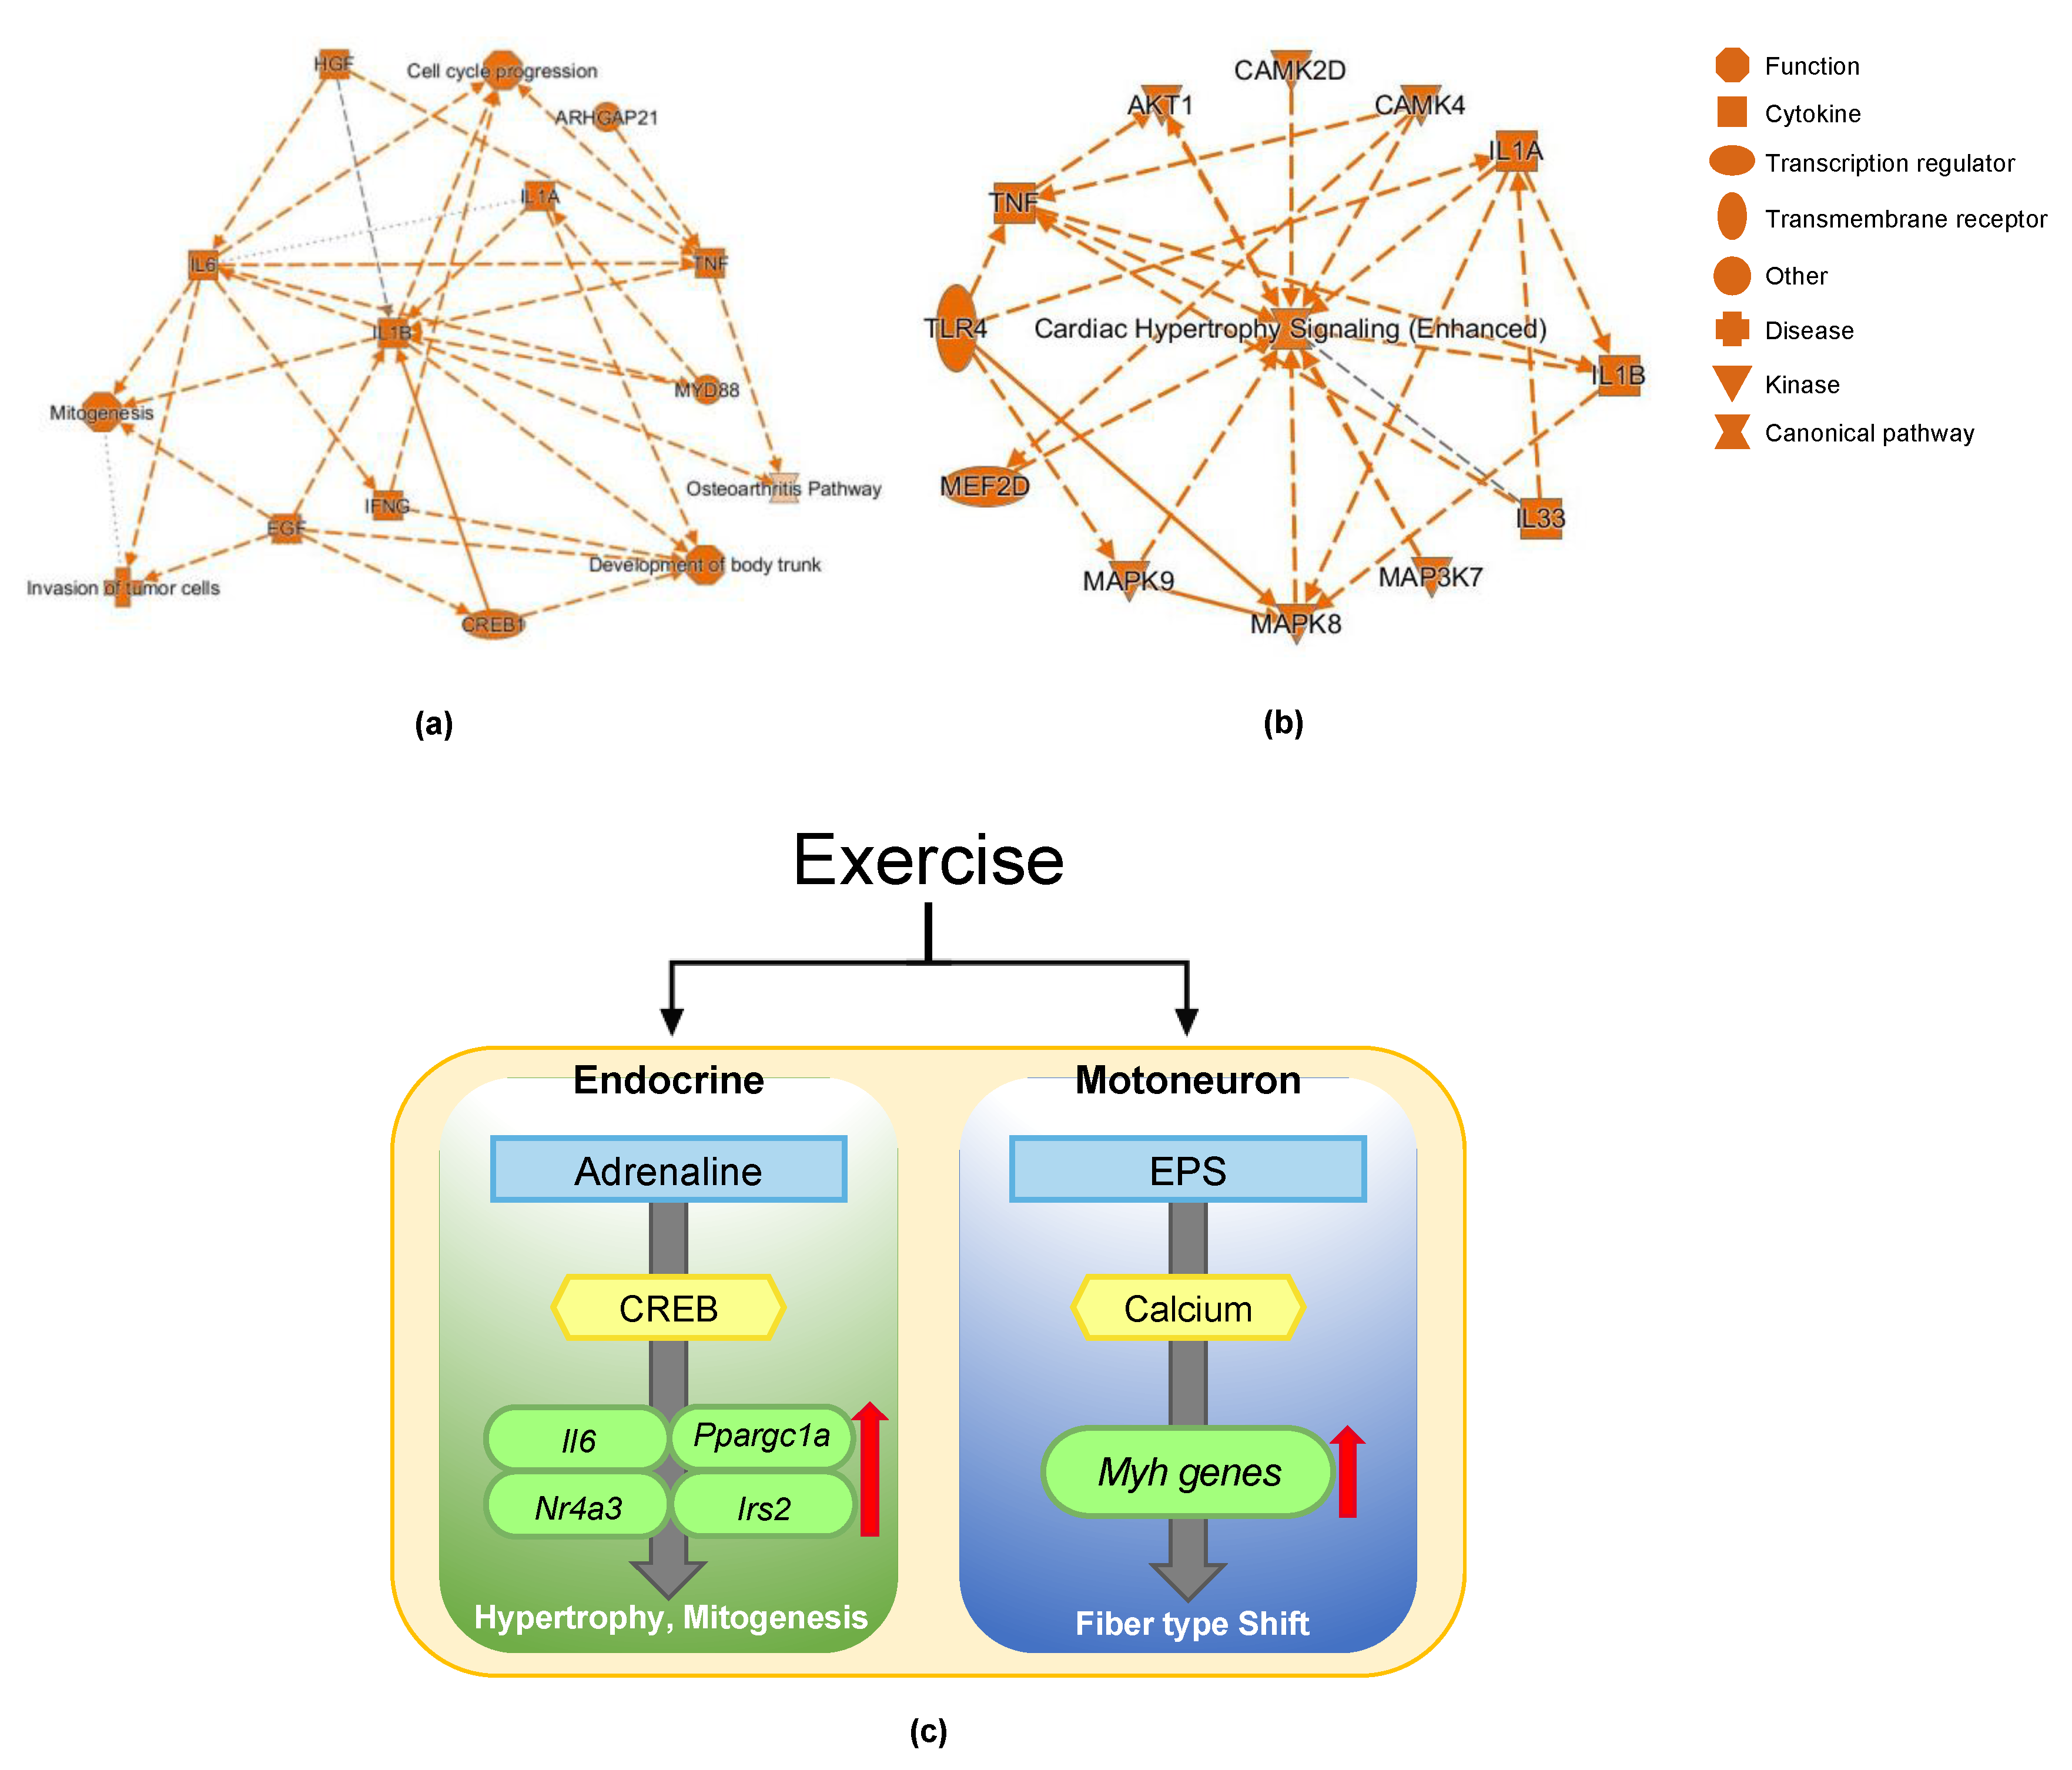
To clarify global transcriptional regulation with 24-h EPS, EPS-applied C2C12 myotubes were analyzed by RNA-seq (Figure 4a). A total of 575 genes were identified as differentially expressed genes (DEGs) with statistical significance (exactTest raw p < 0.05) and a fold change more than 2-fold. In addition to Myh7 and Myh2, RNA-seq revealed that sarcomeric genes, such as Acta1 and Myom1, were also induced by EPS. Slc2a1, which codes GLUT1 (glucose transporter 1), was also increased, which might contribute to insulin sensitivity increased by exercise. We validated Gsta1, Gsta4, Slc2a1, Acta1, and Myom2 with qPCR experiments, in which expression levels were greatly increased in the EPS-applied myotubes (Figure 4b). Gsta1, Gsta4, and Slc2a1 were identified as new targets of EPS. These results suggested that EPS increased antioxidant pathway and glucose metabolism. The enriched pathways are analyzed by KEGG [29] (Figure 4c) and DIRECT BP (Figure 4d). Both analyses identified cytokine–cytokine receptor interaction and glutathione metabolism (Figure 4c).

3.5. IPA Analysis

To visualize the results of RNA-seq, we analyzed the RNA-seq of the clenbuterol experiment and EPS experiment by IPA (Figure 5a,b). IPA indicated that CREB1 acts as an upstream transcription factor to mediate clenbuterol-dependent transcriptional regulation and mitogenesis, cell cycle progression, and the development of body trunk were induced (Figure 5a). In the case of EPS experiment, CAMK2D/4 and MEF2D were predicted to induce cardiac hypertrophy signaling (Figure 5b). These results are consistent with the importance of CREB1 in adrenaline signaling and the CAMK–MEF2 axis in muscle contraction.

4. Discussion

In this study, we factored the effect of exercise into motoneuron activity and endocrines and established two in vitro exercise models for the research of transcription using clenbuterol treatment and EPS experiments. We analyzed global transcriptional regulation by RNA-seq in both models. The IPA analyses summarized the RNA-seq results and are shown in Figure 5a,b. RNA-seq analyses revealed that clenbuterol regulated hypertrophic effect and mitogenesis pathway and EPS-regulated sarcomeric gene transcription to achieve fiber type shift (Figure 5c).
Ppargc1a and Irs2 are important genes to achieve the effect of exercise, mitogenesis and insulin/IGF-1 signaling. The induction of Ppargc1a and Irs2 by clenbuterol was observed only in low glucose media (Figure 1). The precise mechanism causing the difference between high glucose media and low glucose media is not clear. High glucose concentration is reported to induce phosphorylation of HDAC5 by CaMKII and nuclear export of HDAC5 in C2C12 myotubes [33]. HDAC5 is a transcriptional suppresser, therefore nuclear export of HDAC5 might be directly or indirectly related with induction of Ppargc1a and Irs2 by clenbuterol. To examine the physiological meaning of the impaired induction of Ppargc1a and Irs2 by adrenaline, diabetic patients or animal models would be useful to test induction of Ppargc1a and Irs2 by exercise in future research.
Exercise affects the whole body through myokines, bioactive molecule secreted from skeletal muscles, which include Irisin, IGF-I, Il6 and so on. EPS was reported to increase the mRNA expression of Il6, Cxcl1, and Cxcl5 in C2C12 myotubes and human primary myoblasts [31,34]. Consistent with previous reports, our RNA-seq analysis of 24 h EPS also identified up-regulation of Il6, Cxcl1 and Cxcl5. In addition, clenbuterol treatment surprisingly induced Il6, Cxcl1 and Cxcl5 gene expression (Figure 1 and Figure 2). Although the meaning of the existence of common target genes is not clear, those genes might act as myokines to inform the other tissues expressing their corresponding receptors about the occurrence of transcriptional changes in skeletal muscles.
Clenbuterol treatment induced gene expression of Nr4a3, Irs2, and Ppargc1a within 1 h, whereas EPS needed longer to induce Myh7 and Myh2 gene expression. The gene induction speed was different between clenbuterol treatment and EPS. Transcription is closely related with epigenome, chemical modification without DNA sequence change such as methylation of DNA, acetylation and methylation of histone proteins and turnover of histone protein variants. Depending of epigenetic modification, the speed of transcriptional suppression and activation is different and acetylation of histone responds faster than H3K9 methylation or DNA methylation [35]. The difference of gene induction speed might be explained from the point of epigenetic regulation. As for epigenetic analysis of exercise, exercise led to enhanced hypoacetylation of histone 3 lysine 27 [36]. Recently, it was also reported that chronic exercise training induces histone turnover to histone variant H3.3 and enhanced gene responses to exercise [37]. However, the responsible biological signal for epigenetic modification is not clear. As another possibility, different sets and number of transcription factors might explain the difference in transcriptomic responses. It was reported that CREB/ATF/AP1-, MYC/MAX- and E2F-related transcription factors are associated with the acute response genes in in vivo exercise and IRF- and STAT-related transcription factors were associated with chronic response genes [38,39]. For the advanced molecular mechanistic analyses, our in vitro exercise models would be useful.
In conclusion, exercise effects on transcription are factorized into muscle contraction and adrenaline stimulation. The transcriptome analyses identified new insights into future study in the field of muscles.

Author Contributions

Conceptualization, I.S.; methodology, I.S., A.K. and T.U.; software, I.S.; validation, T.F. and I.S.; formal analysis, T.F. and I.S.; investigation, T.F. and I.S.; resources, I.S.; data curation, T.F. and I.S.; writing—original draft preparation, T.F. and I.S.; writing—review and editing, T.F., T.N. and I.S.; visualization, T.F., M.T. and I.S.; supervision, I.S.; project administration, I.S.; funding acquisition, T.N. and I.S. All authors have read and agreed to the published version of the manuscript.

Funding

This research was funded by Japan Society for the Promotion of Science (JSPS) KAKENHI Grants (JP21K11677, JP18H04981 and JP19H04054) and AMED-CREST (Grant Number: JP19gm0810009h0104).

Institutional Review Board Statement

Not applicable.

Informed Consent Statement

Not applicable.

Data Availability Statement

RNA sequencing data have been deposited in the Gene Expression Omnibus as accession no. GSE183159.

Acknowledgments

IPA analysis was supported by Support Center for Advanced Medical Sciences, Tokushima University Graduate School of Biomedical Sciences.

Conflicts of Interest

The authors declare no conflict of interest.

References

  1. Aldana, S.G.; Greenlaw, R.L.; Diehl, H.A.; Salberg, A.; Merrill, R.M.; Ohmine, S.; Thomas, C. Effects of an intensive diet and physical activity modification program on the health risks of adults. J. Am. Diet. Assoc. 2005, 105, 371–381. [Google Scholar] [CrossRef]
  2. Pedersen, B.K.; Saltin, B. Exercise as medicine—Evidence for prescribing exercise as therapy in 26 different chronic diseases. Scand. J. Med. Sci. Sport. 2015, 25, 1–72. [Google Scholar] [CrossRef] [PubMed] [Green Version]
  3. Hegde, B.M. Health benefits of exercise. Kuwait Med. J. 2018, 50, 143–145. [Google Scholar] [CrossRef]
  4. Handschin, C.; Spiegelman, B.M. The role of exercise and PGC1α in inflammation and chronic disease. Nature 2008, 454, 463–469. [Google Scholar] [CrossRef] [PubMed] [Green Version]
  5. Mancinelli, R.; Toniolo, L.; Di Filippo, E.S.; Doria, C.; Marrone, M.; Maroni, C.R.; Verratti, V.; Bondi, D.; Maccatrozzo, L.; Pietrangelo, T.; et al. Neuromuscular Electrical Stimulation Induces Skeletal Muscle Fiber Remodeling and Specific Gene Expression Profile in Healthy Elderly. Front. Physiol. 2019, 10, 1–11. [Google Scholar] [CrossRef] [PubMed] [Green Version]
  6. Di Filippo, E.S.; Mancinelli, R.; Marrone, M.; Doria, C.; Verratti, V.; Toniolo, L.; Dantas, J.L.; Fulle, S.; Pietrangelo, T. Neuromuscular electrical stimulation improves skeletal muscle regeneration through satellite cell fusion with myofibers in healthy elderly subjects. J. Appl. Physiol. 2017, 123, 501–512. [Google Scholar] [CrossRef] [Green Version]
  7. Chapman, M.A.; Arif, M.; Emanuelsson, E.B.; Reitzner, S.M.; Lindholm, M.E.; Mardinoglu, A.; Sundberg, C.J. Skeletal Muscle Transcriptomic Comparison between Long-Term Trained and Untrained Men and Women. Cell Rep. 2020, 31. [Google Scholar] [CrossRef]
  8. Pillon, N.J.; Gabriel, B.M.; Dollet, L.; Smith, J.A.B.; Sardón Puig, L.; Botella, J.; Bishop, D.J.; Krook, A.; Zierath, J.R. Transcriptomic profiling of skeletal muscle adaptations to exercise and inactivity. Nat. Commun. 2020, 11. [Google Scholar] [CrossRef] [Green Version]
  9. Contrepois, K.; Wu, S.; Moneghetti, K.J.; Hornburg, D.; Ahadi, S.; Tsai, M.S.; Metwally, A.A.; Wei, E.; Lee-McMullen, B.; Quijada, J.V.; et al. Molecular Choreography of Acute Exercise. Cell 2020, 181, 1112–1130.e16. [Google Scholar] [CrossRef] [PubMed]
  10. Goto, M.; Terada, S.; Kato, M.; Katoh, M.; Yokozeki, T.; Tabata, I.; Shimokawa, T. cDNA Cloning and mRNA analysis of PGC-1 in epitrochlearis muscle in swimming-exercised rats. Biochem. Biophys. Res. Commun. 2000, 274, 350–354. [Google Scholar] [CrossRef]
  11. Booth, F.W.; Ruegsegger, G.N.; Toedebusch, R.G.; Yan, Z. Endurance Exercise and the Regulation of Skeletal Muscle Metabolism. Prog. Mol. Biol. Transl. Sci. 2015, 135, 129–151. [Google Scholar] [CrossRef]
  12. Schiaffino, S.; Reggiani, C. Fiber types in mammalian skeletal muscles. Physiol. Rev. 2011, 91, 1447–1531. [Google Scholar] [CrossRef] [PubMed] [Green Version]
  13. AHLQUIST, R.P. A study of the adrenotropic receptors. Am. J. Physiol. 1948, 153, 586–600. [Google Scholar] [CrossRef]
  14. Davis, E.; Loiacono, R.; Summers, R.J. The rush to adrenaline: Drugs in sport acting on the β-adrenergic system. Br. J. Pharmacol. 2008, 154, 584–597. [Google Scholar] [CrossRef] [Green Version]
  15. Awede, B.L.; Thissen, J.P.; Lebacq, J. Role of IGF-I and IGFBPs in the changes of mass and phenotype induced in rat soleus muscle by clenbuterol. Am. J. Physiol.-Endocrinol. Metab. 2002, 282, 31–37. [Google Scholar] [CrossRef] [Green Version]
  16. Abo, T.; Iida, R.H.; Kaneko, S.; Suga, T.; Yamada, H.; Hamada, Y.; Yamane, A. IGF and myostatin pathways are respectively induced during the earlier and the later stages of skeletal muscle hypertrophy induced by clenbuterol, a β2-adrenergic agonist. Cell Biochem. Funct. 2012, 30, 671–676. [Google Scholar] [CrossRef] [PubMed]
  17. Kitaoka, Y.; Watanabe, D.; Nonaka, Y.; Yagishita, K.; Kano, Y.; Hoshino, D. Effects of clenbuterol administration on mitochondrial morphology and its regulatory proteins in rat skeletal muscle. Physiol. Rep. 2019, 7, 1–9. [Google Scholar] [CrossRef] [PubMed] [Green Version]
  18. Miura, S.; Kawanaka, K.; Kai, Y.; Tamura, M.; Goto, M.; Shiuchi, T.; Minokoshi, Y.; Ezaki, O. An increase in murine skeletal muscle peroxisome proliferator-activated receptor-γ coactivator-1α (PGC-1α) mRNA in response to exercise is mediated by β-adrenergic receptor activation. Endocrinology 2007, 148, 3441–3448. [Google Scholar] [CrossRef] [PubMed] [Green Version]
  19. Nikolić, N.; Görgens, S.W.; Thoresen, G.H.; Aas, V.; Eckel, J.; Eckardt, K. Electrical pulse stimulation of cultured skeletal muscle cells as a model for In Vitro exercise-possibilities and limitations. Acta Physiol. 2017, 220, 310–331. [Google Scholar] [CrossRef] [PubMed]
  20. Carter, S.; Solomon, T.P.J. In Vitro experimental models for examining the skeletal muscle cell biology of exercise: The possibilities, challenges and future developments. Pflugers Arch. 2019, 471, 413–429. [Google Scholar] [CrossRef] [Green Version]
  21. Hoshino, D.; Kawata, K.; Kunida, K.; Hatano, A.; Yugi, K.; Wada, T.; Fujii, M.; Sano, T.; Ito, Y.; Furuichi, Y.; et al. Trans-omic Analysis Reveals ROS-Dependent Pentose Phosphate Pathway Activation after High-Frequency Electrical Stimulation in C2C12 Myotubes. iScience 2020, 23, 101558. [Google Scholar] [CrossRef] [PubMed]
  22. Tamura, Y.; Kouzaki, K.; Kotani, T.; Nakazato, K.; Electrically, N.K. Making Cell Culture More Physiological Electrically stimulated contractile activity-induced transcriptomic responses and metabolic remodeling in C 2 C 12 myotubes: Twitch vs. tetanic contractions. Am. J. Physiol. Cell Physiol. 2020, 319, 1029–1044. [Google Scholar] [CrossRef]
  23. Huang, D.W.; Sherman, B.T.; Lempicki, R.A. Bioinformatics enrichment tools: Paths toward the comprehensive functional analysis of large gene lists. Nucleic Acids Res. 2009, 37, 1–13. [Google Scholar] [CrossRef] [Green Version]
  24. Huang, D.W.; Sherman, B.T.; Lempicki, R.A. Systematic and integrative analysis of large gene lists using DAVID bioinformatics resources. Nat. Protoc. 2009, 4, 44–57. [Google Scholar] [CrossRef] [PubMed]
  25. Pilegaard, H.; Osada, T.; Andersen, L.T.; Helge, J.W.; Saltin, B.; Neufer, P.D. Substrate availability and transcriptional regulation of metabolic genes in human skeletal muscle during recovery from exercise. Metabolism 2005, 54, 1048–1055. [Google Scholar] [CrossRef]
  26. Rundqvist, H.C.; Montelius, A.; Osterlund, T.; Norman, B.; Esbjornsson, M.; Jansson, E. Acute sprint exercise transcriptome in human skeletal muscle. PLoS ONE 2019, 14, 1–24. [Google Scholar] [CrossRef] [Green Version]
  27. Myers, S.A.; Eriksson, N.; Burow, R.; Wang, S.C.M.; Muscat, G.E.O. β-Adrenergic signaling regulates NR4A nuclear receptor and metabolic gene expression in multiple tissues. Mol. Cell. Endocrinol. 2009, 309, 101–108. [Google Scholar] [CrossRef]
  28. Gordon, B.S.; Steiner, J.L.; Rossetti, M.L.; Qiao, S.; Ellisen, L.W.; Govindarajan, S.S.; Eroshkin, A.M.; Williamson, D.L.; Coen, P.M. REDD1 induction regulates the skeletal muscle gene expression signature following acute aerobic exercise. Am. J. Physiol. -Endocrinol. Metab. 2017, 313, E737–E747. [Google Scholar] [CrossRef] [PubMed]
  29. Kanehisa, M.; Goto, S. KEGG: Kyoto Encyclopedia of Genes and Genomes. Nucleic Acids Res. 2000, 28, 27–30. [Google Scholar] [CrossRef]
  30. Fujita, H.; Nedachi, T.; Kanzaki, M. Accelerated de novo sarcomere assembly by electric pulse stimulation in C2C12 myotubes. Exp. Cell Res. 2007, 313, 1853–1865. [Google Scholar] [CrossRef]
  31. Nedachi, T.; Fujita, H.; Kanzaki, M. Contractile C2C12 myotube model for studying exercise-inducible responses in skeletal muscle. Am. J. Physiol.-Endocrinol. Metab. 2008, 295. [Google Scholar] [CrossRef] [PubMed] [Green Version]
  32. Burch, N.; Arnold, A.S.; Item, F.; Summermatter, S.; Santos, G.B.S.; Christe, M.; Boutellier, U.; Toigo, M.; Handschin, C. Electric pulse stimulation of cultured murine muscle cells reproduces gene expression changes of trained mouse muscle. PLoS ONE 2010, 5. [Google Scholar] [CrossRef] [Green Version]
  33. Meng, Z.X.; Gong, J.; Chen, Z.; Sun, J.; Xiao, Y.; Wang, L.; Li, Y.; Liu, J.; Xu, X.Z.S.; Lin, J.D. Glucose Sensing by Skeletal Myocytes Couples Nutrient Signaling to Systemic Homeostasis. Mol. Cell 2017, 66, 332–344.e4. [Google Scholar] [CrossRef] [PubMed] [Green Version]
  34. Scheler, M.; Irmler, M.; Lehr, S.; Hartwig, S.; Staiger, H.; Al-Hasani, H.; Beckers, J.; de Angelis, M.H.; Häring, H.U.; Weigert, C. Cytokine response of primary human myotubes in an in vitro exercise model. Am. J. Physiol.-Cell Physiol. 2013, 305, 877–886. [Google Scholar] [CrossRef]
  35. Bintu, L.; Yong, J.; Antebi, Y.E.; McCue, K.; Kazuki, Y.; Uno, N.; Oshimura, M.; Elowitz, M.B. Dynamics of epigenetic regulation at the single-cell level. Science 2016, 351, 720–724. [Google Scholar] [CrossRef] [PubMed] [Green Version]
  36. Ramachandran, K.; Senagolage, M.D.; Sommars, M.A.; Futtner, C.R.; Omura, Y.; Allred, A.L.; Barish, G.D. Dynamic Enhancers Control Skeletal Muscle Identity and Reprogramming. PLoS Biol. 2019, 17, e3000467. [Google Scholar] [CrossRef]
  37. Ohsawa, I.; Kawano, F. Chronic exercise training activates histone turnover in mouse skeletal muscle fibers. FASEB J. 2021, 35, 1–14. [Google Scholar] [CrossRef]
  38. Makhnovskii, P.A.; Zgoda, V.G.; Bokov, R.O.; Shagimardanova, E.I.; Gazizova, G.R.; Gusev, O.A.; Lysenko, E.A.; Kolpakov, F.A.; Vinogradova, O.L.; Popov, D.V. Regulation of Proteins in Human Skeletal Muscle: The Role of Transcription. Sci. Rep. 2020, 10, 1–9. [Google Scholar] [CrossRef] [PubMed] [Green Version]
  39. Popov, X.D.V.; Makhnovskii, P.A.; Shagimardanova, E.I.; Gazizova, G.R.; Lysenko, E.A.; Gusev, O.A.; Vinogradova, O.L. Contractile activity-specific transcriptome response to acute endurance exercise and training in human skeletal muscle. Am. J. Physiol.-Endocrinol. Metab. 2019, 316, E605–E614. [Google Scholar] [CrossRef]
Figure 1. Clenbuterol treatment induced acute-exercise-like transcriptional changes. (a) mRNA expression levels of Nr4a3 were determined in C2C12 myotubes supplemented with indicated concentration of clenbuterol for 1 h (n = 3). * p < 0.05, **** p < 0.0001 compared with untreated C2C12 myotubes; (b) mRNA expression levels of Nr4a3, Il6, Irs2 and Ppargc1a were determined in C2C12 myotubes supplemented with 30 ng/mL clenbuterol for 1 h in low glucose or high glucose media (n = 4/each condition). * p < 0.05, **** p < 0.0001 compared with untreated C2C12 myotubes; (c) mRNA expression levels of Nr4a3, Il6, Irs2, and Ppargc1a were determined in C2C12 myotubes supplemented with 30 ng/mL clenbuterol for an indicated hour in low glucose media (n = 4/each condition). * p < 0.05, ** p < 0.01, *** p < 0.001 and **** p < 0.0001 compared with untreated C2C12 myotubes.
Applsci 11 10436 g001
Figure 2. RNA-sequencing analysis revealed clenbuterol-dependent transcription. (a) Volcano plot for RNA-seq data obtained from C2C12 myotubes treated with 30 ng/mL clenbuterol, low glucose media for 1 h; (b) mRNA expression levels of Nr4a1, Nr4a2, Vegfa, Cxcl1, Cxcl5, and Per1 were determined in C2C12 myotubes supplemented with 30 ng/mL clenbuterol for 1 h in low glucose media (n = 4/each condition). ** p < 0.01, *** p < 0.001 and **** p < 0.0001 compared with untreated C2C12 myotubes; (c) KEGG pathway analysis for clenbuterol-dependent upregulated genes (red) and downregulated genes (blue). Number of genes in enriched terms are indicated in brackets. (d) Direct BP analysis for clenbuterol-dependent upregulated genes (red) and downregulated genes (blue). Number of genes in enriched terms are indicated in brackets.
Applsci 11 10436 g002
Figure 3. EPS-induced chronicle exercise-like transcriptional changes. mRNA expression levels of Myh7, Myh2, Myh1, and Myh4 were determined in C2C12 myotubes with 1 pulse or 10 pulses at 1 Hz for 24 h (n = 4). * p < 0.05, ** p < 0.01, *** p < 0.001 and **** p < 0.0001.
Applsci 11 10436 g003
Figure 4. RNA-sequencing analysis revealed EPS-dependent transcription. (a) Volcano plot for RNA-seq data obtained from C2C12 myotubes with 10 pulses at 1 Hz for 24 h; (b) mRNA expression levels of Slc2a1, Acta1, Myom2, Gsta1 and Gsta4 were determined in C2C12 myotubes with10 pulses at 1 Hz for 24 h (n = 4/each condition). * p < 0.05, ** p < 0.01; (c) KEGG pathway analysis for EPS-dependent upregulated genes (red) and downregulated genes (blue). Number of genes in enriched terms are indicated in brackets. (d) Direct BP analysis for EPS-dependent upregulated genes (red) and downregulated genes (blue). Number of genes in enriched terms are indicated in brackets.
Applsci 11 10436 g004
Figure 5. Models of clenbuterol treatment and EPS. (a) Pathway diagram for CREB1 and mitogenesis of clenbuterol treatment analyzed by IPA; (b) pathway diagram for cardiac hypertrophy of EPS analyzed by IPA; (c) a model of exercise regulation of acute and slow transcriptional changes.
Applsci 11 10436 g005
Table 1. Sequence of the oligonucleotides for qPCR.
Gene NameForward (5′-3′)Reverse (5′-3′)
ActbGGCTGTATTCCCCTCCATCGCCAGTTGGTAACAATGCCATGT
Myh7AGGGCGACCTCAACGAGATCAGCAGACTCTGGAGGCTCTT
Myh2ACTTTGGCACTACGGGGAAACCAGCAGCATTTCGATCAGCTC
Myh4GCTTGAAAACGAGGTGGAAACCTCCTCAGCCTGTCTCTTG
Myh1TACTCACGCCAGCTAGACGATGCCTCTTCAGCTCCTCAAT
Irs2CTGCGTCCTCTCCCAAAGTGGGGGTCATGGGCATGTAGC
Nr4a1TTGAGTTCGGCAAGCCTACCGTGTACCCGTCCATGAAGGTG
Nr4a2GTGTTCAGGCGCAGTATGGTGGCAGTAATTTCAGTGTTGGT
Nr4a3TCAGCCTTTTTGGAGCTGTTTGAAGTCGATGCAGGACAAG
Ppargc1aTATGGAGTGACATAGAGTGTGCTCCACTTCAATCCACCCAGAAAG
Il6TAGTCCTTCCTACCCCAATTTCCTTGGTCCTTAGCCACTCCTTC
VegfaTCTCTGGGAGAACCCAAATGATCCACCCACTAGGCAACAG
Cxcl1CTGGGATTCACCTCAAGAACATCCAGGGTCAAGGCAAGCCTC
Cxcl5GTTCCATCTCGCCATTCATGCGCGGCTATGACTGAGGAAGG
Per1CGGATTGTCTATATTTCGGAGCATGGGCAGTCGAGATGGTGTA
Slc2a1CAGTTCGGCTATAACACTGGTGGCCCCCGACAGAGAAGATG
Acta1CCCAAAGCTAACCGGGAGAAGCCAGAATCCAACACGATGCC
Gsta1AAGCCCGTGCTTCACTACTTCGGGCACTTGGTCAAACATCAAA
Gsta4TGATTGCCGTGGCTCCATTTACAACGAGAAAAGCCTCTCCGT
Publisher’s Note: MDPI stays neutral with regard to jurisdictional claims in published maps and institutional affiliations.

