Article

Characterisation of Seasonal Mytilus edulis By-Products and Generation of Bioactive Hydrolysates

1
Food BioSciences Department, Teagasc Food Research Centre, Ashtown, Dublin 15, Ireland
2
Instituto de Agroquímica y Tecnología de Alimentos, Burjassot CSIC, 46980 Valencia, Spain
*
Author to whom correspondence should be addressed.
Appl. Sci. 2020, 10(19), 6892; https://doi.org/10.3390/app10196892
Submission received: 6 August 2020 / Revised: 24 September 2020 / Accepted: 25 September 2020 / Published: 1 October 2020
(This article belongs to the Special Issue Research of Bioactive Peptides in Foods)

Abstract

:

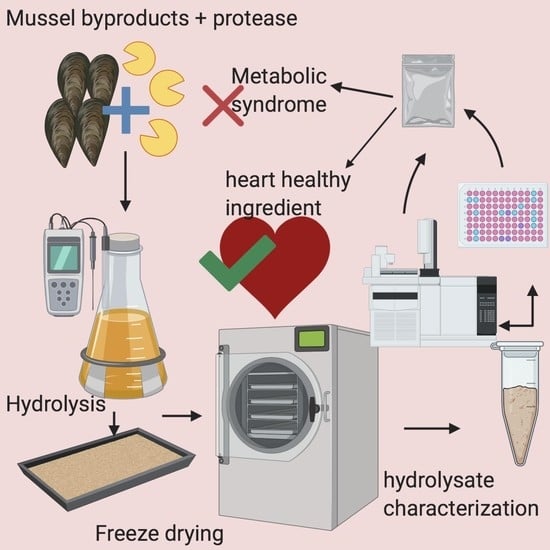
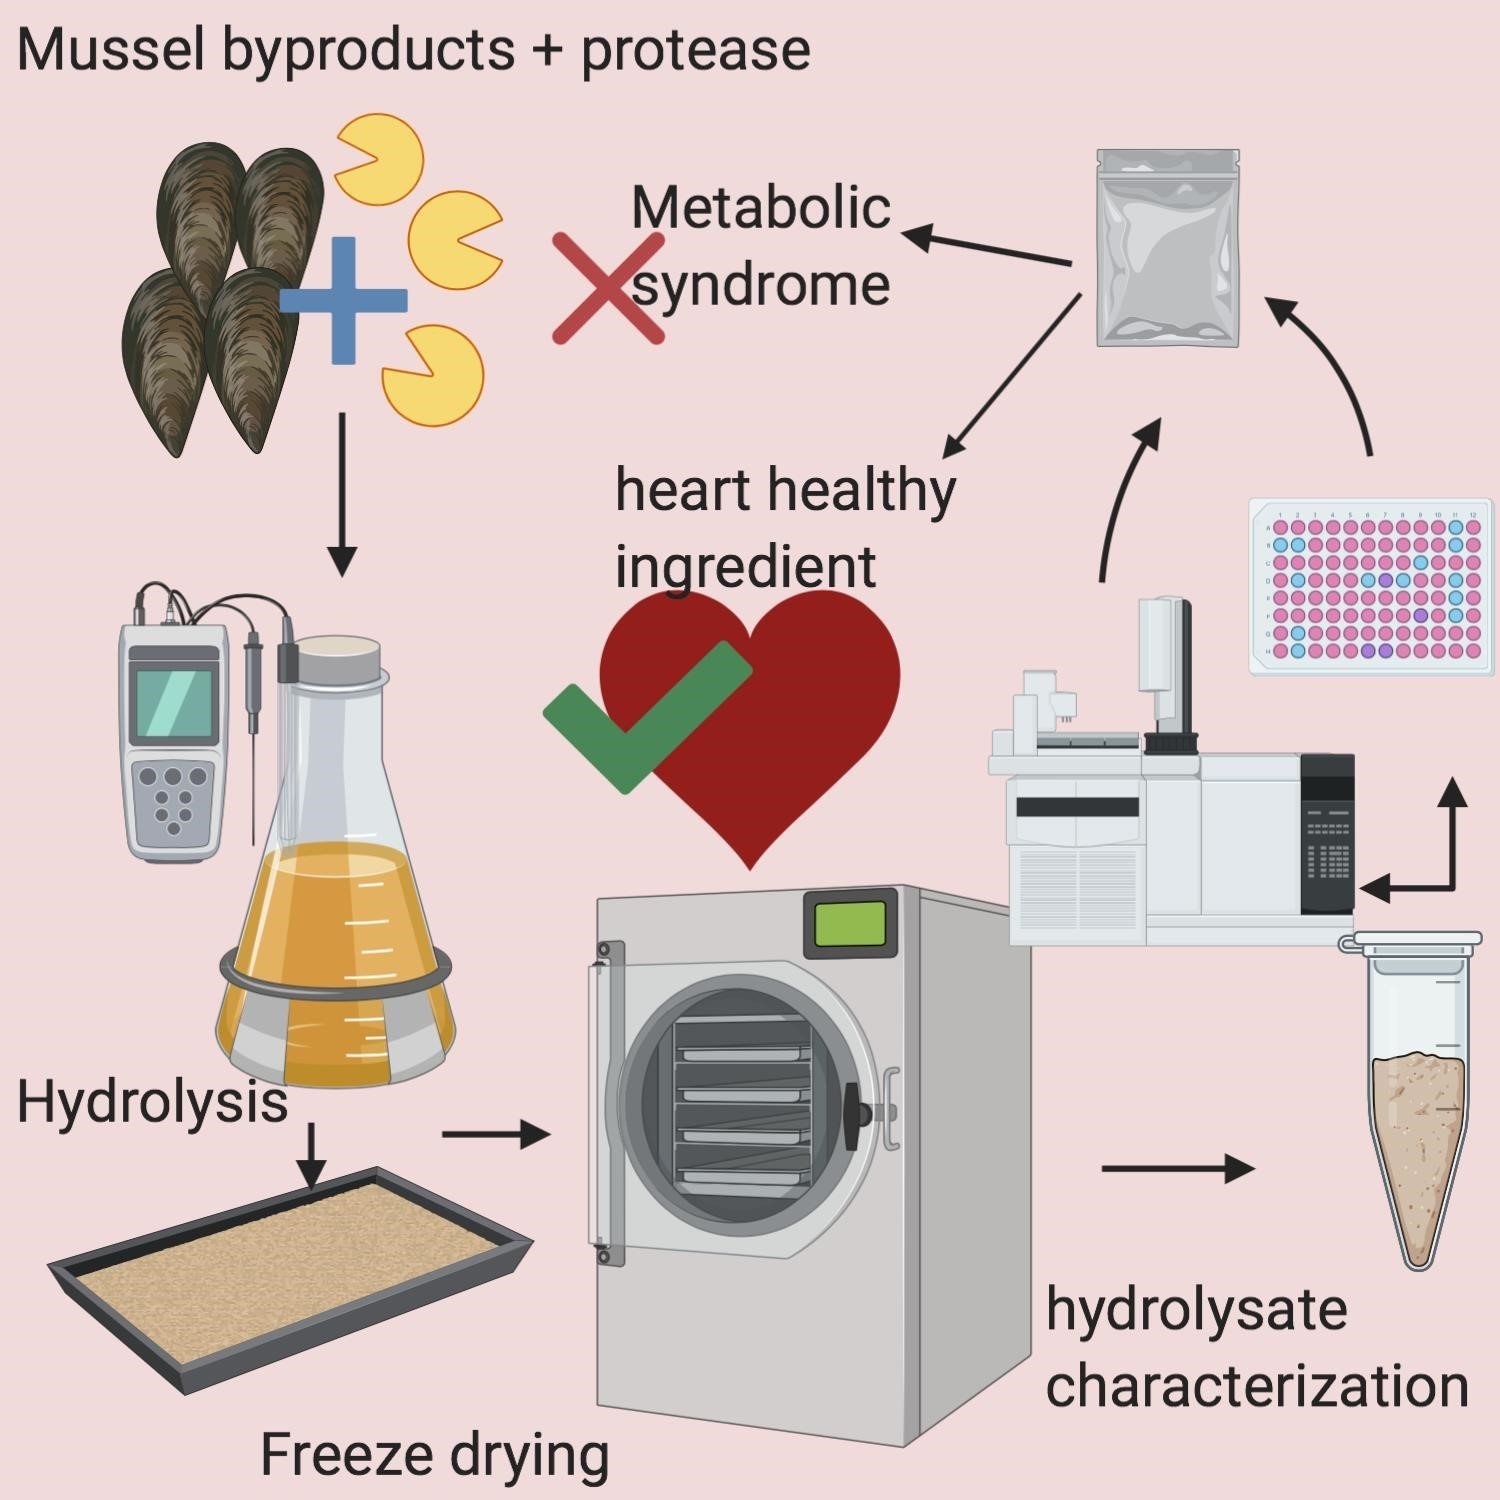
Featured Application

Functional foods for humans with the potential to prevent diabetes through inhibition of the dipeptidyl peptidase IV (DPP-IV) enzyme.

Abstract

Mussel cultivation results in tons of by-product, with 27% of the harvest considered as reject material. In this study, mussel by-products considered to be undersized (mussels with a cooked meat yield <30%), mussels with broken shells and barnacle-fouled mussels were collected from three different locations in the west, north-west and south-west of Ireland. Samples were hydrolysed using controlled temperatures and agitation, and the proteolytic enzyme Protamex® was added at an enzyme:substrate ratio of 1:50 (w:v). The hydrolysates were freeze-dried and analysed for protein content and amino acid composition, lipid content and fatty acid methyl ester (FAME) composition, ash and techno-functional and bioactive activities. The degree of hydrolysis was determined using the Adler-Nissen pH stat method and was found to be between 2.41% ± 0% and 7.55% ± 0.6%. Mussel by-products harvested between February and May 2019 had protein contents ranging from 36.76% ± 0.41% to 52.19% ± 1.78%. The protein content of mussels collected from July to October (the spawning season) ranged from 59.07% ± 1.375% to 68.31% ± 3.42%. The ratio of essential to nonessential amino acids varied from 0.68–0.96 and it was highest for a sample collected in November from the west of Ireland. All the hydrolysate samples contained omega-3 polyunsaturated fatty acids (PUFA), especially eicosapentaenoic acid (EPA) and docosahexaenoic acid (DHA), which are known anti-inflammatory agents. Selected hydrolysates which had angiotensin-converting enzyme I (ACE-I; EC 3.4.15.1) and dipeptidyl peptidase IV (DPP-IV; EC 3.4.14.5) inhibitory activities were filtered using 3-kDa membrane filtration and the permeate fraction was sequenced using mass spectrometry (MS). Identified peptides were >7 amino acids in length. Following BIOPEP database mining, 91% of the by-product mussel peptides identified were found to be previously identified DPP-IV and ACE-I inhibitory peptides, and this was confirmed using in vitro bioassays. The ACE-I inhibitory activity of the by-product mussel hydrolysates ranged from 22.23% ± 1.79% to 86.08% ± 1.59% and the most active hydrolysate had an ACE-I inhibitory concentration (IC50) value of 0.2944 mg/mL compared to the positive control, captopril. This work demonstrates that by-product mussel hydrolysates have potential for use as health-promoting ingredients.

Graphical Abstract

1. Introduction

Mussel cultivation for human consumption has been practiced for years through rope or raft cultivation systems, and the total global productivity of the common blue mussel (Mytilus edulis) is approximately 20,000 tons (9% of the total global mussel production) [1]. Of the total produced mussels, 27% is discarded as by-products [2]. By-product mussels can be edible mussels, including seed mussels, undersized mussels, mussels with broken shells or mussels that are fouled with barnacles, or they can be inedible due to the presence of toxins such as azaspiracids (AZA) and diarrhetic shellfish poisoning (DSP) toxin. However, mussel by-products are a rich source of protein, lipids and essential amino acids. Bioprocessing of by-product mussels for high-value commercial ingredient development could contribute positively towards the circular economy. However, characterisation of the raw material/by-products is necessary before initiating such work, as there is a high degree of variability in the composition of mussel by-products, which will result in variability in the end products. The harvesting season, by-product type, location and climate all have significant effects on the composition of mussel by-products. The spawning or the reproductive period for Mytilus edilus is spring to summer, whereas gametogenesis occurs during the winter season when the mussels get bigger prior to spawning. Depending on when the mussels are harvested, the size, meat yield and composition vary. A high meat yield, protein, lipid and pigment content (e.g., caretonoid) are often associated with the gametogenesis phase of maturation in mussels [3,4].
Meat yield is the amount of meat obtained per known quantity of whole wet mussel and when calculated after cooking it is referred to as the cooked meat yield [5]. Cooked meat yield values lower than 30% are not viable for sale and mussels with a cooked meat yield less than 30% are categorised as by-products. The whole mussel is made up of the shell, meat, extrapallial fluid and byssus threads. Proximate composition analysis of mussel meat found that it contained 58.7% protein, 22.5% carbohydrates, 7% lipids and 11.8% ash on a dry weight basis, apart from other minor components [6]. Lipids and proteins are the main components studied for health-promoting benefits. A recent study revealed that consuming mussel meat three times a week for two weeks as the protein source in a personalised meal can moderately improve the omega-3 index and whole blood docosahexaenoic acid (DHA) and eicosapentanoic acid (EPA) content in young healthy adults [7]. EPA and DHA are known for their anti-inflammatory benefits and mussel lipids rich in these polyunsaturated fatty acids (PUFAs) have been used previously in formulating bone supplements [8]. Proteins in mussels can be hydrolysed using proteolytic enzymes to yield hydrolysates containing bioactive peptides. Several enzymes such as trypsin (EC 3.4.21.4), papain (EC 3.4.22.2), Alcalase® (EC 3.4.21.62), Protamex® (EC 3.4.21.62 and EC 3.4.24.28) and others have been used previously to generate bioactive peptides [9,10]. The pH optima of the enzyme, temperature, batch time and enzyme:substrate ratio can influence the degree of hydrolysis and resulting bioactivity of the peptides and hydrolysates. Several proteases such as papain (EC 3.4.22.2), Flavourzyme® (EC 3.4.11.1) and Protamex® have been used to cleave mussel meat proteins for the manufacture of bioactive peptides [11]. Protamex®, a serine protease, is known for its ability to produce non-bitter-tasting hydrolysates [12].
Bioactive peptides from Mytilus edulis have previously shown bioactivities, including ACE-I inhibition and antioxidant potential, as well as antimicrobial, anticoagulant, anti-inflammatory, osteogenic, hepatoprotective and anticancer activities [13,14,15,16,17,18]. The bioactivity of peptides depends on the parent protein, the size of the peptides, peptide hydrophobicity and amino acid composition and the location of amino acids within the peptide sequence [19]. Generally, bioactive peptides are known to be short sequences of between 2–30 amino acids in length, with molecular weights less than 6 kDa [20]. Incorporation of bioactive peptide-containing hydrolysates into food products requires analyses of techno-functional properties, including water holding, oil binding and emulsion stability and activity [21]. Hydrolysates showing superior techno-functional properties and specific bioactivities can be incorporated into functional food products for human use or can be used to develop nutraceutical supplements with targets against specific diseases associated with cardiovascular diseases (CVDs) and inflammation. One such novel food product approved by the European food safety authority (EFSA) recently is PreCardix®, a hydrolysate made from shrimp by-products which is effective against hypertension [22].There are many nutraceutical products on the market made from green-lipped mussel lipids, but no such regulatory approved product currently exists from blue mussels.
The objective of the present work was to generate hydrolysates from by-product mussels and assess their functionality and bioactivity in relation to season and location of harvest and by-product type. This study will help mussel growers and processors to develop new markets for their by-products and provides information concerning the best season to harvest mussels for maximum hydrolysate yields and what process to use, as well as information on what by-product type is most suited to this process.

2. Materials and Methods

2.1. Chemicals

Protamex® enzyme (protease from Bacillus sp., Sigma-Aldrich, Dublin, Ireland), 3 KDa spin tubes (Amicon® Ultra Centrifugal Filters, Millipore, Cork, Ireland), hexane and other solvents and the standard acotiamide dihydrochloride were purchased from Sigma-Aldrich (Sigma-Aldrich, Dublin, Ireland). The ACE-I inhibitor captopril (the positive control used in the ACE-I inhibition assays) was supplied by Sigma-Aldrich (Dublin, Ireland). The tris-tricine SDS-PAGE reagents were supplied by Fisher Scientific (Dublin, Ireland) and Bio-Rad Life Science Research (Dublin, Ireland). The ACE-I inhibition assay kit was supplied by NBS Biologicals, (Cambridge, UK). The 3.5 kDa snakeskin dialysis membrane was supplied by the Medical Supply Company (MSC, Dublin, Ireland). All other chemicals used were of analytical grade (≥99% purity). Unless otherwise stated, all reagents were made using Milli-Q deionised water (18.2 ohms).

2.2. Sampling

Mussel samples were collected over a period of 12 months from different sites—Mulroy bay, Donegal, Ireland (northwest); Killary harbour, Galway Ireland (west) and Ardgroom, County Cork (southwest).The mussel by-products identified as seed mussels, undersized mussels, broken shells, byssus thread mixed samples and toxin-containing samples were characterised and their cooked meat yields were determined.

2.3. Cooked Meat Yield

Two hundred and fifty grams of mussel by-products which were collected and transported to the laboratory on ice and subsequently frozen at −80 °C were thawed, dried with a paper towel, cooked in boiling water for 7 min and cooled. Meat was separated from shells and both empty shells and meat weights were determined. The cooked meat yield (MYcook) was calculated using the following formula [5]:
MYcook = [meat weight after cooking (g)/total weight (g)] × 100

2.4. By-Product Mussel Hydrolysis with Protamex

Two hundred and fifty grams of whole by-product mussels were ground using a tabletop cutter blender (Robot Coupe R2 tabletop cutter mixer, Vincennes, France) with 500 mL water for 1 min. The slurry obtained was used for hydrolysis and endogenous enzymes were heat-deactivated for 10 min at 80 °C in a water bath prior to hydrolysis. Hydrolysis was carried out at 130 rpm, 35 °C, pH 7 with Protamex® added to the mussel by-product at the ratio of 1:50 (w:v). Hydrolysis was carried out for 1.5 h. Then, 0.1 M NaOH was added to adjust the pH of the hydrolysates to 7. Protamex® was heat-deactivated at 95 °C for 10 min and hydrolysates allowed to cool to room temperature. Clean mussel shells were separated from the mixture, the hydrolysate slurries were poured into trays, frozen and then freeze-dried using a Labconco freeze drier (Labconco corporation, Kansas City, Missouri, USA) for 48 h. The freeze-dried hydrolysates were weighed to calculate yield and were subsequently analysed for protein, lipid, ash and fatty acid methyl ester (FAME) content.

2.5. Degree of Hydrolysis

The degree of hydrolysis was calculated using the pH stat method of Adler-Nissen [23]. Before starting the hydrolysis, pH was adjusted to 7 using 0.1 M NaOH and after completion of hydrolysis the pH was readjusted to 7. The volume of NaOH required to readjust the pH was noted, the protein content of the mussel substrate was determined from proximate analysis and the degree of hydrolysis (DH) was calculated using the following formula:
DH = B × NB × 1/α × 1/MP × 1/htot × 100%
where
B = volume of NaOH consumed
NB = normality of NaOH = 0.1 M
1/α = 5.05 for Protamex®
MP = amount of protein (g) in reaction mixture
htot = 8.6 for fish

2.6. Protein and Lipid Composition

The protein content of mussel by-products and hydrolysates was estimated using the AOAC 968.06 method, 15th Edition—the Dumas method—using FP628 Nitrogen Analyser, LECO Corporation, St. Joseph, MI, USA. A nitrogen factor of 6.25 was used to calculate the protein content in each sample. The lipid content was quantified using AOAC Method 2008.06 with an Oracle Rapid NMR Fat Analyser, CEM Corporation, Matthews, NC, USA. Samples were prepared according to standard procedures used for these analyses, as described previously [24].

2.7. Techno-Functional Properties of Hydrolysate

2.7.1. Emulsion Activity and Emulsion Stability Assay of Mussel Hydrolysates

Hydrolysates at a concentration of 1% w/v were made in water and adjusted to pH 2, 4, 6, 8 and 10 using 1 M NaOH or 1 M HCl. The samples were homogenised for 30 s at 14,000 rpm. Emulsions were created using commercial vegetable oil, which was added to the aqueous phase containing the hydrolysate at an oil:hydrolysate ratio of 3:2 (v:v). The addition was done in two steps. At first, half the volume of oil was added to the mixture, homogenised for 30 s and centrifuged at 14,000 rpm. This was followed by addition of the rest of the oil and homogenisation at the same speed for 90 s. The formed emulsion was centrifuged at 1100× g for 5 min and the volume of the emulsion layer was measured. Emulsion activity (EA) was calculated using the formula:
EA   % =   V E V T × 100
where V E is the volume of the emulsion layer after centrifuging and V T . is the volume inside the tube.
Further, to determine emulsion stability (ES), the previously prepared emulsions were heated at 85 °C for 15 min, cooled at room temperature for 10 min and centrifuged again at 1100× g for 5 min. The ES was expressed as the % of EA remaining after centrifuging as follows:
ES % = V emulsion   after   heating V original   emulsion   ×   100

2.7.2. Solubility of Protein Hydrolysates

pH-adjusted hydrolysate solutions at concentrations of 1% w/v were prepared as discussed above. The prepared solutions were agitated at room temperature for 45 min in a Multi Reax Vibrating Shaker. Then, 1–2-mL aliquots of the full protein dispersion we dispensed in a separate tube. The hydrolysate solution was then centrifuged at 4000× g for 30 min. Then, 1–2 mL of the protein supernatant was dispensed in a second tube. The bicinchoninic acid assay kit (Pierce™ BCA Protein Assay Kit, ThermoScientific, Waltham, MA, USA) was used to quantify the soluble protein. The percentage solubility S (%) of the protein extract at different pH conditions was calculated using the formula:
S % = Protein   Supernatant Protein   in   full   Dispersion   ×   100

2.7.3. Water Activity

An Aqualab 4TE Benchtop Water Activity Meter (Decagon Devices, Inc., Washington, DC, USA) was used for water activity analysis.

2.8. Amino Acid Composition of Peptides

Determination of the total amino acid composition of the individual hydrolysates was done by further hydrolysing hydrolysates using 6 M HCL at 110 °C for 23 h [25]. The samples were then de-proteinised by mixing equal volumes of 24% (w/v) tri-chloroacetic acid and sample. These were allowed to stand for 10 min at room temperature before centrifugation at 14,400× g for 10 min. The supernatants were removed and diluted with 0.2 M sodium citrate buffer, pH 2.2, to give approximately 250 nmol of each amino acid residue. Samples were then diluted 1:2 with the internal standard nor-leucine to give a final concentration of 125 nm/mL. Amino acids were quantified using a Jeol JLC-500/V amino acid analyser (Jeol Ltd., Garden city, Herts, UK) fitted with a Jeol Na+ high-performance cation exchange column.

2.9. Sequencing Using Mass Spectrometry (MS) and In Silico Analysis of Peptides

Hydrolysate samples were further purified prior to MS analysis and were passed through 3-kDa cut-off ultraspin tubes. The resulting permeates containing peptides less than 3 kDa in size were assessed using mass spectrometry. Nano-LC-MS/MS analysis was performed using an Eksigent Nano-LC Ultra 1D Plus system (Eksigent of AB Sciex, CA, USA) coupled with the quadrupole-time-of-flight (Q-ToF) TripleTOF® 5600 system from AB Sciex Instruments (Framingham, MA, USA) and equipped with a nano-electrospray ionisation source. After 5 min of pre-concentration, the trap column was automatically switched in-line onto a nano-HPLC capillary column (3 µm, 75 µm × 12.3 cm, C18) (Nikkyo Technos Co, Ltd., Tokyo, Japan). Mobile phase A contained 0.1% v/v formic acid in water and mobile phase B contained 0.1% v/v formic acid in 100% acetonitrile. A linear gradient from 5% to 35% of solvent B over 60 min at a flow rate of 0.3 μL/min and running temperature of 30 °C was used for chromatographic separations.
The sample was ionised, applying 2.8 kV to the spray emitter. Scans were acquired from 350–1250 m/z for 250 ms. The quadrupole resolution was set to ‘UNIT’ for MS2 experiments, which were acquired from 100–1500 m/z for 50 ms in ‘high sensitivity’ mode. The following switch criteria were used: charge: 1+ to 5+; minimum intensity; 70 counts per second (cps). Up to 25 ions were selected for fragmentation after each survey scan. Dynamic exclusion was set to 15 s. The system sensitivity was controlled with 2 fmol of 6 standard proteins (LC Packings). Automated spectral processing, peak list generation and database search for the identification of the peptides were performed using Mascot Distiller v2.7.1.0 software (Matrix Science, Inc., Boston, MA, USA). The UniProt protein database (https://www.uniprot.org/ accessed 01/10/2020) [26,27] was used to identify the peptides with a significance threshold p < 0.05. The tolerance on the mass measurement was 0.3 Da in MS mode and 100 ppm in MS/MS ions. In silico analysis of the sequenced peptides was done using the Thermo Fisher peptide analysis online tool and BIOPEP-UWM databases (both accessed 01/10/2020), as described previously [28,29].

2.10. Gas Chromatography Mass Spectrometry for Fatty Acid Composition Analysis

Lipid fractions were extracted from mussel hydrolysates using hexane and shaking (130 rpm, 6 h). Trans-esterification was carried out using the method of Araujo et al., with some modifications [30]. Approximately 10–20 mg of lipid sample, along with 1 mL of 1 mg/mL internal standard (glycerol-tri-heptadecanoate) solution, was mixed and dried under nitrogen. Then, 1 mL of BCl3-methanol (12% w/w) was added for every 10 mg of dry sample and flushed with nitrogen. The mixture was heated to 90 °C–100 °C for 60–90 min, cooled to room temperature, followed by the addition of 1 mL of 10% (w/v) NaCl solution in water and 1 mL of n-hexane (HPLC or GC-grade purity). The contents of the vial were mixed for 1 min to ensure extraction of FAMEs into n-hexane, settled for 10 min and the upper (hexane) layer was added to a tube containing anhydrous sodium sulphate to dry the hexane extract. Extracted FAMEs were separated and analysed using an Agilent 7890A GC/5975C MSD system. Separation was performed on the Agilent J&W DB-FastFAME GC column (30 m, 0.25 mm ID, 0.25 μm film thickness) using hydrogen, 8 psi, at constant pressure mode. A split ratio of 25:1 was used and the inlet was maintained at 250 °C while the oven was temperature programmed to 50 °C (0.5 min), 15 °C/min to 194 °C (4 min) and 4 °C/min to 240 °C (1 min). Supelco Fame 37 mix was utilised for external calibration by making a series of appropriate dilutions with hexane, with individual compound peaks used to construct a calibration curve. The fatty acids in the sample were quantified with the calibration curve using the MassHunter Quantitative Analysis software package (Agilent, Santa Clara, CA, USA).

2.11. Bioassays

Various bioassays for detecting potential health benefits like heart-health and mental health maintenance, prevention of type-2-diabetes and anti-inflammation activities were performed.

2.11.1. Angiotensin-Converting Enzyme (ACE-I) Inhibition

The ACE-I inhibition assay was carried out to check for the heart health benefits of the hydrolysates. This was done using a kit supplied by Dojindo laboratories (Dojindo Laboratories, Kumamoto, Japan). It is an absorbance-based assay in which captopril is used as the positive control. The percentage of ACE-I Inhibitory activity was calculated for each sample and, further, the concentration of hydrolysate that inhibited ACE-I by 50% (IC50) values was determined for selected samples.

2.11.2. Acetylcholinesterase (EC 3.1.1.7) (AChE) Inhibition

The AChE assay kit (Fluorometric) from Abcam (Cambridge, UK) was used to study inhibition of AChE activity by mussel hydrolysates to understand their potential for improving mental health. Acotiamide dihydrochloride was used as the standard AChE inhibitor (Sigma-Aldrich, now Merck, Dublin, Ireland). Fluorescence was recorded at an Ex/Em wavelength of 490/520 nm. The inhibition percentage for all the samples was estimated from the fluorescence values.

2.11.3. Dipeptidyl Peptidase IV (DPP-IV) Inhibition

A DPP-IV Activity Fluorometric Assay Kit from BioVision Inc. (Cambridge Bioscience, Cambridge, UK) was obtained to study the potential prevention of type-2 diabetes by the hydrolysates. The positive control for the assay was sitagliptin. Fluorescence was recorded at an Ex/Em wavelength of 360/460 nm. The inhibition percentage for all the samples was estimated from the fluorescence values.

2.12. In-Silico Analysis and Statistics

Two bioinformatics tools were used to analyse polarity profiles of the sequenced peptides, along with their potential bioactivities. The Thermo Fisher peptide analysis tool (https://www.thermofisher.com/ie/en/home/life-science/protein-biology/peptides-proteins/custom-peptide-synthesis-services/peptide-analyzing-tool.html accessed on the 01/09/2020) and BIOPEP-UWM database (formerly BIOPEP) analysis (http://www.uwm.edu.pl/biochemia/index.php/pl/biopep accessed on 01/09/2020) were the tools used. Within BIOPEP-UWM, the “profile of potential biological activity” option was used to assess peptide fragments identified by MS for potential bioactivities. GraphPad prism 8 software (GraphPad Software, LLC, San Diego, CA, USA) was used to study analysis of variance using the Tukey method for post hoc analysis.

3. Results and Discussion

3.1. Sampling

Ten samples in total were collected from three different sampling sites. Five samples were from Killary harbour and were labeled KHN18, KHM19, KHJ19, KHS19 and KHO19, collected in the months of November 2018, March 2018, June 2019 and September and October 2019. Three samples were obtained from Mulroy bay and were labeled MBF19, MBMay19 and MBJuly19, as they were sampled in the months of February, May and July 2019. Two were obtained from Ardgroom, samples AJ19 and AJuly19, obtained in the months of June and July 2019. Most of the by-products were seed mussels, except KHN18, which were broken shells. Samples labeled MBJuly19, KHS19 and KHO19 were undersized mussel by-products containing byssus and broken shells.

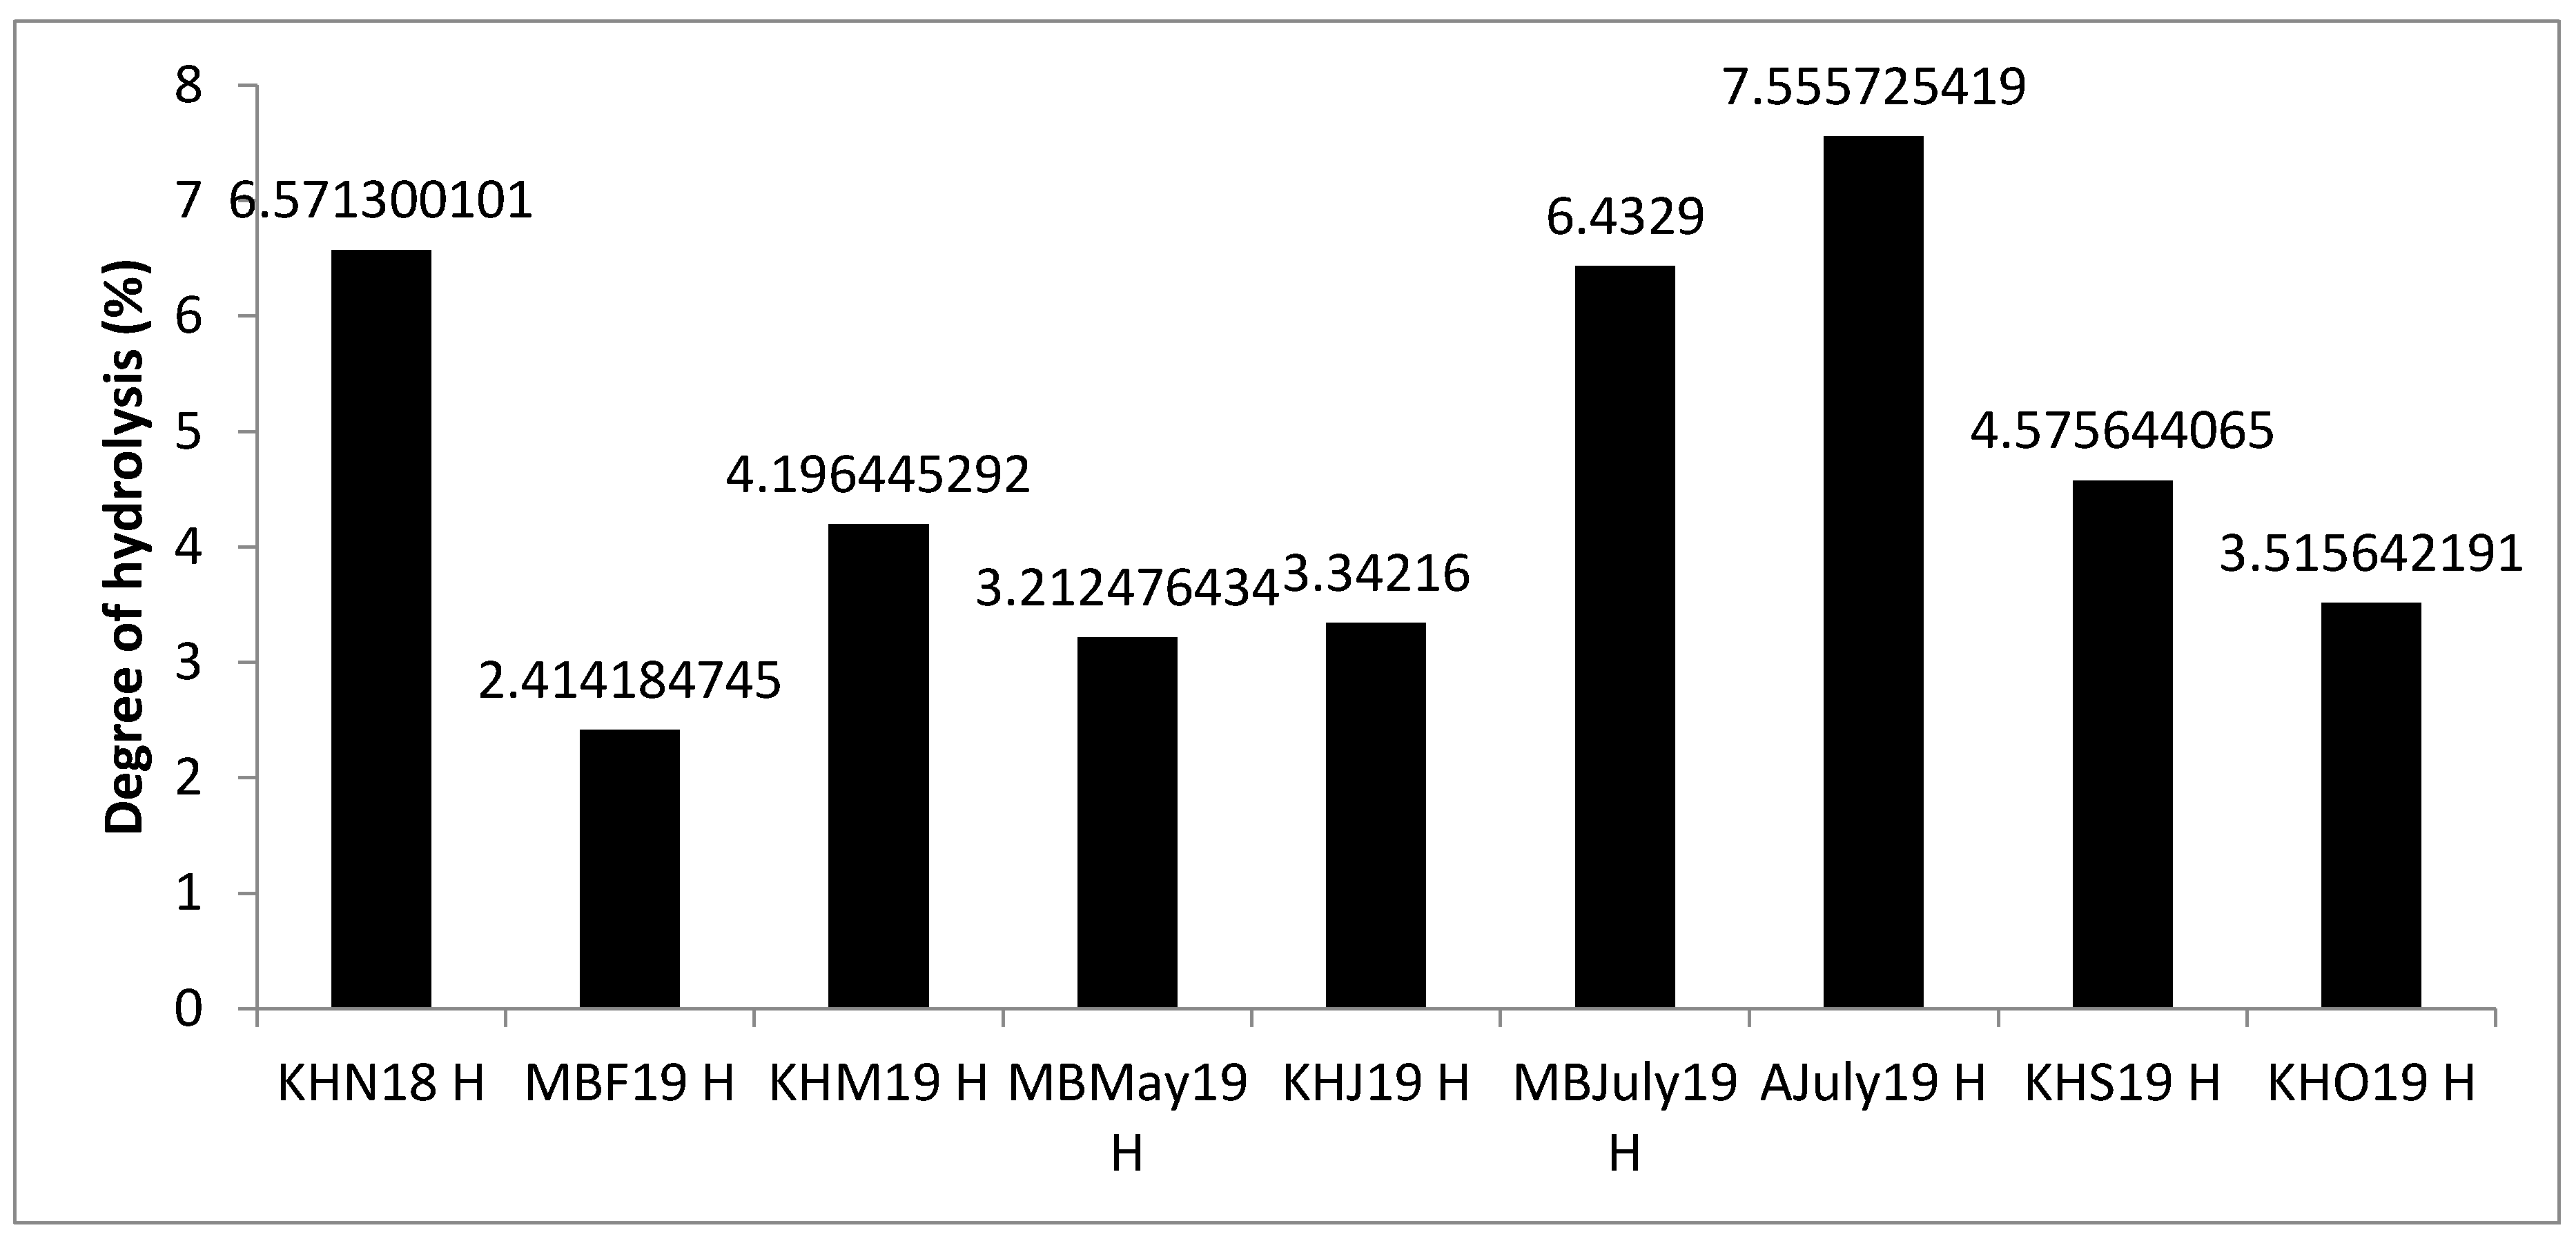
3.2. Degree of Hydrolysis and Peptide Length

The degree of hydrolysis refers to the percentage of hydrolyzed peptide bonds and depends on several factors, such as the initial amount of protein, the type of enzyme used in the hydrolysis, the duration of the hydrolysis, temperature and pH. For all of the by-product mussel hydrolysis in this study, the degree of hydrolysis was between 2.41% and 7.55% ± 0.6% as assayed using the pH stat method, shown in Figure 1. For samples KHN18, MBF19 and KHM19, the degree of hydrolysis values were positively correlated with hydrolysate yields. For other samples no such correlation was observed, which could be a result of these samples containing byssus threads or empty broken shells that were separated from the final hydrolysate product and did not contribute to the final yield. A lower degree of hydrolysis is often associated with production of larger peptides having more than seven amino acids, whereas a greater degree of hydrolysis leads to smaller di- and tri-peptides [31]. Similar results were reported by other researchers using Protamex® and hydrolysis of bone extract. Protamex® leads to a lower degree of hydrolysis and peptides with higher molecular weights compared to other proteases such as Flavourzyme® [32]. In the 3-kDa fraction generated following filtration in this work, about 57% of the peptides that were characterised consisted of seven amino acids, whereas the remaining 43% were larger peptides with more than seven amino acids and up to 16 amino acids in length. No di- or tri-peptides were detected in the sequenced samples due to the mass tolerance setting and m/z range selected in the MS method.

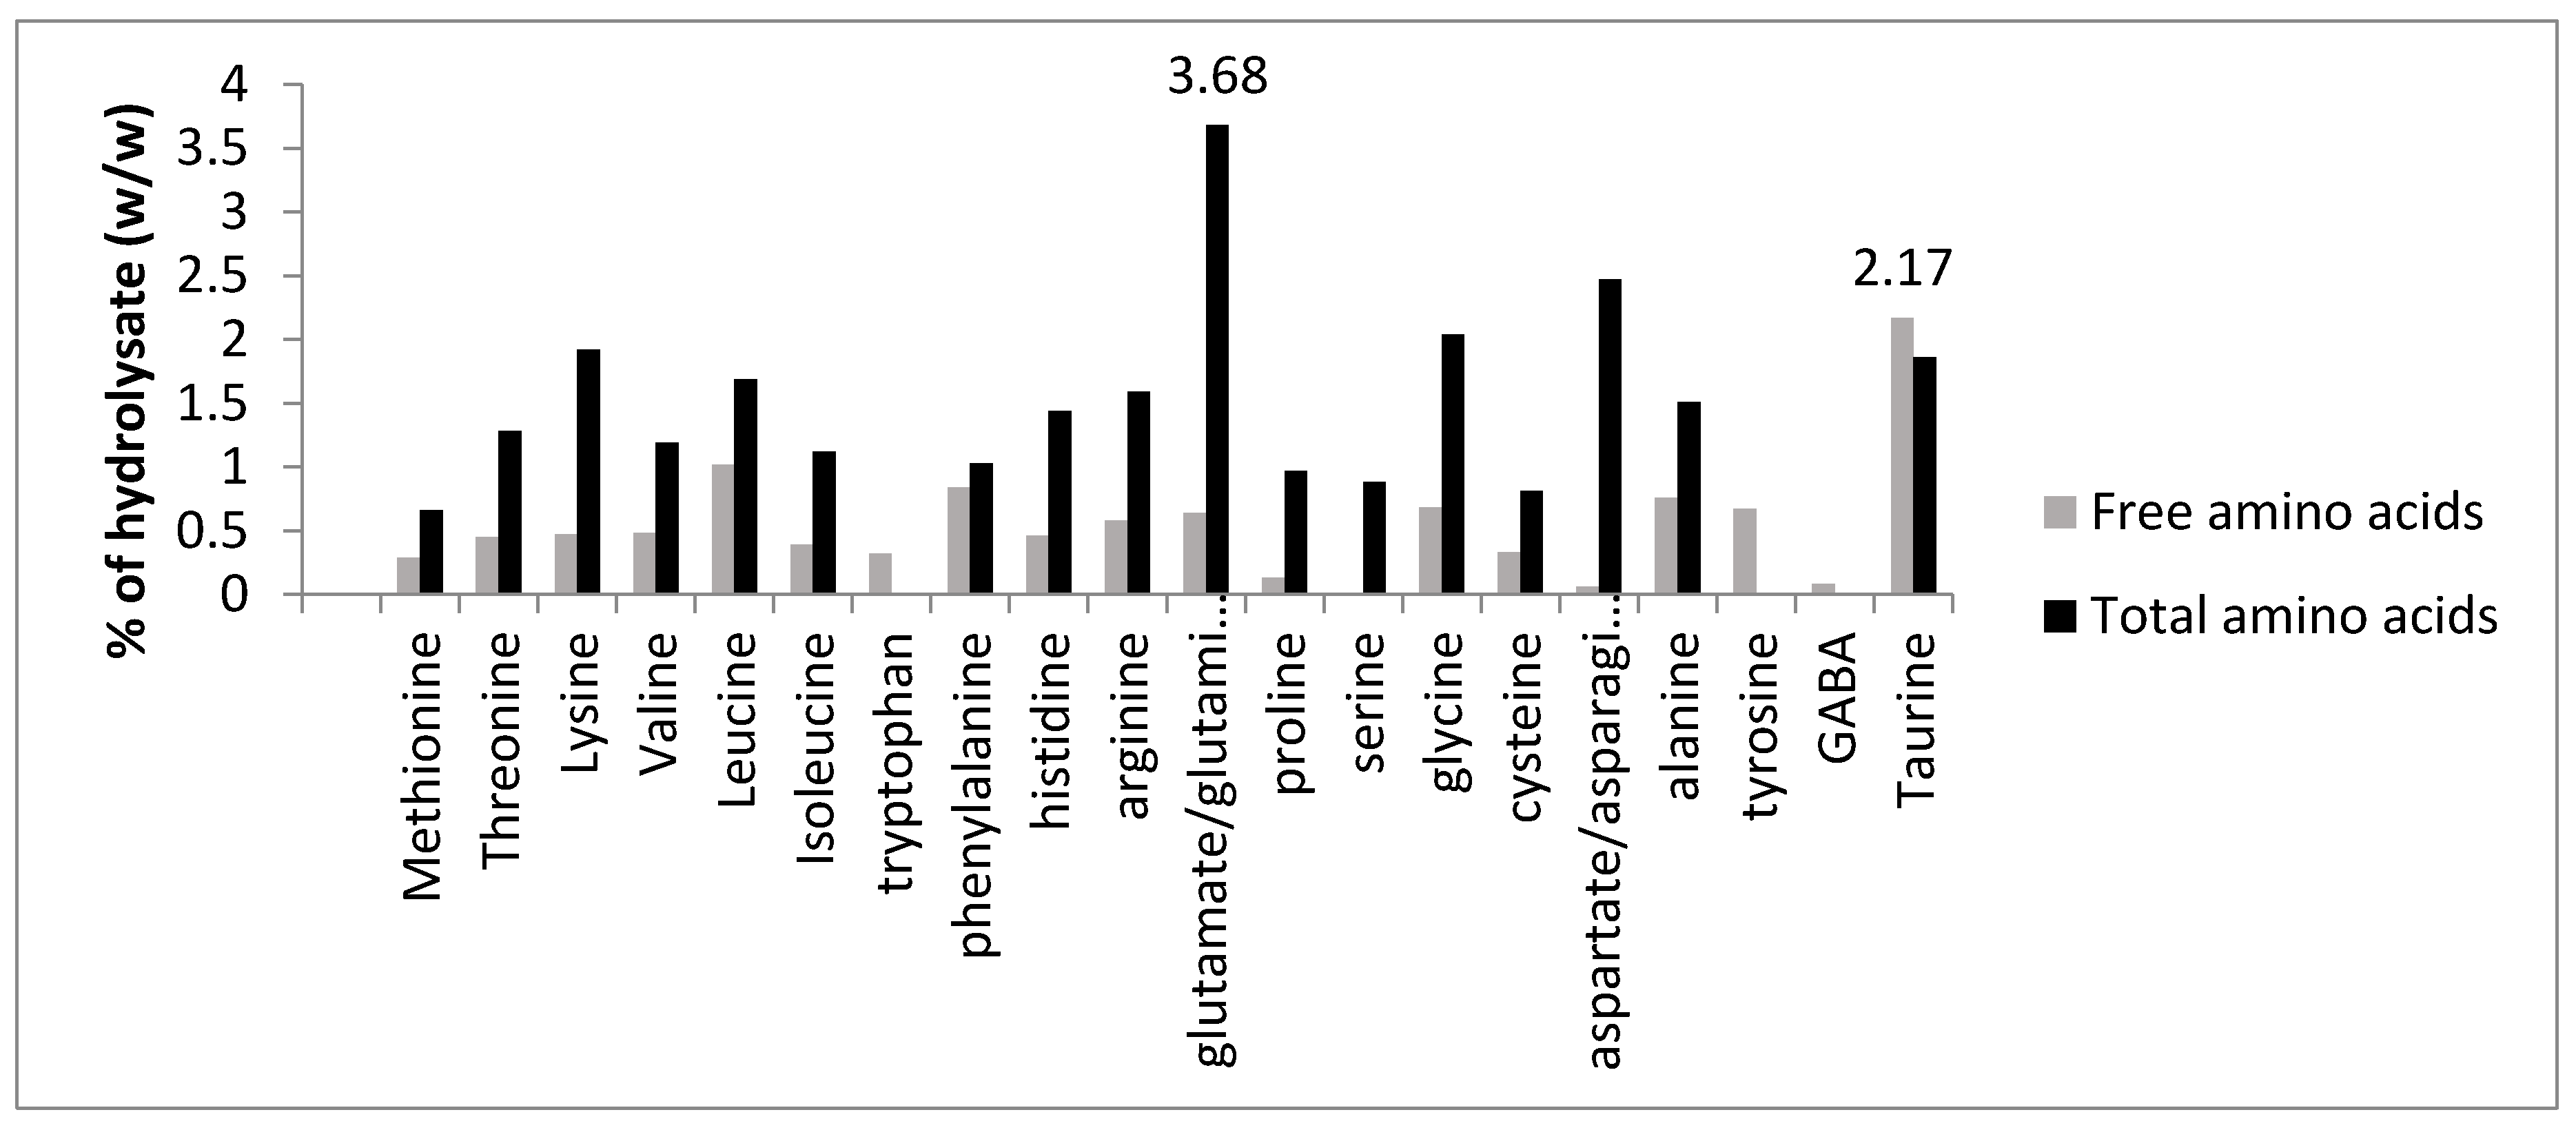
3.3. Free Amino Acid Content

The free amino acid content of the generated hydrolysates ranged from 3.77% for sample MBF19 to 11.91% for sample MBMay19 of the total amino acid content. The free amino acid content depends on the enzyme used during hydrolysis, the time of hydrolysis and the resulting degree of hydrolysis. Amino acid contents of 30% were previously reported for marine samples with higher degrees of hydrolysis (35%–40%) [33]. Taurine was the only amino acid found in a higher concentration in the free amino acid fraction of the mussel hydrolysates when compared to the total amino acid fraction. It is known that taurine, a free amino acid, is not part of the protein polypeptide chain and hence is found in a greater proportion in the free amino acid fraction. Figure 2 shows the relative abundance of free and total amino acids in the mussel by-product hydrolysates for sample KHN18, which had an ACE-I inhibitory activity of 86.08% ± 1.59% when assayed at a concentration of 1 mg/mL compared to the control.

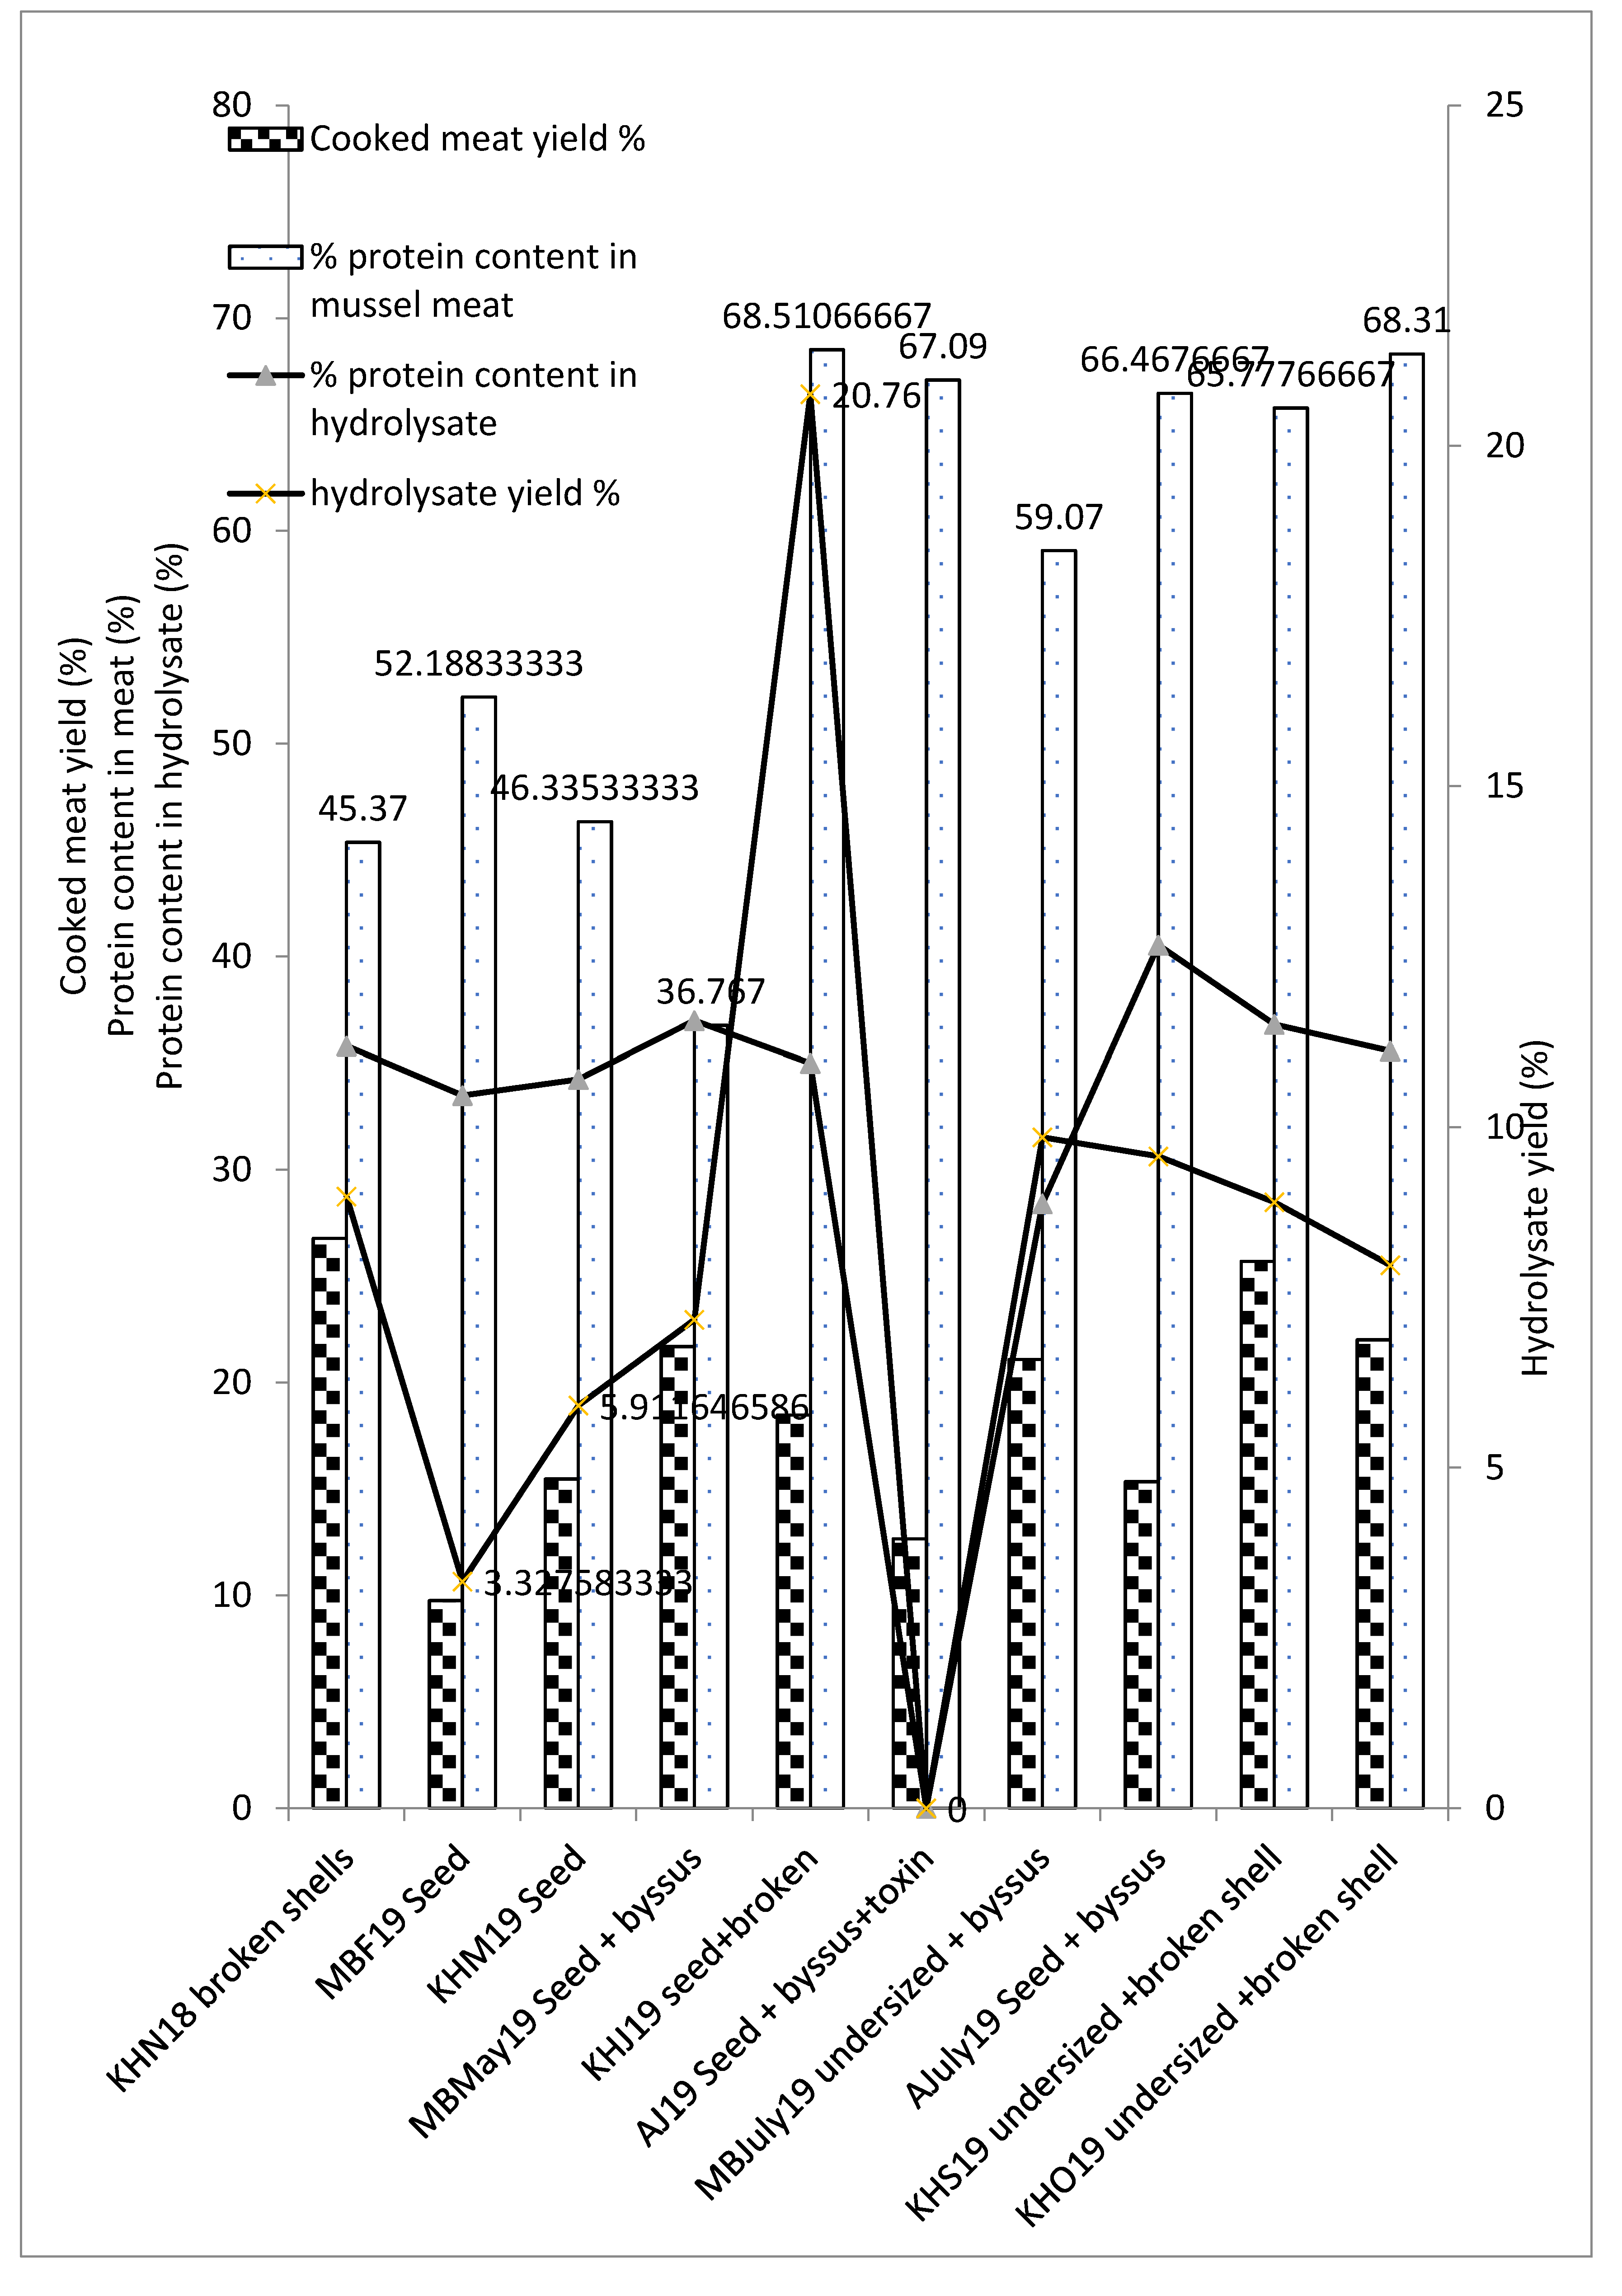
3.4. Cooked Meat Yield, Hydrolysate Yield and Protein Content across Different Seasons and By-Product Types

The meat yield and corresponding hydrolysate yield are dependent on the type of by-product mussel and the season of harvest. Seed mussels’ cooked meat yields ranged from 9.75%–15.34% compared to undersized/broken shells or a combination of seed and broken sells, which had meat yields ranging from 22%–26.77%. Seed mussel samples in this study showed heterogeneity and some samples contained seed mussels < 1 cm in length, resulting in no retrievable meat and thus lower meat yields/250 g of sample in comparison to larger seed mussels. The cooked meat yield for the by-products analysed varied between 9.75% (MBF19) to 26.77% (KHN18), and was always less than 30%. For Mytilus edulis mussels, the gamete development phase is between November and May, during which time the cells reach sexual maturation, and there is a record drop in meat yield in the month of May [34]. In agreement with these published results, the present study showed relatively lower meat yields, hydrolysate yields and protein contents in mussel by-products harvested between February and May, as shown in Figure 3. The meat protein content is high between July and October, months associated with the spawning season. A higher amount of storage tissue accumulates during this season, which corresponds to the higher protein content observed. Furthermore, in February and March, lower meat yields were found in comparison to samples harvested from September and November, though the effect was not as pronounced as the hydrolysate yields and protein contents observed.

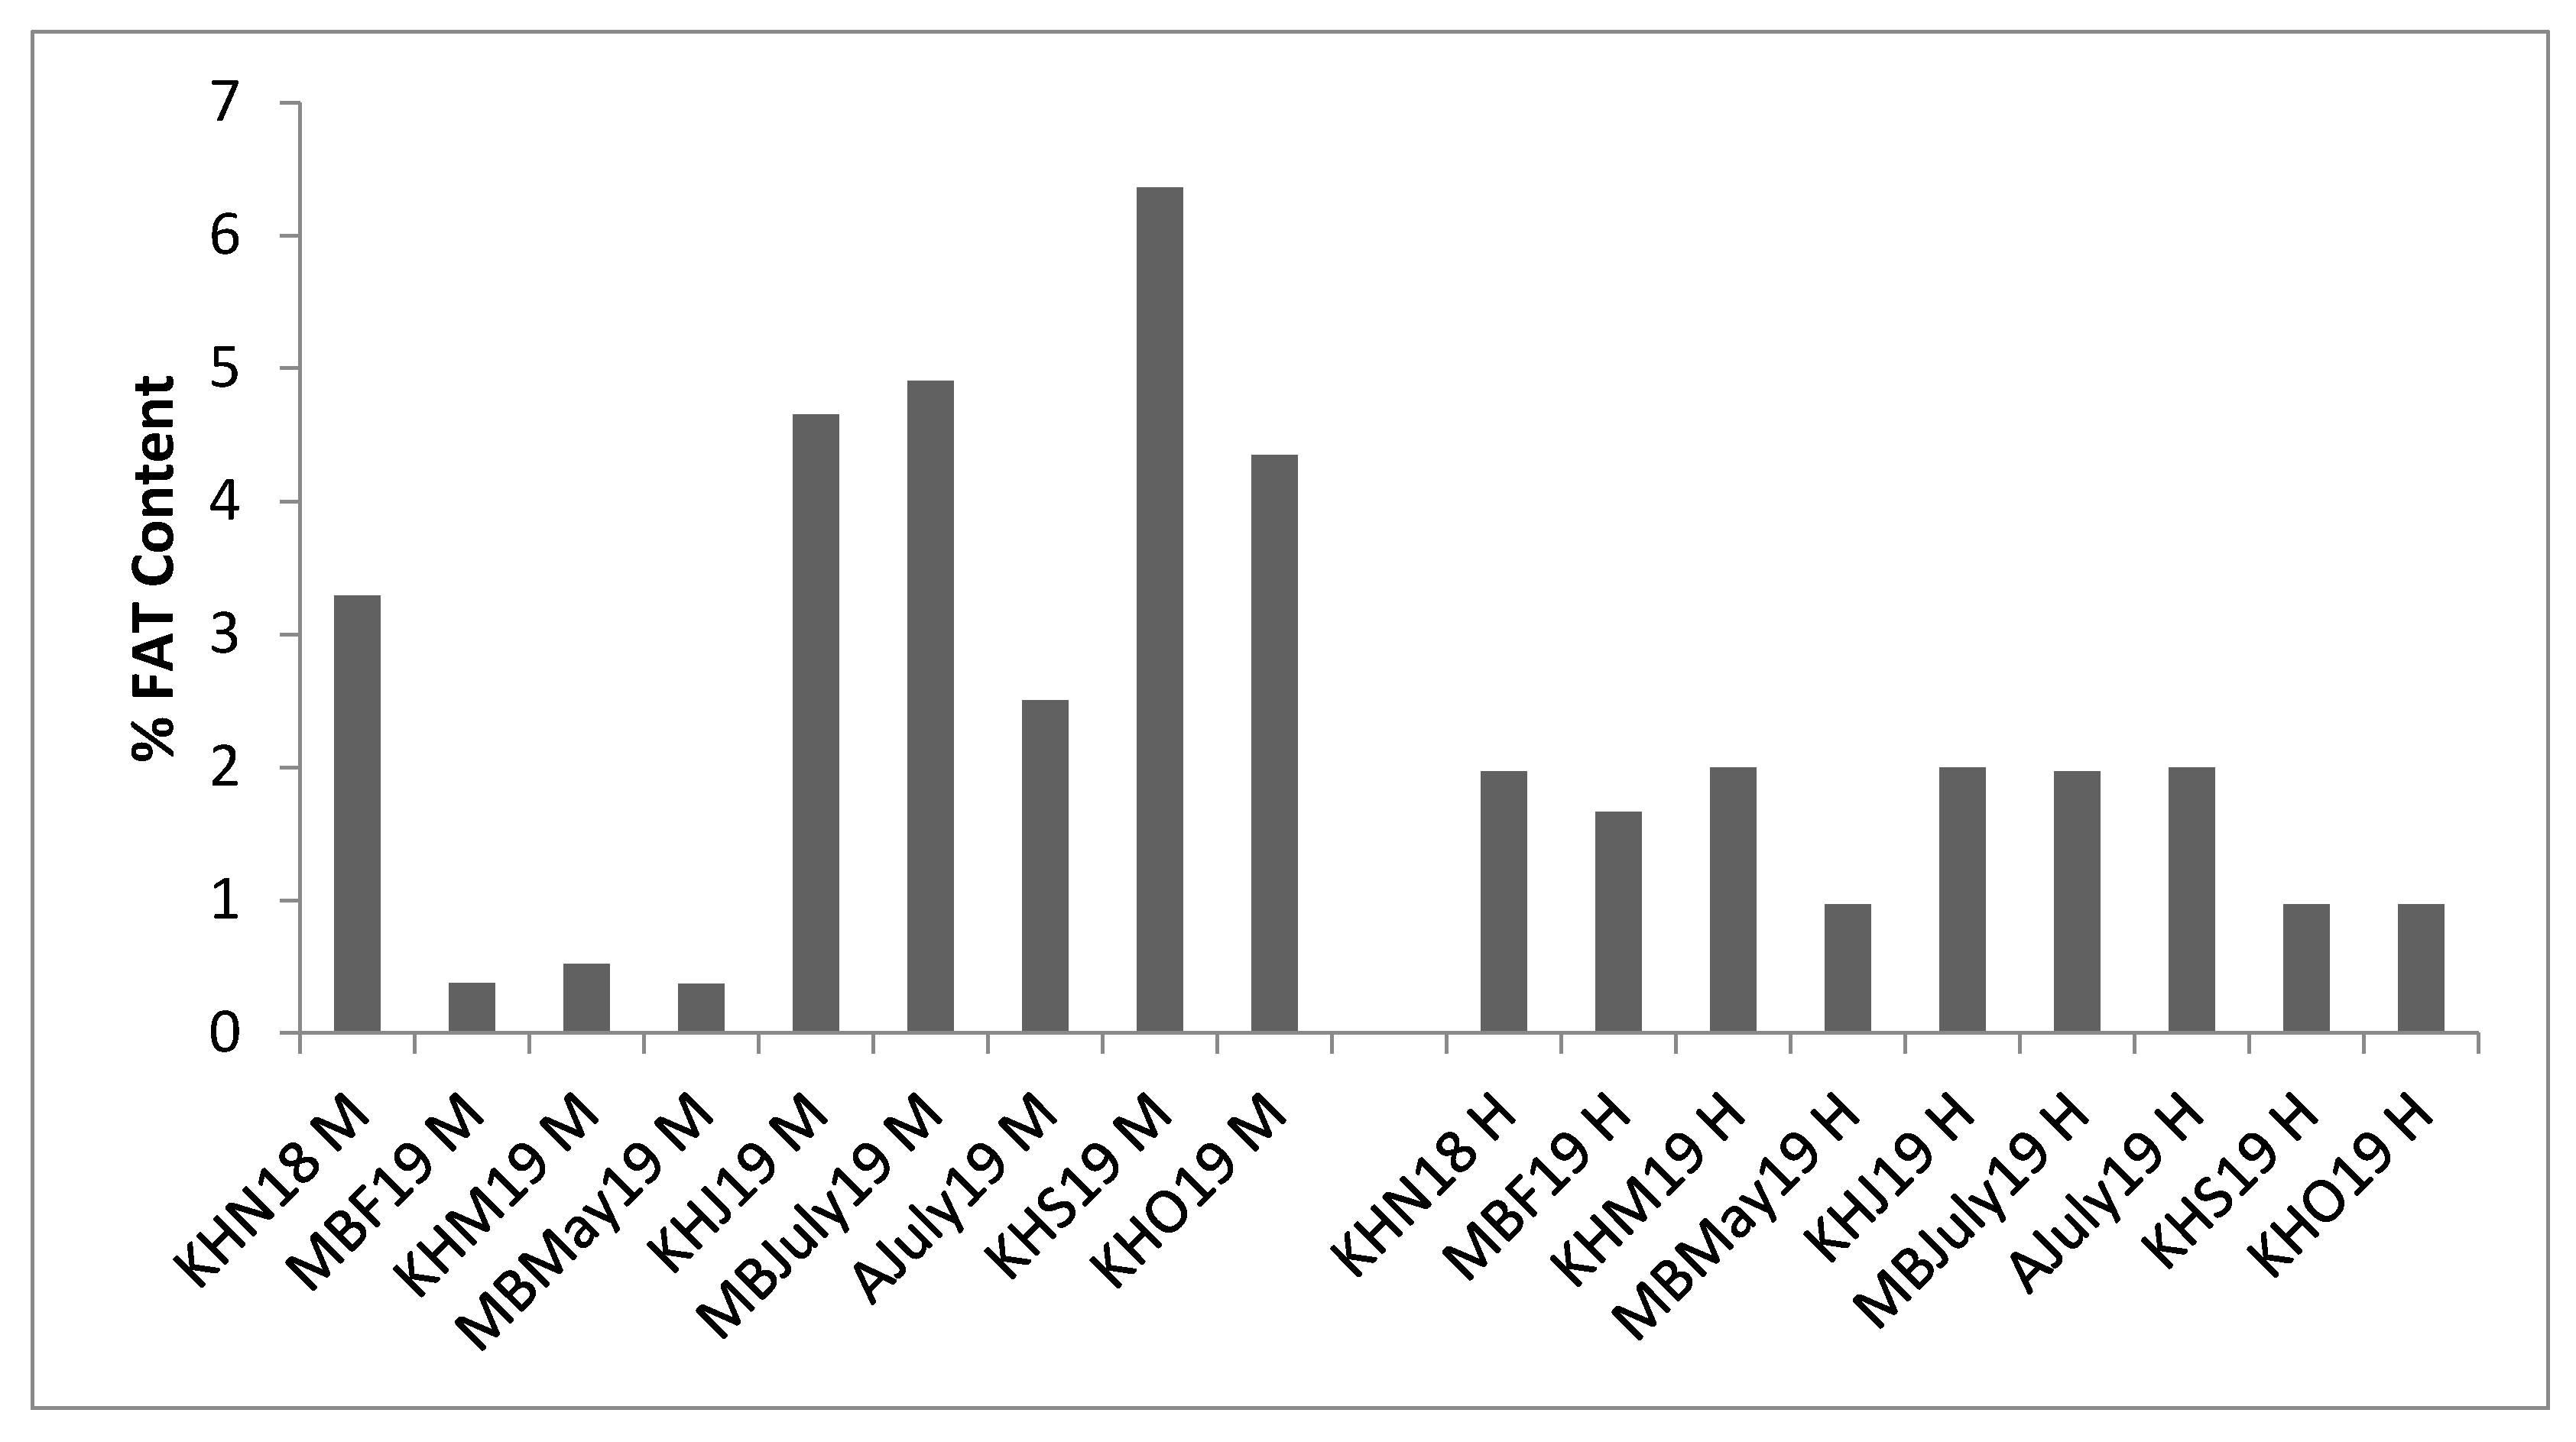
3.5. Lipid Content of Mussels and Hydrolysates

The lipid content of mussel meat samples showed a high standard deviation in comparison to hydrolysate samples, indicative of variability in any biological raw material. The lipid content of meat ranged from 0.52% ± 0.17% to 6.25% ± 1.19%, whereas for hydrolysates it was between 0.966% ± 0.05% and 2% ± 0%, as seen in Figure 4. The lipid content for mussel by-product meat samples varied based on mussel by-product type and season of collection. The lowest lipid content for mussel meat was observed between February to May (0.37% ± 0.07%, 0.52% ± 0.17%, 0.37% ± 0.11%), i.e., during the gamete development phase—a trend similar to protein content—and the by-product type of these samples was seed mussel.

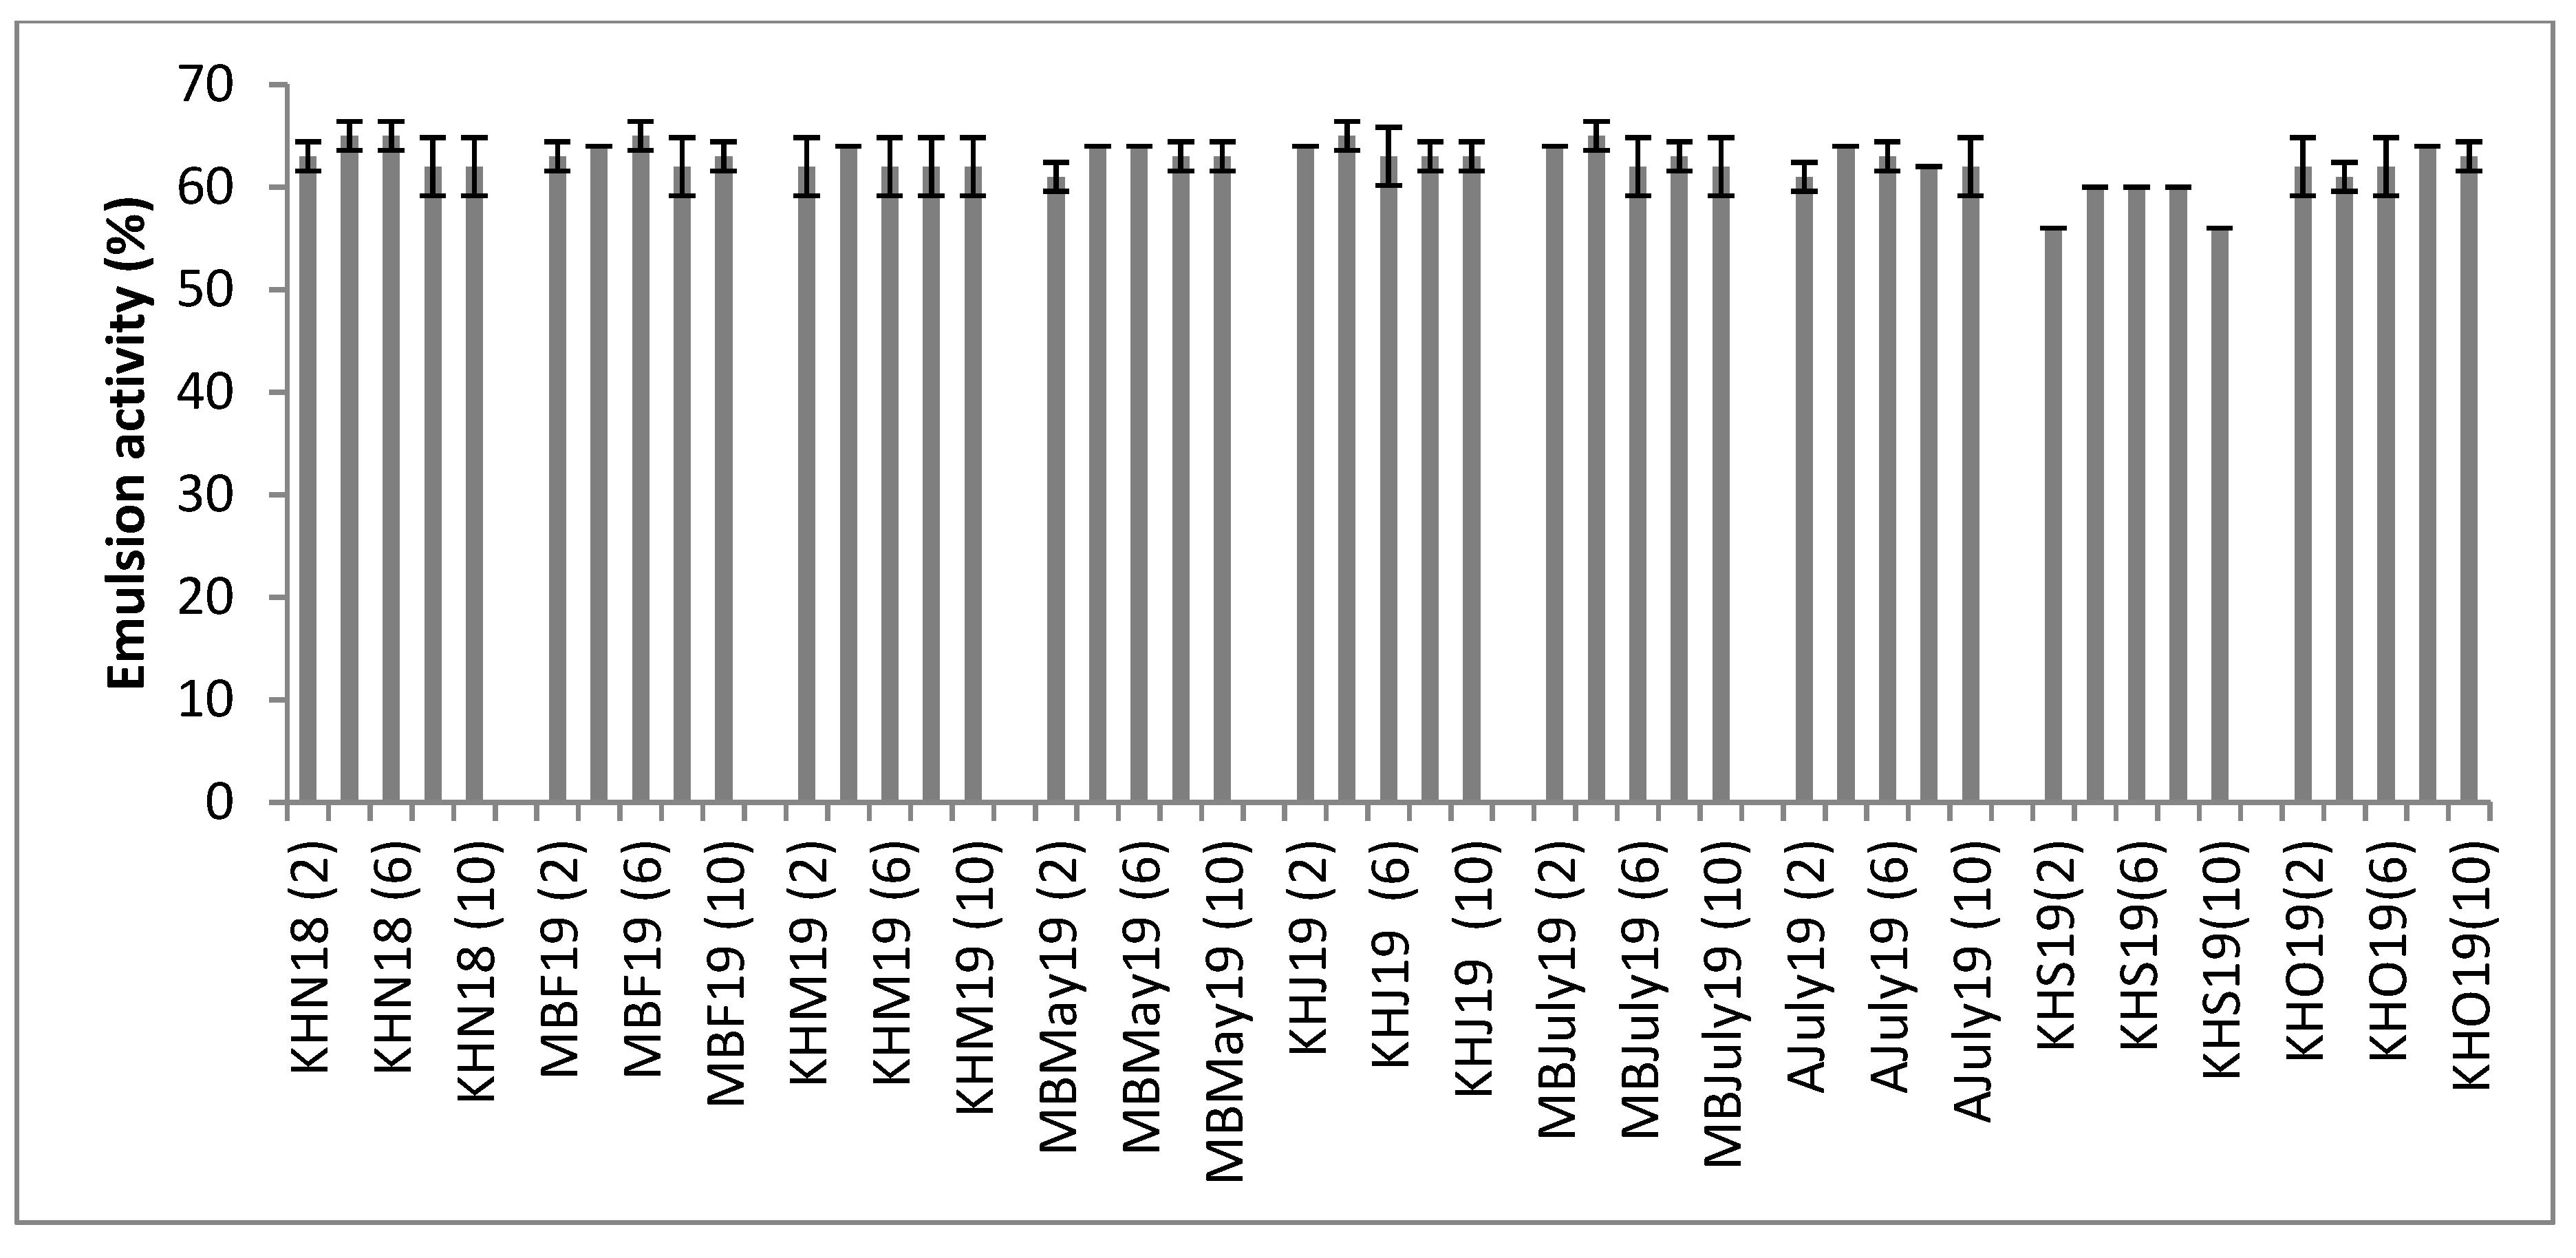
3.6. Emulsion Activity and Emulsion Stability

The emulsion activity is the potential of a substance to form emulsions and it is useful in the formulation of products like mayonnaise or in the preparation of foods where the prevention of phase separation is required, i.e., in the preparation of beverages having both an oil and water phase. As seen in Figure 5, the % emulsion activity of all the hydrolysates was between 56% ± 0% and 65% ± 1.4%. Similar emulsion activity ranges have been reported by other authors working on marine-based protein hydrolysates [35]. Proteins in the hydrolysate are the chief component responsible for the emulsion activity seen. However the thermal stability of these emulsions was noted to be very poor and there was complete phase separation on heating the emulsions. The results show that the mussel hydrolysates have appreciable emulsion activity, which can be explored for cold temperature applications like cold soups and blended smoothies.

3.7. Water Activity

As seen in Table 1, the water activity (aw) readings for the freeze-dried mussel hydrolysates were between 0.25–0.44, indicating little scope for microbial growth and showing that freeze drying was appropriate to maintain product quality.

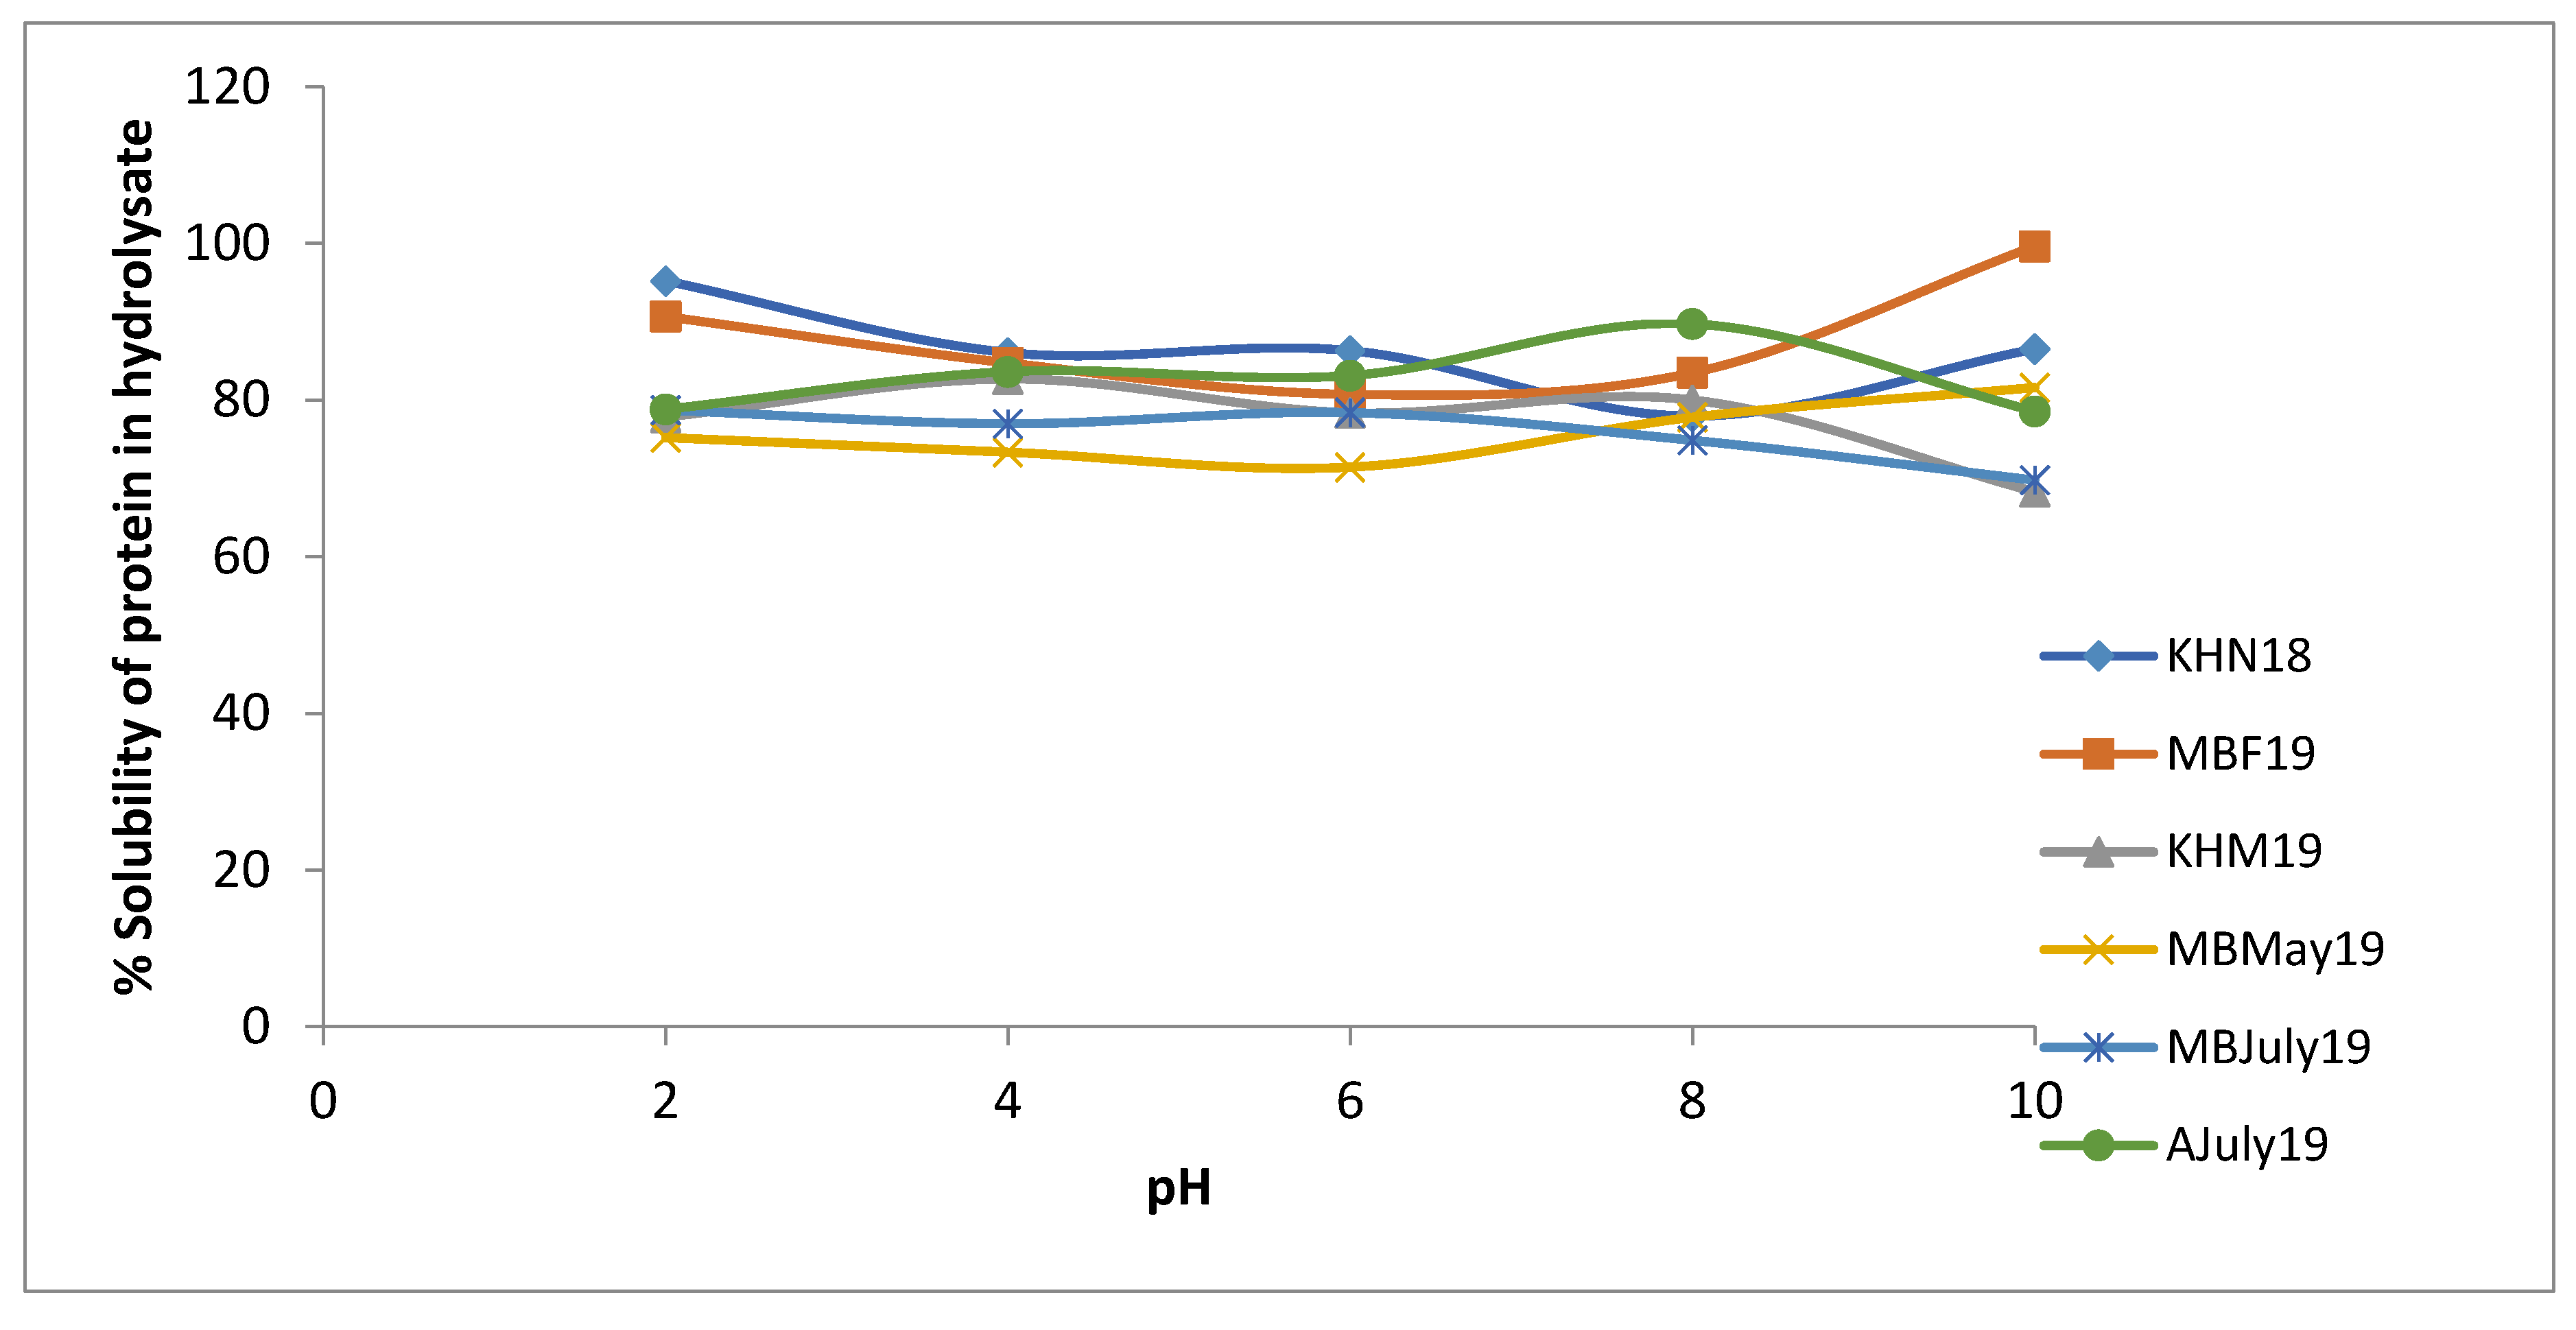
3.8. Solubility of Mussel By-Product Hydrolysates

Selected mussel by-product hydrolysates, representative of the different seasons and sampling sites, were analysed for solubility. Solubility of the mussel by-product hydrolysates ranged between 60%–100%, as seen in Figure 6. Change in pH had a differential effect on the solubility of different hydrolysates. Some hydrolysates showed the highest solubility at pH 2 (KHN18: 95.21% ± 3.47%), whereas others showed the highest solubility at pH 10 (MBF19: 99.63% ± 4.5%), and most showed very little change with change in pH. This shows that pH has very little influence on the solubility of mussel hydrolysate samples, thereby providing wider applicability in the selection of target food matrices. Similar results have been reported by other researchers for protein hydrolysates having a low degree of hydrolysis [36]. Enzymatic treatment often leads to the unfolding of proteins, exposing amino acids buried within the protein structure [37]. Since Protamex is a relatively nonspecific serine protease, protein unfolding will differ, resulting in varied solubility of the samples, as seen in our study. Protein solubility of the samples is a prerequisite techno-functional property for designing many food products and is also necessary to ensure higher digestibility and bioavailability of the ingredients. A similar range of solubility was reported previously by authors working on octopus hydrolysates [38].

3.9. Amino Acid Composition of Hydrolysates

LC-MS analysis of mussel by-product Protamex® hydrolysates showed them to contain most essential amino acids except tryptophan, which is not measured by the method used. The ratio of essential to nonessential amino acids varied from 0.68–0.96 and this ratio was 0.96 for sample KHN18, as shown in Table 2. At 0.96 the ratio was close to the ideal ratio of 1 and was better than plant sources like soy, pea and hemp protein [39] as well as marine-sourced salmon hydrolysate generated by other researchers [40]. Glutamate was the most abundant amino acid present, which is known to be responsible for the umami taste of food products, followed by aspartate and glycine, in the total amino acid fraction of the hydrolysate.
GC-MS analysis of mussel by-product hydrolysates showed the presence of minor components such as benzaldehydes, which are known to be flavour compounds. Benzaldehyde is thought to be a product of the Maillard reaction, and was reported to be present in volatiles of other protein hydrolysates. Hydrolysates from other mussel varieties were explored previously for the development of flavour ingredients [41] and the presence of these compounds in the hydrolysates would favour their use for flavour ingredients. Certain amino acids are associated with specific tastes, such as L-histidine (essential amino acid), which is bitter; L-glutamate (non-essential amino acid), which imparts an umami flavour and L-threonine (essential amino acid), which gives a sweet taste [42]. Thus the relative abundance of these amino acids in the peptides dictates the final taste of the hydrolysate product. Further, taurine, a Sulphur-containing amino acid was found abundantly (0.86%–3.25% w/w) in the mussel hydrolysate samples, with maximum amount detected in KHM19 at 3.25% w/w of hydrolysate. Taurine is considered a critical nutrient for humans and diet represents its main source. Among the several functions of taurine, it is known to be an anti-oxidant and also effective against cardiovascular disorders [43].

3.10. Fatty Acid Analysis of Hydrolysates

All the hydrolysate samples generated contained the omega-3 polyunsaturated fatty acids eicosapentaenoic acid (EPA) (AJuly19: 313.41 ± 11.59 mg/gm lipid) and docosahexaenoic acid (DHA) (KHN18: 538.28 ± 10.03 mg/gm lipid), as seen in Table 3. These fatty acids are known to be anti-inflammatory and are implicated in reducing symptoms of several inflammatory disorders such as asthma, arthritis and even cardiovascular diseases. The content of fatty acids in mussels harvested in summer usually display decreased levels of saturated fatty acids (SFAs), indicating the low energy requirement of the blue mussels during this season, as SFAs like palmitic (C16:0) or myristic (C14:0) acids are associated with energetic-type functions [4]. A similar seasonal trend was observed in our work with respect to SFAs in by-product mussel hydrolysates generated during the summer period. The recommended ratio of omega 6:omega 3 in the human diet for anti-inflammatory benefits has been established as 10:1–4:1. Most of the hydrolysates showed a ratio of 0.1, which translates as 10 times more omega 3 in the hydrolysates, compared to omega 6 content. The hydrolysates can be considered a rich source of both essential amino acids and anti-inflammatory omega-3 fatty acids.

3.11. Sequence, Physicochemical Nature and Bioactivity of Identified Peptides

Most of the peptides identified in the 3-kDa permeate fraction were medium-to-large sized peptides having >7 amino acids, as shown in Table 4. Table 4 illustrates the biological activity of fragments of peptides identified by mass spectrometry, but not the activity of entire peptides. The average molecular weight of a seven-amino-acid-long peptide was 650 Da. The solubility profile of the peptides varied from being moderately hydrophobic (27% of the peptides analysed) to highly hydrophilic (73% of the peptides analysed), as measured using the ThermoFisher peptide analysing tool (https://www.thermofisher.com/ie/en/home/life-science/protein-biology/peptides-proteins/custom-peptide-synthesis-services/peptide-analyzing-tool.html). This tool does not state how hydrophobicity is calculated, but absolute amino acid-based scores are either based on Kyte and Doolittle [44] or the Woolfenden et al. [45] methods. Using BIOPEP-UWM (formerly BIOPEP) analysis (http://www.uwm.edu.pl/biochemia/index.php/en/biopep accessed 20/01/2020), 91% of the peptides found in the 3-kDa permeate for hydrolysate KHN18 had previously identified DPP-IV and ACE-I inhibitory activities (e.g., EDGKNPDDDE, HGCGMHS, DPKGGGA). Correlations between ACE-I and DPP-IV inhibitory activity has been previously reported by scientists working on bioactive peptides [46]. Other bioactivities predicted for the mussel by-product hydrolysates using in silico analysis included antioxidant (e.g., VDDHHDDHHD), anti-amnestic (e.g., DHPLPGTD) and anti-thrombotic (e.g., GPPGEPGEPGSS) activities, as well as regulation of stomach mucosal activity (e.g., VGEPGPPGP), immune-modulating (e.g., ATASILGY) and chemotactic activity (e.g., KPGPSHPGDSKA).
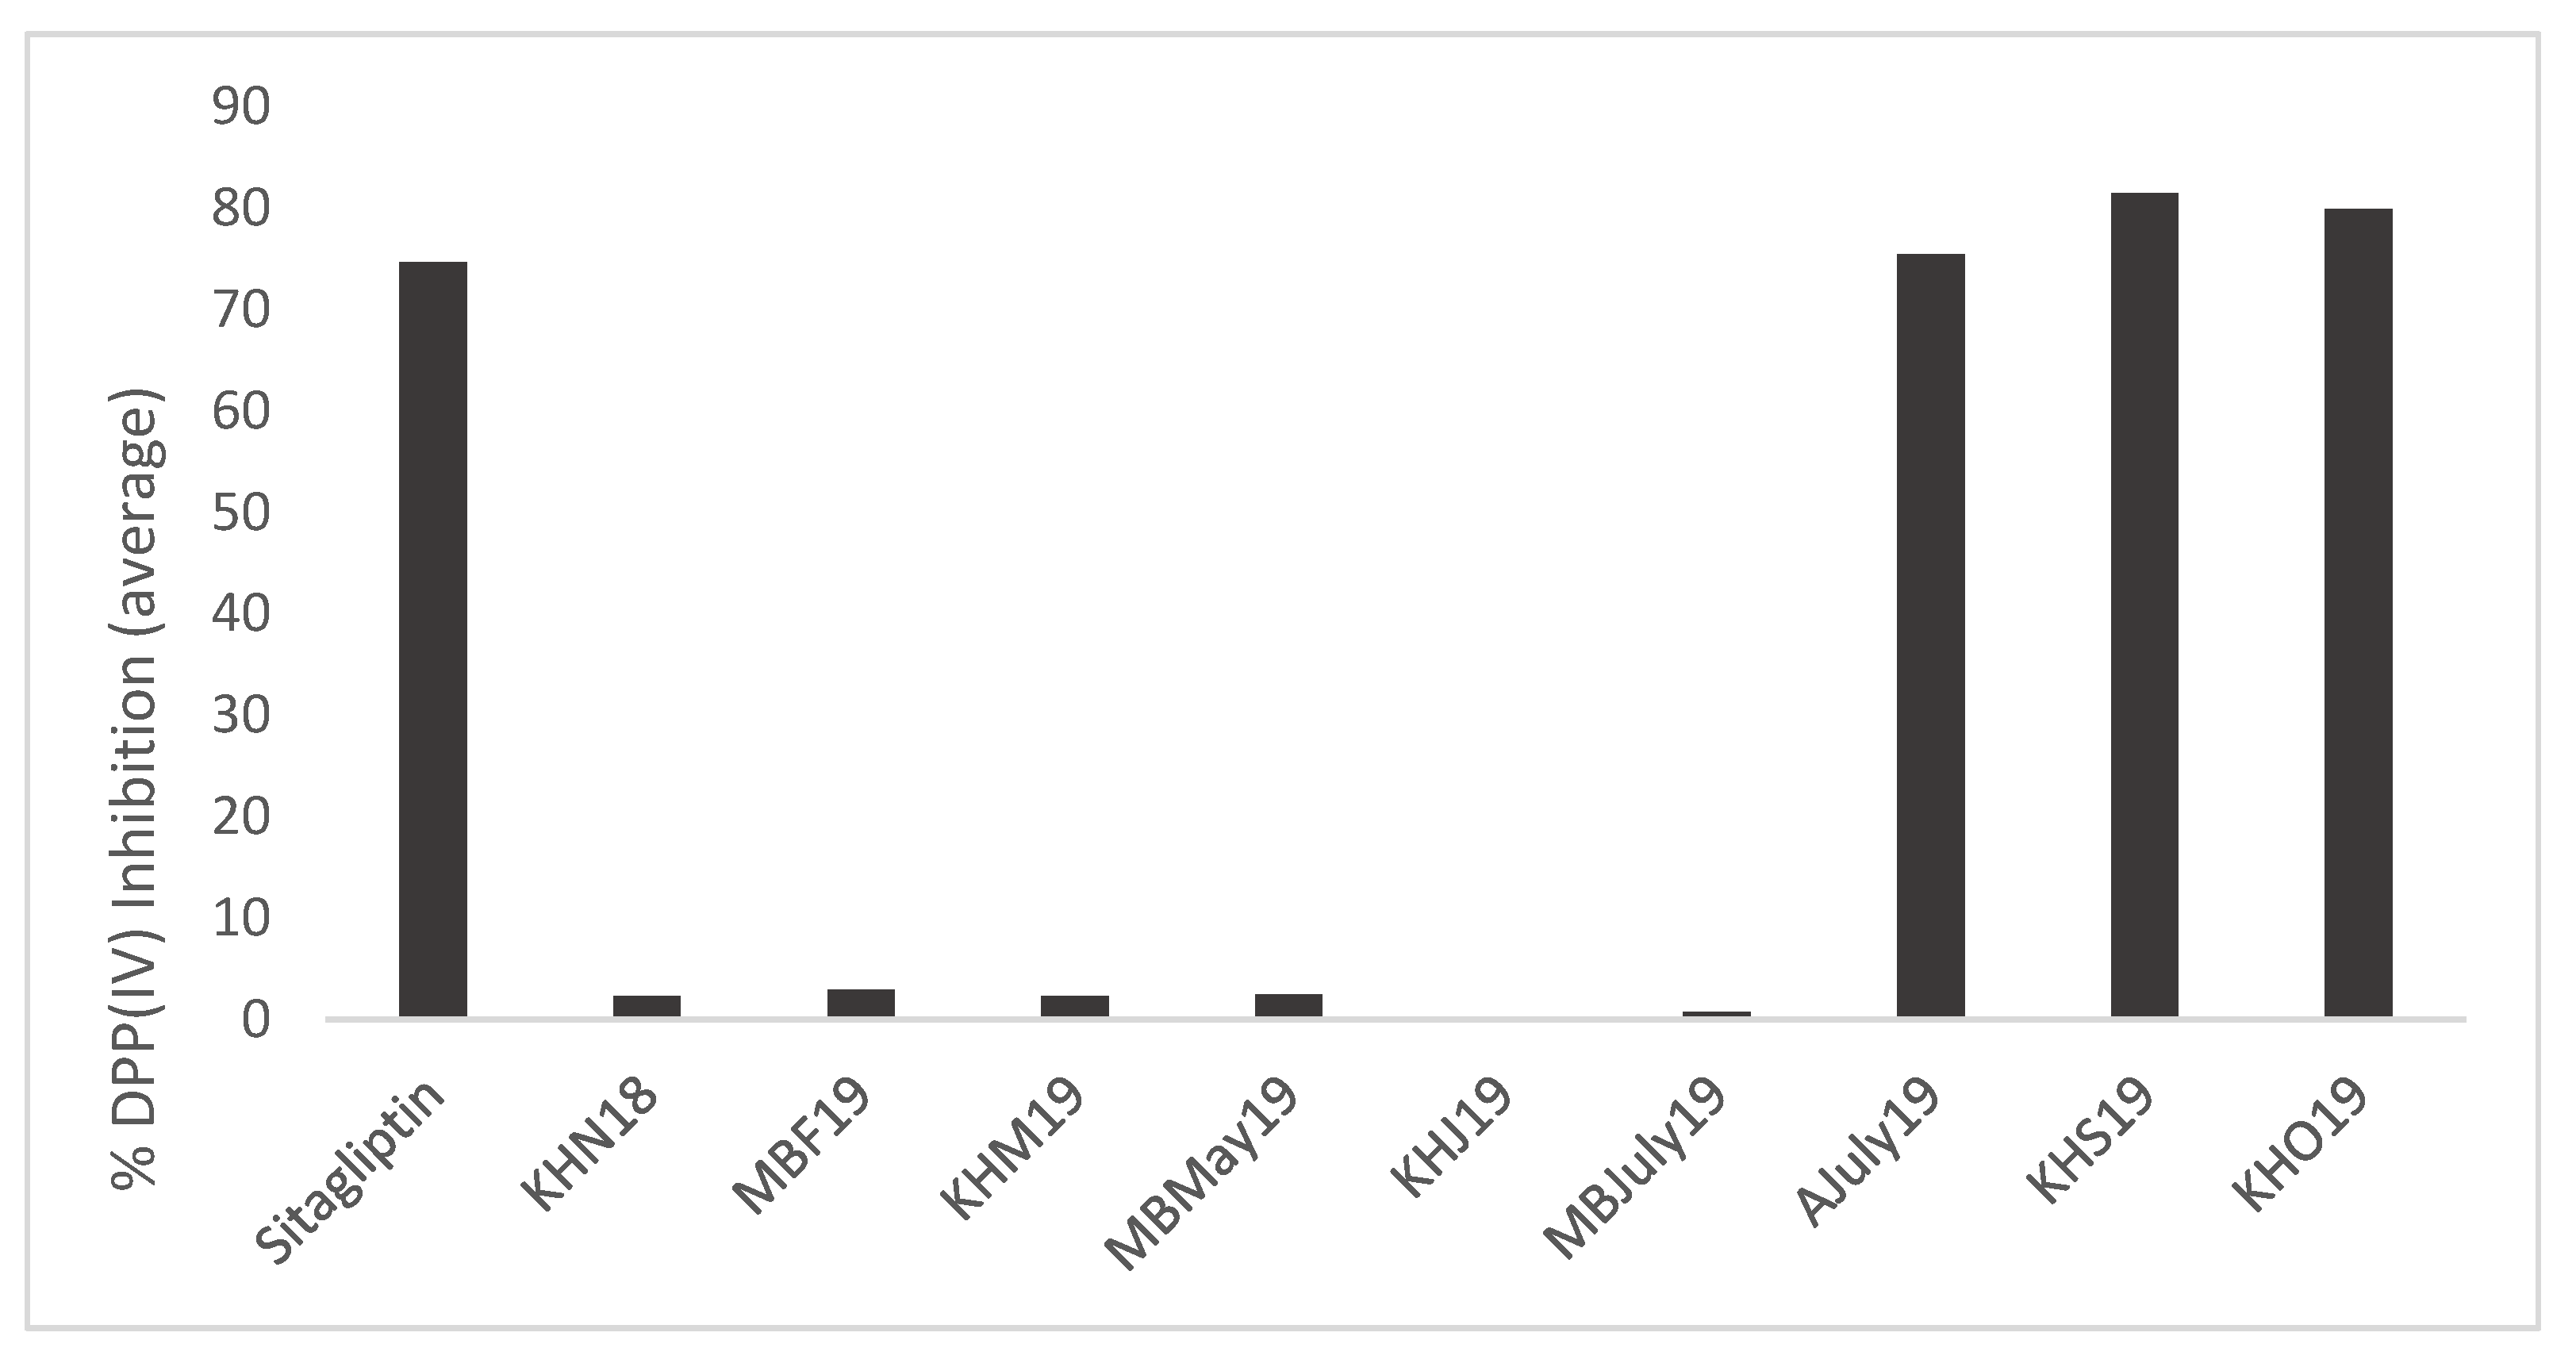
  • DPP (IV) inhibition: The DPP-IV inhibitory activity at 30 min for the generated mussel by-product hydrolysates ranged from 0% to 90.51% ± 0.18%, whereas it was 81.14% ± 0.47% for sitagliptin when samples were assayed at a concentration of 1 mg/mL compared to the positive control, sitagliptin, which was assayed at a concentration of 18 nM (IC50 value) (Figure 7).
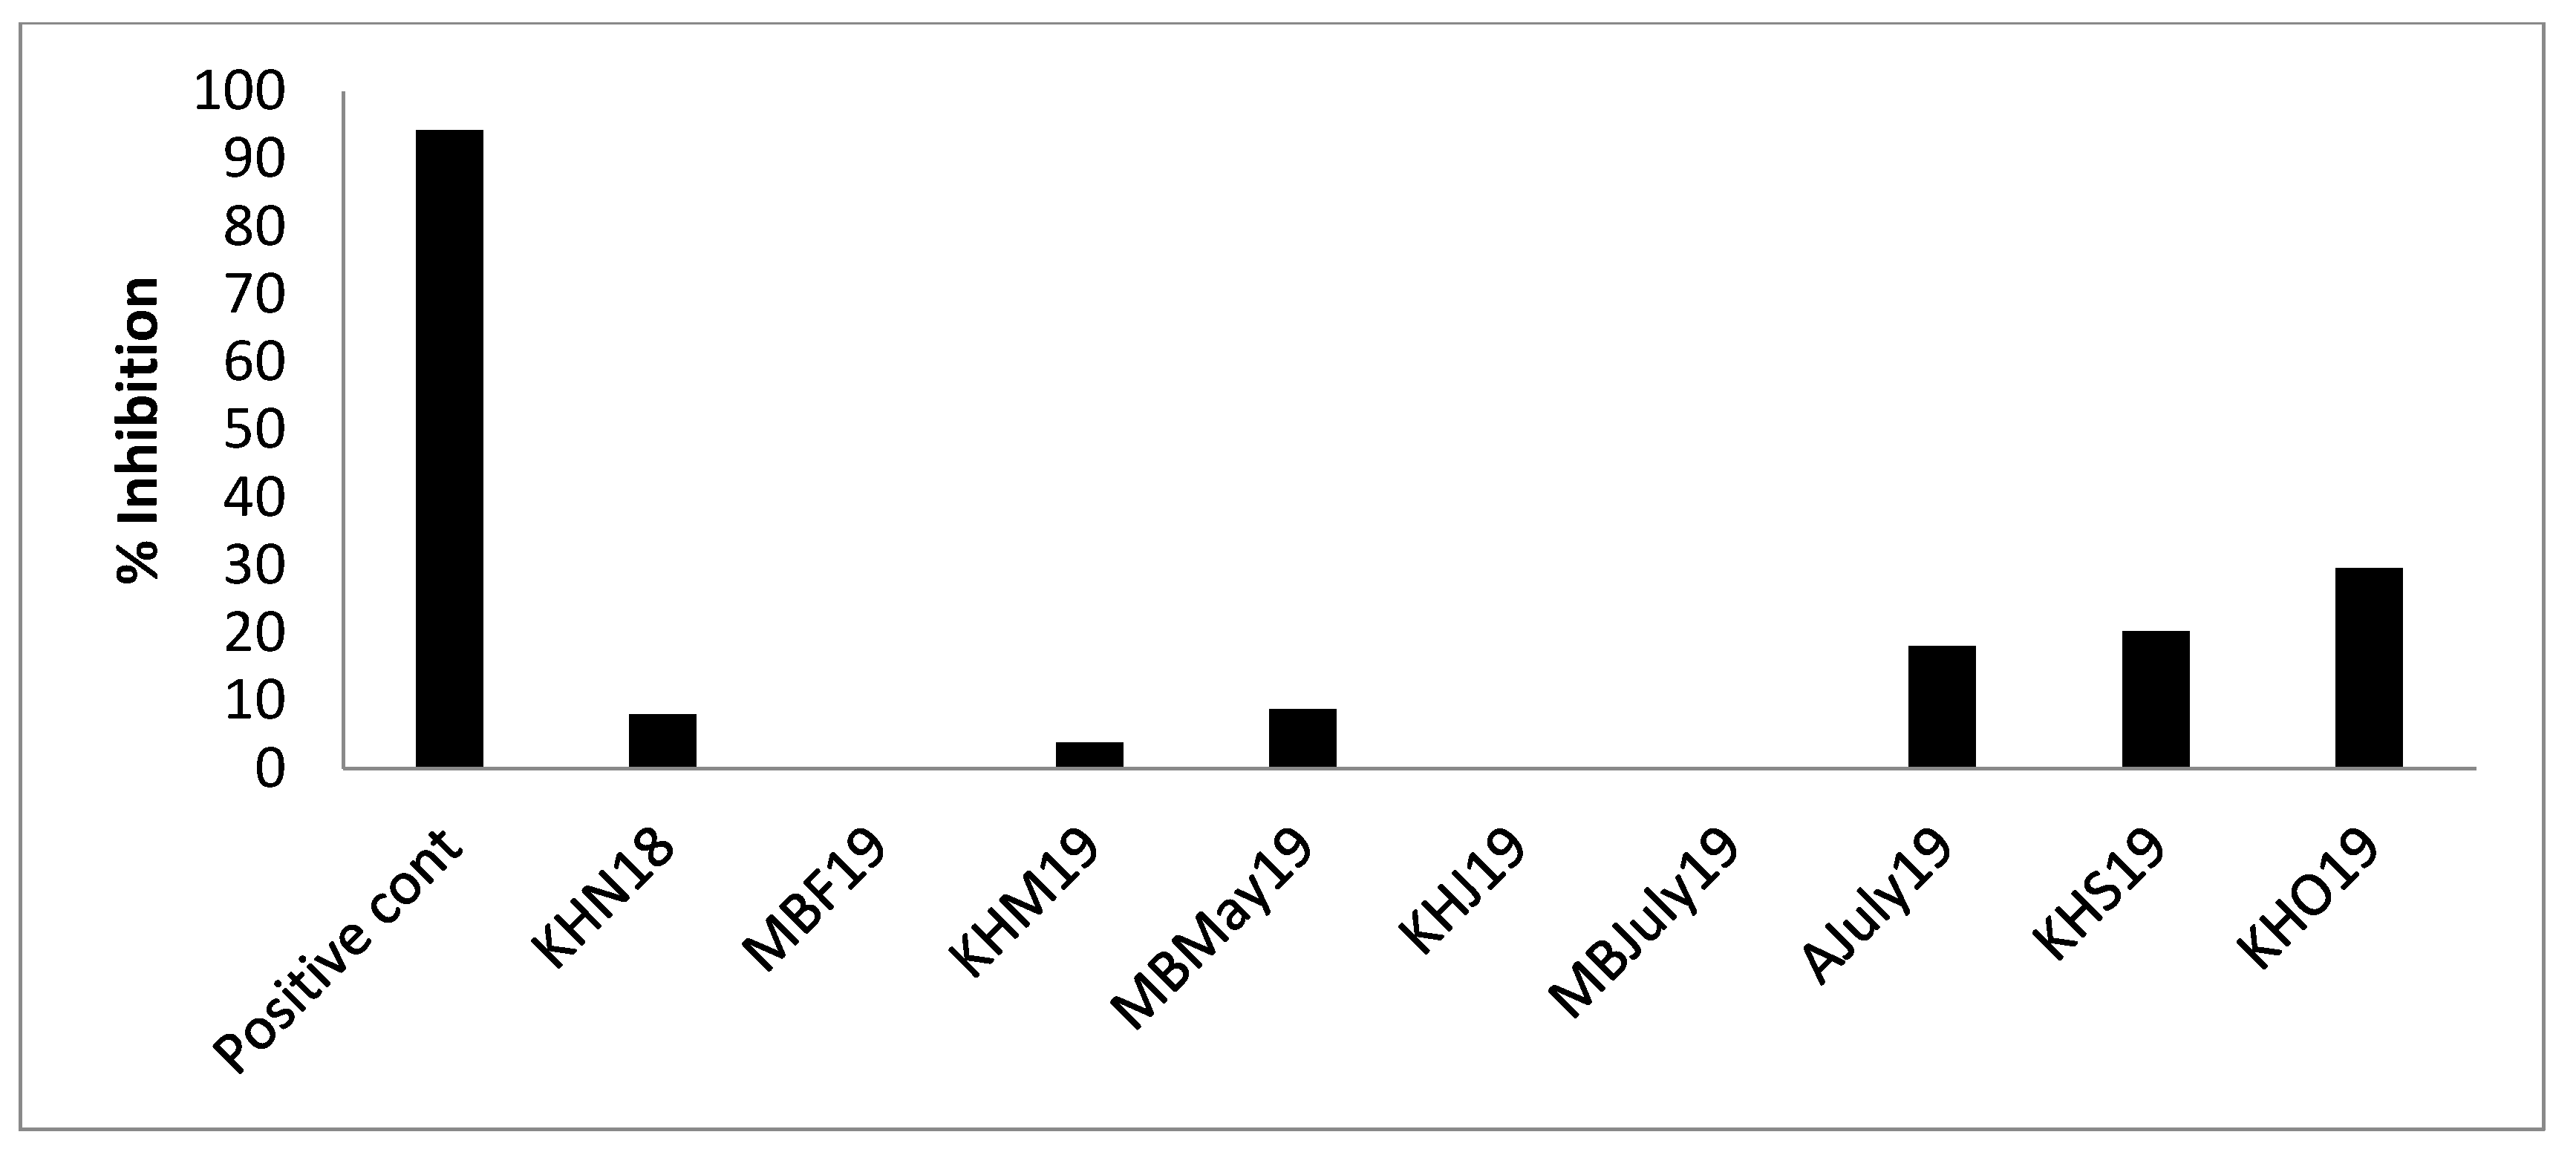
  • AChE inhibition: A trend similar to DPPIV inhibition was seen. AJuly19, KHS19 and KHO19 displayed AChE inhibition (Figure 8), though the % inhibition (KHO19: 29.59% ± 1.88%) of the samples (1 mg/mL) was low as compared to positive control acotiamide dihydrochloride (94.201% ± 0.89%) assayed at 100 uM concentration (IC50 3 uM). Researchers have found AChE, ACE-I and DPPH inhibitory activity in subcritical extracts of blue mussels [47]. The obtained results warrant further studies to explore the possible potential of some of these hydrolysates in promoting mental health.
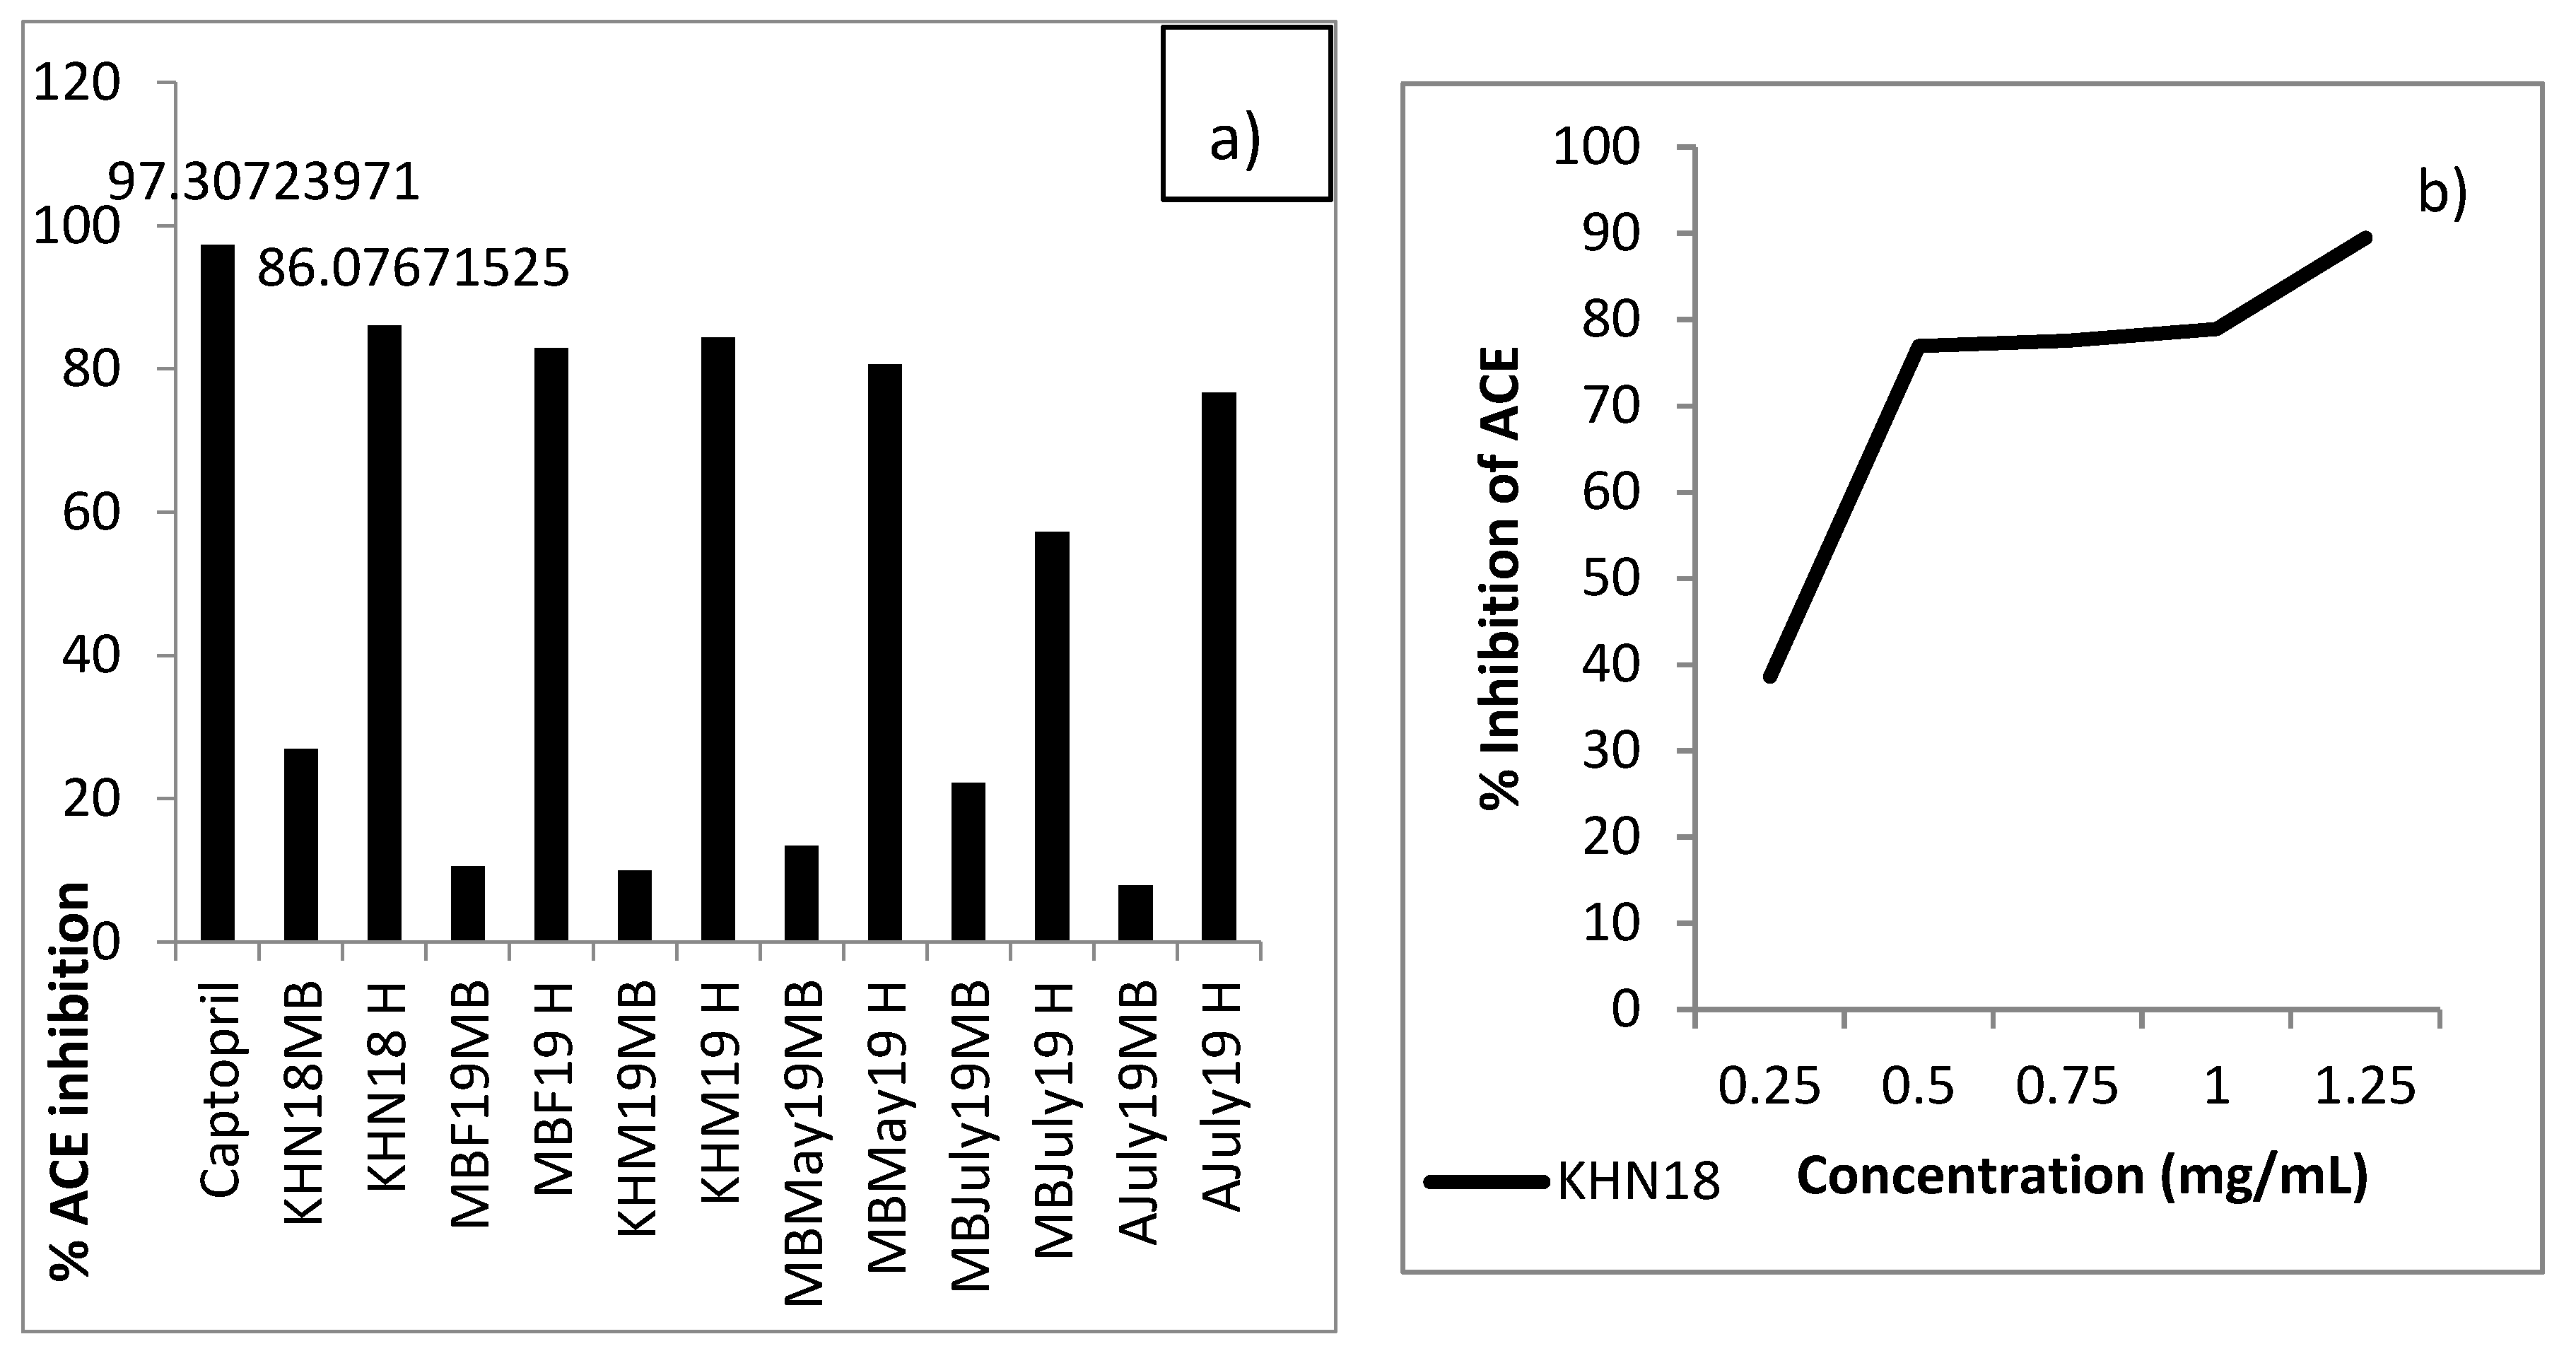
  • ACE-I inhibition: All the samples showed appreciable ACE-I inhibition as compared to un-hydrolysed mussel broth, as seen in Figure 9. The percentage of ACE-I inhibition was seen to vary between 22.23% ± 1.79% and 86.08% ± 1.59% for hydrolysates as compared to 97.31% ± 0.255% by positive control captopril. The KHN18 sample inhibited ACE-I by 86.08% ± 1.59% when assayed at a concentration of 1 mg/mL, compared to captopril which was assayed at a concentration of 0.5 mg/mL. Further, the IC50 value for KHN18 was 0.2944 mg/mL, which is lower than reported values of other marine hydrolysates (1.50–2.54 mg/mL) [48], highlighting the superior ACE-I inhibitor potential of the mussel hydrolysates. An interesting study conducted on Mytilus edulis-based fermented sauce also established the formation of ACE-I inhibitory peptides from blue mussel sources [14]. The findings from the in vitro assay also confirm the results obtained from bioinformatics mining of the sequenced peptides, as 92% of the peptides identified in the 3-kDa permeate fraction and assessed using BIOPEP had ACE-I inhibitory activity.

4. Summary

The mussel meat yield and resulting hydrolysate yields showed season-specific trends and this related to the fat and protein content of generated hydrolysates. Mussel meat yields were 9.75% to 21.69%, 0.37% ± 0.11% to 0.52% ± 0.17%, 36.77% ± 7.17% to 52.19% ± 3.33% for mussel meat and 3.33% ± 0.93% to 7.17% ± 0.65%, 0.97% ± 0.06% to 2% ± 0%, 33.48% ± 1.45% to 36.99% ± 1.27% for hydrolysates harvested during the period from February to May (during the gamete development season). This is compared to values of 15.34% to 22%, 2.5% ± 1.32% to 6.36% ± 1.2%, 65.78% ± 0.54% to 68.31% ± 1.02% for mussel meat and 7.97% ± 0.39% to 9.57% ± 0.94%, 0.96% ± 0.05% to 2% ± 0%, 35.57% ± 1.02% to 40.54% ± 2.12% for hydrolysates generated with July–October samples (during the blue mussel spawning season). All the hydrolysates were rich in essential amino acids, taurine, polyunsaturated fatty acids EPA and DHA, and contained several unique bioactive peptides with ACE-I inhibitory activity. Few hydrolysates had DPP-IV inhibitory activities (AJuly19, KHS19 and KHO19) and hydrolysates generated with these samples also inhibited AChE. The in silico results were in agreement with the results seen through in vitro enzyme inhibition assays. Peptides obtained from the 3-kDa fraction of the hydrolysates were medium-to-large sized, having >7 amino acids. The hydrolysates showed good emulsion activity and excellent protein solubility profiles over a range of pH and can thus be incorporated in further product formulation studies targeting cardiovascular diseases and obesity. The study enabled the characterisation of raw material and hydrolysate products through a sampling period of one year. In future, inhibitory peptides from marine sources need not be limited to over-exploited green lipped mussels. The bio-active-rich composition of the resulting hydrolysates from lesser studied Mytilus edulis mussels opens doors for nutraceutical products. Further, in silico studies can be undertaken using blue mussel-derived sequenced peptides to dock critical enzymes such as prolyl endopeptidase, cyclooxygenase 1 and 2, along with dipeptidyl peptidase, acetylcholinesterase and angiotensin-converting enzyme-1. The enzymes have been implicated in several disorders such as mental degeneration, inflammation, diabetes, cardiovascular diseases and other metabolic diseases.

Author Contributions

Conceptualisation, M.H.; methodology, A.S.N.; validation, A.S.N., M.H.; formal analysis, A.S.N., L.M.; investigation, M.H. and A.S.N.; writing—original draft preparation, A.S.N.; writing—review and editing, A.S.N. and M.H.; supervision, M.H.; project administration, M.H.; funding acquisition, M.H. All authors have read and agreed to the published version of the manuscript.

Funding

This research was funded by Bord Iascaigh Mhara (BIM) and the European Maritime Fisheries Fund (EMFF), grant number 17/SRDP/002 2018-2020.

Acknowledgments

The authors would like to acknowledge the contribution of Ivan Milovanovic for assistance with fatty acid methyl ester (FAME) analysis. The authors would like also to thank AnneMarie McAuliffe for assistance with TAA analysis.

Conflicts of Interest

The authors declare no conflict of interest.

References

  1. FAO. Fishery and Aquaculture Statistics; FAO: Rome, Italy, 2016. [Google Scholar]
  2. Naik, A.S.; Hayes, M. Bioprocessing of mussel by-products for value added ingredients. Trends Food Sci. Technol. 2019, 92, 111–121. [Google Scholar] [CrossRef]
  3. Laura, E.; Petes, B.A.M.; Alyssa, L. Harris Intertidal mussels exhibit energetic trade-offs between reproduction and stress resistance. Ecol. Monogr. 2008, 78, 387–402. [Google Scholar]
  4. Fernandez, A.; Grienke, U.; Soler-Vila, A.; Guiheneuf, F.; Stengel, D.B.; Tasdemir, D. Seasonal and geographical variations in the biochemical composition of the blue mussel (Mytilus edulis L.) from Ireland. Food Chem. 2015, 177, 43–52. [Google Scholar] [CrossRef] [PubMed]
  5. Bongiorno, T.; Iacumin, L.; Tubaro, F.; Marcuzzo, E.; Sensidoni, A.; Tulli, F. Seasonal changes in technological and nutritional quality of Mytilus galloprovincialis from suspended culture in the Gulf of Trieste (North Adriatic Sea). Food Chem. 2015, 173, 355–362. [Google Scholar] [CrossRef]
  6. Dare, P.J.; Edwards, D.B. Seasonal changes in flesh weight and biochemical composition of mussels (Mytilus Edulis, L.) in the Conwy Estuary, North Wales. J. Exp. Mar. Biol. Ecol. 1975, 18, 89–97. [Google Scholar] [CrossRef]
  7. Carboni, S.; Kaur, G.; Pryce, A.; McKee, K.; Desbois, A.P. Mussel Consumption as a “Food First” Approach to Improve Omega-Status. Nutrients 2019, 11, 1381. [Google Scholar] [CrossRef] [Green Version]
  8. Doggrell, S.A. Lyprinol—Is it a useful anti-inflammatory agent? Evid. Based Complementary Altern. Med. Ecam 2011, 2011, 307121. [Google Scholar] [CrossRef] [Green Version]
  9. Wang, B.; Li, L.; Chi, C.F.; Ma, J.H.; Luo, H.Y.; Xu, Y.F. Purification and characterisation of a novel antioxidant peptide derived from blue mussel (Mytilus edulis) protein hydrolysate. Food Chem. 2013, 138, 1713–1719. [Google Scholar] [CrossRef]
  10. Ilva, V.M.; Park, K.J.; Hubinger, M.D. Optimization of the enzymatic hydrolysis of mussel meat. J. Food Sci. 2010, 75, C36–C42. [Google Scholar]
  11. Dai, Z.-Y.; Zhang, Y.-P.; Zhang, H.; Lu, Y.-B. Preparation and Characterization of Mussel (Mytilus Edulis) Protein Hydrolysates with Angiotensin-I-Converting Enzyme (Ace) Inhibitory Activity by Enzymatic Hydrolysis. J. Food Biochem. 2012, 36, 66–74. [Google Scholar] [CrossRef]
  12. Nguyen HT, M.; Sylla KS, B.; Randriamahatody, Z.; Donnay-Moreno, C.; Moreau, J.; Tran, L.T.; Bergé, J. Enzymatic Hydrolysis of Yellowfin Tuna (Thunnus albacares)By-Products Using Protamex Protease. Food Technol. Biotechnol. 2011, 49, 48–55. [Google Scholar]
  13. Park, S.Y.; Ahn, C.-B.; Je, J.-Y. Antioxidant and Anti-Inflammatory Activities of Protein Hydrolysates fromMytilus Edulisand Ultrafiltration Membrane Fractions. J. Food Biochem. 2014, 38, 460–468. [Google Scholar] [CrossRef]
  14. Rajapakse, N.; Mendis, E.; Jung, W.-K.; Je, J.-Y.; Kim, S.-K. Purification of a radical scavenging peptide from fermented mussel sauce and its antioxidant properties. Food Res. Int. 2005, 38, 175–182. [Google Scholar] [CrossRef]
  15. Beaulieu, L.; Thibodeau, J.; Bonnet, C.; Bryl, P.; Carbonneau, M.E. Evidence of anti-proliferative activities in blue mussel (Mytilus edulis) by-products. Mar. Drugs 2013, 11, 975–990. [Google Scholar] [CrossRef] [Green Version]
  16. Oh, R.; Lee, M.J.; Kim, Y.O.; Nam, B.H.; Kong, H.J.; Kim, J.W.; Park, J.Y.; Seo, J.K.; Kim, D.G. Purification and characterization of an antimicrobial peptide mytichitin-chitin binding domain from the hard-shelled mussel, Mytilus coruscus. Fish Shellfish Immunol. 2018, 83, 425–435. [Google Scholar] [CrossRef]
  17. Jung, W.-K.; Kim, S.-K. Isolation and characterisation of an anticoagulant oligopeptide from blue mussel, Mytilus edulis. Food Chem. 2009, 117, 687–692. [Google Scholar] [CrossRef]
  18. Elavarasan, K.; Shamasundar, B.A.; Badii, F.; Howell, N. Angiotensin I-converting enzyme (ACE) inhibitory activity and structural properties of oven- and freeze-dried protein hydrolysate from fresh water fish (Cirrhinus mrigala). Food Chem. 2016, 206, 210–216. [Google Scholar] [CrossRef]
  19. Sánchez, A.; Vázquez, A. Bioactive peptides: A review. Food Qual. Saf. 2017, 1, 29–46. [Google Scholar] [CrossRef]
  20. Karami, Z.; Akbari-Adergani, B. Bioactive food derived peptides: A review on correlation between structure of bioactive peptides and their functional properties. J. Food Sci. Technol. 2019, 56, 535–547. [Google Scholar] [CrossRef]
  21. Ovando, C.A.; Carvalho, J.C.D.; Vinícius de Melo Pereira, G.; Jacques, P.; Soccol, V.T.; Soccol, C.R. Functional properties and health benefits of bioactive peptides derived from Spirulina: A review. Food Rev. Int. 2018, 34, 34–51. [Google Scholar] [CrossRef]
  22. Turck, D.; Bresson, J.L.; Burlingame, B.; Dean, T.; Fairweather-Tait, S.; Heinonen, M.; Hirsch-Ernst, K.I.; Mangelsdorf, I.; McArdle, H.J.; Naska, A.; et al. Safety of shrimp peptide concentrate as a novel food pursuant to Regulation (EU) 2015. EFSA J. 2018, 16. [Google Scholar] [CrossRef]
  23. Adler-Nissen, J. Enzymic Hydrolysis of Food Proteins; Elsevier Applied Science Publishers: Barking, UK, 1986; p. xxiv. 427p. [Google Scholar]
  24. Association of Official Analytical Chemists. Official Methods of Analysis of AOAC International; AOAC International: Rockville, MD, USA, 1998. [Google Scholar]
  25. Fountoulakis, M.; Lahm, H.W. Hydrolysis and amino acid composition of proteins. J. Chromatogr. A 1998, 826, 109–134. [Google Scholar] [CrossRef]
  26. The UniProt Consortium UniProt: A worldwide hub of protein knowledge. Nucleic Acids Res. 2019, 47, D506–D515. [CrossRef] [PubMed] [Green Version]
  27. Perkins, D.N.; Pappin, D.J.; Creasy, D.M.; Cottrell, J.S. Probability-based protein identification by searching sequence databases using mass spectrometry data. Electrophoresis 1999, 20, 3551–3567. [Google Scholar] [CrossRef]
  28. Keska, P.; Rohn, S.; Halagarda, M.; Wojciak, K.M. Different carcass elements of organic and conventional pork –potential sources of antioxidant activities. Antioxidants 2020, 9, 835. [Google Scholar] [CrossRef]
  29. Minkiewicz, P.; Iwaniak, A.; Darewicz, M. BIOPEP-UWM Database of Bioactive Peptides: Current Opportunities. Int. J. Mol. Sci. 2019, 20, 5978. [Google Scholar] [CrossRef] [Green Version]
  30. Araujo, P.; Nguyen, T.T.; Frøyland, L.; Wang, J.; Kang, J.X. Evaluation of a rapid method for the quantitative analysis of fatty acids in various matrices. J. Chromatogr. 2008, 1212, 106–113. [Google Scholar] [CrossRef] [Green Version]
  31. Silvestre, M.P.C.; Morais, H.A.; Silva, V.D.M.; Silva, M.R. Degree of hydrolysis and peptide profile of whey proteins using pancreatin. Nutrire 2013, 38, 278–290. [Google Scholar] [CrossRef]
  32. Chiang, J.H.; Loveday, S.M.; Hardacre, A.K.; Parker, M.E. Effects of enzymatic hydrolysis treatments on the physicochemical properties of beef bone extract using endo- and exoproteases. Int. J. Food Sci. Technol. 2019, 54, 111–120. [Google Scholar] [CrossRef] [Green Version]
  33. Novikov, V.Y.; Derkach, S.R.; Kuchina, Y.A.; Shironina, A.Y.; Mukhin, V.A. Kinetics of enzymatic reactions in the production of fish protein hydrolysates. J. Dispers. Sci. Technol. 2018, 39, 1454–1461. [Google Scholar] [CrossRef]
  34. Duinker, A.; Håland, L.; Hovgaard, P.; Mortensen, S. Gonad development and spawning in one and two year old mussels (Mytilus edulis) from Western Norway. J. Mar. Biol. Assoc. UK 2008, 88, 1465–1473. [Google Scholar] [CrossRef]
  35. Naqash, S.Y.; Nazeer, R.A. Antioxidant and functional properties of protein hydrolysates from pink perch (Nemipterus japonicus) muscle. J. Food Sci. Technol. 2013, 50, 972–978. [Google Scholar] [CrossRef] [PubMed] [Green Version]
  36. Segura-Campos, M.R.; Espinosa-García, L.; chel-Guerrero, L.A.; Betanar-Ancona, D.A. Effect of enzymatic hydrolysis on solubility, hydrophobicity and in vivo digestibility in cowpea (Vigna unguiculata). Int. J. Food Prop. 2012, 15, 770–780. [Google Scholar] [CrossRef] [Green Version]
  37. Yu, D.; Sun, Y.; Wang, W.; O’Keefe, S.F.; Neilson, A.P.; Feng, H.; Wang, Z.; Huang, H. Recovery of protein hydrolysates from brewer’s spent grain using enzyme and ultrasonication. Int. J. Food Sci. Technol. 2020, 55, 357–368. [Google Scholar] [CrossRef]
  38. Ben Slama-Ben Salem, R.; Bkhairia, I.; Abdelhedi, O.; Nasri, M. Octopus vulgaris protein hydrolysates: Characterization, antioxidant and functional properties. J. Food Sci. Technol. 2017, 54, 1442–1454. [Google Scholar] [CrossRef] [Green Version]
  39. Gorissen, S.H.M.; Crombag, J.J.R.; Senden, J.M.G. Protein content and amino acid composition of commercially available plant-based protein isolates. Amino Acids 2018, 50, 1685–1695. [Google Scholar] [CrossRef] [Green Version]
  40. Bak, K.H.; Petersen, M.A.; Lametsch, R.; Hansen, E.T.; Ruiz-Carrascal, J. Development of Volatile Compounds during Hydrolysis of Porcine Hemoglobin with Papain. Molecules 2018, 23, 357. [Google Scholar] [CrossRef] [Green Version]
  41. Breternitz, N.R.; Bolini, H.M.A.; Hubinger, M.D. Sensory acceptance evaluation of a new food flavoring produced by microencapsulation of a mussel (Perna perna) protein hydrolysate. LWT Food Sci. Technol. 2017, 83, 141–149. [Google Scholar] [CrossRef]
  42. Bachmanov, A.A.; Bosak, N.P.; Glendinning, J.I.; Inoue, M.; Li, X.; Manita, S.; McCaughey, S.A.; Murata, Y.; Reed, D.R.; Tordoff, M.G.; et al. Genetics of Amino Acid Taste and Appetite. Adv. Nutr. 2016, 7, 806S–822S. [Google Scholar] [CrossRef] [Green Version]
  43. Xu, Y.J.; Arneja, A.S.; Tappia, P.S.; Dhalla, N.S. The potential health benefits of taurine in cardiovascular disease. Exp. Clin. Cardiol. 2008, 13, 57–65. [Google Scholar]
  44. Kyte, J.; Doolittle, R.F. A simple method for displaying the hydropathic character of a protein. J. Mol. Biol. 1982, 157, 105–132. [Google Scholar] [CrossRef] [Green Version]
  45. Wolfenden, R.; Andersson, L.; Cullis, P.; Southgate, C. Affinities of Amino Acid Side Chains for Solvent Water. Biochemistry 1981, 20, 849–855. [Google Scholar] [CrossRef] [PubMed]
  46. Mora, L.; Gallego, M.; Aristoy, M.C.; Reig, M.; Toldrá, F. Bioactive Peptides, chapter 12. In Innovative Thermal and Non-Thermal Processing, Bioaccessibility and Bioavailability of Nutrients and Bioactive Compounds; Woodhead Publishing: Sawston, UK, 2019; pp. 333–345. [Google Scholar]
  47. Han, J.-K.; Sung, S.-C.; Jo, M.-J.; Lee, S.-C. Antioxidant, ACE inhibitory, and acetylcholinesterase inhibitory activities of subcritical water extract of blue mussel. Food Sci. Biotechnol. 2018, 27, 847–851. [Google Scholar] [CrossRef] [PubMed]
  48. Ghanbari, R.; Zarei, M.; Ebrahimpour, A.; Abdul-Hamid, A.; Ismail, A.; Saari, N. Angiotensin-I Converting Enzyme (ACE) Inhibitory and Anti-Oxidant Activities of Sea Cucumber (Actinopyga lecanora) Hydrolysates. Int. J. Mol. Sci. 2015, 16, 28870–28885. [Google Scholar] [CrossRef] [Green Version]
Figure 1. The Degree of hydrolysis (DH) of mussel by-product Protamex® hydrolysates (H) determined using the Adler-Nissen pH stat method. The 9 samples from the three sampling sites Mulroy bay (MB), Killary harbour (KH) and Ardgroom (A), collected from November 2018 to October 2019, were used for hydrolysis. Analysis was performed in triplicate (n = 3). Bars sharing the same letter are not significantly different according to Tukey’s honestly significant difference (HSD) test.
Applsci 10 06892 g001
Figure 2. Free and total amino acid % composition (w/w) of mussel by-product Protamex® hydrolysate for the Killary harbour November 2018 (KHN18) sample. The amino acids were quantified using a Jeol JLC-500/V amino acid analyser (Jeol Ltd., Garden city, Herts, UK) fitted with a Jeol Na+ high performance cation exchange column. Glutamate was the most abundant amino acid, whereas taurine was the most abundant free amino acid, as seen from the average values displayed on the two bars. Analysis was performed in triplicate (n = 1).
Applsci 10 06892 g002
Figure 3. Changes in meat yield (% w/w), hydrolysate yield (% w/w) and protein content (% w/w) for mussel by-products and Protamex® hydrolysates. The 10 samples from the three sampling sites Mulroy bay (MB), Killary harbor (KH) and Ardgroom (A), collected from November 2018 to October 2019, were used for analysis. Yields were determined gravimetrically, whereas protein content was estimated using the Dumas method (AOAC 968.06 method using Leco FP628). Analysis was performed in triplicate (n = 3). Bars sharing the same letter are not significantly different according to Tukey’s HSD test.
Applsci 10 06892 g003
Figure 4. Changes in lipid content (%) for mussel by-products meat (M) and Protamex® hydrolysates (H). All 9 samples from the three sampling sites, Mulroy bay (MB), Killary harbor (KH) and Ardgroom (A), collected from November 2018 to October 2019, were used for analysis. The lipid content was quantified using AOAC Method 2008.06 with an Oracle Rapid NMR Fat Analyser. Analysis was performed in triplicate (n = 3).
Applsci 10 06892 g004
Figure 5. Emulsion activity (%) of various mussel Protamex® hydrolysates (H) across a pH range of (2) to (10). All 9 samples from the three sampling sites, Mulroy bay (MB), Killary harbor (KH) and Ardgroom (A), collected from November 2018 to October 2019, were used for analysis. No significant difference was found between the average solubility values after Tukey post hoc analysis. Analysis was performed in triplicate (n = 3).
Applsci 10 06892 g005
Figure 6. The percentage solubility of various mussel Protamex® hydrolysates across a pH range of 2 to 10. Six representative samples from the three sampling sites, Mulroy bay, Killary harbour and Ardgroom, collected from November 2018 to July 2019, were used for analysis. Analysis was performed in triplicate (n = 3).
Applsci 10 06892 g006
Figure 7. DPP (IV) inhibition (%) by mussel Protamex® hydrolysates. Nine samples from the three sampling sites, Mulroy bay, Killary harbour and Ardgroom, collected from November 2018 to October 2019, were used for analysis at a concentration of 1 mg/mL. Analysis was performed in triplicate (n = 3). No significant difference was found between positive control Sitagliptin and samples AJuly19, KHS19, KHO19 after Dunn Bonferroni (nonparametric) post hoc analysis.
Applsci 10 06892 g007
Figure 8. AChE enzyme inhibition (%) by inhibition by mussel Protamex® hydrolysates. Nine samples from the three sampling sites, Mulroy bay (MB), Killary harbor (KH) and Ardgroom (A), collected from November 2018 to October 2019, were used for analysis at a concentration of 1 mg/mL. *The positive control showed significantly higher AChE inhibition as compared to all the samples. Assays were performed in triplicate (n = 3).
Applsci 10 06892 g008
Figure 9. (a) The % ACE-I enzyme inhibition (%) by mussel Protamex® hydrolysates. Six representative unhydrolyzed mussle broth samples (MB) and corresponding hydrolysates (H) from the three sampling sites, Mulroy bay (MB), Killary harbor (KH) and Ardgroom (A), collected from November 2018 to July 2019, were used for analysis at a concentration of 1 mg/mL against captopril (the positive control). (b) The IC50 curve for the Killary harbour November 2018 sample (KHN18). The positive control showed significantly higher ACE inhibition as compared to all the samples and all the hydrolysates showed significantly higher ACE inhibition as compared to unhydrolyzed samples. Assays were performed in triplicate (n = 3).
Applsci 10 06892 g009
Table 1. Water activity (aw) measurements of mussel Protamex® hydrolysates. Nine samples from the three sampling sites, Mulroy bay, Killary harbour and Ardgroom, collected from November 2018 to October 2019, were used for analysis. Analysis was performed in triplicate (n = 3).
SampleAverage awStandard Deviation (±)
KHN180.350.0028
MBF190.440.0035
KHM190.330.004
MBMay190.330.0005
KHJ190.350.0028
MBJuly190.370.008
AJuly190.300.0005
KHS190.250.0047
KHO190.290.0115
Table 2. Total amino acid composition (%, w/w) of selected mussel by-product Protamex® hydrolysates compared to other marine and non-marine protein hydrolysates.
Amino Acids KHN18proMBF19 HKHM19 HMBMay19HSoy ProteinWhey ProteinIcelandic Scallop HydrolysateAtlantic Salmon Hydrolysate
Essential amino acidsMethionine0.66070.11350.17990.36870.31.80.4571.3
Threonine1.28150.24940.28550.23552.35.40.8562.9
Lysine1.92370.27260.78960.40053.47.13.7780
Valine1.19670.00630.42750.77752.23.51.6812.5
Leucine1.68690.26790.29680.895858.602.4
Isoleucine1.11820.19560.22970.64711.93.801.2
tryptophan0000.0989000.8120
phenylalanine1.03260.22750.3470.5653.22.52.8113.1
histidine1.43820.31740.52250.50661.51.40.22916.4
arginine1.59610.18540.24950.18884.81.74.6111.3
Non-essential amino acidsglutamate/glutamine3.68140.55351.58941.932512.415.52.6783.1
proline0.97290.15080.22290.51693.34.80.7410
serine0.87650.20150.26460.20633.440.9414.8
glycine2.03810.27040.53151.54892.71.51.613.7
cysteine0.81340.03850.6430.51370.20.800
aspartate/asparagine2.46960.61040.79030.66004.1160.4
alanine1.50910.22810.79160.89752.84.22.0324.7
tyrosine00.01240.00780.0212.22.41.9091.9
GABA0.00650.02430.050700000
Taurine1.86392.31822.55952.39640000
Total26.1666.243710.779313.37760000
TEAA11.93461.83563.3284.684424.635.815.23531.1
TNEAA12.3612.06564.84116.29682733.214.01548.6
Ratio of E:NE0.96550440.88865220.687447070.7439334270.9111111.0783131.087049590.639917695
Table 3. Fatty acid composition (mg/g lipid) of mussel Protamex® hydrolysates. All 9 samples from the three sampling sites, Mulroy bay, Killary harbour and Ardgroom, collected from November 2018 to October 2019, were used for gas chromatography mass spectrometry (GCMS)-based fatty acid analysis.
mg Fatty Acid/g Lipid
Name (Methyl Ester) KHN18MBF19KHM19MBMay19KHJ19MBJuly19AJuly19KHS19KHO19
Butyric acidC4:015.0614.0214.8314.1315.3339.1912.37814.06520.340
Caproic acidC6:016.2615.1015.9815.2015.4518.0513.36915.13021.986
Caprylic acidC8:030.5839.5534.0130.5728.8535.1219.44248.53361.002
Capric acidC10:022.5931.6527.5324.5422.9325.8615.24338.06744.464
Undecanoic acidC11:06.986.496.856.536.637.715.7316.5149.458
Lauric acidC12:09.268.168.668.428.868.917.8868.60512.316
Tridecanoic acidC13:07.136.546.936.646.757.855.8866.6139.576
Myristic acidC14:0179.199.0112.3925.4231.3719.0041.66927.27925.037
Myristoleic acidC14:15.583.003.173.033.253.732.9143.0664.441
Pentadecanoic acidC15:010.667.187.997.828.958.637.8258.66211.53
cis-10-Pentadecenoic acidC15:13.153.103.283.073.163.622.6762.9324.249
Palmitic acidC16:0395.7332.1766.60115.13175.6099.48173.312132.21114.37
Palmitoleic acidC16:1210.433.6116.2856.5370.0653.5892.55755.93743.761
cis-10-Heptadecenoic acidC17:12.110.561.402.102.501.301.8921.8781.521
Stearic acidC18:034.2720.5622.2623.3839.4228.3830.46929.36534.148
Elaidic acidC18:1 t45.370.922.644.553.732.365.7492.9642.751
Oleic acidC18:1 c90.501.815.259.077.424.6911.4555.8965.468
Linolelaidic acidC18:2 t4.743.503.953.952.644.114.3533.4895.418
Linoleic acidC18:2 c95.815.5610.1812.7314.128.6616.43913.03113.276
γ-Linolenic acidC18:3 n65.243.613.964.224.134.644.7144.1995.533
α-Linolenic acidC18:3 n343.985.9912.2619.3223.319.6122.63319.86520.183
Arachidic acidC20:016.4714.8015.6214.9415.2417.8313.19114.86621.402
cis-11-Eicosenoic acidC20:118.1810.109.756.0815.546.7711.1527.2118.213
cis-11,14-Eicosadienoic acidC20:29.221.424.033.435.011.744.8354.6344.964
Henicosanoic acidC21:09.268.088.547.988.189.447.2138.02611.619
cis-8,11,14-Eicosatrienoic acidC20:3 n61.241.131.191.581.421.192.1331.4002.117
Arachidonic acidC20:4 n620.7720.5614.8210.0321.7616.8322.09917.68819.010
cis-11,14,17-Eicosatrienoic acidC20:3 n33.822.923.563.563.963.663.3424.2514.687
cis-5,8,11,14,17-EicosapentaenoicC20:5 n3 (EPA)141.4947.0254.62128.90212.2873.04313.410193.973163.444
Tricosanoic acidC23:08.267.738.177.777.909.156.8087.69311.178
Lignoceric acidC24:015.8014.7515.6214.7615.1217.3812.96914.71021.319
cis-4,7,10,13,16,19-Docosahexaenoic acidC22:6 (DHA)538.2881.3392.3182.71158.5353.75173.005150.713131.364
omega 6 137.0135.7838.1335.9449.0940.2754.5844.4450.32
omega 3 727.57137.26162.75234.49398.08140.05512.39368.80319.68
omega 6:omega 3 ratio 0.1880.2600.2340.1530.1230.2870.1060.1200.157
Table 4. Sequence, physicochemical nature and bioactivity of peptide fragments identified using mass spectrometry in the 3-kDa permeate of Killary harbour November 2018 (KHN18) mussel by-product Protamex® hydrolysate, as analyzed by BIOPEP and Thermo Fisher peptide analysis in silico tools.
Peptide Sequencemol wtNo of AA RESIDUESHydrophobicityGRAVYNaturepIPotential Bioactivities
(BIOPEP)
VDDHHDDHD1240.44100.57−2.61very high hydrophilicity4.4DPP-IV inhibition and antioxidant
PVDDHHDDHD1337.50112.2−2.52very high hydrophilicity4.4DPP4-IV inhibition and antioxidant
NPVDDHHDDHD1451.53123.57−2.6very high hydrophilicity4.4DPP4-IV inhibition and antioxidant
KPEAPKVP864.5488.9−1.26high hydrophilicity9.9ACE-I inhibitor, DPP-IV andDPP-III inhibition and antioxidant
NLGAIGH680.36713.740.37moderate hydrophobicity7.8ACE-I inhibitor, DPP-IV inhibition
KGLVDGAPAN940.471016.48−0.17moderate hydrophobicity6.8ACE-I inhibitor, DPP-IV inhibition and glucose uptake stimulating
FNAEKGFGF1015.47926.99−0.17moderate hydrophobicity6.9ACE-I inhibitor, DPP-IV and DPP-III inhibition
DHPLPGTD850.38814.49−1.34moderate hydrophobicity3.9ACE-I inhibitor, DPP-IV and DPP-III inhibition, anti-amnestic, antithrombotic, regulates stomach mucosal activity
SSDVPGV659.32711.810.19moderate hydrophobicity3.1ACE-I inhibitor, DPP-IV inhibition, anti-amnestic, antithrombotic, regulates stomach mucosal activity
GPPGEPGEPGSS1066.45126.37−1.38very high hydrophilicity3.1ACE-I inhibitor, antioxidative, DPP-IV and DPPIII inhibition, anti-amnestic, antithrombotic, regulates stomach mucosal activity

