Abstract
This study aims to assess the perceived quality of telecommunication services in Portugal and examine how governance practices influence organizational performance, addressing the lack of empirical evidence on service quality gaps in the Portuguese telecommunications sector. Specifically, it investigates the alignment between customers’ expectations and perceptions of service delivery among major telecommunications providers in northern Portugal. A convenience sample of 119 subscribers was collected through an online questionnaire disseminated via social media and email. The survey measured service quality across the five SERVQUAL dimensions (tangibles, reliability, responsiveness, assurance, and empathy), and sociodemographic variables (gender, age, and education) were recorded to explore their influence on customer satisfaction and perceived quality. Results reveal a consistent gap between expectations (6.51) and perceptions (5.54), particularly in reliability and responsiveness, despite generally positive evaluations of tangibility and assurance. Sociodemographic factors significantly influenced satisfaction levels and perceptions of service quality, highlighting the importance of tailored governance strategies. These findings demonstrate that effective governance and quality management are interdependent drivers of sustainable competitiveness in technology-intensive sectors. By identifying specific quality gaps and their drivers, this study provides actionable insights for improving service delivery. Enhancing organizational reliability, responsiveness, and empathy—supported by transparent communication and data-driven decision-making—is essential for improving customer trust, operational resilience, and long-term performance. By integrating continuous quality assessment into administrative strategy, telecommunications firms can enhance service excellence and contribute to broader goals of sustainable economic development and digital transformation.
1. Introduction
In an era defined by rapid technological change, globalization, and rising customer expectations, the effectiveness of governance and administrative quality has become a crucial determinant of organizational performance. Telecommunications, as a cornerstone of digital infrastructure, plays a strategic role in shaping the competitiveness and resilience of modern economies. Beyond technological capacity, the ability of companies to deliver reliable, responsive and customer-centered services increasingly reflects the quality of their governance models and management systems (Pires, 2007; António et al., 2016).
Since the 1980s, quality management has evolved from a technical approach focused on process control to a comprehensive philosophy embedded in corporate governance and strategic planning (Deming, 1982; Ishikawa, 1990). The adoption of Total Quality Management (TQM) principles and international standards such as ISO 9001:2015 (APCER, 2015) consolidated quality as a key element of organizational governance, linking operational reliability, transparency and continuous improvement to sustainable performance (Wicher et al., 2018; Goetz, 2022). In this context, quality is not limited to the conformity of outputs but represents an administrative capacity that integrates people, processes and technology in pursuit of long-term value creation.
In the service economy, the relationship between governance and quality takes on a particularly critical role. Service delivery depends not only on technological assets but also on management systems that ensure consistency, responsiveness and trust (Grönroos, 1990; Kotler & Keller, 2019). The telecommunications sector exemplifies this interdependence: as digitalization accelerates, customer satisfaction becomes a strategic indicator of governance effectiveness and an essential condition for competitiveness. Service quality, perceived through dimensions such as reliability, assurance and empathy, reflects both organizational performance and institutional credibility (Parasuraman et al., 1988; Zeithaml et al., 2017).
This study therefore investigates how governance effectiveness and service quality interact to influence organizational performance in the Portuguese telecommunications sector. By analyzing gaps between customer expectations and perceptions, it identifies areas where administrative practices can be strengthened to improve service delivery and build sustainable trust. The research adopts the SERVQUAL framework as a diagnostic tool to assess the coherence between strategic governance principles and operational execution. In doing so, it contributes to a broader understanding of how governance quality and customer satisfaction can act as complementary drivers of economic development and organizational sustainability in a technology-intensive industry.
Despite extensive research on service quality assessment in telecommunications globally, significant empirical gaps persist in the Portuguese context. While SERVQUAL has been widely applied to measure customer perceptions across various service sectors and telecom markets internationally (Salem & Kiss, 2023; Sravanthi, 2024; Mehta & Sharma, 2024), few studies have systematically examined this relationship within the Portuguese telecommunications sector, where market maturity, competitive intensity, and regulatory environment differ substantially from other European contexts. ANACOM (2025) data documents 13.8 million subscribers, and Eurostat (2023) reveals 85.8% internet penetration, indicating a digitally mature population whose service quality expectations may differ systematically from international contexts studied to date. The absence of Portugal-specific empirical evidence limits understanding of how governance practices in Portuguese telecommunications operators (NOS, MEO, Vodafone) translate into customer-perceived service quality.
Furthermore, existing literature predominantly treats governance and service quality as separate domains. Governance is examined through compliance frameworks (ISO 9001, corporate governance structures) without explicit measurement of customer-perceived service outcomes. Service quality, conversely, is assessed independently using SERVQUAL or satisfaction metrics, without connection to underlying governance practices. The interaction between governance effectiveness, reflected in organizational reliability, responsiveness, and accountability, and customer-perceived service quality dimensions remains underexplored. Additionally, the relationship between service quality perceptions and organizational performance outcomes (customer satisfaction, loyalty, competitive positioning) is rarely examined holistically. This study addresses this theoretical gap by positioning service quality not as an outcome of operational processes alone, but as a direct manifestation of governance capacity.
Finally, while some research documents sociodemographic variations in service perceptions (Melia, 2014), the specific patterns of expectation-perception gaps and their variation across gender, age, and education levels remain undocumented for the Portuguese telecommunications market. This is particularly important because tailoring governance strategies and quality improvement initiatives to specific customer segments requires understanding their differential sensitivity to service dimensions. Limited evidence exists on whether governance strategies effective for one demographic group translate equally across segments.
This study addresses these three interconnected gaps by (1) providing empirical evidence of how service quality dimensions measured via SERVQUAL manifest in Portuguese telecommunications; (2) examining how governance practices interact with perceived service quality to influence organizational performance; and (3) analyzing how sociodemographic characteristics (gender, age, education) moderate the strength and nature of service quality gaps, informing segment-specific governance and quality strategies.
2. Theoretical Framework
Quality management and service excellence have been extensively discussed in the literature, evolving from early industrial quality control models to comprehensive frameworks integrating customer satisfaction and organizational performance. This section presents the theoretical foundations underpinning the present research, emphasizing the evolution of quality management standards and the conceptualization of service quality within the SERVQUAL model. The review seeks to clarify how these frameworks contribute to assessing and improving perceived service quality in the telecommunications sector, where customer expectations and perceptions play a critical role in shaping organizational competitiveness.
2.1. Service Quality and the SERVQUAL Model
The concept of service quality began to attract significant academic attention in the early 1980s, when services came to represent an increasingly significant share of the global economy (Parasuraman et al., 1988). According to Melia (2014), service quality is the primary factor that generates customer loyalty and determines a company’s long-term survival in the market.
Grönroos (1990) was a pioneer in distinguishing between technical quality (the outcome of the service) and functional quality (the process of service delivery). This distinction proved essential to understanding how customers evaluate quality—not only based on the final product, but also on the way the service is delivered.
Building on Grönroos’s framework, Parasuraman et al. (1990) developed the SERVQUAL model, which measures service quality as the difference between customers’ expectations and their perceptions. In 1988, the authors expanded the model to include the concept of perceived total quality, highlighting the importance of organizational image and marketing communications in shaping customer expectations.
Perceived quality is strongly influenced by the corporate image that consumers hold of a company (Gonçalves dos Reis & Melão, 2009). Grönroos (1990) suggested that corporate image functions as an interpretative filter that shapes how customers perceive the service they receive.
Kotler (1992) reinforced that customers select their service providers based on expectations and, after consumption, compare the experience to what they anticipated. Understanding what customers value is therefore essential for managing service quality. Moreira (2010) further emphasized that even when managers are not directly present during critical service encounters, they must promote a customer-centered organizational culture in which the client is the ultimate judge of quality.
Service quality is thus a key competitive differentiator and a critical success factor (Parasuraman et al., 1988). Najafi et al. (2015) highlighted that service quality is a multidimensional construct and must be evaluated by considering both tangible and intangible aspects of service delivery.
Given the dynamic nature of the service sector, delivering quality has become not only a strategic goal but also a competitive necessity. According to Zeithaml et al. (2017), the key to service quality lies in meeting or exceeding customer expectations, as positive perceptions generate satisfaction and loyalty.
Kotler and Keller (2019) note that higher service quality leads to greater customer satisfaction, allowing firms to justify higher prices and reduce costs associated with complaints or customer loss. Zeithaml et al. (2017) add that excellence in service creates loyal customers who become continuous and sustainable sources of revenue.
The SERVQUAL model identifies five key dimensions that customers use to assess service quality: tangibility, which refers to the physical facilities, equipment, and appearance of staff; reliability, representing the organization’s ability to perform the promised service dependably and accurately; responsiveness, reflecting the willingness of employees to assist customers and provide prompt service; assurance, encompassing the knowledge and courtesy of employees and their ability to inspire trust and confidence; and empathy, which captures the individualized attention and care provided to each customer.
Together, these dimensions form the foundation for evaluating the gap between customer expectations and perceptions, serving as a diagnostic tool for improving overall service performance. These dimensions make it possible to measure the GAP between expectations (E) and perceptions (P), where service quality is expressed as Q = P − E. Negative values indicate that expectations exceed perceptions (service failure), while positive values show that the service exceeds expectations.
Due to its simplicity, flexibility, and applicability, the SERVQUAL model has been widely used across sectors, including hospitality, healthcare, higher education, transportation, and particularly telecommunications, where service quality perceptions are strongly shaped by technical reliability, responsiveness, and customer support. Recent applications of SERVQUAL in internet and telecom services confirm that customers systematically report higher expectations than perceptions, especially in terms of reliability and responsiveness, reinforcing the model’s diagnostic power for net-work-based services (Salem & Kiss, 2023; Sravanthi, 2024).
2.2. Service Quality in the Telecommunications Sector
The telecommunications sector is one of the most dynamic and strategic industries in the modern economy, playing a central role in digital transformation and global connectivity. Since Alexander Graham Bell’s invention of the telephone in 1877 and the early telephone experiments in Portugal by Edison Gower Bell—later transferred to the Anglo-Portuguese Telephone Company—the sector has been characterized by constant innovation and technological evolution (Santos, 1998).
The first official telephone connection between Lisbon and Porto was established in 1904, and by 1936, the first value-added services had emerged, including the transmission of sporting and cultural events, wake-up calls, and time announcement services (Santos, 1998). Since then, telecommunications in Portugal have experienced remarkable growth, accompanied by rapid digitalization of services and technological infrastructure expansion (Mazzoni et al., 2007).
According to Eurostat (2023), internet access in Portugal rose significantly over the last two decades—from 51.5% of the population in 2010 to 85.8% in 2023. This growth reflects the integration of information and communication technologies (ICT) into daily life and the essential role of telecommunications in the economy, education, work, and leisure.
As reported by ANACOM (2025), by July 2022, there were 13.8 million subscribers to electronic communication services in Portugal. Approximately 93% of households had some form of fixed service, 73.1% subscribed to individual services (mainly mobile telephony and broadband), and 26.9% opted for bundled packages (typically triple- or quadruple-play). These figures demonstrate the massive penetration of the sector and its importance in Portugal’s socio-economic structure.
More recent market outlooks forecast further growth of the Portuguese telecom market driven by 5G deployment, fibre rollout and increasing demand for convergent packages, which intensify competitive pressure on service quality and customer experience (ANACOM, 2025). In this environment, even small deteriorations in perceived service quality can translate into churn, lower average revenue per user and a weakening of operators’ organizational performance indicators, particularly in highly competitive segments such as mobile and broadband.
In a highly connected society, characterized by accelerated digitalization and constant technological innovation, the quality of telecommunications services has become a critical success factor. Exponential growth in data demand, the need for instant responses, and intense competition among operators present major challenges to maintaining service quality and ensuring customer satisfaction (Keramati, 2011).
Within this context, customer satisfaction emerges as a central indicator of performance and sustainability. Consumers expect reliable, fast, and personalized services, valuing both technical quality (e.g., network speed and coverage) and functional quality (e.g., customer service, problem-solving, billing transparency). The balance between these dimensions determines overall service quality perception and, consequently, customer loyalty.
Continuous assessment of customer satisfaction thus becomes an essential strategic tool. Studies by Parasuraman et al. (1988) and Zeithaml et al. (2017) demonstrate that perceived service failures directly impact repurchase intentions and word-of-mouth recommendations. In telecommunications, where price differentiation is limited, perceived quality constitutes a sustainable competitive advantage. Empirical evidence in telecom markets shows that higher perceived service quality is positively associated with customer satisfaction and, through satisfaction, with customer loyalty and related behavioral intentions, reinforcing the central role of service quality in organizational performance outcomes (Suchanek & Bucicova, 2025; Abdullah et al., 2022).
The SERVQUAL model, by identifying gaps between perceptions and expectations, provides a solid basis for strategic and operational improvements. Measuring reliability failures (e.g., service interruptions) or responsiveness issues (e.g., support delays) enables companies to prioritize investments and enhance the overall customer experience. Studies applying SERVQUAL to mobile and internet services consistently reveal the largest gaps in reliability and responsiveness, indicating that timely problem resolution, network availability, and responsiveness of customer service are decisive levers for improving performance in telecom settings (Salem & Kiss, 2023; Sravanthi, 2024).
Furthermore, the relationship between quality and satisfaction is mediated by sociodemographic variables such as age, gender, and education level. Empirical studies indicate that women tend to report higher satisfaction and closer alignment between expectations and perceptions, while middle-aged customers exhibit higher demands in reliability and tangibility (Melia, 2014). These differences reinforce the importance of segmentation and service personalization strategies.
In the Portuguese context, telecommunications providers face significant challenges concerning perceived quality, particularly in reliability and responsiveness—dimensions critical to customer retention. The SERVQUAL study conducted in northern Portugal, based on 119 valid survey responses, revealed an average gap of 0.97 points between expectations (6.51) and perceptions (5.54). The largest gaps were found in reliability and responsiveness, highlighting weaknesses in timely problem-solving and deadline adherence. Conversely, tangibility showed the smallest discrepancy, reflecting satisfaction with physical and visual aspects of service delivery.
These results corroborate international findings, which identify reliability and responsiveness as central determinants of satisfaction in the telecommunications sector (Najafi et al., 2015; Zeithaml et al., 2017). Improvements in these areas not only reduce complaints but also enhance consumer trust and loyalty.
In addition, Portuguese operators compete not only on price and technological coverage but also on recognized service quality and customer experience, as documented by independent evaluations such as Opensignal performance reports and customer satisfaction indices, where distinctions for “best customer service” and superior network experience reinforce the strategic importance of service quality for corporate reputation and market share (NOS, 2021).
2.3. SERVQUAL as a Framework for Service Quality Management Versus ISO 9001
Although ISO 9001 is globally recognized as a reference standard for quality management systems, it was originally designed as a generic, process-oriented framework, focusing on documentation, standardization of procedures, and continuous improvement rather than on directly measuring customers’ perceived service quality (QMS UK, 2024). In the telecommunications industry, ISO 9001 certification can help streamline operations, reduce variability, and support regulatory compliance, but it does not, by itself, provide a granular diagnostic of gaps between expected and perceived service from the customer’s viewpoint (Pacific Cert, 2025).
By contrast, SERVQUAL is explicitly grounded in service marketing and consumer behavior, conceptualizing service quality as the gap between expectations and perceptions across five dimensions (tangibles, reliability, responsiveness, assurance and empathy) and has been repeatedly validated in telecom settings (Parasuraman et al., 1988; Mehta & Sharma, 2024). These expectations–perceptions structure aligns closely with how Portuguese telecom customers experience network reliability, responsiveness of technical support, competence and courtesy of staff, personalized attention, and the quality of physical and digital interfaces, making SERVQUAL a more sensitive framework for assessing and managing service quality than ISO 9001.
Empirical work in mobile and internet services demonstrates that SERVQUAL scores in reliability and responsiveness are strong predictors of satisfaction, loyalty, and recommendation intentions, providing clear guidance for managerial action, such as prioritizing investments in network quality, response times, and first contact resolution (Salem & Kiss, 2023; Mehta & Sharma, 2024). ISO 9001 can therefore be seen as complementary to SERVQUAL in Portuguese telecommunications: while ISO 9001 structures internal processes and governance, SERVQUAL captures the external, customer-perceived outcomes of those processes, allowing organizations to link internal quality management practices to concrete performance indicators such as churn and customer satisfaction indices.
2.4. The Standardization of Quality: NP, EN and ISO 9001:2015
According to the NP EN ISO 9001:2015 standard, adopting a quality management system is a strategic decision that can help organizations improve their overall performance and create a solid foundation for long-term sustainability. Quality management cannot be addressed without considering the standards and benchmarks that underpin it.
One of the most widely recognized systems worldwide is ISO 9001, derived from the British BS 5750 standard, created during World War II. In 1987, ISO introduced the first global standard for quality management—ISO 9000:1987 (Pires, 2007). These standards emerged in response to the need to ensure the reliability and efficiency of complex systems, particularly in strategic industrial sectors.
The ISO 9001 standard promotes transparency, reduces complexity, and enhances decision-making reliability (Goetz, 2022). Since its creation, it has undergone four major revisions—in 1994, 2000, 2008, and 2015—each reflecting the evolution of management practices and the demands of the global market.
The 1994 version retained the focus on quality assurance but expanded the concept to include Quality Management Systems (QMS). In 2000, ISO 9001 became consolidated, introducing process-based management and the PDCA (Plan–Do–Check–Act) cycle, as well as eight quality management principles. The 2008 revision simplified the language, emphasized preventive action, and explicitly included both “goods and services.” Finally, the ISO 9001:2015 revision integrated risk management and a new high-level structure, consolidating seven key principles of quality (Wicher et al., 2018).
The ISO 9000 family consists of a set of technical standards and guiding documents (APCER, 2015): ISO 9000:2015—Fundamentals and vocabulary; ISO 9001:2015—Quality management system requirements; ISO 9004:2009—Managing for the sustained success of an organization; ISO/TS 9002:2016—Guidelines for the application of ISO 9001:2015.
With over one million certificates issued in 189 countries, ISO 9001 is the most widely adopted quality management standard worldwide (Goetz, 2022). Within the ISO 9000 family, there is a strong emphasis on the focus of customer focus and continuous improvement.
According to APCER (2015), the benefits of implementing ISO 9001 include: increased customer confidence through robust quality control processes; effective complaint resolution, ensuring rapid and adequate responses; process improvement through the identification and elimination of inefficiencies; continuous optimization via regular audits and reviews that sustain organizational competitiveness.
For Portuguese telecommunications operators, these benefits translate into more consistent provisioning processes, standardized fault management and clearer escalation procedures; however, only customer-oriented instruments such as SERVQUAL can determine whether these ISO driven improvements are actually reflected in higher perceived service quality and stronger customer satisfaction and loyalty outcomes.
2.5. Conceptual Framework
This study is grounded in a conceptual framework that articulates the relationships among governance practices, service quality dimensions, and organizational performance, with sociodemographic characteristics serving as moderating variables (Figure 1).
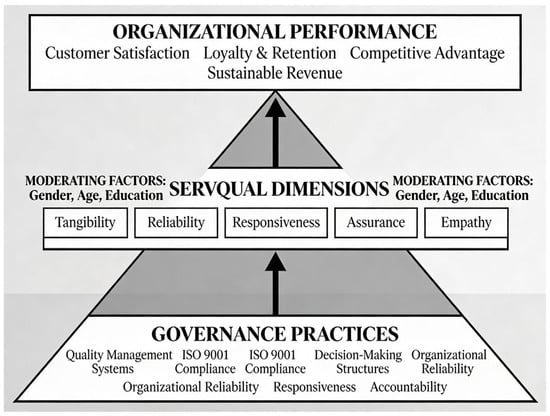
Figure 1.
Conceptual Framework—Governance Practices, SERVQUAL Dimensions, and Organizational Performance with Sociodemographic Moderators. Source: Authors’ own elaboration.
Level 1: Antecedents (Governance Practices)—At the foundational level, organizational governance comprises both formal systems (quality management protocols, ISO 9001 compliance, structured decision-making processes) and informal capabilities (operational reliability, customer responsiveness, organizational transparency). These governance practices establish the administrative infrastructure within which service delivery occurs. In telecommunications, governance effectiveness determines whether the organization possesses the necessary administrative capacity, monitoring systems, and accountability mechanisms to ensure consistent, reliable service delivery.
Level 2: Quality Perception Mechanisms (SERVQUAL Dimensions)—The five SERVQUAL dimensions operate as measurable expressions of how governance practices manifest in customer experience. Tangibility reflects governance investment in service infrastructure; Reliability reflects governance capacity for process standardization and service consistency; Responsiveness reflects governance structures for complaint management and employee empowerment; Assurance reflects governance investment in employee training and organizational credibility; and Empathy reflects governance orientation toward customer-centric organizational culture. The gaps between customer expectations and perceptions for each dimension reveal specific areas where organizational governance falls short.
Level 3: Outcomes (Organizational Performance)—Service quality perceptions directly influence organizational performance through customer satisfaction, loyalty and retention, competitive advantage, and sustainable revenue. In the mature, competitive Portuguese telecommunications market, perceived service quality has become the primary non-price lever for competitive differentiation.
Moderating Factors: Sociodemographic Characteristics—Sociodemographic variables (gender, age, educational level) moderate the strength and nature of relationships within this framework by influencing the magnitude of expectation-perception gaps and the relative importance of different SERVQUAL dimensions across demographic segments.
Based on the conceptual framework presented in Section 2.5, this study applies the SERVQUAL model to assess service quality in Portuguese telecommunications. Specifically, it seeks to (1) measure the degree of discrepancy between customer expectations and perceptions across the five SERVQUAL dimensions; (2) identify which dimensions present the largest gaps; (3) analyze how sociodemographic variables (gender, age, and education) influence these perception-expectation discrepancies; and (4) provide actionable recommendations for quality improvement.
The relevance of this study lies in its empirical application within the Portuguese telecommunications sector—a mature, highly competitive market where service quality has emerged as the primary non-price lever for competitive differentiation. By linking governance capacity directly to customer-perceived quality outcomes across demographic segments, this research contributes to evidence-based quality strategies for organizational performance improvement.
2.6. Research Positioning and Literature Gaps
The present study contributes to the literature by integrating three previously disconnected research streams: (1) SERVQUAL methodology in telecommunications; (2) governance’s role in service quality delivery; and (3) sociodemographic variations in service perception gaps. While SERVQUAL has been extensively applied in telecom contexts internationally (Salem & Kiss, 2023; Sravanthi, 2024; Mehta & Sharma, 2024), empirical documentation of service quality gaps within the Portuguese telecommunications sector remains sparse. Similarly, the governance-quality linkage has been theoretically established (Owusu-Kyei et al., 2023; Wicher et al., 2018) and empirically demonstrated in cross-sector contexts (Abd-Elrahman & Ahmed Kamal, 2022), yet few studies operationalize this relationship using SERVQUAL measurement in technology-intensive sectors.
Furthermore, while demographic moderation of service perceptions has been documented in other service industries (Yousapronpaiboon, 2014; Ismailova et al., 2025; Melia, 2014), telecommunications-specific evidence on how gender, age, and education jointly moderate expectation-perception gaps is absent from the literature. Consequently, this study addresses a critical gap by providing the first empirical application of governance-integrated SERVQUAL analysis in the Portuguese telecommunications context, with explicit examination of sociodemographic moderation effects.
3. Methods
3.1. Participants and Procedure
A total of 119 valid responses were collected for this study. The target population included residents of northern Portugal who subscribed to at least one telecommunication service, such as internet, mobile, or bundled packages. A convenience sampling method was used, selecting participants based on accessibility and willingness to participate rather than random selection.
Data were gathered through an online questionnaire created with Google Forms and distributed via social media and email. The questionnaire began with an introductory section outlining the objectives and purpose of the study and included items collecting sociodemographic data, namely gender (male, female, other), age (<30, [30–40], [40–50], and ≥50), and educational level (2nd cycle, 3rd cycle, secondary, bachelor’s, and master’s degree).
Data collection took place between April and October 2024. Although this non-probabilistic sampling approach enabled efficient data collection and wide dissemination, it may limit the generalizability of the findings to the broader population of telecommunication service users in Portugal.
3.2. Measures
The questionnaire used in this study was based on the SERVQUAL model, designed to assess service quality in telecommunication companies operating in Portugal. As the SERVQUAL instrument has been extensively validated across various sectors, including telecommunications, this study adopted the version proposed by Parasuraman et al. (1988). This version closely aligns with the aims of the present research, as the SERVQUAL model has been repeatedly tested and refined within the telecommunications sector. Consequently, its use ensures a robust and contextually appropriate tool for capturing the specific characteristics of service quality in this industry.
The SERVQUAL instrument comprises five dimensions: tangibles, reliability, responsiveness, assurance, and empathy, and includes a total of 44 items, divided into two main sections. The first section (22 items) assesses customers’ expectations regarding an ideal telecommunication service, whereas the second (22 items) measures their perceptions of the service offered by their current provider.
All items were rated on a seven-point Likert scale ranging from 1 (strongly disagree) to 7 (strongly agree). Service quality gaps were calculated by comparing perception and expectation scores for each dimension, in line with the original SERVQUAL framework.
Parasuraman et al. (1988) reported Cronbach’s alpha coefficients for the SERVQUAL dimensions ranging from approximately 0.74 to 0.85, supporting the instrument’s validity and reliability in measuring service quality perceptions.
3.3. Statistical Analysis
Sociodemographic data were summarized using means and standard deviations for continuous variables, and frequencies and percentages for categorical variables. The normality of the data distribution was assessed using the Kolmogorov–Smirnov and Shapiro–Wilk tests. When the assumption of normality was not met, nonparametric tests were applied. Specifically, the Mann–Whitney U test and the Kruskal–Wallis test were used to compare independent groups, whereas the Wilcoxon signed-rank test was employed to analyze paired data, such as differences between expectation and perception scores across the SERVQUAL dimensions. The internal consistency of the SERVQUAL dimensions and the customer satisfaction scale was evaluated using Cronbach’s alpha coefficients, confirming that all measurement instruments demonstrated satisfactory reliability for subsequent analyses.
All statistical analyses were performed using IBM SPSS Statistics, version 29.0, with the significance level set at 0.05.
4. Results
4.1. Sample Characterization
The sample consisted of 119 participants, predominantly female (73.9%), with male respondents representing 26.1% of the total. Regarding age distribution, the largest group comprised individuals aged between 40 and 50 years (37.8%), followed by those aged 30 to 40 years (26.9%) and under 30 years (21.0%), while 14.3% were 50 years or older. In terms of educational attainment, most participants held a bachelor’s degree (54.6%), followed by master’s degree holders (22.7%) and those with secondary education (19.3%), indicating a generally high level of education among respondents.
4.2. Reliability and Validity of the SERVQUAL Scale
The reliability of the SERVQUAL scale was assessed across both expectation and perception dimensions measuring service quality in the telecommunications sector. For expectations, Cronbach’s alpha coefficients ranged from 0.63 to 0.77, indicating satisfactory internal consistency. Specifically, reliability values were Tangibility = 0.67, Reliability = 0.63, Responsiveness = 0.70, Assurance = 0.77, and Empathy = 0.73. Regarding perceptions, Cronbach’s alpha values ranged from 0.68 to 0.95, demonstrating strong internal consistency and high reliability. The coefficients for each dimension were Tangibility = 0.68, Reliability = 0.95, Responsiveness = 0.91, Assurance = 0.89, and Empathy = 0.92. The findings confirm the psychometric robustness of the SERVQUAL instrument, validating its use for assessing both perceived and expected service quality within the telecommunications context (Maroco et al., 2016).
4.3. Service Quality Assessment—Expectation vs. Perceptions
The analysis of service quality across the five SERVQUAL dimensions (Table 1) revealed consistently negative GAP scores, indicating that customer perceptions were lower than expectations in all areas. All differences were statistically significant (p < 0.001), confirming the robustness of these findings. The largest discrepancy was observed in the reliability dimension (GAP = −1.42; p < 0.001), followed by responsiveness (GAP = −1.18; p < 0.001) and assurance (GAP = −1.05; p < 0.001), suggesting that customers perceive notable shortcomings in the consistency and promptness of service delivery, as well as in the confidence conveyed by providers. In contrast, the tangibility dimension showed the smallest GAP (−0.37; p < 0.001), indicating greater satisfaction with the physical aspects of service provision, such as facilities, equipment, and staff appearance. The global mean GAP value (−0.98; p < 0.001) further reinforces that, overall, expectations systematically exceeded perceptions, highlighting the need for strategic improvements—particularly in reliability and responsiveness—to enhance perceived service quality in the telecommunications sector.

Table 1.
Mean scores of perceived service quality and GAP analysis by dimension: Wilcoxon test.
As Teas (1994) suggests, expectations tend to be higher in the context of SERVQUAL, as this service quality evaluation model relies on factors that directly influence the customer’s perception of excellence. In the telecommunications sector, additional factors can shape expectations, including the essential nature of these services in daily life, which makes customers more demanding regarding quality and reliability; marketing and promotional claims by operators, which raise expectations by presenting services as fast, efficient, and innovative; and high market competition, which leads customers to anticipate superior performance from each company, assuming that all should outperform their rivals.
The analysis of Figure 2 demonstrates a consistent pattern in which customer expectations exceed perceptions across all items representing the five SERVQUAL dimensions: tangibles (Q1–Q4), reliability (Q5–Q9), responsiveness (Q10–Q13), assurance (Q14–Q17), and empathy (Q18–Q22). This consistent gap confirms the presence of a service quality discrepancy, indicating that perceived service levels fall short of expectations within the telecommunications sector. The only exception is item Q3, which addresses the employees’ neat and professional appearance; for this item, perceived service slightly surpasses expectations. This finding suggests that customers may assign less importance to aesthetic aspects of personnel, instead prioritizing attributes such as efficiency, competence, and problem-solving abilities when evaluating overall service quality.
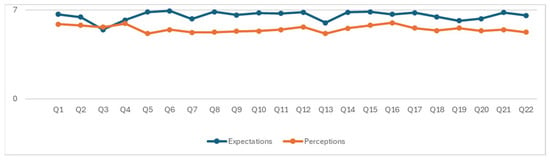
Figure 2.
Comparison of Customer Expectations and Perceptions Across SERVQUAL Items. Source: Authors’ own elaboration.
4.4. Service Quality by Sociodemographic Characteristics and Telecommunication Company Types
The analysis of service quality perceptions and expectations across gender revealed several noteworthy differences (Table 2). Regarding perceptions, no statistically significant differences were found between male and female respondents in most SERVQUAL dimensions, except for assurance (p = 0.018), where females reported slightly higher perceived quality (5.87 vs. 5.31). In contrast, expectations differed significantly across nearly all dimensions, indicating that females consistently held higher expectations than males. Specifically, statistically significant gender differences were observed in tangibility (6.19 vs. 6.15; p = 0.023), reliability (6.70 vs. 6.66; p = 0.002), responsiveness (6.59 vs. 6.58; p = 0.015), assurance (6.82 vs. 6.64; p = 0.021), and empathy (6.52 vs. 6.25; p = 0.003). Overall, while males and females perceive the quality of telecommunication services similarly, females tend to have higher performance expectations, particularly regarding reliability, assurance, and empathy. Interestingly, females’ perceptions generally align more closely with their expectations, suggesting a relatively higher level of satisfaction with services provided by telecommunication companies.
Table 2.
Results for SERVQUAL Dimensions by Gender: Mean, Standard Deviation, and Mann–Whitney Test for Expectations and Perceptions.
In addition to the differences observed in perceptions and expectations, the analysis of GAP scores (Table 3) further indicates that both genders exhibit significant differences between expectations and perceptions across all SERVQUAL dimensions. However, the GAP values are consistently larger among male respondents, suggesting that males perceive a greater discrepancy between their expectations and the actual performance of telecommunication services compared to females. This pattern may reflect differences in levels of demand or sensitivity toward service quality between genders. These findings highlight the need for gender-tailored strategies aimed at reducing perceived service quality gaps, particularly in the dimensions of reliability and empathy, where disparities are most pronounced.
Table 3.
Mean scores of perceived service quality and GAP analysis by dimension and gender: Wilcoxon test.
The results presented in Table 4 indicate statistically significant differences in the Tangibility (p = 0.001) and Reliability (p = 0.01) dimensions. Based on the multiple comparison tests, it was found that, in the Tangibility dimension (expectations), individuals aged [40–50] years reported significantly higher mean values compared to those under 30 years (6.50 vs. 5.90; p = 0.004) and to those aged [30–40] years (6.50 vs. 5.96; p = 0.011). Similarly, the multiple comparison tests revealed significant differences in the Reliability dimension, where participants aged [40–50] years exhibited significantly higher expectation scores than those under 30 years (6.80 vs. 6.58; p = 0.008).
Table 4.
Results for SERVQUAL Dimensions by Age: Mean, Standard Deviation, and Kruskal–Wallis Test for Expectations and Perceptions.
Overall, the [40–50] age group displays the highest expectations regarding service quality, reflecting greater demand and sensitivity toward tangible and reliable aspects of service delivery—possibly associated with higher levels of consumer experience and professional or personal responsibilities. In contrast, younger participants show more moderate expectations, which may stem from their ongoing development of service reference standards, greater tolerance for service shortcomings, and differing needs compared to older age groups.
In the analysis of service quality gaps (GAPs) by age group (Table 5), Tangibility is the only dimension that does not show statistically significant differences among the age groups (<30 years and [40–50]), indicating a greater alignment between expectations and perceptions across these segments. This suggests that tangible aspects of the service are perceived with similar consistency, regardless of age.
Table 5.
Mean scores of perceived service quality and GAP analysis by dimension and age: Wilcoxon test.
In contrast, all other dimensions exhibit statistically significant differences, indicating discrepancies between what customers expect and what they perceive. These differences highlight critical areas that require improvement to better align service performance with customer expectations.
Notably, the age group [30–40] displays the largest GAPs across all dimensions, particularly in Reliability and Empathy, suggesting that customers in this range perceive a greater distance between their expectations and the actual service delivered. Conversely, individuals aged 50 years or older show smaller GAPs, reflecting a closer alignment between perceived performance and expectations, especially in Tangibility.
Across all age groups, Reliability and Responsiveness emerge as the dimensions with the largest overall GAPs, emphasizing the need for targeted strategies to enhance these aspects of service quality. This analysis underscores the importance of adapting service improvement initiatives to the specific expectations and experiences of different age segments, in order to enhance satisfaction and reduce perceived discrepancies.
Table 6 shows no statistically significant differences across educational levels for all dimensions analyzed, indicating a largely homogeneous perception and expectation of service quality among clients. Notwithstanding, clients with up to secondary education tend to exhibit slightly higher expectations, possibly reflecting elevated service demands. Conversely, those with higher academic qualifications—bachelor’s or master’s degrees—display more moderate expectations, likely due to a refined understanding of service capabilities and realistic evaluation criteria.
Table 6.
Results for SERVQUAL Dimensions by Education Level: Mean, Standard Deviation, and Kruskal–Wallis Test for Expectations and Perceptions.
Analysis of service quality gaps (GAPs) reveals education as a relevant factor (Table 7), with higher-educated individuals, particularly master’s holders, exhibiting larger GAPs, indicative of higher standards and critical assessments. In contrast, clients with lower educational attainment demonstrate smaller discrepancies, suggesting a more lenient service evaluation. These findings underscore the necessity of customizing quality management and communication strategies to align with customers’ educational profiles, thereby enhancing satisfaction and minimizing perceived service gaps.
Table 7.
Mean scores of perceived service quality and GAP analysis by dimension and education level: Wilcoxon test.
5. Discussion
The main objective of this study was to apply the SERVQUAL model to evaluate service quality among Portuguese telecommunications companies in northern Portugal and to assess customers’ perceptions and expectations of these services. This approach made it possible to identify discrepancies between customer expectations and perceptions of service quality attributes, aligning with recent theoretical frameworks that emphasize the importance of measuring service gaps to enhance customer satisfaction (Alnsour et al., 2014; Cezar et al., 2023).
The application of the SERVQUAL model proved essential for identifying gaps between customer expectations and perceptions, offering companies valuable insights into consumer needs and preferences. This analysis provides meaningful guidance for continuous service improvement, allowing telecommunications companies to align their quality standards more effectively with customer expectations, thereby enhancing competitiveness, satisfaction, and loyalty (Hussain et al., 2019). By targeting dimensions with the largest gaps, companies can strategically improve efficiency, reliability, and the overall value of their service delivery.
This study found that the overall perceived quality of telecommunications services had a mean score of 5.54 (on a seven-point scale), whereas customer expectations averaged 6.51. This difference indicates that, despite moderately positive perceptions, there remains substantial potential to narrow the gap between expected and perceived service quality. Reliability and responsiveness showed the largest discrepancies, consistent with findings from similar sectors where operational reliability and promptness strongly influence customer satisfaction (Reis, 2015; Izogo, 2017). Conversely, tangibility (focusing on physical facilities, equipment, personnel, and communication materials) showed the smallest gap, indicating relatively higher satisfaction with the visible aspects of service quality.
Sociodemographic variables such as gender, age, and education significantly influenced customer expectations and perceptions. Women reported higher expectations and perceptions that more closely aligned with those expectations, reflecting greater satisfaction levels. In contrast, men exhibited wider gaps, indicating greater dissatisfaction and reinforcing the need for gender-specific strategies, particularly concerning reliability and empathy (Sousa et al., 2020). Age-group analysis revealed that middle-aged customers (40–49 years) held higher expectations for tangibility and reliability, likely reflecting greater experience and responsibility, compared with younger clients who displayed lower expectations and greater tolerance for service shortcomings (Lima & Magalhães, 2021). Educational attainment also influenced results: clients with lower education levels exhibited higher expectations, whereas those with university degrees provided more moderate and critical evaluations, reflecting a deeper understanding of service limitations (Almomani, 2018).
Reliability consistently emerged as the most critical dimension, displaying the largest negative gap across all operators, particularly concerning the fulfillment of promised deadlines and the effectiveness of problem resolution. Detailed item-level analysis identified key shortcomings in meeting service commitments and in demonstrating genuine engagement when resolving customer problems, highlighting systemic areas that require urgent strategic improvement (Mehta & Sharma, 2024). These findings call for targeted investments in operational reliability, responsiveness, and empathetic customer relations to enhance overall service quality and foster customer loyalty within Portugal’s competitive telecommunications market.
The findings presented reinforce that governance quality and service excellence are inseparable in sustaining organizational performance within technology-intensive industries. In the Portuguese telecommunications sector, the consistency of service delivery, the capacity to respond promptly to customer needs, and the reliability of administrative processes represent not only operational imperatives but also indicators of effective governance. Organizations that embed service quality into their governance frameworks are better equipped to anticipate risks, improve decision-making, and maintain stakeholder trust. The empirical evidence from this study demonstrates that sustained performance depends on aligning internal management systems with the expectations of increasingly demanding and heterogeneous users. This alignment requires the integration of quality monitoring, employee empowerment, and transparent communication into governance structures, transforming service quality into a strategic asset that supports both economic resilience and social legitimacy. These insights set the foundation for the concluding section, which discusses the broader implications of governance and service quality as mutually reinforcing drivers of sustainable competitiveness and organizational excellence.
Theoretical Contributions and Practical Implications
This study makes a valuable contribution to the academic understanding of service quality and governance in technology-intensive sectors, particularly within the Portuguese telecommunications context. By applying the SERVQUAL model, the research extends theoretical insights regarding the alignment between customer expectations and perceptions, highlighting the specific dimensions—reliability, responsiveness, tangibility, assurance, and empathy—that most significantly influence user satisfaction. These findings corroborate and build upon recent empirical evidence showing that service quality dimensions significantly shape customer satisfaction and competitive advantage in the telecommunications industry (Torrão & Teixeira, 2023; Sravanthi, 2024). From a practical standpoint, the results offer actionable guidance for managers, demonstrating the need to prioritize investments in operational reliability, timely responsiveness, and empathetic customer interactions to reduce churn and enhance loyalty (Ribeiro et al., 2024). Moreover, the study illustrates how integrating continuous quality assessment into governance practices can transform service quality from a mere operational metric into a strategic organizational asset, reinforcing competitiveness and customer trust. Recent modeling of customer satisfaction in mobile telecommunications markets further indicates that evolving customer expectations and market dynamics require adaptive and evidence-based governance strategies (Suchanek & Bucicova, 2025).
6. Conclusions
Assessing customer satisfaction has become a fundamental component of governance and quality management in organizations operating in competitive and technology-intensive markets. In the telecommunications sector, where reliability and responsiveness are directly linked to public trust and economic performance, service quality acts as a tangible expression of governance effectiveness. This study examined how governance practices and service quality jointly influence organizational performance in Portuguese telecommunications companies, revealing systematic gaps between customer expectations and perceptions across all dimensions evaluated. Reliability and responsiveness remain the most critical weaknesses, while tangibility stands out as a relative strength, reflecting adequate investment in physical infrastructure and visible service conditions.
The results confirm that, even within a technologically advanced and mature industry, organizational performance continues to depend on governance models capable of ensuring operational reliability and effective communication. The average negative gap of 0.98 points between expectations and perceptions highlights a structural misalignment between what customers expect and what they experience, signaling governance and managerial deficiencies that go beyond technical performance. Bridging this gap requires an integrated administrative approach that reinforces process consistency, employee accountability, and proactive interaction with users, particularly when service disruptions occur.
From a managerial perspective, these findings underline the strategic importance of embedding quality assessment into governance systems. Telecommunications companies should strengthen their internal monitoring mechanisms by incorporating real-time customer feedback tools and predictive analytics capable of identifying service weaknesses before they escalate. Investment in employee training, transparent communication protocols and data-driven decision-making will not only enhance responsiveness and reliability but also contribute to a governance culture grounded in transparency, adaptability and learning. At the same time, the capacity for empathy in customer interaction should be treated as a governance asset, since emotionally intelligent communication can mitigate dissatisfaction and rebuild trust when failures arise.
The sociodemographic analysis reinforces the need for inclusive and differentiated governance practices. Women reported higher satisfaction levels and smaller gaps between expectations and perceptions, whereas men revealed greater discrepancies, suggesting that gender-sensitive approaches to communication and service recovery could improve overall satisfaction. Middle-aged consumers (40–49 years) expressed the highest expectations in terms of reliability and tangibility, likely reflecting greater professional dependence on service stability. Educational level also shaped criticality, with more educated consumers displaying a more evaluative stance and, consequently, higher expectations of governance transparency and accountability. These findings suggest that adaptive, user-centric governance models can strengthen legitimacy and satisfaction across diverse customer profiles.
Beyond its diagnostic contribution, this study demonstrates that quality management frameworks, such as the SERVQUAL approach, can serve as governance tools for continuous learning and performance optimization. Systematically comparing customer expectations and perceptions allows organizations to translate feedback into actionable intelligence that informs strategic planning, innovation and public communication. In doing so, quality management evolves from an operational mechanism into a governance process that supports sustainable competitiveness and institutional credibility.
Future research should explore the causal linkages between governance quality, service excellence and behavioural outcomes such as loyalty, advocacy and willingness to pay for premium services. Longitudinal and comparative studies could extend the analysis to different national or regional contexts, contributing to a more comprehensive understanding of how governance and service quality interact in promoting sustainable economic growth. Furthermore, incorporating digital transformation variables—such as artificial intelligence, automation and data governance—would provide valuable insights into how modern administrative strategies can enhance responsiveness and reliability.
Ultimately, sustained excellence in telecommunications requires more than technological innovation. It demands governance systems that place reliability, responsiveness and empathy at the core of their organizational culture. When these dimensions are embedded in governance frameworks and administrative practice, service quality transcends operational metrics and becomes a strategic source of trust, differentiation and long-term competitive advantage. In this sense, governance and service quality operate not as parallel concerns but as mutually reinforcing foundations of sustainable performance and economic development.
7. Limitations
Although this study collected valuable insights into the usage patterns and perceptions of telecommunication services among users in the North of Portugal, several limitations related to the sampling method should be acknowledged. The study relied on a convenience sample obtained via an online questionnaire distributed through social media and e-mail, which inherently limits the statistical representativeness and generalizability of the findings. Furthermore, the sample exhibits an overrepresentation of women (73.9% compared with approximately 52.8% in the Portuguese population) and of participants with higher education levels (77.3% holding a bachelor’s or master’s degree), factors that may introduce bias in specific perceptions and responses.
Despite these constraints, the sample provides a solid basis for identifying meaningful exploratory trends and relationships across the dimensions of service quality examined in this study, offering valuable insights into the profiles, behaviors, and expectations of telecommunication service users in Portugal. In addition, national data indicate that more than 88% of the population aged 16 to 74 uses digital or telecommunication services, supporting the relevance and appropriateness of the target population defined in this research. Consequently, while the findings should be interpreted with caution regarding their generalizability to the entire Portuguese population, the study nonetheless contributes significant empirical evidence to the understanding of service quality management and customer perceptions in the Portuguese telecommunications sector.
Author Contributions
Conceptualization, N.C., E.V. and B.B.S.; methodology, E.V. and M.J.S.d.F.; validation, M.J.S.d.F. and E.V.; formal analysis, M.J.S.d.F.; investigation, N.C., E.V. and B.B.S.; resources, M.J.S.d.F. and B.B.S.; data curation, E.V.; writing—original draft preparation, N.C.; writing—review and editing, M.J.S.d.F. and E.V.; visualization, M.J.S.d.F.; supervision, M.J.S.d.F., E.V. and B.B.S.; project administration, M.J.S.d.F. All authors have read and agreed to the published version of the manuscript.
Funding
This research received no external funding.
Institutional Review Board Statement
Ethical review and approval were waived for this study due to the use of anonymized survey data collected with informed consent, with no personal or sensitive information being processed. The research was conducted in full compliance with the ethical and legal principles governing the preparation of master’s dissertations at the Polytechnic University of Cávado and Ave.
Informed Consent Statement
Informed consent was obtained from all subjects involved in the study.
Data Availability Statement
The datasets generated and/or analyzed during the current study are not publicly available due to privacy and ethical restrictions but are available from the corresponding authors upon reasonable request.
Acknowledgments
We would like to thank the participants in this study and the reviewers for their valuable contributions.
Conflicts of Interest
The authors declare no conflicts of interest.
References
- Abd-Elrahman, A. E. H., & Ahmed Kamal, J. M. (2022). Relational capital, service quality and organizational performance in the Egyptian telecommunication sector. International Journal of Emerging Markets, 17(1), 299–324. [Google Scholar] [CrossRef]
- Abdullah, N. N., Prabhu, M., & Othman, M. B. (2022). Analysing driving factors of customer satisfaction among telecommunication service providers in Kurdistan region. SAGE Open, 12(2), 1–15. [Google Scholar] [CrossRef]
- Almomani, G. (2018). Measuring service quality and customers satisfaction in the UK mobile telecommunications market using the SERVQUAL instrument [Master’s thesis, University of Lincoln]. [Google Scholar] [CrossRef]
- Alnsour, M. S., Abu Tayeh, B., & Awwad Alzyadat, M. (2014). Using SERVQUAL to assess the quality of service provided by Jordanian telecommunications Sector. International Journal of Commerce and Management, 24(3), 209–218. [Google Scholar] [CrossRef]
- ANACOM. (2025). O sector das comunicações 2024. Documento eletrónico. Autoridade Nacional de Comunicações. Available online: https://www.anacom.pt/streaming/SectorCom2024.pdf?contentId=1809702&field=ATTACHED_FILE (accessed on 20 November 2025).
- António, N., Teixeira, A., & Rosa, Á. (2016). Gestão da qualidade: De Deming ao modelo de excelência da EFQM (2nd ed.). Edições Sílabo. [Google Scholar]
- APCER. (2015). Guia do utilizador ISO 9001:2015. Associação Portuguesa de Certificação. [Google Scholar]
- Cezar, F. V., Zucatto, L. C., Borba, V. T., & Segatto, S. S. (2023). Qualidade do serviço público por meio do modelo SERVQUAL: Uma análise das dissertações e teses brasileiras (2000–2020). Revista de Gestao e Secretariado, 14(12), 21145–21161. [Google Scholar] [CrossRef]
- Deming, E. W. (1982). Out of the crisis. Massachusetts Institute of Technology. [Google Scholar]
- Eurostat. (2023). Digital economy and society statistics—Households and individuals—Statistics explained. Available online: https://ec.europa.eu/eurostat/statistics-explained/index.php?title=Digital_economy_and_society_statistics_-_households_and_individuals (accessed on 20 November 2025).
- Goetz, N. (2022). Acerca da história da ISO 9001—Uma história de sucesso. DQS. Available online: https://www.dqsglobal.com/pt-pt/aprender/blog/a-historia-da-iso-9001-uma-historia-de-sucesso (accessed on 20 November 2025).
- Gonçalves dos Reis, J. C., & Melão, N. F. (2009). Serviço multi-canal: Uma estratégia para o futuro. Gestão e Desenvolvimento, 17–18, 27–49. [Google Scholar]
- Grönroos, C. (1990). Service management and marketing: Managing the moments of truth in service competition. Lexington Books. [Google Scholar]
- Hussain, S. A. I., Baruah, D., Dutta, B., Mandal, U. K., Mondal, S. P., & Nath, T. (2019). Evaluating the impact of service quality on the dynamics of customer satisfaction in the telecommunication industry of Jorhat, Assam. Telecommunication Systems, 71(1), 31–53. [Google Scholar] [CrossRef]
- Ishikawa, K. (1990). Introduction to quality control (3rd ed.). 3A Corporation. [Google Scholar]
- Ismailova, R., Chynybaev, M., Orunbaev, S., Omurov, N., Kalygulova, S., Zhumadilov, A., Isaeva, G., & Sirmbard, S. (2025). A comparative analysis of service quality and student perceptions in Kyrgyzstan’s higher education institutions. Cogent Education, 12(1), 2502202. [Google Scholar] [CrossRef]
- Izogo, E. E. (2017). Customer loyalty in telecom service sector: The role of service quality and customer commitment. The TQM Journal, 29(1), 19–36. [Google Scholar] [CrossRef]
- Keramati, A. A. M. (2011). Identification of customer churn determinants using censored log file data in the Iranian mobile telecommunications service industry. International Journal of Electronic Customer Relationship Management, 5, 111–129. [Google Scholar] [CrossRef]
- Kotler, P. (1992). Administração de marketing. A. S. A., São Paulo. [Google Scholar]
- Kotler, P., & Keller, K. L. (2019). Administração de marketing (15th ed.). Pearson Prentice Hall. [Google Scholar]
- Lima, E. R., & Magalhães, T. C. (2021). Satisfação de clientes com o atendimento bancário. Research, Society and Development, 10(11), e182101118722. [Google Scholar] [CrossRef]
- Maroco, J., Maroco, A. L., Campos, J. A. D. B., & Fredricks, J. A. (2016). University student’s engagement: Development of the University Student Engagement Inventory (USEI). Psicologia: Reflexão e Crítica, 29(1), 21. [Google Scholar] [CrossRef]
- Mazzoni, C., Castaldi, L., & Addeo, F. (2007). Consumer behavior in the Italian mobile telecommunication market. Telecommunications Policy, 31, 632–647. [Google Scholar] [CrossRef]
- Mehta, P., & Sharma, M. (2024). Towards competition policy and regulatory reforms in India. White Paper. CUTS International. [Google Scholar]
- Melia, Y. (2014). The impact of service quality dimensions on customer satisfaction: Workshop insurance partner in Padang City, Indonesia. International Academic Journal of Economics, 1(1), 77–87. Available online: https://iaiest.com/iaj/index.php/IAJE/article/view/IAJE1410008 (accessed on 20 November 2025).
- Moreira, I. (2010). A excelência no atendimento. Lidel. [Google Scholar]
- Najafi, S., Saati, S., & Tavana, M. (2015). Data envelopment analysis in service quality evaluation: An empirical study. Journal of Industrial Engineering International, 11(3), 319–330. [Google Scholar] [CrossRef]
- NOS. (2021). Awards and distinctions. Available online: https://www.nos.pt/pt/institucional/a-nos/o-nosso-adn/reconhecimentos-e-premios#Ano2021 (accessed on 20 November 2025).
- Owusu-Kyei, M., Kong, Y., Akomeah, M. O., & Afriyie, S. O. (2023). Corporate governance and total quality management implementation in the telecom sector, Ghana. International Journal of Research and Innovation in Social Science, 7(2), 141–157. [Google Scholar]
- Pacific Cert. (2025). ISO certification for telecommunication services industry and ISO applicable standards. Pacific Cert. Available online: https://www.pacificcert.com (accessed on 20 November 2025).
- Parasuraman, A., Zeithaml, V. A., & Berry, L. L. (1988). SERVQUAL: A multiple-item scale for measuring consumer perceptions of service quality. Journal of Retailing, 64(1), 12–40. [Google Scholar]
- Parasuraman, A., Zeithaml, V. A., & Berry, L. L. (1990). Guidelines for conducting service quality research. Marketing Research, 2(4), 34–45. [Google Scholar]
- Pires, A. (2007). Qualidade: Sistemas de gestão da qualidade (3rd ed.). Lidel. [Google Scholar]
- QMS UK. (2024). ISO 9001 for service companies. QMS UK. Available online: https://www.qmsuk.com/news/iso-9001-for-service-companies (accessed on 20 November 2025).
- Reis, M., Matias, J. C., Interior, C., Garrido, S., & Lourenço, L. A. (2015). Analyse of Customer Satisfaction in the mobile telecommunications industry: The TQM approach. Tıtulo: TMQ, Techniques, Methodologies and Quality-Nú mero, 6, 92–118. [Google Scholar]
- Ribeiro, H., Barbosa, B., Moreira, A. C., & Rodrigues, R. G. (2024). Determinants of churn in telecommunication services: A systematic literature review. Management Review Quarterly, 74(3), 1327–1364. [Google Scholar] [CrossRef]
- Salem, O., & Kiss, M. (2023). Using the SERVQUAL model to assess service quality of internet service providers: Evidence from Jordan. Oradea Journal of Business and Economics, 8(1), 61–71. [Google Scholar] [CrossRef]
- Santos, R. (1998). História das telecomunicações em Portugal. Available online: https://www.bocc.ubi.pt (accessed on 20 November 2025).
- Sousa, V., Pelissari, A. S., & Mainardes, E. W. (2020). A segmentação de comportamento entre homens e mulheres ainda é relevante? Um estudo sobre a percepção de qualidade de marcas de smartphones. Caderno Profissional de Marketing-UNIMEP, 8(2), 136–155. [Google Scholar]
- Sravanthi, G. (2024). Evaluating customer satisfaction and service quality in select telecom enterprises using SERVQUAL model. South Eastern European Journal of Public Health, 24(S4), 2230–2248. Available online: https://www.seejph.com/index.php/seejph/article/view/6700 (accessed on 20 November 2025).
- Suchanek, P., & Bucicova, N. (2025). The customer satisfaction model in the mobile telecommunications sector after Covid-19 pandemic. PLoS ONE, 20(1), e0317093. [Google Scholar] [CrossRef]
- Teas, R. K. (1994). Expectations as a comparison standard in measuring service quality: An assessment of a reassessment. Journal of Marketing, 58(1), 132–139. [Google Scholar] [CrossRef]
- Torrão, J., & Teixeira, S. (2023). The antecedents of customer satisfaction in the Portuguese telecommunications sector. Sustainability, 15(3), 2778. [Google Scholar] [CrossRef]
- Wicher, E. W., Chaves, S., Campello, M., Machado, F. M., Silveira, F. d., Ortiz, L. C. V., Mello, V. D., Vidolin, A. C., Santos, F. B. d., Jesus, I. N. d., Correa, J. C., Barbosa, T. d. S., Weersma, L. A., Barros, J. L. C., Barros Júnior, E. d. A., Coimbra, D. B., Oliveira, M. d. L. M. C. d., Moser, D. D. N., Amaro, E. S. D. d. M., … Andrade, D. F. (2018). Gestão pela qualidade (Vol. 3). Editora Poisson. [Google Scholar] [CrossRef]
- Yousapronpaiboon, K. (2014). SERVQUAL: Measuring higher education service quality in Thailand. Procedia-Social and Behavioral Sciences, 116, 1088–1095. [Google Scholar] [CrossRef]
- Zeithaml, V. A., Berry, L., & Parasuraman, A. (2017). A excelência em serviços. Saraiva Educação S.A. [Google Scholar]


Disclaimer/Publisher’s Note: The statements, opinions and data contained in all publications are solely those of the individual author(s) and contributor(s) and not of MDPI and/or the editor(s). MDPI and/or the editor(s) disclaim responsibility for any injury to people or property resulting from any ideas, methods, instructions or products referred to in the content. |
© 2026 by the authors. Licensee MDPI, Basel, Switzerland. This article is an open access article distributed under the terms and conditions of the Creative Commons Attribution (CC BY) license.