Abstract
The rapid rise in atmospheric CO2 necessitates strategies for mitigation and valorization. Microalgae offer potential through simultaneous CO2 capture and production of high-value biomolecules. Five Chlorophyta strains (A–E: Micractinium sp., Chlamydomonas sp., Micractinium sp., Chlorococcum sp., and Chlorella vulgaris) were isolated from temperate waters and soils and tested for growth and biochemical responses under controlled nitrogen availability (low: 0.346 g L−1 nitrate; high: 0.6 g L−1 nitrate + ammonia), carbon supply (low: 0.04% CO2; high: 4% CO2), and cultivation systems (batch reactors, fermenters, and varied illumination). Over 14 days, maximum dry biomass was achieved in batch cultivation with CO2 sparging, low nitrogen, and continuous light, ranging from 1.47 g L−1 (strain A) to 2.67 g L−1 (strain D). Biomass composition varied: proteins, 25–45%; carbohydrates, 20–35%; and lipids, 18–28%. Nitrogen limitation promoted lipid accumulation (e.g., strain D: +40%) with concurrent protein decline (−25%). Chlorophyll a/b displayed strain-specific plasticity; high CO2 generally increased chlorophyll, while nitrogen stress reduced it up to 50%. Overall, this study demonstrates that locally adapted Chlorophyta strains can achieve high biomass productivity under CO2 enrichment while allowing for flexible redirection of carbon flux toward lipids, carbohydrates, or pigments through nutrient management. Among the tested isolates, strains D and E emerged as the most promising candidates for integrated CO2 sequestration and biomass production, while strains B, C, and D showed strong potential for biodiesel feedstock; strain A for carbohydrate valorization; and strain E for chlorophyll extraction. Future research should focus on scale-up validation in pilot photobioreactors under continuous operation, optimization of two-stage cultivation strategies for lipid production, integration with industrial CO2 point sources, and strain improvement using modern genomics-assisted breeding and genome-editing technologies. These efforts will support the translation of regional microalgal resources into scalable carbon-capture and bioproduct platforms.
1. Introduction
Global warming is tightly linked to the steady rise in atmospheric carbon dioxide, which has climbed from ~280 ppm in the pre-industrial era to monthly means around 429–430 ppm in May–June 2025—an increase of roughly 50% and the highest levels in the instrumental record. The Mauna Loa record (the Keeling Curve) documents both the long-term rise and the seasonal cycle, with the June 2025 monthly average at 429.61 ppm, up from 426.91 ppm in June 2024; daily means during late July–early August 2025 hovered around 426 ppm. Year-to-year increments have recently exceeded 3 ppm, underscoring the urgency of scalable carbon management solutions [1].
Beyond emission cuts, biological CO2 sequestration is needed to curb near-term growth in atmospheric CO2. Green microalgae (Chlorophyta) are especially attractive because they couple rapid growth with efficient photoautotrophic carbon capture; ~1.5–2.0 kg of CO2 is fixed per 1 kg of algal biomass produced [2,3]. Laboratory and pilot studies report CO2 fixation rates from ~0.07 up to ~1.5 g L−1 day−1 after process optimization, and in some systems, performance is maintained with flue-gas-like CO2 levels (10–15%) without growth inhibition [4]. Collectively, these traits enable algae to function as both carbon sinks and biorefineries for value-added products [5].
To cultivate green microalgae, two production architectures dominate: open systems (e.g., raceway ponds), and closed photobioreactors (PBRs), such as tubular and flat-panel designs. Closed PBRs provide better contamination control and gas-transfer management, while open ponds offer lower CAPEX but greater environmental variability. Recent reviews compare trade-offs in light distribution, mixing, gas delivery, and surface-area-to-volume constraints central to CO2 mass transfer [6]. Critically, strain tolerance to elevated CO2 is often broad: numerous Chlorophyta species can grow at 10–20% CO2, with specific reports of Chlorella sp. growing at 40–100% CO2 (max growth near 10%), and Scenedesmus sp. tolerating up to ~80% CO2 (with highest biomass at 10–20%) [5,7,8]. On the nitrogen side, robust performance under nitrogen-replete and -limited conditions is essential because N management is a lever for productivity vs. product accumulation [9]. Reactor-level studies and meta-analyses tie higher fixation to optimized bubble size/velocity and CO2 loading rates; batch tests have reached ~1.8 g CO2 L−1 d−1 at 15% CO2, indicating that engineering and physiology together set the operating window [10].
Field-proximate deployment benefits from autochthonous (local) strains already adapted to regional temperature, irradiance, water chemistry, and seasonal light regimes, which can reduce startup losses and stabilize output under outdoor variability [11,12]. Reviews of outdoor PBR cultivation emphasize that outdoor adaptation of strains and local climate matching are pivotal for consistent biomass and metabolite yields; phycoprospecting programs routinely isolate indigenous microalgae for lipid/pigment productivity specifically because native taxa outperform non-native lines under site-specific stressors [13,14]. Recent work continued to report high diversity of promising indigenous isolates with desirable product profiles, reinforcing the strategy of “local strains for local bioprocesses” [15].
Microalgal biomass composition is highly plastic. Under nitrogen starvation, many species exhibit lipid increases (often 1.5–2× or more), with concomitant protein declines and shifts in carbohydrates; for example, reports show lipids +139% (Phaeodactylum tricornutum) or carbohydrates +59% (Dunaliella tertiolecta) relative to N-replete controls, and general trends of protein decreasing by ~50% with N limitation [16,17]. Xanthonema hormidioides has been reported to exhibit psychrotolerant growth with enhanced lipid accumulation under N limitation, accompanied by coordinated regulation of photosynthesis- and stress-related metabolic pathways [18]. Monoraphidium sp. SB2 isolated from Taiwanese ponds showed strong growth and lipid production over a broad temperature range and demonstrated the ability to accumulate lipids when cultivated in industrial wastewater [19]. Pigments also respond: chlorophyll frequently drops several-fold, while carotenoids increase ~2× in some Chlorophyta under N stress; in Nannochloropsis, N deprivation drives fatty acids to ~50–60% DW with a sharp chlorophyll reduction [20,21,22]. Light regime interacts with nutrient status: studies indicate continuous light vs. 16:8 light/dark cycles can shift storage compound allocation (e.g., boosting carbohydrates under light/dark at N-limitation in cyanobacteria) and modulate pigment pools—factors to consider when targeting a particular product slant [23,24,25].
Regional Chlorophyta strains, when cultivated under controlled carbon and nitrogen regimes, can serve as highly efficient biofactories for both CO2 mitigation and production of marketable biomolecules. Industrially relevant strains such as Chlorella vulgaris, Scenedesmus sp., and Nannochloropsis gaditana have been shown to thrive under elevated CO2 concentrations (4–8%) and nitrogen limitation, simultaneously enhancing lipid accumulation and carbon sequestration rates. For instance, Chlorella vulgaris and N. gaditana exhibited CO2 fixation rates up to 1.7 g L−1 day−1 in tubular photobioreactors supplemented with high-CO2 gas streams [26]. Similarly, nitrogen-starved Scenedesmus sp. strain R-16 accumulated up to 52% total lipids, demonstrating the strong influence of nutrient stress on metabolic reprogramming and suitability for biodiesel feedstock applications [27]. These studies highlight how manipulating the nitrogen-to-carbon ratio in culture media enables selective enhancement of target biochemical pathways, leading to optimized yields of lipids, proteins, or carbohydrates depending on the strain’s adaptive physiology.
Industrial cultivation of regional Chlorophyta species has further benefited from the integration of photobioreactors and hybrid waste-CO2 systems, allowing for process optimization across different nutrient and carbon conditions. For example, Chlorella and Scenedesmus have been employed in wastewater-fed systems that provide dual benefits of CO2 capture and nutrient recycling while sustaining robust biomass growth [28]. High-CO2 cultivation also promotes chlorophyll and pigment biosynthesis, expanding applications in nutraceutical and pigment-extraction industries [29]. Industrial-scale trials have demonstrated that manipulating carbon supply and nitrogen stress not only enhances product specificity but also supports circular economy models, linking carbon capture, nutrient recovery, and bioresource production [30]. Consequently, regional isolates of Chlorophyta have emerged as prime candidates for integrated biorefineries, where environmental adaptability and biochemical flexibility are harnessed for sustainable CO2 utilization and the generation of high-value bio-based products.
Despite major advances in microalgal strain development worldwide, temperate continental regions of Eastern Europe and Central Russia remain underexplored as reservoirs of industrially relevant microalgal diversity. These regions are characterized by strong seasonal temperature variation, moderate irradiance, and pronounced photoperiod changes, which impose selective pressure for physiological plasticity and stress tolerance. However, only limited data exist on the productivity and biochemical flexibility of indigenous Chlorophyta strains from these ecosystems under CO2-enriched and nitrogen-modulated cultivation conditions relevant to industrial operation [31,32].
In aqueous culture media, inorganic carbon exists as a dynamic carbonate system comprising dissolved CO2, carbonic acid, bicarbonate (HCO3−), and carbonate (CO32−), whose relative proportions are governed by pH, temperature, and CO2 partial pressure. At typical cultivation pH values (6.5–8.5), bicarbonate is the dominant dissolved inorganic carbon species, while free CO2 represents only a minor fraction. Continuous CO2 sparging shifts the equilibrium toward higher CO2 and HCO3− concentrations and maintains carbon-replete conditions through continuous gas–liquid mass transfer [33]. Microalgae can utilize both CO2 and bicarbonate via carbon-concentrating mechanisms, such that effective carbon availability is controlled by the balance between CO2 supply, carbonate buffering, and biological uptake rather than by a fixed carbon pool [34].
The motivation of the present study is therefore to identify and characterize native microalgal strains from temperate Russian ecosystems that are capable of efficient CO2 utilization and high-value biomass production under industrially relevant cultivation regimes.
In the present study, five newly isolated green microalgal strains from the Central European Russia (temperate) region were investigated. It was quantified how nitrogen availability (higher vs. lower N), carbon supply (elevated CO2 vs. ambient), light regime (continuous vs. 16:8 h light/dark), and cultivation format (stirred bioreactor/fermenter vs. static vessels) shape biomass productivity and biochemical composition (proteins, carbohydrates, chlorophyll, and carotenoids). We hypothesized that indigenous Chlorophyta strains isolated from regional waters, soils, and thermal environments exhibit high physiological plasticity and robust productivity under elevated-CO2 and nitrogen-modulated conditions, making them promising candidates for regional carbon-capture and microalgal biorefinery applications. By mapping condition-response surfaces for each strain, we aimed to derive cultivation strategies tailored to production goals, i.e., maximizing biomass, lipids, or pigments, within the realistic operating envelopes. The outcome will be decision rules for scale-up in regional facilities using local strains to meet carbon-capture and bioproduct targets.
2. Materials and Methods
2.1. Microalgal Isolates
The isolation of microalgae was conducted from diverse environmental sources, including springs, agricultural soils, natural lakes, and artificial ponds; additionally, one strain (E) was obtained as a mutant of a lake wild type. Two thermophilic isolates (strains A and E) were acquired from the IPPAS collection of the Microalgae Ecophysiology Group at the K.A. Timiryazev Institute of Plant Physiology (Moscow, Russia). Strain B was isolated from agricultural soil, while strains C and D were obtained from a natural freshwater lake and an artificial pond, respectively. Reservoir samples were collected in dark glass bottles and immediately transported to the laboratory at 6–8 °C. Soil extracts were prepared at a 1:10 ratio (soil to sterile Tamiya medium (Tamiya Incorporated, Shizuoka, Japan) (KNO3 2.5, MgSO4·7H2O 1.25, K2HPO4·3H2O 1.045, Na2EDTA 0.0185, FeSO4·7H2O 0.0045, H3BO3 2.86, MnCl2·4H2O 1.81, ZnSO4·7H2O 0.222, MoO3 0.018, and NH4VO3 0.023 g L−1). For isolation, 5 mL aliquots from liquid samples were inoculated into 50 mL sterile Tamiya medium and cultivated for 14 days at 25 °C under 100 µmol m−2 s−1 with a 16:8 h light/dark cycle and periodic stirring. Purification was performed by plating cultures on 2% Tamiya agar supplemented with antibiotics (levomycetin, 20 µg L−1; cefixime, 100 mg L−1) and the fungicide nystatin (40 µg L−1) [35]. A second purification step involved growth in liquid Tamiya medium containing 0.1 µg L−1 carbendazim, following [36].
2.2. Growth Curves and Temperature Optima
Biomass growth of the isolated microalgae and their temperature optima were evaluated in 50% Tamiya medium. For each strain, 2 mL of inoculum was transferred into 50 mL of medium in triplicate Erlenmeyer flasks. To generate growth curves at 25 °C, cultures were incubated for 14 days under controlled illumination (100 µmol m−2 s−1, 16:8 h light/dark cycle) with periodic manual stirring. Growth was monitored daily by measuring optical density at 680 nm using a 721N VIS spectrophotometer (MEDIORA OY, Helsinki, Finland). To determine the temperature optimum, triplicate flasks of each strain were incubated at different temperatures (15, 20, 25, 30, 35, and 40 °C) for 10 days under the same illumination regime. Optical density was measured once per flask at the end of the incubation period at 680 nm. The specific growth rate (μ, d−1) and the doubling time were calculated from optical density (OD680) data during the exponential growth phase, according to [37]. Biomass productivity was calculated from daily optical density increments using strain-specific OD-to-biomass conversion coefficients derived from final dry biomass concentrations. CO2 fixation rates were estimated using a stoichiometric conversion factor of 1.88 g CO2 per g of algal dry biomass [38].
2.3. Imaging
Morphological characteristics of the isolates were examined with an Axio Scope. A1 binocular microscope (Zeiss, Suzhou, China) at 1000× magnification (100× objective). Dry biomass samples for photographic documentation were prepared as follows. The microalgal cell suspensions were centrifuged at 3700 rpm for 30 min. After supernatant removal, the resulting wet pellet was subjected to freeze-drying for 37 h using a laboratory freeze dryer (BIORUS, Moscow, Russia). The obtained lyophilized biomass was gently homogenized (crushed) to a fine powder and photographed under standardized lighting conditions.
2.4. Identification
Genomic DNA was extracted using a FastDNA Spin Kit for Soil (MP Bio, Shandong, China), following the manufacturer’s protocol, and amplification was carried out in a CFX-96 thermal cycler (Bio-Rad, Singapore) with the following conditions: 95 °C for 3 min; 39 cycles of 95 °C for 15 s, 55 °C for 30 s, and 72 °C for 30 s. Reactions (25 µL) contained 1 µL DNA template, 0.5 µL each of forward and reverse primer (10 µM), 2.5 µL dNTPs (10 µM), 2.5 µL 10× buffer, 2.5 µL MgCl2 (25 µM), 0.2 µL SynTaq polymerase (5 U µL−1), and 15.3 µL ddH2O. Gene-specific primers SS5 (5′-GGTGATCCTGCCAGTAGTCATATGCTTG-3′) and SS3 (5′-GATCCTTCCGCAGGTTCACCTACGGAAACC-3′) were used [39]. PCR products were sequenced by Sanger sequencing using SS5/SS3 primers and the BigDye Terminator v3.1 Cycle Sequencing Kit (Thermo Fisher Scientific, Waltham, MA, USA). Reactions (10 µL) contained 1 µL primer (3.2 pmol), 0.8 µL Ready Reaction Mix, 1.6 µL 5× Sequencing Buffer, 2–5 µL purified PCR product (10–50 ng, depending on fragment size), and nuclease-free water to volume. Direct sequencing data were processed using the MEGA-X software tool (version 10.0.5). Chromatograms were trimmed for quality using the tool’s automated pipeline. The resulting FASTA consensus sequences were manually verified and then used for BLASTN analysis [40]. The identification data are presented in Table S1 in the Supplementary Materials.
2.5. Experiment Design
The five microalgal strains were cultivated under six controlled variants combining reactor type (4l batch vs. fermenter Yocell (Qingdao, China), CO2 supply (ambient 0.04% vs. enriched 4%), nitrogen availability (low 0.346 g L−1 nitrate vs. high 0.6 g L−1 nitrate + ammonia), and light regime (continuous vs. 16:8 h light/dark). High-carbon conditions were simulated using batch reactors with CO2 sparging and continuous illumination, whereas low-carbon, stirred systems were represented by mechanically mixed fermenters operated under 16:8 light–dark cycles (Table 1). Cultures were sparged with an air (variant 0.04%)–CO2 mixture containing 4% (v/v) CO2 (variant 4%) at a flow rate of 0.5 L min−1 (0.125 vvm) through a fine-bubble diffuser. Carbon availability was therefore controlled operationally by inlet CO2 concentration and gas flow rate rather than by a fixed dissolved carbon concentration. The illumination for all the experimental variants was provided using ERA Fito-50 W-Ra90 LED (ERA a.s., Vrané nad Vltavou, Czech Republic) plant growth spotlight (full-spectrum, 50 W, color rendering index Ra ≥ 90) lamps; the lightening regime was either continuous or 16:8 h.

Table 1.
Cultivation variants used in the study.
2.6. Determination of Algal Biomass, and Content of Proteins, Carbohydrates, Lipids, and Chlorophyll a and b
Optical density at 680 nm (OD) was used to indicate microalgae biomass growth. OD was measured using a 721N spectrophotometer (VIS, Shanghai, China). To definitively determine the dry weight (DW), the entire biomass was collected by centrifugation at 3700 rpm for 30 min, and the resulting wet mass from microalgae was dried in a freeze-drying oven for 37 h (BIORUS, RF). The pH of the culture medium was controlled to reach 7 units at the beginning of the cultivations. At the end of the cultivation, it was measured using a pH meter (Anion, Moscow, Russia).
The total contents of pigments, carbohydrates, proteins, and lipids in the dry biomass were analyzed using a modified combined protocol [41]. Briefly, 50 mg of dried algal powder was homogenized in phosphate-buffered saline (PBS, pH 7.4) by three freeze–thaw cycles (−80 °C/37 °C), followed by ultrasonication (20 min, 4 °C) and centrifugation (3700 rpm, 20 min) [42]. The supernatant was used to determine protein content by the Bradford assay and carbohydrates by the anthrone method [43,44]. The pellet was used for lipid analysis by the Folch method and for pigment extraction [44]. Residual debris after lipid extraction was resuspended in 2 mL PBS buffer (pH 7.4), ultrasonicated (20 min), boiled in 0.5 N NaOH (10 min), and analyzed for protein content with Bradford reagent (1:20 dilution).
Carbohydrates were quantified by mixing the diluted sample (1:10) with anthrone–sulfuric acid reagent at a 1:4 ratio. Lipids were extracted with chloroform/methanol (2:1). Pigments were determined spectrophotometrically from chloroform and methanol fractions. For chloroform fractions, 100 µL was mixed with 3.9 mL of 96% ethanol, shaken for 2 min, and incubated in the dark for 5 min, and absorbance was measured at 665 and 649 nm. Chlorophyll a and b concentrations were calculated using Equations (1) and (2) [44,45]:
Ca(chl) = 12.70 × OD665 − 5.2 × OD649
Cb(chl) = 22.43 × OD649 − 7.07 × OD665
Pigments in the methanol fraction were analyzed without dilution, and the absorbance of the extracts was measured at (652, 665 nm) using a spectrophotometer (721N VIS, China). The concentrations of chlorophyll a and b in the methanol fraction were calculated using the following adapted equations, Equations (3) and (4) [25,44]:
Ca(meth) = 16.52 × OD665 − 8.09 × OD652
Cb(meth) = 27.44 × OD652 − 12.17 × OD665
The total concentration of chlorophyll a and b was then determined by the sum of the pigments in the chloroform and methanol fractions, respectively.
2.7. Statistical Analysis
All measurements were carried out in at least three repetitions. The statistical processing of the obtained results was carried out using Microsoft Office Excel 2016 (Redmond, WA, USA). All graphical data contain average values and standard deviations. To assess the significance of differences, the Mann–Whitney test was used at α = 0.05.
3. Results
3.1. Morphological Characterization, Growth Parameters, and Molecular Identification of Algal Isolates
The selection of microalgal strains for industrial and environmental applications requires a detailed understanding of their morphological traits, growth dynamics, and thermal tolerance. These parameters directly determine cultivation stability, productivity, and scalability under controlled and outdoor conditions. Cell morphology influences sedimentation behavior; harvesting efficiency; and compatibility with downstream recovery methods such as flocculation, flotation, or filtration, which are frequently major contributors to process cost and energy demand [46,47].
From an applied perspective, strains with rapid growth, short lag phases, and broad thermal optima are generally preferred for large-scale production because they minimize downtime, increase achievable biomass productivities, and reduce the need for active temperature control. Conversely, strains with narrow thermal ranges or slow growth kinetics may require stricter operational control, increasing process complexity and cost [48,49].
Accordingly, the five isolates were cultivated under standardized laboratory conditions to determine their growth trajectories at 25 °C and to identify their optimal temperature ranges. Morphological examination was performed to document cell size, shape, and colonial organization, which are relevant for biomass recovery strategies such as flocculation, sedimentation, or filtration. The resulting phenotypic profiles form the physiological baseline for interpreting the productivity and biochemical plasticity observed under different nitrogen and CO2 regimes in subsequent experiments.
The key morphological and growth characteristics of the five strains are summarized in Table 2, which presents representative micrographs, growth curves, temperature optima, and dry biomass appearance.
Table 2.
Morphology, dry biomass images, growth characteristics, and temperature optima of isolated strains.
The growth curves of the five isolates exhibited well-defined exponential and stationary phases (Figure S3 in Supplementary Materials). Strains A and B reached the stationary phase within 8 days, strain E on day 9, strain D on day 10, and strain C on day 12, indicating pronounced strain-specific differences in adaptation and division kinetics. Specific growth rates (μ), calculated from the linear region of the semi-logarithmic OD680 curves (days 2–6), ranged from 0.182 (strain E) to 0.267 (strain A) d−1. These values correspond to doubling times between 2.60 (strain A) and 3.82 (strain E). Peak daily growth intensity was estimated from the maximum day-to-day increase in optical density during the exponential phase (Table S2 in the Supplementary Materials). Strains A and E exhibited the highest short-term growth intensities (peak ΔOD ≈ 0.40 OD units d−1), followed by strain C (0.281), strain B (0.255), and strain D (0.140). To express these kinetics in volumetric units, daily OD increments were converted into biomass productivities using a strain-specific OD-DW conversion coefficient. The estimated peak biomass productivities were 0.172 (A), 0.092 (B), 0.148 (C), 0.064 (D), and 0.174 g L−1 d−1 (E) (Table S3, Supplementary Materials). The corresponding peak CO2 fixation rates, calculated using a stoichiometric conversion factor of 1.88 g CO2 per g of dry biomass, were 0.323 (A), 0.172 (B), 0.277 (C), 0.120 (D), and 0.327 g CO2 L−1 d−1 (E) (Table S3, Supplementary Materials).
The temperature optima further differentiated these strains. Strains A and B both tolerated a broad thermal range (20–35 °C), suggesting ecological plasticity and potential robustness under variable cultivation conditions. Similarly, strain C shared this broad range, but with slower growth. By contrast, strain D had a narrow optimum at 24–26 °C, pointing to specialization in cooler environments. Strain E showed a moderate optimum (25–30 °C), intermediate between broad and narrow thermotolerance.
The algal isolates were further identified based on partial 18S rRNA gene sequencing. The identification results are summarized in Table S2 in the Supplementary Materials. According to these data, strain A was identified as Micractinium sp., strain B as Chlamydomonas sp., strain C as Micractinium sp., strain D as Chlorococcum sp., and strain E as Chlorella vulgaris. These taxa have been frequently reported as inhabitants of surface waters in temperate ecosystems [32].
3.2. Microalgal Biomass Accumulation
The five microalgal isolates were cultivated for 14 days under six controlled variants combining reactor type (batch reactor versus fermenter), carbon supply (ambient 0.04% CO2 versus enriched 4% CO2), nitrogen availability (low versus high), and light regime (continuous illumination versus 16:8 h light/dark cycle). Batch cultures were operated with periodic CO2 barbotage and continuous illumination, while fermenter cultures were maintained under constant mechanical mixing and a 16:8 photoperiod without CO2 sparging.
Biomass accumulation differed markedly among cultivation systems and nutrient regimes, demonstrating strong dependence on carbon availability, nitrogen supply, and reactor configuration (Figure 1).
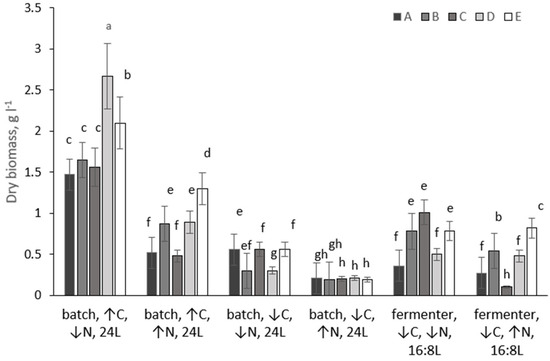
Figure 1.
Biomass yield of microalgal strains (A–E) grown under different conditions over 14 days. Different lowercase letters above bars denote statistically significant differences for each strain (p < 0.05, Mann–Whitney U test). Conditions sharing a common letter within the same strain are not significantly different.
Under CO2-enriched batch conditions (4% CO2, continuous illumination), all five strains achieved their highest biomass yields when grown at low nitrogen concentration. After 14 days, biomass reached 1.47 g L−1 for strain A, 1.65 g L−1 for strain B, 1.56 g L−1 for strain C, 2.67 g L−1 for strain D, and 2.10 g L−1 for strain E. Increasing nitrogen availability under the same CO2-enriched conditions led to a substantial reduction in biomass accumulation for most strains. Biomass yields declined to 0.52–1.30 g L−1, corresponding to a 2–3-fold decrease relative to low-nitrogen cultures. The strongest inhibitory effect of high nitrogen was observed for strain A, whose biomass decreased by 72% (from 1.47 to 0.52 g L−1), whereas strain E retained a comparatively high biomass concentration of 1.30 g L−1. When batch cultures were operated without CO2 sparging and relied solely on atmospheric carbon (0.04% CO2), biomass accumulation decreased substantially for all strains. Under low-nitrogen conditions, the biomass of strain B declined from 1.65 g L−1 (CO2-sparged) to 0.30 g L−1 (unsparged), representing an almost 5.5-fold reduction. Similar trends were observed for the other strains. At high nitrogen concentration without CO2 sparging, biomass yields converged to approximately 0.20 g L−1 for all strains, indicating that external inorganic carbon supply was essential for sustaining high biomass productivity irrespective of nitrogen availability.
Fermenter cultures operated under constant mechanical mixing and a 16:8 h light/dark regime, and without CO2 sparging-supported intermediate biomass yields compared with batch reactors. Under low-nitrogen conditions, strains B and C reached 0.78 and 1.01 g L−1, respectively, corresponding to 50–65% of their maximum biomass yields obtained in CO2-sparged batch cultures. In contrast, strains A and D produced only 0.36 and 0.50 g L−1 under the same fermenter conditions, confirming pronounced strain-specific responses to reactor configuration and light cycling. At high nitrogen concentration in the fermenter, biomass accumulation was further reduced for all strains, ranging from 0.22 to 0.51 g L−1.
Thus, maximum biomass yields for all five strains were consistently achieved under batch cultivation with CO2 sparging, low nitrogen availability, and continuous illumination. Removal of CO2 sparging led to severe carbon limitation and strong suppression of growth, particularly under high nitrogen conditions. Fermenter operation under a 16:8 photoperiod supported moderate biomass production but did not reach the productivity levels of CO2-enriched batch cultures.
3.3. Protein, Carbohydrate, and Lipid Content in Dry Microalgal Biomass
Across strains A–E, macromolecular composition was strongly condition-dependent and generally lipid-dominated (Table 3).
Table 3.
Macromolecular composition (content of proteins, lipids, and carbohydrates) of microalgal biomass.
Averaged over strains, lipids comprised ~45.0% dry weight (DW) (range 25.0–61.2%), proteins comprised ~18.3% DW (range 14.7–24.2%), and carbohydrates comprised ~19.0% DW (range 8.0–35.5%). Under batch/continuous light with CO2 sparging at 4%, mean compositions were 19.2% protein, 15.3% carbohydrate, and 47.2% lipid at low N, and 17.4%, 14.1%, 40.5% at high N for proteins, carbohydrates, and lipids, respectively. Without CO2 sparging, carbohydrates rose and lipids remained high: 16.4%, 23.7%, and 48.6% (low N); and 17.1%, 28.8%, and 45.6% (high N). In fermenters, means were 20.3%, 16.7%, 45.6% (low N) and 19.2%, 15.3%, 42.5% (high N) for proteins, carbohydrates and lipids respectively.
Nitrogen (high-low) in batch reactors with CO2 sparging shifted composition by −1.84 percentage points (pp) for proteins, −1.21 pp for carbohydrates, and −6.64 pp for lipids, whereas without CO2, it gave +0.73 pp for proteins, +5.07 pp for carbohydrates, and −3.03 pp for lipids. Thus, high N led to a decrease in lipid content, with the largest reductions observed when CO2 was abundant. CO2 sparging (yes–no) in batch reactors reduced carbohydrates markedly (−8.45 pp at low N; −14.73 pp at high N), modestly decreased lipids (−1.46 to −5.07 pp), and slightly increased proteins (+0.23 to +2.80 pp). Comparing fermenter to batch reactors at matched N showed proteins +3.9 pp (low N) and +2.1 pp (high N), carbohydrates −7.0 and −13.6 pp, and lipids −3.0 and −3.1 pp, indicating a shift away from carbohydrate enrichment under the 16:8 regime with stronger mixing.
Maxima were strain-specific. Lipids peaked at 61.2% DW in strain C (batch, low N, high C) and ~59–61% in B and D under fermenter low N. Carbohydrates were highest in batch reactors without CO2 (notably 35.5% in A at high N). Proteins remained comparatively modest across the panel, with the highest values in D (24.2% DW; fermenter, high N) and A (22.9% DW; batch, low N, high C).
3.4. Chlorophyll Content
Across the different cultivation regimes, chlorophyll a concentration ranged from 5.12 to 18.55 mg g−1 DW, while chlorophyll b ranged from 1.85 to 6.01 mg g−1 DW (Figure 2).
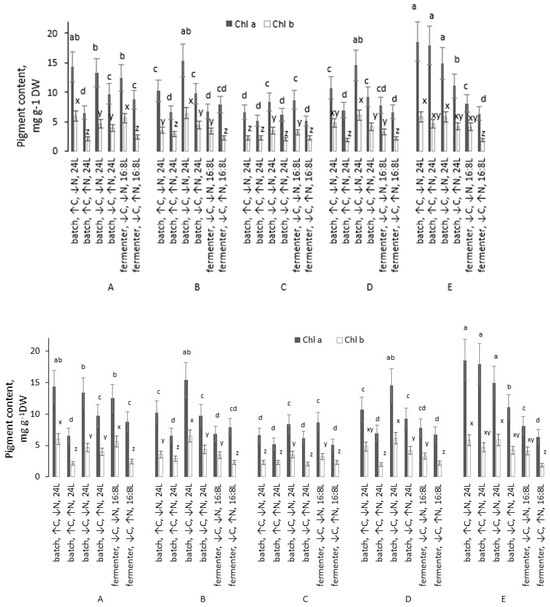
Figure 2.
Chlorophyll a and b content in the dry biomass of microalgal strains grown under different conditions. Different lowercase letters above bars denote statistically significant differences for each strain (p < 0.05, Mann–Whitney U test). Conditions sharing a common letter within the same strain are not significantly different.
In all five strains, the greatest pigment accumulation was achieved in batch cultures under high-C and low-N conditions, where strain E showed the highest chlorophyll a content, and strain A the highest chlorophyll b. For strains A–D, the second-best regime was the batch culture under low C and low N, whereas for strain E, the batch culture under low C and high N also proved highly effective for chlorophyll production.
The total chlorophyll (a + b) content was highest in strain E under favorable conditions, reaching 24.38 mg g−1 DW. This value exceeded the maximum total chlorophyll content of the other strains by 1.1–2.0 times. Transitioning from low to high N led to a decrease in total chlorophyll content in 13 of the 15 strain–condition pairs (by 1.2–2.3 times) and showed no significant effect in the remaining two pairs. These patterns were consistent across replicates: nitrogen limitation generally promoted pigment accumulation, whereas nitrogen sufficiency tended to dilute pigment content per unit biomass.
Fermenter cultivation was less effective for chlorophyll yields in strains D and E (both low and high N), as well as in strain C under low N. In contrast, for strains A and B (both N levels), and strain C under high N, chlorophyll content in the dry biomass did not differ significantly between batch and fermenter cultures at corresponding N levels (p < 0.05).
4. Discussion
4.1. Characteristics of the Isolates
The growth dynamics observed in this study align with known physiological traits of freshwater green microalgae. However, distinct differences between the strains were observed. The time required to reach the stationary phase varied between 8 and 12 days, with Micractinium sp. (A) and Chlamydomonas sp. (B) reaching plateau growth earlier than Chlorococcum sp. (D) and Micractinium sp. (C). This variation reflects strain-specific metabolic adaptation and photosynthetic capacity. Comparable culture durations have been reported for flask-based Chlorella and Scenedesmus strains, which typically attain stationary phase within 7–12 days under moderate illumination (50–150 μmol photons m−2 s−1) and nutrient sufficiency [50,51]. The earlier transition to stationary growth observed in Micractinium strains likely results from their smaller cell size and rapid acclimation to closed-culture conditions. The specific growth rates (μ) and doubling-time values are well within the range reported for common chlorophyte genera cultivated under laboratory conditions: Chlorella vulgaris (μ = 0.18–0.30 d−1), Scenedesmus obliquus (μ = 0.20–0.35 d−1), and Chlamydomonas reinhardtii (μ ≈ 0.20 d−1) [52]. The shorter doubling times of Micractinium sp. (strains A and C) compared to Chlorococcum sp. (strain D) indicate superior photosynthetic efficiency and carbon-assimilation kinetics. In contrast, Chlorococcum sp., a slower-growing alga with thicker cell walls and lower chlorophyll a/b ratios, demonstrated reduced productivity and delayed adaptation, in line with prior observations of this genus under CO2-enriched conditions [38]. Both peak biomass productivity and peak CO2 fixation rates were at the upper range of values reported for flask-based green microalgae cultures grown under similar light and nutrient conditions [50,51,53].
The contrasting strategies observed likely reflect different ecological trade-offs. Slow-growing but thermally resilient strains often allocate more resources to cellular protection and stress tolerance, whereas fast-growing strains prioritize rapid division under favorable conditions. In large-scale systems, these differences translate into distinct operational niches: fast growers are advantageous in controlled photobioreactors, while stress-tolerant strains are often superior in open or minimally controlled environments [47,48]. In terms of future large-scale application, strains with short lag phases and broad thermal optima are better suited to outdoor and semi-outdoor systems, where diel and seasonal temperature fluctuations are unavoidable. Broad thermotolerance reduces the need for active temperature control and increases operational robustness, which is a key determinant of economic feasibility in industrial photobioreactors and raceway ponds. Similar conclusions have been reported for industrial Chlorella and Tetradesmus platforms, where thermal flexibility strongly correlates with stable long-term productivity [49].
4.2. Biomass Yield Patterns
Our findings show that increasing CO2 from ambient (0.04%) to elevated (~4%) strongly enhances biomass accumulation across all strains. This observation aligns with previous studies. Thus, Khan et al. (2022) reported that supplying microalgae with 4% CO2 markedly improved both growth parameters and biomass production, compared to standard atmospheric CO2 (~0.04%) [54]. Similarly, Montoya-Vallejo et al. (2023) highlighted significant microalgal proliferation with CO2 enrichment, emphasizing CO2’s role as a limiting substrate for photosynthetic growth [55]. It was reported before that in dense microalgal cultures, atmospheric CO2 supply is frequently insufficient to meet photosynthetic demand; therefore, additional CO2 supplementation or improved gas transfer should be implemented [56].
Lower nitrogen content often led to higher biomass under CO2-enriched conditions than high-N media. Other authors demonstrated that lower nitrogen inputs can improve biomass yield per unit nitrogen, optimizing resource utilization despite reducing absolute nutrient supply [57]. In addition, the level of nitrogen in the low-N variant used in our study was not critically low; it might be sufficient for particular strains to gain their biomass [58]. In opposite, the presence of ammonia and high-N cultural media could suppress the growth of microalgae [59,60]. In addition to direct ammonium stress, nitrogen form can influence culture performance through acid–base effects. Assimilation of NH4+ is often associated with net proton release and may promote acidification, whereas NO3− assimilation typically consumes protons and can shift pH in the opposite direction; therefore, mixed nitrogen sources may impose pH-related physiological constraints depending on buffering capacity and gas exchange. Similar interactions between nitrogen metabolism and pH dynamics have been reported for phytoplankton and green algae, where ammonium uptake tends to acidify the medium, while nitrate use can elevate pH [61,62]. In our experiments, however, the bulk pH measured at the start and end of cultivation did not change markedly, suggesting that large-scale pH drift was not the dominant reason for reduced biomass in the high-N treatment. Nevertheless, short-term and microscale pH fluctuations near the cell surface or within boundary layers can occur even when bulk pH remains stable, particularly under high photosynthetic activity and CO2 dosing/mixing, and such local conditions may still modulate ammonium tolerance and nutrient uptake kinetics—a phenomenon consistent with microenvironmental pH regulation observed in algal diffusion boundary layers [63].
Fermenter cultures (mechanical mixing, 16:8 light cycle, no CO2 sparging) generally produced lower biomass than batch reactors with continuous light and CO2 enrichment, highlighting the importance of light availability and mass-transfer conditions. Mechanical mixing improves bulk mass transfer but does not compensate for the absence of direct CO2 delivery, leading to diel fluctuations in dissolved inorganic carbon and oxygen accumulation during the light phase, followed by respiratory carbon consumption in the dark. This cyclic metabolism reduces net carbon fixation efficiency relative to continuous illumination. Moreover, strain-specific performance in the fermenter suggests differential tolerance to hydrodynamic shear and mixing intensity, which can affect membrane integrity, photosystem stability, and pigment retention. Some strains (e.g., B and C) maintained relatively high productivity under agitation, whereas others (e.g., A and D) were more sensitive, indicating that reactor design and mixing regime interact with strain physiology and must be considered jointly in process scale-up.
4.3. Composition Shifts in Microalgal Dry Biomass
Elevating CO2 from atmospheric ~0.04% is known to relieve inorganic-carbon limitation, increasing growth rate and altering carbon partitioning. Biomass composition can shift toward proteins when nitrogen is plentiful, or toward neutral lipids when nitrogen is limiting [64]. In our study, batch reactors with 4% CO2 displayed lower carbohydrate fractions and slightly higher protein, consistent with carbon no longer constraining the Calvin cycle and with reallocation away from transient starch. The literature concurs that CO2 enrichment (1–5% and higher) often improves growth and can reshape macromolecular allocation depending on N status and light, though net lipid productivity does not necessarily track percentage lipid when biomass productivity also changes [65].
N limitation or starvation is reported to be the reason of large lipids gains across different microalgae (Chlorella, Scenedesmus/Tetradesmus, and Nannochloropsis) [66,67]. In our study, moving from low to high N decreased lipids content under both CO2 regimes (−3 to −7 pp), matching this pattern. The relatively modest protein gains at high N (and even slight decreases under 4% CO2) indicate that N sufficiency did not push proteins much above ~20% DW; this is not unusual for lipid-prone Chlorophyta grown under bright light and ample carbon [68].
In the fermenters (16:8 h light regime), carbohydrates were lower than in batch reactors without CO2, suggesting that different lightening scenarios influence starch and other carbohydrates synthesis and turnover in the algal cells. Indeed, the literature demonstrates that light–dark cycles channel fixed carbon into transient carbohydrate pools that are subsequently mobilized; metabolic studies in Chlamydomonas/Chlorella link diel starch turnover to downstream lipid/carotenoid fluxes, while reviews emphasize the roles of CO2, light intensity, and photoperiod in partitioning carbon among starch and TAG [10,69,70]. In addition, moving from batch/continuous/low CO2 to fermenter/16:8/low CO2 increased proteins modestly (+2–4 pp) while decreasing both carbohydrates and lipids (~−3 to −14 pp). Two factors can explain this: (i) improved mixing diminishes boundary layers, enhancing CO2/O2 exchange and potentially raising respiratory/maintenance demands that reduce storage fractions; and (ii) diel photoperiod redistributes carbon as transient storage that is then consumed in the dark, limiting its accumulation in bulk carbohydrate or TAG at the 14-day endpoint. Reviews on light regime effects report similar trade-offs between steady protein turnover under continuous light and storage dynamics, with outcomes depending on intensity and N status-consistent with your strain-specific responses [60,70,71]. For chlorophyll, the observed ranges are consistent with published data for freshwater Chlorophyta.
Typically, chlorophyll a levels in Chlorella vulgaris, Scenedesmus obliquus, or Chlamydomonas reinhardtii range from 5 to 15 mg g−1 DW, and chlorophyll b from 2 to 7 mg g−1 DW, depending on nutrient and light regimes [66,72,73]. Our results reinforce the role of nitrogen limitation in upregulating chlorophyll synthesis per unit biomass, likely as a compensatory mechanism to enhance light harvesting when protein synthesis is constrained [74]. High CO2 availability further accentuated chlorophyll accumulation under low N, suggesting that sufficient inorganic carbon supports carbon fixation despite reduced nitrogen metabolism, thus maintaining photosynthetic efficiency [75].
By contrast, under high-N conditions, pigment concentrations decreased, which agrees with reports that fast growth dilutes pigments due to higher cell division rates and reduced chloroplast density [76].
The fermenter results indicate that light regime also plays a role for chlorophyll content. A 16:8 cycle reduced overall pigment content compared with constant illumination in batch cultures, in line with findings that intermittent dark periods decrease chlorophyll biosynthesis while promoting carbohydrate accumulation [77].
4.4. Bioprocess Relevance and Application Outlook of the Isolated Strains
Based on the results presented above, we evaluated the bioprocess relevance and application outlook of the isolated strains under cultivation regimes representative of scalable microalgal production systems. Because each isolate exhibited variable yields of biomass, lipids, proteins, carbohydrates, and chlorophyll across the different cultivation conditions, we compared the highest values achieved by each strain among all tested variants. This approach reflects a realistic bioprocess development strategy, in which strains are selected according to their peak performance under optimized regimes rather than average productivity under suboptimal conditions.
From a bioprocess engineering perspective, the highest biomass yields achieved by strains D (2.67 g L−1) and E (2.10 g L−1) place them within the performance range reported for established production strains such as Chlorella, Scenedesmus, and Nannochloropsis cultivated in closed photobioreactors under CO2 enrichment. [26,78]. Reported laboratory and pilot-scale systems typically achieve 1.5–3.5 g L−1 under optimized aeration, illumination, and nutrient supply, indicating that the regional isolates characterized here fall within performance ranges reported for established large-scale cultivation platforms [79,80]. In particular, the strong response of strain D to CO2 sparging suggests high carbon utilization efficiency, making it well suited for integration with point-source CO2 emitters such as power plants or fermentation industries, where flue gas typically contains 5–15% CO2 [81].
To estimate the industrial potential of the isolates, we compared the highest values of biomass yield, lipids, proteins, carbohydrates, and chlorophyll content, demonstrated by each isolate across tested conditions (Figure 3).
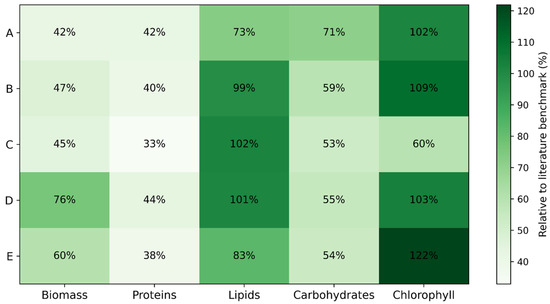
Figure 3.
Heatmap of relative industrial potential of microalgal isolates (A–E) normalized to the literature benchmark maxima.
Beyond biomass productivity, lipid accumulation is a key criterion for biofuel-oriented applications. Strains B, C, and D reached lipid contents about 60% of dry weight under fermenter conditions with low CO2 and low N availability. These results align with the well-known stress-induced lipid accumulation response, whereby nitrogen starvation redirects carbon flux toward triacylglycerol (TAG) synthesis [82]. The observed lipid fractions exceed typical baseline values (20–40%) and are comparable to optimized strains of Nannochloropsis and Chlorella used in biodiesel studies [83,84].
The combination of high biomass accumulation under CO2 enrichment and strong lipid induction under nitrogen limitation suggests that a two-stage cultivation strategy—biomass buildup under nitrogen-replete conditions followed by nitrogen stress—could be applied to these strains, as is commonly implemented in industrial lipid production systems. Protein-rich biomass fractions are of interest for feed, food, and aquaculture applications. Protein-rich biomass fractions are of interest for feed, food, and aquaculture applications. Although the maximum protein contents observed (up to 24.2% DW in strain D) are lower than those reported for some protein-optimized Chlorella platforms (40–55% DW), they are comparable to protein levels typically found in Scenedesmus and Tetradesmus species cultivated under mixed nitrogen regimes (20–30% DW) [85]. From a biorefinery perspective, such protein fractions are particularly valuable as co-products after lipid extraction, supporting cascading use concepts that improve overall process economics and sustainability. Carbohydrate accumulation peaked in strain A (35.5% DW), under high-N conditions without CO2 sparging. This pattern is consistent with reports that starch synthesis is favored under limited carbon supply and active photosynthesis [86]. Carbohydrate levels were generally lower than those seen in specialized starch-producing strains (up to 50% DW), but sufficient for use in bioethanol or bioplastic feedstock production, especially when biomass is abundant. Chlorophyll productivity was dominated by strain E (24.38 mg g−1 DW), slightly higher than many green microalgae, which typically range between 8 and 20 mg g−1 DW [44]. This suggests that strain E could be particularly suited for pigment extraction for nutraceutical or cosmetic applications, or as a photosynthetically efficient candidate for photobioreactor deployment.
To enable a direct comparison of the bioprocess performance of the investigated strains, the experimental maxima for biomass, lipids, proteins, carbohydrates, and chlorophyll were normalized against the representative literature benchmark values, which were taken as 100% (3.5 g L−1 for biomass, 60% DW for lipids, 55% DW for proteins, 50% DW for carbohydrates, and 20 mg g−1 DW for chlorophyll). All experimental values were recalculated as percentages of these reference maxima, providing a dimensionless performance index that allows for objective benchmarking against established industrial platform strains. The resulting literature-normalized heatmap (Figure 3) highlights clear strain-specific production profiles. Strain D reached approximately 76% of the industrial biomass benchmark and exceeded the lipid benchmark (>100%), while strain E exceeded the pigment benchmark (122%) and reached 60% of the biomass benchmark. Strains B and C matched or exceeded the lipid benchmark (99–102%), confirming their strong oleaginous character, whereas proteins and carbohydrates reached moderate but industrially relevant levels (33–44% and 53–71% of benchmark, respectively).
Overall, the heatmap-based evaluation underscores that strain D is the most versatile, excelling in biomass, protein, and lipid categories, while strain E specializes in pigments and biomass yield, and strains B and C maximize lipid content from a bioprocess integration perspective. Moreover, the strains offer complementary roles: strains D and E for large-scale CO2 sequestration and general biomass productivity; strains B, C, and D for biodiesel feedstock; strains A and D for protein-rich feed applications; strain A for carbohydrate-based valorization; and strain E for pigment extraction.
5. Conclusions
The present study demonstrates that local Chlorophyta strains isolated from the Russian temperate zone exhibit considerable potential for deployment in carbon capture and bioproduct-oriented bioprocesses. The strains revealed wide physiological plasticity, ranging from cold-adapted to heat-tolerant profiles, and exhibited highly dynamic shifts in biochemical composition under varying nitrogen and CO2 conditions. These trade-offs indicate that no single cultivation strategy universally maximizes all outputs; instead, optimal pathways depend on aligning the physiological strengths of each strain with the intended production target, whether biomass, proteins, lipids, carbohydrates, or pigments. We identified clear strain-specific production phenotypes, including high-biomass candidates (strains D and E), lipid-specialized strains (B, C, and D), carbohydrate-enriched biomass (strain A), and pigment-rich biomass (strain E). The literature-normalized benchmarking further demonstrated that several isolates already operate within industrially relevant performance windows, particularly with respect to lipid and pigment productivity. Numerous studies show that cultivation conditions strongly affect microalgal growth and metabolism. While most focus on strain-specific stress responses, the present study adopts a comparative, bioprocess-oriented screening approach, evaluating multiple isolates under industrially relevant reactor configurations, carbon supply regimes, and illumination strategies to identify production-specialized strains for integrated microalgal biorefineries.
From a development perspective, the results support a modular biorefinery strategy in which different strains are deployed according to their dominant production traits rather than a single universal production platform. Future research should focus on scale-up validation in pilot photobioreactors under continuous operation, optimization of two-stage cultivation strategies for lipid production, integration with industrial CO2 point sources, and strain improvement using evolutionary adaptation and/or modern genomics-assisted breeding and genome-editing technologies. Such approaches will enable the transition of the most promising isolates toward commercially competitive production systems.
Supplementary Materials
The following supporting information can be downloaded at https://www.mdpi.com/article/10.3390/environments13020073/s1, Figure S1: The cultivation systems used in the study; Figure S2: Photographs of strain E dry biomass cultivated under different processing conditions; Figure S3: Growth curves of the five strains (A–E) cultivated over 14 days (OD680); Table S1: Molecular identification of isolated strains; Table S2: Daily changes in optical density (ΔOD680) of microalgal strains A–E during the 14-day cultivation period; Table S3: Kinetic and productivity parameters of microalgal strains; Table S4: pH values of the nutrient medium on the 14th day of microalgae cultivation.
Author Contributions
Conceptualization, S.S.; methodology, G.G. and P.G.; software, G.G.; validation, S.S., P.G. and G.G.; formal analysis, D.K.; investigation, D.K., M.E.R. and G.G.; resources, S.S.; data curation, G.G. and P.G.; writing—original draft preparation, S.S., P.G. and G.G.; writing—review and editing, S.S., P.G. and G.G.; visualization, G.G. and P.G.; supervision, P.G.; project administration, G.G. and P.G.; funding acquisition, S.S. All authors have read and agreed to the published version of the manuscript.
Funding
This work was funded by the subsidy allocated to Kazan Federal University for the state assignment in the sphere of scientific activities, project No. FZSM-2024-0004.
Data Availability Statement
The original contributions presented in this study are included in the article. Further inquiries can be directed to the corresponding authors.
Conflicts of Interest
The authors declare no conflicts of interest.
Abbreviations
| PPM | parts per million |
| PBR | photobioreactor |
| CAPEX | capital expenditure |
| OD | optical density |
| nm | nanometer |
| PCR | polymerase chain reaction |
| dNTPs | deoxyribonucleotide triphosphates |
| U | units |
| µL | microliter |
| ddH2O | double-distilled water |
| NO3− | nitrate |
| NH4+ | ammonium |
| DW | dry weight |
| PBS | phosphate-buffered saline |
| rpm | revolutions per minute |
| pp | percentage points |
| TAG | triacylglycerol |
| CO2 | carbon dioxide |
| CRediT | Contributor Roles Taxonomy |
| g L−1 | grams per liter |
| mg L−1 | milligrams per liter |
| µg L−1 | micrograms per liter |
| h | hour(s) |
| min | minute(s) |
| s | second(s) |
References
- NOAA Climate.gov. Climate Change: Atmospheric Carbon Dioxide. Available online: https://www.climate.gov/news-features/understanding-climate/climate-change-atmospheric-carbon-dioxide (accessed on 9 September 2025).
- Chisti, Y. Biodiesel from microalgae. Biotechnol. Adv. 2007, 25, 294–306. [Google Scholar] [CrossRef]
- Gayathri, R.; Mahboob, S.; Govindarajan, M.; Al-Ghanim, K.A.; Ahmed, Z.; Al-Mulhm, N.; Vodovnik, M.; Vijayalakshmi, S.; Gayathri, R.; Mahboob, S.; et al. A review on biological carbon sequestration: A sustainable solution for a cleaner air environment, less pollution and lower health risks. J. King Saud Univ. Sci. 2021, 33, 101282. [Google Scholar] [CrossRef]
- de Morais, M.G.; Costa, J.A.V. Biofixation of carbon dioxide by Spirulina sp. and Scenedesmus obliquus cultivated in a three-stage serial tubular photobioreactor. J. Biotechnol. 2007, 129, 439–445. [Google Scholar] [CrossRef] [PubMed]
- Singh, U.B.; Ahluwalia, A.S. Microalgae: A promising tool for carbon sequestration. Mitig. Adapt. Strateg. Glob. Change 2013, 18, 73–95. [Google Scholar] [CrossRef]
- Nwoba, E.G.; Parlevliet, D.A.; Laird, D.W.; Alameh, K.; Moheimani, N.R. Pilot-scale self-cooling microalgal closed photobioreactor for biomass production and electricity generation. Algal Res. 2020, 45, 101731. [Google Scholar] [CrossRef]
- Qin, J.; Jia, M.; Sun, J. Examining the effects of elevated CO2 on the growth kinetics of two microalgae, Skeletonema dohrnii (Bacillariophyceae) and Heterosigma akashiwo (Raphidophyceae). Front. Mar. Sci. 2024, 11, 1347029. [Google Scholar] [CrossRef]
- Wang, H.; Nche-Fambo, F.A.; Yu, Z.; Chen, F. Using microalgal communities for high CO2-tolerant strain selection. Algal Res. 2018, 35, 253–261. [Google Scholar] [CrossRef]
- Truong, T.Q.; Park, Y.J.; Winarto, J.; Huynh, P.K.; Moon, J.; Bin Choi, Y.; Song, D.G.; Koo, S.Y.; Kim, S.M. Understanding the Impact of Nitrogen Availability: A Limiting Factor for Enhancing Fucoxanthin Productivity in Microalgae Cultivation. Mar. Drugs 2024, 22, 93. [Google Scholar] [CrossRef]
- Chunzhuk, E.A.; Grigorenko, A.V.; Kiseleva, S.V.; Chernova, N.I.; Ryndin, K.G.; Kumar, V.; Vlaskin, M.S. The Influence of Elevated CO2 Concentrations on the Growth of Various Microalgae Strains. Plants 2023, 12, 2470. [Google Scholar] [CrossRef]
- Cheregi, O.; Ekendahl, S.; Engelbrektsson, J.; Strömberg, N.; Godhe, A.; Spetea, C. Microalgae biotechnology in Nordic countries—The potential of local strains. Physiol. Plant. 2019, 166, 438. [Google Scholar] [CrossRef]
- Chauton, M.S.; Forbord, S.; Mäkinen, S.; Sarno, A.; Slizyte, R.; Mozuraityte, R.; Standal, I.B.; Skjermo, J. Sustainable resource production for manufacturing bioactives from micro- and macroalgae: Examples from harvesting and cultivation in the Nordic region. Physiol. Plant. 2021, 173, 495–506. [Google Scholar] [CrossRef] [PubMed]
- Pilot Scale Microalgae Cultivation|ScienceDirect. Available online: https://www.sciencedirect.com/book/9780323959629/pilot-scale-microalgae-cultivation (accessed on 10 September 2025).
- Gaurav, K.; Neeti, K.; Singh, R. Microalgae-based biodiesel production and its challenges and future opportunities: A review. Green Technol. Sustain. 2024, 2, 100060. [Google Scholar] [CrossRef]
- Kurpan, D.; Cardeiras, R.; Bagnoud-Velásquez, M.; Dubois, S.; Lecoultre, N.; Gindro, K.; Wahl, F.; Brahier, A.B. Isolation, characterization, and maintenance of native Swiss microalgae for biotechnological prospection. Sci. Rep. 2025, 15, 25573. [Google Scholar] [CrossRef] [PubMed]
- Sajjadi, B.; Chen, W.Y.; Raman, A.A.A.; Ibrahim, S. Microalgae lipid and biomass for biofuel production: A comprehensive review on lipid enhancement strategies and their effects on fatty acid composition. Renew. Sustain. Energy Rev. 2018, 97, 200–232. [Google Scholar] [CrossRef]
- Tibbetts, S.M.; Milley, J.E.; Lall, S.P. Chemical composition and nutritional properties of freshwater and marine microalgal biomass cultured in photobioreactors. J. Appl. Phycol. 2015, 27, 1109–1119. [Google Scholar] [CrossRef]
- Gao, B.; Hong, J.; Chen, J.; Zhang, H.; Hu, R.; Zhang, C. The growth, lipid accumulation and adaptation mechanism in response to variation of temperature and nitrogen supply in psychrotrophic filamentous microalga Xanthonema hormidioides (Xanthophyceae). Biotechnol. Biofuels Bioprod. 2023, 16, 12. [Google Scholar] [CrossRef]
- Wu, L.F.; Chen, P.C.; Lee, C.M. The effects of nitrogen sources and temperature on cell growth and lipid accumulation of microalgae. Int. Biodeterior. Biodegrad. 2013, 85, 506–510. [Google Scholar] [CrossRef]
- Malakootian, M.; Hatami, B.; Dowlatshahi, S.; Rajabizadeh, A. Optimization of culture media for lipid production by Nannochloropsis oculata for Biodiesel production. Environ. Health Eng. Manag. J. 2015, 2, 141–147. [Google Scholar]
- Comparison of Various Growth Media Composition for Physio-Biochemical Parameters of Biodiesel Producing Microalgal Species (Chlorococcum aquaticum, Scenedesmus obliquus, Nannochloropsis oculata and Chlorella pyrenoidosa). Available online: https://www.researchgate.net/publication/353903262_Comparison_of_various_growth_media_composition_for_physio-biochemical_parameters_of_biodiesel_producing_microalgal_species_Chlorococcum_aquaticum_Scenedesmus_obliquus_Nannochloropsis_oculata_and_Chlor (accessed on 10 September 2025).
- Kateryna Maltseva, Y.M.; Maltsev, Y.; Maltseva, K.; Khmelnytskyi, B. Fatty acids of microalgae: Diversity and applications. Rev. Environ. Sci. Bio/Technol. 2021, 20, 515–547. [Google Scholar] [CrossRef]
- Bazdar, E.; Roshandel, R.; Yaghmaei, S.; Mardanpour, M.M. The effect of different light intensities and light/dark regimes on the performance of photosynthetic microalgae microbial fuel cell. Bioresour. Technol. 2018, 261, 350–360. [Google Scholar] [CrossRef]
- Esteves, A.F.; Gonçalves, A.L.; Vilar, V.J.P.; Pires, J.C.M. Is it possible to shape the microalgal biomass composition with operational parameters for target compound accumulation? Biotechnol. Adv. 2025, 79, 108493. [Google Scholar] [CrossRef]
- Jabri, H.A.; Taleb, A.; Touchard, R.; Saadaoui, I.; Goetz, V.; Pruvost, J. Cultivating Microalgae in Desert Conditions: Evaluation of the Effect of Light-Temperature Summer Conditions on the Growth and Metabolism of Nannochloropsis QU130. Appl. Sci. 2021, 11, 3799. [Google Scholar] [CrossRef]
- Adamczyk, M.; Lasek, J.; Skawińska, A. CO2 Biofixation and Growth Kinetics of Chlorella vulgaris and Nannochloropsis gaditana. Appl. Biochem. Biotechnol. 2016, 179, 1248–1261. [Google Scholar] [CrossRef] [PubMed]
- Ren, H.-Y.; Liu, B.-F.; Ma, C.; Zhao, L.; Ren, N.-Q. A new lipid-rich microalga Scenedesmus sp. strain R-16 isolated using Nile red staining: Effects of carbon and nitrogen sources and initial pH on the biomass and lipid production. Biotechnol. Biofuels 2013, 6, 143. [Google Scholar] [CrossRef] [PubMed]
- Kong, W.; Kong, J.; Feng, S.; Yang, T.; Xu, L.; Shen, B.; Bi, Y.; Lyu, H. Cultivation of microalgae–bacteria consortium by waste gas–waste water to achieve CO2 fixation, wastewater purification and bioproducts production. Biotechnol. Biofuels Bioprod. 2024, 17, 26. [Google Scholar] [CrossRef]
- Ashour, M.; Mansour, A.T.; Alkhamis, Y.A.; Elshobary, M. Usage of Chlorella and diverse microalgae for CO2 capture—Towards a bioenergy revolution. Front. Bioeng. Biotechnol. 2024, 12, 1387519. [Google Scholar] [CrossRef]
- Shekh, A.; Sharma, A.; Schenk, P.M.; Kumar, G.; Mudliar, S. Microalgae cultivation: Photobioreactors, CO2 utilization, and value-added products of industrial importance. J. Chem. Technol. Biotechnol. 2022, 97, 1064–1085. [Google Scholar] [CrossRef]
- Sushchenko, R.Z.; Nikulin, V.Y.; Bagmet, V.B.; Nikulin, A.Y. Molecular genetic and morphological characteristics of Micractinium thermotolerans and M. inermum (Trebouxiophyceae, Chlorophyta) from pyroclastic deposits of the Kamchatka Peninsula (Russia). Vavilovskii Zhurnal Genet. Sel. 2024, 28, 706–715. [Google Scholar] [CrossRef]
- Kryvenda, A.; Tischner, R.; Steudel, B.; Griehl, C.; Armon, R.; Friedl, T. Testing for terrestrial and freshwater microalgae productivity under elevated CO2 conditions and nutrient limitation. BMC Plant Biol. 2023, 23, 27. [Google Scholar] [CrossRef]
- Merrett, M.J.; Nimer, N.A.; Dong, L.F. The utilization of bicarbonate ions by the marine microalga Nannochloropsis oculata (Droop) Hibberd. Plant Cell Environ. 1996, 19, 478–484. [Google Scholar] [CrossRef]
- van Hille, R.; Fagan, M.; Bromfield, L.; Pott, R. A modified pH drift assay for inorganic carbon accumulation and external carbonic anhydrase activity in microalgae. J. Appl. Phycol. 2013, 26, 377–385. [Google Scholar] [CrossRef]
- Kan, Y.; Pan, J. A one-shot solution to bacterial and fungal contamination in the green alga Chlamydomonas Reinhardtii culture by using an antibiotic cocktail. J. Phycol. 2010, 46, 1356–1358. [Google Scholar] [CrossRef]
- Mustapa, M.; Sallehudin, N.J.; Mohamed, M.; Noor, N.M.; Raus, R. Decontamination of Chlorella sp. culture using antibiotics and antifungal cocktail treatment. ARPN J. Eng. Appl. Sci. 2016, 11, 104–109. [Google Scholar]
- Turner, M. Microalgae—biotechnology and microbiology. J. Exp. Mar. Bio. Ecol. 1994, 183, 300–301. [Google Scholar] [CrossRef]
- Morales, M.; Sánchez, L.; Revah, S. The impact of environmental factors on carbon dioxide fixation by microalgae. FEMS Microbiol. Lett. 2018, 365, fnx262. [Google Scholar] [CrossRef]
- Khaw, Y.S.; Khong, N.M.H.; Shaharuddin, N.A.; Yusoff, F.M. A simple 18S rDNA approach for the identification of cultured eukaryotic microalgae with an emphasis on primers. J. Microbiol. Methods 2020, 172, 105890. [Google Scholar] [CrossRef]
- Tamura, K.; Stecher, G.; Kumar, S. MEGA11: Molecular Evolutionary Genetics Analysis Version 11. Mol. Biol. Evol. 2021, 38, 3022–3027. [Google Scholar] [CrossRef]
- Chen, Y.; Vaidyanathan, S. Simultaneous assay of pigments, carbohydrates, proteins and lipids in microalgae. Anal. Chim. Acta 2013, 776, 31–40. [Google Scholar] [CrossRef]
- Corrêa, P.S.; Morais Júnior, W.G.; Martins, A.A.; Caetano, N.S.; Mata, T.M. Microalgae Biomolecules: Extraction, Separation and Purification Methods. Processes 2021, 9, 10. [Google Scholar] [CrossRef]
- Folch, J.; Lees, M.; Sloane Stanley, G.H. A simple method for the isolation and purification of total lipides from animal tissues. J. Biol. Chem. 1957, 226, 497–509. [Google Scholar] [CrossRef]
- Ritchie, R.J. Consistent sets of spectrophotometric chlorophyll equations for acetone, methanol and ethanol solvents. Photosynth. Res. 2006, 89, 27–41. [Google Scholar] [CrossRef] [PubMed]
- Wellburn, A.R. The Spectral Determination of Chlorophylls a and b, as well as Total Carotenoids, Using Various Solvents with Spectrophotometers of Different Resolution. J. Plant Physiol. 1994, 144, 307–313. [Google Scholar] [CrossRef]
- Uduman, N.; Qi, Y.; Danquah, M.K.; Forde, G.M.; Hoadley, A. Dewatering of microalgal cultures: A major bottleneck to algae-based fuels. J. Renew. Sustain. Energy 2010, 2, 012701. [Google Scholar] [CrossRef]
- Barros, A.I.; Gonçalves, A.L.; Simões, M.; Pires, J.C.M. Harvesting techniques applied to microalgae: A review. Renew. Sustain. Energy Rev. 2015, 41, 1489–1500. [Google Scholar] [CrossRef]
- Béchet, Q.; Shilton, A.; Guieysse, B. Modeling the effects of light and temperature on algae growth: State of the art and critical assessment for productivity prediction during outdoor cultivation. Biotechnol. Adv. 2013, 31, 1648–1663. [Google Scholar] [CrossRef]
- Borowitzka, M.A. High-value products from microalgae-their development and commercialisation. J. Appl. Phycol. 2013, 25, 743–756. [Google Scholar] [CrossRef]
- Patil, L.; Kaliwal, B. Optimization of biomass productivity and carbon dioxide fixation ability by freshwater microalgae scenedesmus bajacalifornicus bbklp-07, a step towards sustainable development. Int. J. Recent Sci. Res. 2017, 8, 16903–16911. [Google Scholar] [CrossRef][Green Version]
- Rinanti, A.; Kardena, E.; Astuti, D.I.; Dewi, K. Improvement of carbon dioxide removal through artificial light intensity and temperature by constructed green microalgae consortium in a vertical bubble column photobioreactor. Malays. J. Microbiol. 2014, 10, 29–37. [Google Scholar] [CrossRef]
- García-Cubero, R.; Moreno-Fernández, J.; García-González, M. Modelling growth and CO2 fixation by Scenedesmus vacuolatus in continuous culture. Algal Res. 2017, 24, 333–339. [Google Scholar] [CrossRef]
- Koruyucu, A.; Schädler, T.; Gniffke, A.; Mundt, K.; Krippendorf, S.; Urban, P.; Blums, K.; Halim, B.; Brück, T.; Weuster-Botz, D. Energy-Efficient Production of Microchloropsis salina Biomass with High CO2 Fixation Yield in Open Thin-Layer Cascade Photobioreactors. Processes 2024, 12, 1303. [Google Scholar] [CrossRef]
- Khan, T.A.; Liaquat, R.; Dr, Z.; Khoja, A.H.; Bano, A. Biological Carbon Capture, Growth Kinetics and Biomass Composition of Novel Microalgal Species. SSRN Electron. J. 2022, 17, 100982. [Google Scholar] [CrossRef]
- Montoya-Vallejo, C.; Guzmán Duque, F.L.; Quintero Díaz, J.C. Biomass and lipid production by the native green microalgae Chlorella sorokiniana in response to nutrients, light intensity, and carbon dioxide: Experimental and modeling approach. Front. Bioeng. Biotechnol. 2023, 11, 1149762. [Google Scholar] [CrossRef] [PubMed]
- Masojídek, J.; Ranglová, K.; Lakatos, G.E.; Benavides, A.M.S.; Torzillo, G. Variables Governing Photosynthesis and Growth in Microalgae Mass Cultures. Processes 2021, 9, 820. [Google Scholar] [CrossRef]
- Farooq, W. Maximizing Energy Content and CO2 Bio-fixation Efficiency of an Indigenous Isolated Microalga Parachlorella kessleri HY-6 Through Nutrient Optimization and Water Recycling During Cultivation. Front. Bioeng. Biotechnol. 2022, 9, 804608. [Google Scholar] [CrossRef]
- Ruangsomboon, S. Effects of different media and nitrogen sources and levels on growth and lipid of green microalga Botryococcus braunii KMITL and its biodiesel properties based on fatty acid composition. Bioresour. Technol. 2015, 191, 377–384. [Google Scholar] [CrossRef]
- Metin, U.; Altınbaş, M. Evaluating Ammonia Toxicity and Growth Kinetics of Four Different Microalgae Species. Microorganisms 2024, 12, 1542. [Google Scholar] [CrossRef]
- Salbitani, G.; Carfagna, S. Ammonium Utilization in Microalgae: A Sustainable Method for Wastewater Treatment. Sustainability 2021, 13, 956. [Google Scholar] [CrossRef]
- Glibert, P.M.; Wilkerson, F.P.; Dugdale, R.C.; Raven, J.A.; Dupont, C.L.; Leavitt, P.R.; Parker, A.E.; Burkholder, J.M.; Kana, T.M. Pluses and minuses of ammonium and nitrate uptake and assimilation by phytoplankton and implications for productivity and community composition, with emphasis on nitrogen-enriched conditions. Limnol. Oceanogr. 2016, 61, 165–197. [Google Scholar] [CrossRef]
- Lachmann, S.C.; Mettler-Altmann, T.; Wacker, A.; Spijkerman, E. Nitrate or ammonium: Influences of nitrogen source on the physiology of a green alga. Ecol. Evol. 2019, 9, 1070–1082. [Google Scholar] [CrossRef]
- Fernández, P.A.; Roleda, M.Y.; Leal, P.P.; Hurd, C.L. Seawater pH, and not inorganic nitrogen source, affects pH at the blade surface of Macrocystis pyrifera: Implications for responses of the giant kelp to future oceanic conditions. Physiol. Plant. 2017, 159, 107–119. [Google Scholar] [CrossRef]
- Ho, S.H.; Chen, C.Y.; Chang, J.S. Effect of light intensity and nitrogen starvation on CO2 fixation and lipid/carbohydrate production of an indigenous microalga Scenedesmus obliquus CNW-N. Bioresour. Technol. 2012, 113, 244–252. [Google Scholar] [CrossRef]
- Li, C.T.; Trigani, K.; Zuñiga, C.; Eng, R.; Chen, E.; Zengler, K.; Betenbaugh, M.J. Examining the impact of carbon dioxide levels and modulation of resulting hydrogen peroxide in Chlorella vulgaris. Algal Res. 2021, 60, 102492. [Google Scholar] [CrossRef]
- Markou, G.; Nerantzis, E. Microalgae for high-value compounds and biofuels production: A review with focus on cultivation under stress conditions. Biotechnol. Adv. 2013, 31, 1532–1542. [Google Scholar] [CrossRef]
- Morales, M.; Aflalo, C.; Bernard, O. Microalgal lipids: A review of lipids potential and quantification for 95 phytoplankton species. Biomass Bioenergy 2021, 150, 106108. [Google Scholar] [CrossRef]
- Wang, X.; Fosse, H.K.; Li, K.; Chauton, M.S.; Vadstein, O.; Reitan, K.I. Influence of nitrogen limitation on lipid accumulation and EPA and DHA content in four marine microalgae for possible use in aquafeed. Front. Mar. Sci. 2019, 6, 435318. [Google Scholar] [CrossRef]
- Maltsev, Y.; Maltseva, K.; Kulikovskiy, M.; Maltseva, S. Influence of Light Conditions on Microalgae Growth and Content of Lipids, Carotenoids, and Fatty Acid Composition. Biology 2021, 10, 1060. [Google Scholar] [CrossRef] [PubMed]
- Kato, Y.; Oyama, T.; Inokuma, K.; Vavricka, C.J.; Matsuda, M.; Hidese, R.; Satoh, K.; Oono, Y.; Chang, J.S.; Hasunuma, T.; et al. Enhancing carbohydrate repartitioning into lipid and carotenoid by disruption of microalgae starch debranching enzyme. Commun. Biol. 2021, 4, 450. [Google Scholar] [CrossRef]
- Li, X.; Li, W.; Zhai, J.; Wei, H. Effect of nitrogen limitation on biochemical composition and photosynthetic performance for fed-batch mixotrophic cultivation of microalga Spirulina platensis. Bioresour. Technol. 2018, 263, 555–561. [Google Scholar] [CrossRef]
- Richmond, A. Handbook of Microalgal Culture. In Handbook of Microalgal Culture: Biotechnology and Applied Phycology; Blackwell Publishing Ltd.: Oxford, UK, 2003. [Google Scholar] [CrossRef]
- Masojídek, J.; Torzillo, G.; Koblízek, M. Photosynthesis in Microalgae. In Handbook of Microalgal Culture: Applied Phycology and Biotechnolog, 2nd ed.; Wiley: Hoboken, NJ, USA, 2013; pp. 21–36. [Google Scholar] [CrossRef]
- Geider, R.J.; MacIntyre, H.L.; Kana, T.M. Dynamic model of phytoplankton growth and acclimation: Responses of the balanced growth rate and the chlorophyll a:carbon ratio to light, nutrient-limitation and temperature. Mar. Ecol. Prog. Ser. 1997, 148, 187–200. [Google Scholar] [CrossRef]
- Li, G.; Xiao, W.; Yang, T.; Lyu, T. Optimization and Process Effect for Microalgae Carbon Dioxide Fixation Technology Applications Based on Carbon Capture: A Comprehensive Review. C 2023, 9, 35. [Google Scholar] [CrossRef]
- Dickman, E.M.; Vanni, M.J.; Horgan, M.J. Interactive effects of light and nutrients on phytoplankton stoichiometry. Oecologia 2006, 149, 676–689. [Google Scholar] [CrossRef]
- Cervera-Mata, A.; Navarro-Alarcón, M.; Rufián-Henares, J.Á.; Pastoriza, S.; Montilla-Gómez, J.; Delgado, G. Phytotoxicity and chelating capacity of spent coffee grounds: Two contrasting faces in its use as soil organic amendment. Sci. Total Environ. 2020, 717, 137247. [Google Scholar] [CrossRef]
- Fadeyi, O.; Dzantor, K.; Adeleke, E. Assessment of Biomass Productivities of Chlorella vulgaris and Scenedesmus obliquus in Defined Media and Municipal Wastewater at Varying Concentration of Nitrogen. J. Water Resour. Prot. 2016, 8, 217–225. [Google Scholar] [CrossRef][Green Version]
- de Marchin, T.; Erpicum, M.; Franck, F. Photosynthesis of Scenedesmus obliquus in outdoor open thin-layer cascade system in high and low CO2 in Belgium. J. Biotechnol. 2015, 215, 2–12. [Google Scholar] [CrossRef]
- Oliveira, C.Y.B.; Oliveira, C.D.L.; Prasad, R.; Ong, H.C.; Araujo, E.S.; Shabnam, N.; Gálvez, A.O. A multidisciplinary review of Tetradesmus obliquus: A microalga suitable for large-scale biomass production and emerging environmental applications. Rev. Aquac. 2021, 13, 1594–1618. [Google Scholar] [CrossRef]
- AL-Mashhadani, M.K.H.; Khudhair, E.M. Cultivation of Chlorella vulgaris Using Airlift Photobioreactor Sparged with 5%CO2 -Air as a Biofixing Process. J. Eng. 2017, 23, 22–41. [Google Scholar] [CrossRef]
- Hu, Q.; Sommerfeld, M.; Jarvis, E.; Ghirardi, M.; Posewitz, M.; Seibert, M.; Darzins, A. Microalgal triacylglycerols as feedstocks for biofuel production: Perspectives and advances. Plant J. 2008, 54, 621–639. [Google Scholar] [CrossRef] [PubMed]
- Rodolfi, L.; Zittelli, G.C.; Bassi, N.; Padovani, G.; Biondi, N.; Bonini, G.; Tredici, M.R. Microalgae for oil: Strain selection, induction of lipid synthesis and outdoor mass cultivation in a low-cost photobioreactor. Biotechnol. Bioeng. 2009, 102, 100–112. [Google Scholar] [CrossRef] [PubMed]
- Barouh, N.; Wind, J.; Chuat, V.; Gagnaire, V.; Valence, F.; Bourlieu-Lacanal, C.; Subileau, M. Variations in Chlorella lipid content in commercial and in-lab produced biomass. OCL 2024, 31, 9. [Google Scholar] [CrossRef]
- Becker, E.W. Micro-algae as a source of protein. Biotechnol. Adv. 2007, 25, 207–210. [Google Scholar] [CrossRef]
- Dragone, G.; Fernandes, B.D.; Abreu, A.P.; Vicente, A.A.; Teixeira, J.A. Nutrient limitation as a strategy for increasing starch accumulation in microalgae. Appl. Energy 2011, 88, 3331–3335. [Google Scholar] [CrossRef]


Disclaimer/Publisher’s Note: The statements, opinions and data contained in all publications are solely those of the individual author(s) and contributor(s) and not of MDPI and/or the editor(s). MDPI and/or the editor(s) disclaim responsibility for any injury to people or property resulting from any ideas, methods, instructions or products referred to in the content. |
© 2026 by the authors. Licensee MDPI, Basel, Switzerland. This article is an open access article distributed under the terms and conditions of the Creative Commons Attribution (CC BY) license.