Abstract
The Po River, the largest watercourse in northern Italy, represents a fundamental resource for the socio-economic system of the Padanian Plain. Between February 2022 and February 2023, the basin was affected by exceptional climatic anomalies, with unprecedented high temperatures, marked precipitation deficits, and the most severe hydrological drought documented in the instrumental record. Po river waters sampled during this period showed variable increases (Na+, K+, Mg2+, HCO3−, Cl−, SO42−) or decreases (Ca2+, NO3−) in the geochemical composition of major ions compared to data from previous decades collected under various climatic and hydrological conditions In contrast, the water stable isotope composition (δ2H and δ18O) of the period 2022–2023 displayed distinct and peculiar signatures, ranging from −64.1 to −53.5‰ for δ2H and from −9.4 to −5.7‰ for δ18O, compared to historical averages for 1998–2014 (−71.3 to −58.0‰ and −10.0 to −8.7‰, respectively). These values indicate a strong enrichment in heavy isotopes, reflecting warmer and drier climatic conditions, comparable only to those observed during the severe drought of 2015. Two groups of data were identified: Group 1, showing affinities with Eastern Mediterranean precipitation, and Group 2, characterized by pronounced evaporative isotopic enrichment due to prolonged drought, as evidenced by strongly negative d-excess and LC-excess values, consistent with those from arid and semi-arid regions worldwide. This study demonstrates how climate change and increasing hydrological stress are altering the isotopic composition of one of Europe’s most important river systems. Stable isotopes provide a sensitive tool for tracing moisture sources, quantifying evaporative processes, and assessing drought impacts, confirming their role as Essential Climate Variables (ECVs) in climate and water-resource studies.
1. Introduction
The Critical Zone (CZ) is the thin and fragile layer at Earth’s surface where rock, soil, water, air, and living organisms interact. This zone constitutes a complex system in which geochemical processes and the atmosphere–hydrosphere interaction regulate water availability and sustain ecosystems. Within the CZ, the hydrologic cycle is a fundamental component of the climate system, with crucial societal and ecological relevance. Yet, significant knowledge gaps remain in our understanding of water fluxes and their responses to increasing greenhouse gas forcing. In this framework, stable oxygen and hydrogen isotope ratios in water represent a powerful tool to investigate hydrological processes and to assess their role in climate variability and sensitivity to environmental change [1]. Particular attention is paid to freshwater systems, which act as sensitive indicators of climate forcing and anthropogenic pressures, especially in vulnerable regions such as the Mediterranean Basin, recognized as a climate “hot spot.”
Recent research on water isotopes has focused on refining the estimate of evaporation fluxes in Mediterranean watersheds, where the dominant water sources feeding river flow exhibit a complex variability. Isotopic analyses have demonstrated that evaporation rate estimates in streams can be improved using a modified isotopic mass balance approach, particularly in cases where different flow contributions are characterized by distinct flow paths and residence times [2]. This method, which derives basin-scale averaged evaporation rates from isotopic tracers, has produced results consistent with those obtained from hydrometeorological methods. The study area where the above-mentioned isotope-based methods are applied as tracers of atmospheric circulation and the effects of drought periods on hydrological processes is Northern Italy, a region where the impacts of climate change are increasingly manifesting through more frequent and persistent drought events. The most recent severe drought began in early 2022 and persisted through 2023, with temperature anomalies of +1.23 °C relative to the 1991–2020 reference period (ISPRA, Climate Report 2022 [3]) and a −33% precipitation deficit compared to the climatic average. Notably, 2022 was the driest year since 1961 [3]. Analysis of discharge time series at the Po River basin outlet shows that the 2022 hydrological drought was the most severe of the whole record. According to a recent study by Montanari et al. [4], this condition was not solely driven by reduced precipitation, but rather by a combination of factors, including:
- -
- Changes in precipitation regime, with a reduced snow fraction and diminished snowmelt contribution;
- -
- Increased evaporation rates (+0.013 km3/year);
- -
- Expansion of irrigated agricultural areas.
These anomalies were linked to persistent atmospheric blocking patterns that favored higher temperatures and reduced precipitation. One of the most evident consequences was the progressive depletion of perennial Alpine snow cover, in some locations approaching the complete disappearance. Given that northern Italy’s main rivers flow, including the Po River, significantly depends on meltwater from Alpine glaciers and snowfields over the hydrological year, this reduction threatens the stability of annual discharge [5,6]. A notable example occurred at the Po River basin closure of Pontelagoscuro, located near the town of Ferrara (Emilia Romagna region), where the discharge lasted for long periods of time throughout the year below the historical monthly minimum average [3], with critical minima (down to 114 m3/s) recorded during the summer period.
This study aims at analyzing isotopic variations of oxygen (δ18O) and hydrogen (δ2H) in Po River waters during the 2022–2023 drought period, providing a snapshot of the isotopic status of Po River waters during an unprecedented drought event, evaluated against long-term records. These isotopic tracers demonstrated to be powerful proxies for the identification and assessment of changes in atmospheric circulation and evaporation effectiveness over long drought periods. The study also contributes to the broader discussion on the impacts of climate change, supporting the use of water isotopes as Essential Climate Variables (ECVs; [7,8,9]) for assessing hydrological transformations under warmer future scenarios.
2. Geographic and Climatic Frameworks
The Po River is the main watercourse in northern Italy and the longest river in the country, extending for 652 km (approximately 700 km). It originates from the Monviso massif (Piedmont, NW, Italy) at Pian del Re and is fed by 141 tributaries—those on the northern bank draining the Alps and those on the southern bank draining the Apennines—before flowing into the Adriatic Sea through its delta, which covers an area of more than 380 km2 (Figure 1).
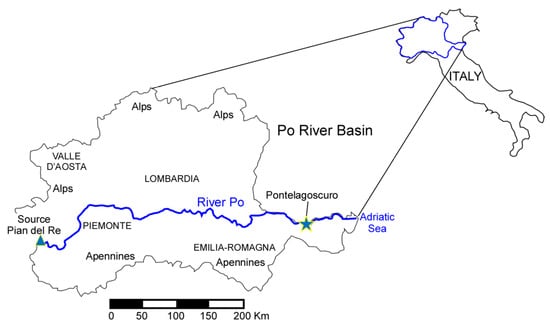
Figure 1.
Simplified sketch map of the Po River basin (blue polygon). The river originates from Pian del Re (2020 m a.s.l.) at the foot of Monviso Mt. in the Cottian Alps (Piedmont), flows eastward across the Po Plain, and discharges into the Adriatic Sea. The river basin closure section at Pontelagoscuro (near Ferrara) is also indicated (star).
The river drains the Padanian Plain, which constitutes the largest hydrological basin in Italy, covering more than 71,000 km2 (about one-quarter of the national territory) and including nearly 3200 municipalities across six regions (Piedmont, Valle d’Aosta, Lombardy, Veneto, Liguria, and Emilia-Romagna).
The Po River basin is one of the most densely populated and economically important area of Italy, with ca. 17 million inhabitants—nearly one-third of the national population—and contribute to almost half of the country’s gross domestic product. It encompasses a high concentration of industrial, agricultural, and livestock activities, which exert significant pressure on both water quality and availability.
The years 2022–2023 were marked by exceptional climatic conditions in northern Italy. In 2022, record-high annual mean temperatures combined with persistent drought severely affected large parts of the country, particularly the northern regions, leading to a sharp reduction in water availability and major challenges in water management and use. The mean annual temperature anomaly reached +1.23 °C in 2022 [3], the highest on record, and +1.13 °C in 2023 (ISPRA, Climate Report 2023 [10]), both relative to the 1991–2020 reference period.
Annual cumulative precipitation in Italy during 2022 was 22% below the climatological average, with the most pronounced deficit in northern regions (−33%). Negative precipitation anomalies persisted throughout much of the year, exacerbating hydrological stress across the Po basin [3].
Hydrological records at the Po River basin closure of Pontelagoscuro (near the town of Ferrara) indicate that the 2022 drought was the most severe of the past 200 years, with average discharge approximately 30% lower than the worst dry period even recorded by instrumental time series (Figure 2) [4,11,12]. This drought was driven not only by reduced precipitation but also by pronounced shifts in precipitation regimes—notably a lower proportion of snowfall and the consequent reduction in snowmelt contribution—further exacerbated by elevated evaporation rates and increasing irrigation demand.
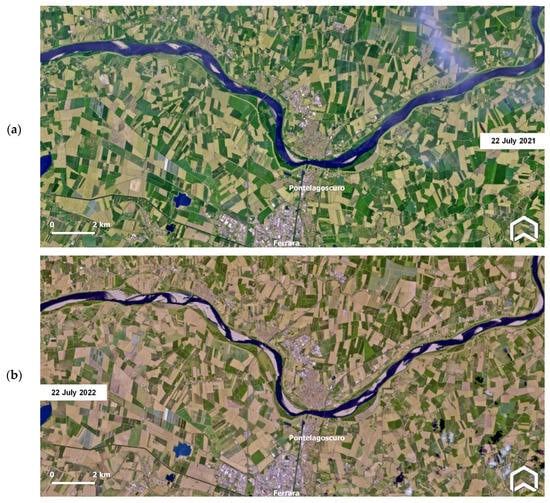
Figure 2.
Sentinel-2 satellite image (processed by ADAM platform, https://adamplatform.eu, accessed on 30 October 2025) centered on the Po river sampling location at Pontelagoscuro, near the town of Ferrara (NE Italy), collected in the same day (22 July) of the years 2021 (a) and July 2022 (b), showing the differences in the exposed areas within the riverbed in response to the extreme summer drought of the year 2022, regarded as the most severe of the past 200 years [11,12].
3. Materials and Methods
3.1. Samples Collection and Field Measurements
The geochemical and isotopic investigation is based on 13 water samples collected from the Po River between February 2022 and February 2023 at the basin closure section of Pontelagoscuro, near the city of Ferrara (44°53′22″ N, 11°36′21″ E).
Surface water was sampled at a depth of 40–50 cm using a bucket, whenever possible from piers to avoid proximity to the shoreline. Particular attention was devoted to the Pontelagoscuro section, where daily discharge data are also available and readily accessible (https://www.agenziapo.it/content/monitoraggio-idrografico-0, accessed on the dates reported in Table 1).

Table 1.
Physico-chemical parameters of Po River water at the Pontelagoscuro section (2022–2023). Reported values include discharge (Q, m3/s), temperature (T, °C), pH, and electrical conductivity (EC, µS/cm).
During the 2022–2023 period, a marked reduction in river discharge was recorded, with an average flow of about 550 m3/s and minimum values as low as 160 m3/s in July 2022 (Table 1), compared to the long-term average discharge of approximately 1540 m3/s at the closing section of the Po River basin.
In the field, surface water samples were collected directly from the Po River using a clean plastic bucket. Immediately after collection, in situ measurements of temperature (T), pH, and electrical conductivity (EC) were performed using a portable multiparameter probe (HANNA Instruments HI 9812-5, Nușfalău, România). The average water temperature was 17 °C, with a maximum of 30 °C recorded in July 2022. According to literature data, such extreme summer temperatures in the Po River had only previously been reported in July 2015, during the severe drought of that year, while the highest values generally remain below this threshold. During the study period, the average EC was 475 µS/cm, slightly higher than the long-term average of 420 µS/cm. The pH ranged between 7.5 and 8.05, consistent with typical values for the Po River [13,14,15,16].
After each sampling, the bucket was thoroughly rinsed with river water to prevent cross-contamination. The samples were then transferred into pre-rinsed polyethylene bottles, stored in a portable cooler, and transported to the laboratory for subsequent chemical and isotopic analyses.
3.2. Analytical Methods
Major cations were analyzed by inductively coupled plasma mass spectrometry (ICP-MS; Thermo Fisher Scientific iCAP TQ, Bremen, Germany.), while major anions were determined by ion chromatography (Dionex ICS-1000, Thermo Fisher Scientific, Waltham, MA, USA). Prior to analysis, samples were diluted 1:10 with deionized Milli-Q water (resistivity ≈ 18.2 MΩ·cm). Analytical accuracy and precision, based on repeated measurements of samples and standards, were better than 10% for all parameters. The alkalinity, expressed as bicarbonate (HCO3−), was determined in situ using the HI 3811 test kit (Hanna Instruments, Nușfalău, România). Hydrogen and oxygen isotopic ratios were measured using a Los Gatos Research LWIA-24d (San Josè, CA, USA) Cavity Ring-Down Spectroscopy (CRDS) isotopic analyzer. The isotopic ratios of 2H/1H and 18O/16O are expressed in delta notation:
relative to the Vienna Standard Mean Ocean Water (V-SMOW) international standard. Four bracketing standards covering the full range of isotopic values observed in the River Po were repeatedly included in the analytical runs. These standards, supplied by Los Gatos Research, were calibrated against International Atomic Energy Agency (IAEA) reference materials. Analytical precision and accuracy, based on replicate measurements of standards, were better than ±0.3‰ for δ18O and ±1.0‰ for δ2H. All the analyses were carried out at Laboratories of the Department of Physics and Earth Sciences of the University of Ferrara.
δ (‰)= (Rsample/Rstandard − 1) × 1000,
3.3. D-Excess and LC-Excess Calculation
The composition of meteoric waters that have not suffered significant evapotranspiration processes is characterized by a linear relationship between oxygen and hydrogen stable isotopes (δ2H = 8 × δ18O + 10), defined by Craig (1961) as the Global Meteoric Water Line (GMWL; [17]). In case of non-equilibrium condensation–evaporation cycles, the isotopic composition of precipitations can deviate from this relationship toward a relative enrichment in deuterium, defined by Dansgaard [18] as deuterium excess (d-excess = δ2H – 8 × δ18O). The d-excess therefore represents the entity of non-equilibrium processes affecting water systems. Values of d-excess between 10 and 11 are indicative of waters approaching quasi-stable conditions at a relative humidity of ~85%.
At the scale of the river basin, an additional parameter to evaluate how isotopic signatures of river waters differ from their source was proposed by Landwehr et al. [19], who defined the Line-Conditioned excess (LC-excess) as the difference between the δ2H and a linear transform of the δ18O with the following equation:
where a and b represent the slope and the intercept of the local meteoric water line. This parameter is particularly useful to quantify the evaporative fractionation suffered by river waters through the deviation of their isotopic signatures from those of the local precipitations and the relative local meteoric water line.
LC-excess = δ2H − a × δ18O − b,
In this view, to emphasize the variation in Po River water, LC-exc was calculated with respect to the updated Northern Italy meteoric water line reported by Giustini et al. [20]:
δ2H = 8.04 × δ18O + 11.47.
4. Results
The waters of the Po River between February 2022 and February 2023 maintained the typical bicarbonate–calcium hydrochemical facies (Table 2).

Table 2.
Monthly ionic composition of Po River water at the Pontelagoscuro section from February 2022 to February 2023. Reported values are expressed in mg L−1 and include major cations (Na+, Mg2+, K+, Ca2+), anions (HCO3−, Cl−, NO3−, SO42−), and total dissolved solids (TDS); “bdl” stands for below detection limit, meaning a substance’s concentration in a sample was too low to be measured by the testing equipment.
However, the major ion composition shows variable deviations compared to the 1998–2014 reference period [13,14,16,21]. In particular, Na+ and Cl−—which generally behave as conservative ions–display the most significant increases, with mean concentrations of ~17 and ~21 mg L−1, respectively, compared to ~12 and ~16 mg L−1 in the past. SO42− shows a moderate rise in concentration (from ~36 to ~42 mg L−1; Figure 3), whereas other major ions exhibit only minor increases. In contrast, nitrate (NO3−) concentrations decreased during 2022–2023 (~4 mg L−1) compared to the past (~7 mg L−1), especially in summer 2022. Similarly, Ca2+ shows lower average concentrations (~42 mg L−1) during the drought compared to the historical reference period (~50 mg L−1). Overall, the mean TDS is higher (≈335 mg L−1) than the historical average (≈280 mg L−1).
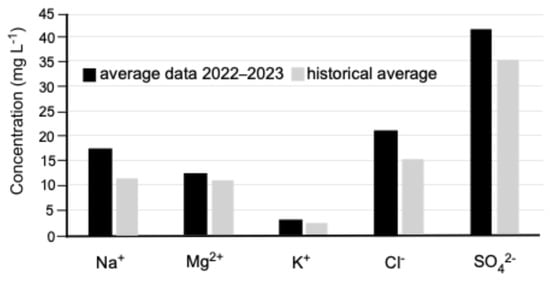
Figure 3.
Average ionic composition of Po River water at the Pontelagoscuro section during 2022–2023 (in ppm, i.e., mg L−1), compared with historical averages from 1998 to 2014 [13,14,16,21,22].
Between February 2022 and February 2023, the isotopic composition of Po River waters ranged from −64.1 to −53.5‰ for δ2H and from −9.4 to −5.7‰ for δ18O (Table 3), compared to the 1998–2014 historical averages (−71.3 to −58.0‰ and −10.0 to −8.7‰, respectively [13,14,16,21,22]).

Table 3.
Monthly isotopic composition of oxygen (δ18O) and hydrogen (δ2H) in Po River water at Pontelagoscuro from February 2022 to February 2023. Data are expressed in δ (‰) relative to Standard Mean Ocean Water (SMOW). D-excess (deuterium excess [18]) represents the deviation of a sample’s δ2H value from that predicted by the Global Meteoric Water Line (GMWL [17]), while LC-excess (Line-Conditioned excess [19]) quantifies deviations from the Local Meteoric Water Line (LMWL [20]).
These values indicate a marked enrichment in heavy isotopes, reflecting warmer and drier climatic conditions, comparable only to those observed during the severe drought of 2015 (Figure 4). Notably, the samples from July 2022 and December 2022 plot well outside the normal range and cluster in a distinct field. In the δ18O vs. δ2H diagram, they define two separate groups, consistent with enhanced evaporative effects and anomalous hydrological conditions associated with prolonged drought, particularly during July–September 2022 (δ18O = −5.9 to −5.7‰).
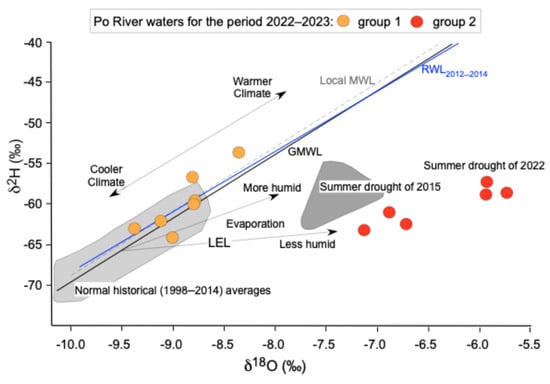
Figure 4.
δ2H vs. δ18O diagram of Po River waters between February 2022 and February 2023. Two distinct groups can be identified: the first (group1, orange dots) falls within the normal isotopic range, while the second (group2, red dots) shows extreme values, particularly during summer 2022. These enriched samples plot along the Local Evaporation Line (LEL) with respect to the Global and Local Meteoric Water Lines (GMWL [16], LMWL [19]) and from the Po River Water Line (RWL) defined for the 2012–2014 period [9]. The light and dark gray field represent the historical isotopic range for 1998–2014 [13,14,15,16,21,22] and the data cluster associated with the severe drought of 2015 [14], respectively. Arrows indicate the main controlling processes, including climatic conditions (cooler/warmer), humidity, and evaporation intensity.
Importantly, the diffusion fractionation factors for 2H–1H and 18O–16O differ and therefore the relative depletion of 2H and 18O is not parallel. The difference in the rate of 2H versus 18O depletion varies with the degree of water vapor saturation, or relative humidity. At low humidity, 2H is less affected by evaporation than 18O, causing vapor compositions to strongly depart from the Global Meteoric Water Line (GMWL [17]), or, in some cases, from the Local Meteoric Water Line (LMWL [19]). As humidity increases, isotopic exchange is enhanced, and the system tends to approach isotopic equilibrium [23]. In evaporating surface waters, the lighter isotopologues (e.g., 1H216O) preferentially escapes to the vapor phase, resulting in a progressive enrichment of heavier isotopes (1H218O and 1H2H18O) in the residual water. This isotopic shift defines the Local Evaporation Line (LEL), which typically exhibits a slope of 3–6 [24] and reflects the extent of fractionation under evaporation-dominated conditions. The LEL represents a fundamental tool for recognizing evaporative effects, tracing water origins, and interpreting hydrological processes.
Regarding the d-excess parameter, Po River waters from the 2022–2023 period shows an average value of +1.9‰, markedly lower than the historical mean (1998–2014) of +10.5‰ [13,14,15,16,21,22]. The decrease is particularly evident during the July–December 2022 interval (group 2 samples), when mean value is negative (−9.1‰), highlighting the strong evaporative effect that affected the Po River waters, especially in July and August, when values dropped to around −12‰.
Similarly, the LC-excess parameter in Po River waters from the investigated period shows an average value of −9‰, significantly lower than the historical mean (1998–2014) of approximately 0‰ [13,14,15,16,21,22]. The decrease is again most pronounced during the July–December 2022 interval (group 2 samples), when mean values reached −20‰, with the lowest values in July and August (around −23‰), further confirming the enhanced evaporative conditions affecting the river.
5. Discussion
The geochemical composition of major ions (Na+, K+, Ca2+, Mg2+, HCO3−, Cl−, SO42−, NO3−) in Po River waters during the 2022–2203 drought period did not show systematic variations with respect to that recorded in recent decades collected under various climatic and hydrological conditions. In contrast, hydrogen and oxygen stable isotope data (δ2H and δ18O) display clear and easily recognizable temporal shifts, reflecting marked modifications in the hydrological and climatic regime. Hydrogen and oxygen stable isotope data (δ2H and δ18O) provide a climatic “signature,” closely linked to precipitation source, seasonality, and evaporation effects, due to their high sensitivity to changes in climatic conditions. This makes isotope ratios powerful proxies both useful to build robust historical baseline of the river basin conditions and to assess the effects on present and future droughts on the river system.
The River Water Line (RWL [9]) is a regression line that describes the relationship between isotopic variations in river water, specifically δ2H and δ18O. It reflects the integration of different water sources (precipitation, groundwater, snowmelt, and glacial inputs) as well as the hydrological processes that modify their isotopic composition. The RWL therefore represents a fundamental tool for interpreting the origin of river waters and for assessing the influence of processes such as mixing, evaporation, and climatic seasonality.
The isotopic composition of Po River waters between February 2022 and February 2023 defines two distinct groups, both outside the historical range of variability.
The samples of group 1 define a regression line expressed as δ2H = 9.8 × δ18O + 27.2. This slope differs significantly from that observed for RWL Po River waters during 2012–2014 (δ2H = 7.5 × δ18O + 6.5).
The 2022–2023 trend indicates an anomalous shift in water origin, displaying stronger affinity with the isotopic signature of the Eastern Mediterranean sector of the Local Meteoric Water Line (LMWL, δ2H = 8 × δ18O + 22 [25]).
The samples of group 2 (collected between July 2022 and December 2022), in contrast, reflect the effects of intense evaporation during arid periods, defining an extreme trend described by the relation: δ2H = 2 × δ18O − 47.
Coherently, the d-excess and LC-excess parameters clearly indicate that the isotopic values of Po River waters during 2022–2023 deviate from the historical range (1998–2014), as illustrated in Figure 5. The light gray field represents the normal historical variability, while the dark gray field highlights the data cluster associated with the summer drought of 2015. Data from 2022 to 2023 form two distinct groups: Group 1 (orange dots; d-excess = 8 to 14‰, LC-excess = −3.2 to +2.8‰), broadly consistent with the historical range, and Group 2 (red dots; d-excess = −5.9 to −12.9‰, LC-excess = −17.1 to −24.0‰), with anomalously negative values, particularly during the summer drought of 2022. These shifts reflect strong evaporative effects and pronounced hydrological stress under prolonged drought conditions.
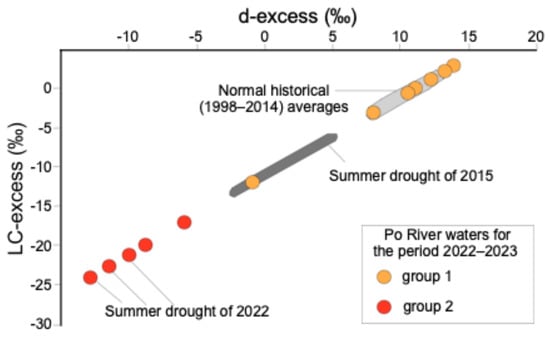
Figure 5.
d-excess vs. LC-excess diagram of Po River waters. The light and dark gray field represent the historical isotopic range for 1998–2014 [13,14,16,21,22] and the data cluster associated with the severe drought of 2015 [15], respectively. Data from February 2022–February 2023 define two groups: Group 1 (orange), which plots close to the historical range, and Group 2 (red), characterized by anomalously negative values during the summer drought of 2022, reflecting strong evaporative effects and hydrological stress.
The d-excess values of Group 1 samples show clear affinities with precipitation originating from the Eastern Mediterranean [25], where higher d-excess values (around +22‰) are typically recorded. This signal is consistent with the persistent atmospheric pattern of anticyclonic (high-pressure) systems that trapped warm, dry continental air masses from Eastern Europe, effectively blocking the inflow of moist oceanic air [26].
In contrast, Group 2 river water samples are strongly influenced by drought-induced evaporation. Previous studies in arid and semi-arid regions—including river and aquifer systems such as the Nile Delta [27], the Tarim River Basin [28], and the Badain Jaran Desert [29], as well as endorheic lakes such as those from Tibetan Plateau [30] and the Aral Sea [31]—have shown that negative d-excess values are more pronounced during dry years. This pattern indicates that drought conditions intensify evaporation across multiple components of the hydrological cycle.
The d-excess parameter in precipitation provides insights into both the dominant moisture source and the degree of recycled vapor. Low or negative d-excess values generally indicate a greater contribution of recycled moisture that has undergone extensive evaporation and re-evaporation. In the Po River, the strongly negative d-excess values observed in Group 2 between July and December 2022 clearly highlight the impact of enhanced evaporative processes under prolonged drought conditions, never recorded before in the Po River waters.
The quantification of the amount of water lost through evaporation is not straightforward. Following the approach of Froehlich et al. [32], we constructed a local empirical regression relating d-excess to the evaporated fraction (E%, Figure 6).
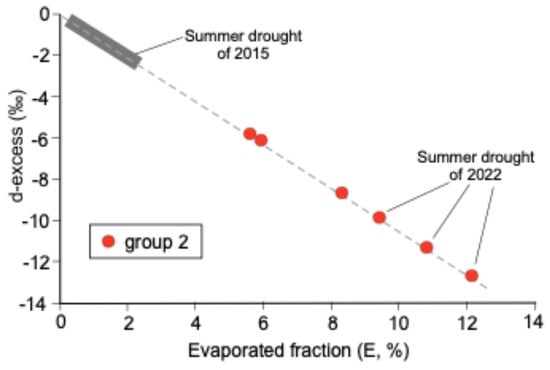
Figure 6.
Empirical relationship between evaporated fraction (E, %) and d-excess (‰) in Po River waters (dashed line), constructed following the approach of Froehlich et al. [32]. Samples collected during drought periods show a marked decrease in d-excess with increasing E.
Samples with low evaporation define the reference baseline, whereas those collected during drought conditions align along a negative slope trajectory, indicative of enhanced evaporative effects. Within this framework, the summer drought of the year 2015 is characterized by E ≈ 2% with d-excess ≈ −2‰, while the extreme drought of the year 2022, particularly represented by Group 2 samples, shows on average E ≈ 8.5% with d-excess ≈ −9.1‰. During the summer drought peak occurred in August 2022, a maximum of E ≈ 12.0% with d-excess ≈ −12.8‰ was reached, highlighting the isotopic imprint of exceptionally intense evaporation.
Quantifying the amount of water lost through evaporation is not straightforward, as it depends on multiple hydrological and climatic factors. However, an indirect indication of evaporative concentration can be inferred from the overall increase in dissolved major ions, even though not all species vary to the same extent. For instance, during the 2022–2023 drought, the mean total dissolved solids (TDS) of Po River waters increased from a historical average of 283 to 335 mg L−1, corresponding to an enrichment of approximately 17%.
Consistent evidence of enhanced evaporation is also provided by the isotopic composition of oxygen and hydrogen. The progressive enrichment in heavy isotopes (δ18O and δ2H) observed during low-flow periods reflects increased evaporation from the river surface, leading to a marked reduction in deuterium excess (d-excess). The empirical relationship proposed by Froehlich et al. [31,32] between d-excess and the evaporated fraction (E%)—originally developed for precipitation and Alpine surface waters—can tentatively be extended to river systems, where surface evaporation similarly lowers the d-excess. By adopting this conceptual framework, we established a local regression for the Po River (Figure 6), allowing estimation of the evaporative fraction of river water during drought conditions. The results suggest an evaporated fraction ranging from ~2% during the 2015 drought to >10–12% during the extreme summer drought of 2022, which is reasonably consistent with the independent increase in TDS.
6. Conclusions
The geochemical composition of major ions in Po River waters highlights significant variations in response to markedly different climatic and hydrological conditions, although such differences among individual ions are often difficult to discern. In contrast, water stable isotopes (δ2H and δ18O) provide deeper and more easily discernible evidence of change, allowing direct comparison between present conditions, past records, and potential future scenarios.
The isotopic monitoring of Po River waters between February 2022 and February 2023, although based on a limited dataset, revealed significant deviations from historical ranges, reflecting change in atmospheric circulation and exceptional drought conditions.
Two distinct sample groups characterized by distinct isotopic features were identified: Group 1, showing affinities with Eastern Mediterranean precipitation sources, and Group 2, characterized by strong evaporative enrichment under prolonged drought. The occurrence of markedly negative d-excess and LC-excess values, consistent with patterns observed in arid and semi-arid regions worldwide, underscores the critical role of drought-induced evaporation in shaping the isotopic composition of the river.
These findings provide valuable insights into both the origin of the moisture feeding the Po River waters and the intensity of evaporation processes operating within the basin. The concern is reinforced by the alarming conditions of spring 2025, marked by widespread drought, dry riverbeds, and threatened harvests across large parts of Europe and the Mediterranean, exacerbated by the scarce rainfall between March and May and temperature anomalies exceeding +2 °C above the seasonal average in some regions.
Importantly, the current isotopic datasets offer a snapshot that can be compared with past geo-archives and with future monitoring, reinforcing the role of stable water isotopes as Essential Climate Variables (ECVs) for assessing drought impacts and evaluating the resilience of freshwater resources in vulnerable regions.
Author Contributions
Conceptualization, G.B., V.B., C.M. and C.N.; methodology, C.M., and V.B.; software, G.B., V.B. and C.N.; data curation, G.B. and C.N.; writing—original draft preparation, G.B. and C.N. All authors have read and agreed to the published version of the manuscript.
Funding
This research received no external funding.
Data Availability Statement
The original contributions presented in this study are included in the article. Further inquiries can be directed to the corresponding author.
Acknowledgments
The authors thank the editor and three anonymous reviewers for their constructive comments and suggestions that allowed improving the submitted manuscript.
Conflicts of Interest
The authors declare no conflicts of interest.
References
- Dee, S.; Bailey, A.; Conroy, J.L.; Atwood, A.; Stevenson, S.; Nusbaumer, J.; Noone, J. Water isotopes, climate variability, and the hydrological cycle: Recent advances and new frontiers. Environ. Res. Clim. 2023, 2, 022002. [Google Scholar] [CrossRef]
- Vystavna, Y.; Cullmann, J.; Hipel, K.; Miller, J.; Soto, D.X.; Harjung, A.; Watson, A.; Mattei, A.; Kebede, S.; Gusyev, M. Better understand past, present and future climate variability by linking water isotopes and conventional hydrometeorology: Summary and recommendations from the International Atomic Energy Agency and World Meteorological Organization. Isot. Environ. Health Stud. 2022, 58, 311–315. [Google Scholar] [CrossRef]
- SNPA. Il Clima in Italia Nel 2022, Report SNPA (Sistema Nazionale per la Protezione dell’Ambiente) 36/2023; The ISPRA (Istituto Superiore per la Protezione e la Ricerca Ambientale) database of environmental indicators is online; Sistema Nazionale per la Protezione dell’Ambiente: Rome, Italy, 2023. [Google Scholar]
- Montanari, A.; Nguyen, H.; Rubinetti, S.; Ceola, S.; Galelli, S.; Rubino, A.; Zanchettin, D. Why the 2022 Po River drought is the worst in the past two centuries. Sci. Adv. 2023, 9, eadg8304. [Google Scholar] [CrossRef]
- Colombo, N.; Guyennon, N.; Valt, M.; Salerno, F.; Godone, D.; Cianfarra, P.; Freppaz, M.; Maugeri, M.; Manara, V.; Acquaotta, F.; et al. Unprecedented snow-drought conditions in the Italian Alps during the early 2020s. Environ. Res. Lett. 2023, 18, 074014. [Google Scholar] [CrossRef]
- Avanzi, F.; Munerol, F.; Milelli, M.; Gabellani, S.; Massari, C.; Girotto, M.; Cremonese, E.; Galvagno, M.; Bruno, G.; Morra di Cella, U.; et al. Winter snow deficit was a harbinger of summer 2022 socio-hydrologic drought in the Po Basin, Italy. Commun. Earth Environ. 2024, 5, 64. [Google Scholar] [CrossRef]
- Thornton, J.M.; Palazzi, E.; Pepin, N.C.; Cristofanelli, P.; Essery, R.; Kotlarski, S.; Giuliani, S.; Guigoz, Y.; Kulonen, A.; Pritchard, D.; et al. Toward a definition of Essential Mountain Climate Variables. One Earth 2021, 4, 805–827. [Google Scholar] [CrossRef]
- Marchina, C.; Lencioni, V.; Paoli, F.; Rizzo, M.; Bianchini, G. Headwaters’ Isotopic Signature as a Tracer of Stream Origins and Climatic Anomalies: Evidence from the Italian Alps in Summer 2018. Water 2020, 12, 390. [Google Scholar] [CrossRef]
- Marchina, C.; Natali, C.; Bianchini, C. The Po River water isotopes during the drought condition of the Year 2017. Water 2019, 11, 150. [Google Scholar] [CrossRef]
- ISPRA. Climate Report 2023, Report SNPA (Sistema Nazionale per la Protezione dell’Ambiente) 42/2024; The ISPRA (Istituto Superiore per la Protezione e la Ricerca Ambientale) database of environmental indicators is online; Istituto Superiore per la Protezione e la Ricerca Ambientale: Rome, Italy, 2024. [Google Scholar]
- Monteleone, B.; Borzí, I. Drought in the Po Valley: Identification, Impacts and Strategies to Manage the Events. Water 2024, 16, 1187. [Google Scholar] [CrossRef]
- Ramírez Molina, A.A.; Tootle, G.; Formetta, G.; Piechota, T.; Gong, J. Extraordinary 21st Century Drought in the Po River Basin (Italy). Hydrology 2024, 11, 219. [Google Scholar] [CrossRef]
- Marchina, C.; Bianchini, G.; Natali, C.; Pennisi, M.; Colombani, N.; Tassinari, R.; Knoeller, K. The Po river water from the Alps to the Adriatic Sea (Italy): New insights from geochemical and isotopic (δ18O-δ2H) data. Environ. Sci. Pollut. Res. 2015, 22, 5184–5203. [Google Scholar] [CrossRef]
- Marchina, C.; Bianchini, G.; Knoeller, K.; Natali, C.; Pennisi, M.; Colombani, N. Natural and anthropogenic variations in the Po river waters (northern Italy): Insights from a multi-isotope approach. Isot. Environ. Health Stud. 2016, 52, 649–672. [Google Scholar] [CrossRef]
- Marchina, C.; Natali, C.; Fazzini, M.; Fusetti, M.; Tassinari, R.; Bianchini, G. Extremely dry and warm conditions in northern Italy during the year 2015: Effects on the Po river water. Rend. Fis. Acc. Lincei 2017, 28, 281–290. [Google Scholar] [CrossRef]
- Marchina, M.; Natali, C.; Fahnestock, M.F.; Pennisi, M.; Bryce, J.; Bianchini, G. Strontium isotopic composition of the Po river dissolved load: Insights into rock weathering in Northern Italy. Appl. Geochem. 2018, 97, 187–196. [Google Scholar] [CrossRef]
- Craig, H. Isotopic variations in meteoric waters. Science 1961, 133, 1702–1703. [Google Scholar] [CrossRef]
- Dansgaard, W. Stable isotopes in precipitation. Tellus 1964, 16, 436–468. [Google Scholar] [CrossRef]
- Landwehr, J.M.; Coplen, T.B. Line-conditioned excess: A new method for characterizing stable hydrogen and oxygen isotope ratios in hydrologic systems. In Proceedings of the International Conference on Isotopes in Environmental Studies Aquatic Forum 2004, Monte-Carlo, Monaco, 25–29 October 2004; IAEA: Wien, Austria, 2006; pp. 132–135. [Google Scholar]
- Giustini, F.; Brilli, M.; Patera, A. Mapping oxygen stable isotopes of precipitation in Italy. J. Hydrol. Reg. Stud. 2016, 8, 162–181. [Google Scholar] [CrossRef]
- Rapti-Caputo, D.; Martinelli, G. The geochemical and isotopic composition of aquifer systems in the deltaic region of the Po River plain (Northern Italy). Hydrogeol. J. 2009, 17, 467–480. [Google Scholar] [CrossRef]
- Martinelli, G.; Chahoud, A.; Dadomo, A.; Fava, A. Isotopic features of Emilia-Romagna region (North Italy) groundwaters: Environmental and climatological implications. J. Hydrol. 2014, 519, 1928–1938. [Google Scholar] [CrossRef]
- Clark, I.; Fritz, P. Environmental Isotopes in Hydrogeology; Lewis Publishing: Singapore, 1997; 328p. [Google Scholar]
- Vystavna, Y.; Harjung, A.; Monteiro, L.R.; Matiatos, I.; Wassenaar, L.I. Stable isotopes in global lakes integrate catchment and climatic controls on evaporation. Nat. Commun. 2021, 12, 7224. [Google Scholar] [CrossRef] [PubMed]
- Hatvani, I.G.; Smati, A.E.; Erdélyi, D.; Szatmári, G.; Vreča, P.; Kern, Z. Modeling the spatial distribution of the meteoric water line of modern precipitation across the broader Mediterranean region. J. Hydrol. 2023, 617, 128925. [Google Scholar] [CrossRef]
- Martins, J.P.A.; Caetano, S.; Pereira, C.; Dutra, E.; Cardoso, R.M. A satellite view of the exceptionally warm summer of 2022 over Europe. Nat. Hazards Earth Syst. Sci. 2024, 24, 1501–1520. [Google Scholar] [CrossRef]
- Salem, Z.E.-S.; Elnahrawy, A.M.; Abdelrahman, K.; Fnais, M.S.; Abu-Alam, T. Oxygen and hydrogen stable isotopes as recharge indicators, Central Nile Delta Quaternary aquifer, Egypt. J. King Saud Univ. Sci. 2022, 34, 101834. [Google Scholar] [CrossRef]
- Huang, T.; Pang, Z. The role of deuterium excess in determining the water salinisation mechanism: A case study of the arid Tarim River Basin, NW China. Appl. Geochem. 2012, 27, 2382–2388. [Google Scholar] [CrossRef]
- Zhao, L.; Xiao, H.; Dong, Z.; Xiao, S.; Zhou, M.; Cheng, G.; Yin, L.; Yin, Z. Origins of Groundwater Inferred from Isotopic Patterns of the Badain Jaran Desert, Northwestern China. Ground Water 2012, 50, 715–725. [Google Scholar] [CrossRef] [PubMed]
- Yuan, F.; Sheng, Y.; Yao, T.; Fan, C.; Li, J.; Zhao, H.; Lei, Y. Evaporative Enrichment of Oxygen-18 and Deuterium in Lake Waters on the Tibetan Plateau. J. Paleolimnol. 2011, 46, 291–307. [Google Scholar] [CrossRef]
- Oberhänsli, H.; Weise, S.M.; Stanichny, S. Oxygen and hydrogen isotopic water characteristics of the Aral Sea, Central Asia. J. Marine Syst. 2009, 76, 310–321. [Google Scholar] [CrossRef]
- Froehlich, K.; Kralik, M.; Papesch, W.; Rank, D.; Scheifinger, H.; Stichler, W. Deuterium excess in precipitation of Alpine regions—Moisture recycling. Isot. Environ. Health Stud. 2008, 44, 61–70. [Google Scholar] [CrossRef] [PubMed]
Disclaimer/Publisher’s Note: The statements, opinions and data contained in all publications are solely those of the individual author(s) and contributor(s) and not of MDPI and/or the editor(s). MDPI and/or the editor(s) disclaim responsibility for any injury to people or property resulting from any ideas, methods, instructions or products referred to in the content. |
© 2025 by the authors. Licensee MDPI, Basel, Switzerland. This article is an open access article distributed under the terms and conditions of the Creative Commons Attribution (CC BY) license (https://creativecommons.org/licenses/by/4.0/).