Abstract
Mountain-block groundwater in the Southern Basin-and-Range Province shows a variety of patterns of δ18O and δ2H that indicate multiple recharge mechanisms. At 2420 m above sea level (masl) in Tucson Basin, seasonal amount-weighted means of δ18O and δ2H for summer are −8.3, −53‰, and for winter, −10.8 and −70‰, respectively. Elevation-effect coefficients for δ18O and δ2H are as follows: summer, −1.6 and −7.7 ‰ per km and winter, −1.1 and −8.9 ‰ per km. Little altitude effect exists in 25% of seasons studied. At 2420 masl, amount-weighted monthly averages of δ18O and δ2H decrease in summer but increase in winter as precipitation intensity increases. In snow-banks, δ18O and δ2H commonly plots close to the winter local meteoric water line (LMWL). Four principal patterns of (δ18O, δ2H) data have been identified: (1) data plotting along LMWLs for all precipitation at >1800 masl; (2) data plotting along modified LMWLs for the wettest 30% of months at <1700 masl; (3) evaporation trends at all elevations; (4) other patterns, including those affected by ancient groundwater. Young, tritiated groundwater predominates in studied mountain blocks. Ancient groundwater forms separate systems and mixes with young groundwater. Recharge mechanisms reflect a complex interplay of precipitation season, altitude, precipitation intensity, groundwater age and geology. Tucson Basin alluvium receives mountain-front recharge containing 50%–90% winter precipitation.
Keywords:
Arizona; New Mexico; hydrology; mountain block; recharge; stable isotopes; tritium; carbon-14 1. Introduction
In the Basin and Range Province [1] of Southwestern North America, mountain blocks play an important role in regional hydrology. Water from the highest mountain ranges is conveyed to adjacent basin-fill aquifers either as surface flow or as sub-surface mountain-block recharge [2]. Since the 1880s, the alluvial aquifers have been a crucial water source for agriculture, mining and urban centers in the region. Groundwater hydrology studies in mountain ranges are potentially difficult because of the challenges of data collection in remote and inaccessible terrain with few sampling points [2].
Studies of mountain-system hydrology have been conducted at a variety of spatial scales. Smaller-scale studies have focused on water budgets of individual hillslopes or small watersheds, using parameters such as water chemistry, temperature and isotopes to examine the distribution of available water between runoff, soil water and bedrock groundwater [3,4,5,6,7,8]. At a larger scale, isotope and noble gas ratio data have identified groundwater moving from a mountain block into basin alluvium in Salt Lake Valley, Utah, USA [9,10]. Stable isotope studies have addressed the residence time of mountain-block groundwater of Table Mountain, South Africa, and the Cascade Range, Oregon, USA [11,12].
A potential approach to mountain-block hydrology consists in comparing isotope data of groundwater from springs and wells with isotopes in mountain precipitation, taking into account the altitude and seasonal effects, with a view to constraining recharge mechanisms and flow paths. Such studies have been undertaken in the Basin-and-Range Province [13,14,15,16,17]. Figure 1 is a conceptual sketch of a mountain block, showing possibilities for water movement that might be evaluated using stable isotope data.
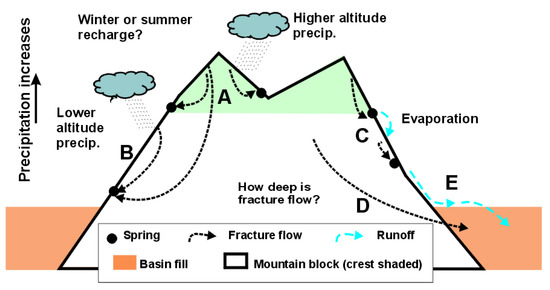
Figure 1.
Conceptual diagram for processes of mountain-block hydrology in the Basin-and-Range Province. A = recharge of high-altitude precipitation, fracture flow to all lower elevations; B = recharge of lower-altitude precipitation; C = high-altitude recharge subject to cyclic infiltration, discharge, evaporation and infiltration; D = mountain-block recharge to basin alluvium; E = mountain-front recharge to basin alluvium.
In this article, stable oxygen and hydrogen isotope data from environmental waters are reviewed in an assessment of groundwater characteristics in six mountain blocks (Santa Catalina, Rincon, Tucson, Santa Rita, Galiuro, and Sacramento) of the Basin and Range Province in Southern Arizona and New Mexico, and in the Mogollon Highlands at Payson, Arizona (Figure 2). Data for the Huachuca and Chiricahua Mountains (Mts.) (Figures S1 and S2), which illustrate less clearly the phenomena to be described in the other locations, are reviewed in Supplementary Information. The aims of the study are: (1) detailed evaluation of isotope character of high-altitude precipitation in the Santa Catalina (Mts); (2) comparison of isotope data for groundwater in multiple mountain blocks; (3) interpretation of stable O and H isotope data in the context of isotope altitude effects, local geology and groundwater ages; (4) interpretation of isotope data patterns in terms of recharge mechanisms; and (5) re-evaluation of seasonality of mountain-front recharge to the alluvial aquifer in Tucson Basin.
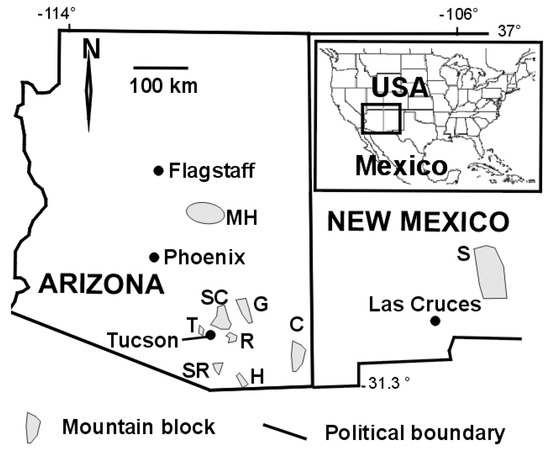
Figure 2.
Map of Arizona and part of New Mexico, showing locations of mountain ranges described in this study. C = Chiricahua Mts.; G = Galiuro Mts.; H = Huachuca Mts.; MH = Mogollon Highlands; R = Rincon Mts.; S = Sacramento Mts., SC = Santa Catalina Mts.; SR = Santa Rita Mts.; T = Tucson Mts.
2. Materials and Methods
2.1. Study Area
The mountain blocks considered here are hard-rock ranges of the Basin-and-Range province, plus part of the southern rim of the Colorado Plateau. The Basin-and-Range Province formed by Neogene tectonic extension, part of an extended episode of taphrogenesis reflecting the interaction of mid-ocean ridges and triple junctions with trenches along the western edge of the continent [18]. Extension split a hard-rock plateau into a series of mountain ranges separated by basins filled with alluvium, a process that began 15 Ma ago in Southeastern Arizona [18]. The ranges are fault-bounded horsts or tilted blocks of consolidated Early Proterozoic to Neogene rocks [19]. The complex interior structure of the ranges reflects evolution from a Late Cretaceous compressive stress regime to a Neogene extensional regime [19].
The region has an arid to semiarid climate, except at the crests of the higher mountain ranges. Annual average precipitation ranges from 75 to over 1000 mm annually, with the higher totals occurring at the range crests [20]. Potential evaporation greatly exceeds rainfall [20,21]. Rainfall typically occurs in two seasons or modes: in summer, localized, potentially intense convective precipitation results from the North American monsoon, and in winter, widespread orographic precipitation originates from Pacific frontal systems. These precipitation modes are consistently separated in the spring by a hot period with little or no rain during May and June. Dry, lower mountain slopes typically support grasses, forbs, succulents and shrubs, succeeded upwards by stunted evergreen oaks and conifers. Well-watered range-crests support forests of conifers and deciduous trees. Most woodland parts of the study areas have little human settlement and are protected by National Forest or National Park designation; in such areas, fire has been suppressed for many years. Since the onset of long-term drought in the late 1990s, the vegetation and surface hydrology of large areas have been greatly affected by forest fires. Higher-density human settlement in these mountain ranges is present locally in the Southern Sacramento, Santa Catalina and Tucson Mts. and the Mogollon Highlands.
When sampling for this study began in the 1990s, springs of modest discharge were widely distributed in most of the ranges considered here, except for the Tucson Mts. Attempts at re-sampling since 2012 have shown that many springs no longer discharge in the Santa Catalina and Galiuro Mts. The change in hydrology reflects drought conditions that have prevailed since about 1998 [22].
The hydrogeology of each range is strongly influenced by its lithologies and structures. In the following summary, representative references are given for the geology. Detailed geological maps and cross-sections can be found in those references.
2.2. Santa Catalina and Rincon Mts
These ranges form the northern and northeastern boundary of Tucson Basin, and constitute a single structural block of the Basin-and-Range Province. In the Santa Catalina Mts. (SCM), the highest peak is Mt. Lemmon, 2791 masl. Steep slopes and V-shaped drainages are characteristic. In the Rincon Mts. (RM), the highest peak is Mica Mountain, 2641 masl. The central massifs of both ranges consist mainly of granitoid intrusions, including thick sheets of Paleogene equigranular peraluminous leucogranite and associated pegmatite intruding tilted Proterozoic and Paleozoic strata to the northeast, and intensely deformed Proterozoic granite to the southwest [23,24]. The SCM-RM block formed the lower plate of a Neogene low-angle detachment fault marked by a band of impermeable mylonite [25]. A pronounced set of sub-horizontal leucogranite sheets on Mica Mountain (RM) creates a stepped topography that is absent in the SCM.
Previous stable isotope studies in the SCM addressed the origin of spring water [26], the origin of groundwater associated with the detachment fault [27], the nature of precipitation at a station at 2420 masl [28] and relationships among precipitation, critical zone groundwater, soil water and stream flow [6,8,29,30].
2.3. Tucson Mts
The Tucson Mountains form a terrain of steep slopes and sharp peaks interspersed with broad valleys and pediments, and bounding Tucson Basin to the west. Wassen Peak, 1428 masl, is the highest point. Late Cretaceous–Paleogene granitoids intrude coeval felsic volcanic rocks and Permian to Jurassic sedimentary rocks [24]. Fracture-hosted groundwater is pumped from as much as 170 m below valley-floors and pediments; water levels are declining rapidly. Detailed isotope (stable O, H in water, stable S, O in sulfate, 3H, 14C, 87Sr/86Sr) and geochemical data were presented for fracture-hosted groundwater from a 9 km2 area near the Yuma Mine, 32.19° N, 111.73° W [31].
2.4. Santa Rita Mts
In the steep-sided massif of Mt. Wrightson (2882 masl), Triassic and Jurassic granitoids intrude Triassic felsic volcanic rocks with interbedded eolian sandstone. Paleozoic limestone and Mesozoic clastic sedimentary rocks underlie the eastern slope of the massif [32]. Published groundwater isotope data (stable O, H and tritium) are available for the Rosemont area at 1500–1700 masl on the northern ridge of the range [33], where complex faulting juxtaposes Proterozoic granitoid, Paleozoic marine shelf strata and Mesozoic clastic sedimentary rocks [32,34,35].
2.5. Galiuro Mts
Steep slopes and V-shaped topography are characteristic. The highest point is Bassett Peak, 2332 masl. Late Paleogene felsic and intermediate volcanic rocks unconformably overlie discontinuous outcrops of Late Cretaceous–Paleogene andesite and granitoids [36]. At the south end of the range, a group of hot springs (Hooker and nearby hot springs) discharges at 53 °C. Stable O, H isotope data were measured for a few springs at the north end of the range [37].
2.6. Mogollon Highlands
Paleozoic strata, predominantly limestone, sandstone and siltstone, unconformably overlie Proterozoic granitoids [38]. Highest elevations, 2300–2400 masl, occur at the Mogollon Rim (the southern edge of the Colorado Plateau) where the strata are flat-lying. South of the Mogollon Rim, at elevations of 1500–1700 masl, the Paleozoic strata and Proterozoic granitoids are juxtaposed in complex fashion by normal faults. Available reports address the hydrogeology of the Mogollon Highlands [39] and isotopes in groundwater [40].
2.7. Sacramento Mts
The highest point in the range is Cathey Peak, 2923 masl. Landforms at high elevation include V-shaped canyons, broad valleys with thick soil, and local karst features. Paleozoic strata, predominantly limestone, are bounded by steep normal faults to the west, and dip eastward. Small springs discharge where shale beds form aquitards, but regional hydrology is dominated by long-distance karst permeability [16]. Groundwater isotope (stable O, H in water, 3H, 14C) and geochemical data amassed during wet years, 2006–2009, [16] were compared with isotope data collected in 2003, following a dry period [17].
2.8. Recharge Seasonality
The difference in stable isotope composition between summer and winter rain in Tucson Basin has been used with isotope mass-balance to determine that winter recharge is dominant in the basin aquifer [41,42,43,44]. Both O and H isotopes should be used in the mass-balance approach [45] because of an isotope effect related to precipitation intensity like that in tropical regions [46]. Two principal recharge mechanisms involving local precipitation (not river water of remote derivation) operate in alluvial basins of Arizona [45]. Basins in Northwestern Arizona receive recharge from winter precipitation, with strong evaporation effects. Basins in Southeastern and Central Arizona receive both summer and winter recharge, but only from precipitation falling in the wettest months. The seasonality of recharge in mountain blocks may not correspond to that in adjacent basins, and may vary with altitude [47].
2.9. Altitude Effects
The altitude effect on stable isotopes in precipitation [48] consists in decreases in δ18O and δ2H with increasing sampling elevation. The altitude-δ18O relationship has been used to determine altitudes of recharge [49,50] and paleoelevations in ancient mountain ranges [51,52]. For worldwide stations at latitudes <70° and altitudes <5000 m, the relationship between δ18O and altitude is linear, and the range of isotopic lapse rate for δ18O is −1.0 to −5.1‰/km with an average of −2.8 ± 1.3 (1σ) ‰/km [53]. Snow sublimation may be superimposed on isotope altitude effects, decreasing lapse rates of δ18O and leading to underestimates of paleo-elevation [54].
Isotope altitude effects are commonly absent on mountain ranges in continental interiors and in snow [55]. Altitude effects in interior ranges of Arizona and New Mexico appear to be complex [45]. Altitude effects are present in summer but not in winter on a north-facing transect near Prescott, Arizona, outside the present study area; on a neighboring south-facing transect, altitude effects are present in both seasons, but are imperfectly correlated with altitude [56]. On the east-facing slope of the Sacramento Mts., New Mexico, normal altitude effects were observed in summer, but reverse effects (δ18O increasing with altitude) occurred in two winters of three studied [16].
In Tucson Basin, data collected at 2420 masl between 1995 and 2004 at Palisades Ranger Station (PRS) in the Santa Catalina Mts. [28] (Supplementary Table S1) have been compared with a 32-year dataset collected at 747 masl at the University of Arizona (UA) station in Tucson [22,28]. PRS has an average precipitation of 750 mm/year; precipitation at PRS is more frequent than at UA, where average precipitation is 360 mm/yr. The long-term estimates of altitude coefficients (Figure 3a) are based on all precipitation events for each station.
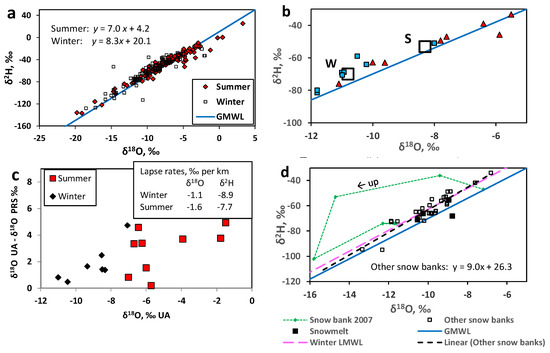
Figure 3.
Isotope data for precipitation in the Santa Catalina Mts. (a). δ2H vs. δ18O for individual measurements. Values of δ18O are amount-weighted means. (b). δ2H vs. δ18O for seasonal amount-weighted mean data. (c). Altitude effects measured between the University of Arizona (UA, 747 masl) and Palisades Ranger Station (PRS, 2420 masl) over entire winter and summer seasons, 1996–2003. (d). δ2H vs. δ18O for snow-banks.
2.10. Sampling and Analyses
Spring water was sampled as close as possible to the discharge point. Water supply wells in continual use were sampled without further purging. Samples were stored in robust, tightly sealed plastic bottles. Measurements of δ18O and δ2H were made on an automated gas-source isotope ratio mass spectrometer (Finnigan Delta S) at the Environmental Isotope Laboratory of the University of Arizona, Tucson, Arizona. For H isotopes, samples were reacted at 750 °C with Cr metal using a Finnigan H/Device coupled to the mass spectrometer. For O isotopes, samples were equilibrated with CO2 at approximately 15 °C in an automated equilibration device coupled to the mass spectrometer. International reference materials VSMOW and SLAP were used for standardization [57]. On the basis of repeated internal standards, analytical precision (1σ) was 0.9‰ or better for δ2H and 0.08 ‰ or better for δ18O. Prior to 1992, water samples were prepared manually by reduction to H2 gas using Zn metal for H isotopes, and CO2 equilibration for O isotopes. Analytical precision (1σ) was poorer, 1.5‰ to 2‰ for δ2H, and 0.15‰ for δ18O. Tritium was measured on 0.18 L samples following electrolytic enrichment, using Quantulus 1220 spectrophotometers with a detection limit of 0.6 tritium units (TU). Calibration was based on National Institute of Standards and Technology standard reference materials 4361 B and C. Carbon-14 measurements were made on 50 L water samples at the Radiocarbon Laboratory, University of Arizona. Dissolved inorganic carbon was precipitated as BaCO3, processed to benzene, and measured using Quantulus 1220 liquid-scintillation spectrophotometers. The detection limit for full-size samples was 0.8 percent modern carbon (pMC) or lower. Calibration was based on international standard Oxalic Acid I.
In this article, the presence of finite tritium in a groundwater sample is used as evidence that the sample contains at least some recharge from precipitation that fell since about 1953. Finite tritium does not preclude the presence of older recharge mixed with the younger water.
3. Results
Previously unpublished isotope data are listed with sample location data in Supplementary Tables S1–S3. Sources of published groundwater data are cited in each section, below.
3.1. Precipitation, Santa Catalina Mts
Figure 3a shows all available data for PRS [28]. Gaps exist, and many data represent composites of rain events over multiple weeks (Table S1). Data for summer (defined here as June to October) and winter (November to May) span broad, largely identical ranges; most data plot on a linear trend above the global meteoric water line (GMWL) [58] between δ18O values of −19‰ and −3‰. Summer data predominate at δ18O > −5‰. Seasonal local meteoric water lines (LMWL), weighted for precipitation amount [59] differ in slope and intercept (Figure 3a). Long-term amount-weighted averages (Figure 3b) are (δ18O, δ2H) = (−10.8‰, −70‰) for winter and (−8.3‰, −53‰) for summer.
3.2. Altitude Effects at Annual Time Scale
Differences in seasonal amount-weighted mean δ18O between PRS and UA are distributed evenly between 0, signifying no altitude effect, and 4.9, corresponding to −2.9 ‰/km (Figure 3c). In Southern Arizona, estimation of average isotope altitude effects clearly requires data for multiple years. Available data indicate little to no altitude effect (< 1‰ difference in Figure 3c) in four of sixteen individual seasons.
3.3. Isotopes in Snow
Winter precipitation above 2000 masl in the Santa Catalina Mts. is commonly snow, locally forming snow-banks that may persist until the spring equinox. Vertical sections through a snow-bank on Mt. Bigelow Road (32.4158° N, 110.7302° W) were sampled between 2007 and 2012 to investigate the occurrence of isotope shifts due to sublimation or other snow-metamorphic processes that are known elsewhere in the Basin and Range Province [54,60]. Except in 2007, the data form a scattered linear trend (Figure 3d), essentially conforming to the winter LMWL. In 2007, much of the snow plotted far above the GMWL, reflecting snow-bank isotope fractionation opposite in sense to that observed in Southeast California and Nevada [54]. Three meltwaters plot with snow-bank data, and a fourth plots to the right of the GMWL, as predicted for snow that has partly sublimed [14]. Large isotope fractionation within snow-banks does not occur in most years in the Santa Catalina Mts. When present, it may result from sublimation and recondensation of vapor along a thermal gradient [61]. Snow metamorphism studies in Alaska [61] and the Southwest USA [54,60] do not show the large isotope shifts to the left of the GMWL that were identified in this study (Figure 3d).
3.4. Precipitation Intensity Effects
Recharge in subtropical and tropical regions has the isotope composition of precipitation falling in the wettest months [46]. This effect is also present in Southern Arizona, where an isotope intensity effect exists in the UA precipitation isotope dataset, and recharge appears to be dominated by precipitation falling during approximately the wettest 30% of months (Figure 4a) [45]. The PRS precipitation dataset is not ideal for such analysis, because of composite samples that are not easily arranged into calendar-month brackets, and because of the relatively small number of monthly data (30 for winter, 37 for summer, compared with 159 and 134, respectively, at UA). Where necessary, data were combined into approximate month-long non-calendrical brackets. Limitations notwithstanding, the wettest summer months (plotted at x ≥ 60 in Figure 4b) at PRS have lower δ18O and δ2H than the long-term amount-weighted averages (plotted at x = 0). In winter, the opposite occurs: the wettest months have higher values of δ18O and δ2H than the long-term averages. Means representing the wettest 30% of months at PRS are nearly collinear with the LMWL as defined by long-term means of all data (Figure 5a).
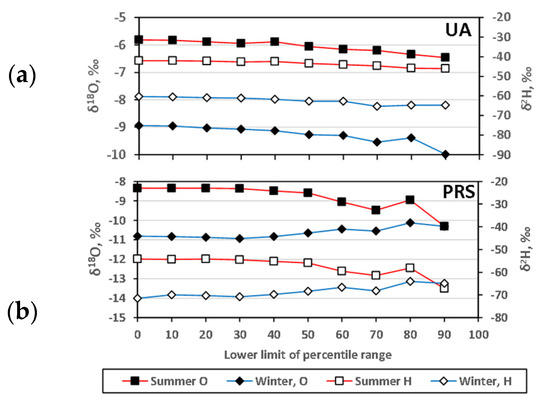
Figure 4.
Effect of rainfall intensity on δD and δ18O in precipitation; data from the (a) University of Arizona (UA) and (b) Palisades Ranger Station (PRS) in the Santa Catalina Mts. Data from [22,28]. A value of 70 (for instance) on the x-axis corresponds to cumulative amount-weighted data for the 70th to 100th percentile of months, arranged in order of monthly precipitation amount–i.e., to the wettest 30% of months.
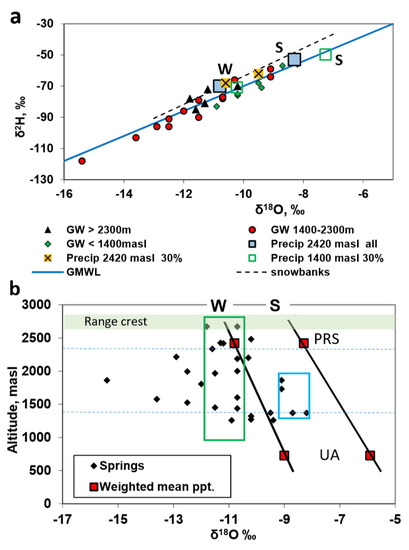
Figure 5.
(a). δ2H vs. δ18O in groundwater (GW) from the Santa Catalina Mts., grouped according to altitude of discharge. Also shown are long-term amount-weighted mean data for precipitation at 2420 masl [28] averaging over all data and over the wettest 30% of months, and for precipitation at 1400 masl [22,28], averaging over the wettest 30% of months. The snowbank line is from Figure 3d. (b). δ18O in high-altitude groundwater from the Santa Catalina Mts. as a function of altitude. Sloping lines indicate long-term δ18O lapse-rates. Blue dashed lines mark altitudes 2300 and 1400 masl. Green and blue rectangles are discussed in the text.
Therefore, isotope data cannot reveal a relationship between precipitation intensity and recharge at the elevation of PRS; such relationships rely on a distinction between the LMWL (long-term means) and the line including wettest-month means [45,46]. Recharge may nonetheless occur mainly during the wettest summer months at high altitudes. In winter, this is less likely because snow-banks and their meltwater can represent all winter precipitation events. The isotope composition of high-altitude winter recharge is, therefore, better estimated by the weighted mean for all winter events.
3.5. Groundwater, Santa Catalina Mts
Figure 5a shows data for the main range of the Santa Catalina Mts., sampled in 1994–1996 [26], omitting data for samples that had apparently evaporated between the discharge and sampling points. Most samples plot close to the GMWL. Springs discharging at elevations above 2300 masl have a restricted range of isotope composition, plotting near or just below the amount-weighted mean for winter precipitation. Springs discharging below 2300 masl have a much broader range that extends from mean summer precipitation to values far below mean winter precipitation. For springs discharging below 1400 masl, the range of isotope composition is more restricted and possibly related (with one exception) to mean precipitation for the wettest months near 1400 masl.
Plotting δ18O as a function of discharge altitude (Figure 5b), it is possible to constrain recharge seasonality. Reasoning that recharge must occur at elevations above the discharge points, winter recharge is predominant for samples plotting within the green rectangle, regardless of recharge altitude. Similarly, samples plotting in the blue rectangle have approximately equal summer and winter recharge, or predominant summer recharge. Points to the left of the green rectangle can only be explained by recharge of water from unusually low-δ18O events, recorded at PRS in both summer and winter (Supplementary Table S1).
All spring discharge in the main massif of the range contained tritium, and, therefore, contains some post-1953 recharge [26]. Groundwater flow appears to occur on a time scale of decades, most likely through shallow fracture systems. The drying of many springs since the beginning of drought conditions in about 1998 is additional evidence of the short time scale of flow. Winter recharge at the range crest could supply discharge to springs with data plotting in the green rectangle (Figure 5b). All springs considered could potentially have catchments extending to the range crest. However, more than half of the springs below 2300 masl were supplied with water of other isotope composition. Recharge was, therefore, occurring at lower elevations, with a wide range of combinations of winter and summer precipitation. No explanation is possible at present for apparent preferential recharge after unusually low-δ18O events; in winter, such events are not the largest precipitation events (Figure 4b; Supplementary Table S1).
3.6. Springs, Rincon Mts
Two sets of samples are considered (Figure 6). Spring water was collected in 2010 on Mica Mountain, the main massif of the range, by National Parks Service staff [62], mostly from small pools into the bottom of which spring water was seeping; some of the samples showed strong evidence of evaporation and others may be slightly evaporated. A second set of spring and well water samples was collected close to outcrop of the Catalina detachment fault by one of us (CJE), Joy Gillick, and Alex Leonard between 1996 and 2014.
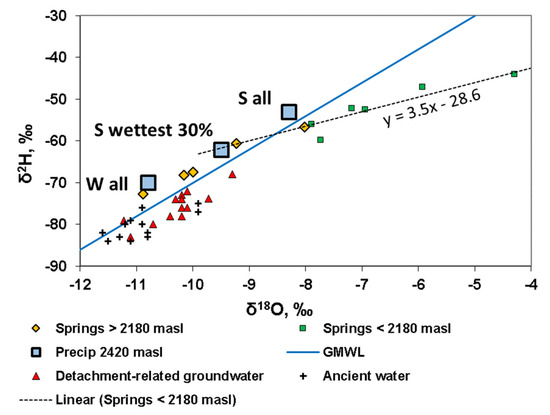
Figure 6.
δ2H vs. δ18O in groundwater from the Rincon Mts. Also shown are long-term amount-weighted mean data for precipitation at 2420 masl (from Figure 5). Data for ancient water are for Southeastern Arizona groundwater containing < 8 pMC. [44,63,64]. W = winter, S = summer.
Data for springs discharging above 2180 masl form an array between mean winter and summer precipitation at PRS, and show no evidence of evaporation, with one exception. Springs discharging below 2180 masl on Mica Mountain form an evaporation trend of slope near 3.5, the trend apparently also including two of the springs discharging above 2180 masl, and the mean isotope composition of the wettest 30% of summer months. Two intensely evaporated samples with (δ18O, δ2H) = (+7.3, −2‰) and (+15.0, +23‰) are omitted from the plot, but lie on the evaporation trend and are included in the regression calculation. Most of the spring waters contained finite tritium when sampled in 2010.
Groundwater drawn from wells in hard rock and from Agua Caliente spring near the Catalina detachment fault at the base of the Rincon Mts. plots near (δ18O, δ2H) = (−10, −76‰). A similar set of data, predating automated analytical techniques, was collected in the early 1980s [27]. The groundwater is of sodium-sulfate type; sulfate-oxygen isotopes indicate that the sulfate source is oxidized sulfide [65]. Tritium is below detection, and 14C content ranges from 16 to 47 percent modern carbon (pMC). Corrected dates are not offered, because sulfide oxidation has probably enhanced the dissolution of accessory carbonate of unknown δ13C value from the aquifer.
Three recharge mechanisms are present in the Rincon Mts. (1) At high-altitudes, various combinations of winter and summer recharge plot on the high-altitude LMWL. Most groundwater of this kind bears detectable tritium (Supplementary Table S2) and appears to flow with short residence time through shallow fractures. (2) High-altitude recharge that is either equal parts high-altitude winter and summer precipitation (considering seasonal amount-weighted means for all precipitation data) or entirely precipitation from the wettest 30% of summer months. This kind of water appears to recharge and discharge cyclically in stream beds, undergoing evaporation in the process. (3) Recharge of slightly evaporated water with (δ18O, δ2H) lower than the values for present-day weighted-mean winter precipitation at PRS. The groundwater is of long residence time, probably thousands of years, apparently flowing through a deep fracture system to an aquifer confined beneath mylonite of the Catalina detachment fault. Such groundwater may be a mixture between ancient precipitation (represented in Figure 6 by eleven data points for Southeastern Arizona groundwater containing <8 pMC [44,63,64] with more recent high-altitude recharge. Note that the data from [64] include four samples without 14C data, but from the same deep, saline aquifer as dated samples.
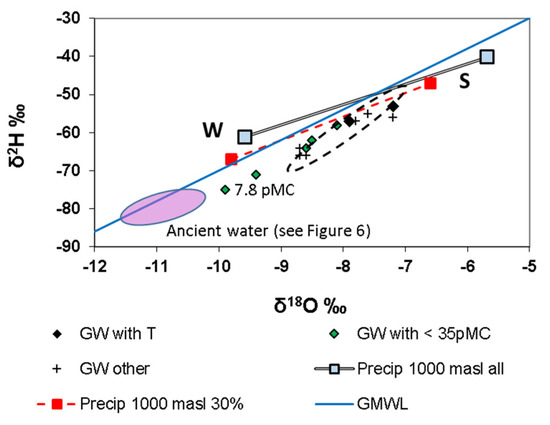
3.7. Groundwater, Tucson Mts
The Tucson Mts. are of lower elevation and have lower precipitation than the other ranges surrounding Tucson Basin. Samples were taken from domestic wells and from one spring, all in hard rock. Values of (δ18O, δ2H) (Supplementary Table S2) form a linear array approximately parallel to and to the right of the GMWL (Figure 7). Samples that contain finite tritium plot at the upper end of the trend, while the oldest sample, containing 7.8 pMC, plots at the lower end. This suggests a relationship between stable O and H isotopes and groundwater residence time, although the age distribution (indicated approximately by uncorrected pMC) is complex in the middle of the array. Values of (δ18O, δ2H) at the upper end of the trend fit a modified LMWL for the wettest 30% of months at 1000 masl, rather than the LMWL for all data (both lines interpolated between UA and PRS altitudes). A precipitation intensity effect operates on recent recharge, which arises equally from winter and summer precipitation, or predominantly from summer precipitation. The lower end of the array indicates ancient recharge at a time of lower (δ18O, δ2H) in average precipitation.
3.8. Groundwater, Santa Rita Mts
Data for springs higher than 1800 masl on the Mt. Wrightson massif (Figure 8) plot on the LMWL for precipitation at PRS, between summer and winter means, with no indication of evaporation. The range of δ18O is similar over about 800 m of altitude. All samples in which tritium was measured contain finite tritium (Supplementary Table S2). In this case, all recharge may occur at the range crest, with approximately equal winter and summer contributions.
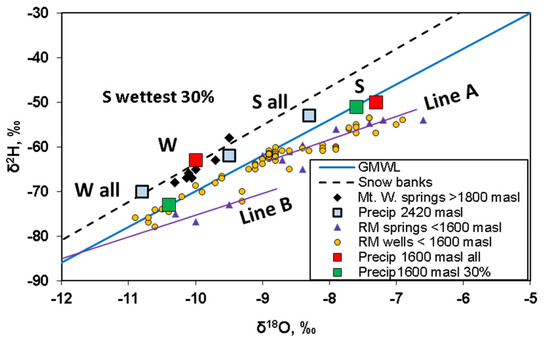
Figure 8.
δ2H vs. δ18O in groundwater (GW) from the Santa Rita Mts. Also shown are long-term amount-weighted mean data for precipitation for Tucson Basin (Figure 3 and Figure 4); “30% wettest” denotes mean data for the wettest 30% of summer and winter months, adjusted for altitude. Lines A and B are suggested evaporation trends of slope 4. Data sources: this study, [33]. W = winter, S = summer.
Data from Rosemont, for wells and springs below 1600 masl, plot either along a line passing through weighted-mean averages of (δ18O, δ2H) for the wettest 30% of months at 1600 masl (which is close to collinear with the GMWL), or to the right of that line. Most data form a cluster with a corresponding evaporation trend (line A in Figure 8, slope 4), and are consistent with about-equal contributions of summer and winter recharge. A few data points suggest predominant winter recharge but may also reflect mixing with ancient recharge. The field of data is delimited downward by an evaporation trend (line B), which appears to be related to the data for ancient water in Figure 6. No 14C measurements are available for this data set.
3.9. Groundwater, Galiuro Mts
Most samples taken in 1994 plot along an evaporation trend of slope near 4 (Figure 9). Care was taken to avoid water that might have evaporated since discharge. A few samples, including Hooker Hot Springs, plot along the GMWL. Samples taken in 1982 [37] plot close to the evaporation trend. Samples taken in 2012 at Upper and Lower Ash Springs plot closer to the GMWL. Other springs that might have been re-sampled proved to be dry in 2012. Most samples taken in 1994 contained finite tritium, between 1 and 6 TU, at the time of sampling. A sample from Hooker Hot Spring contained tritium below detection, and 17 pMC.
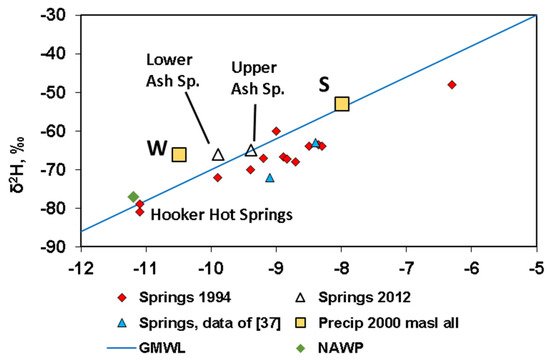
Figure 9.
δ2H vs. δ18O in groundwater (GW) from the Galiuro Mts. Also shown are long-term amount-weighted mean data for precipitation based on data for Tucson Basin, all events (Figure 3 and Figure 4), adjusted for altitude. NAWP = Northern Arizona winter precipitation, independent of altitude effect [45,56] The dashed line is a suggested evaporation trend of slope 4. Data sources: this study; [37]. W = winter, S = summer.
The data are consistent with two main recharge mechanisms in the range. Cold groundwater of decadal residence time, evaporated prior to infiltration, originated as recharge plotting below present mean winter precipitation at 2000 masl (based on Tucson Basin data) but resembling mean winter precipitation that has no altitude effect in Northern Arizona [45,56]. By 2012, this recharge regime may no longer have operated in the catchments of Upper and Lower Ash Springs. At Hooker Hot Springs at the south end of the range, hot groundwater of long residence time, probably thousands of years, was not evaporated prior to recharge and flows through a deeper fracture system.
3.10. Groundwater Mogollon Highlands
Groundwater from an area between the lower flanks of the Mogollon Rim and the Town of Payson yielded (δ18O, δ2H) data forming a linear evaporation trend of slope 5 (Figure 10), and show no relationship to altitude [40]. Samples with δ18O > −10‰ are affected by recharge of treated water from the Payson Town Lake. The data trend is closely similar to trends for alluvial basins in Northwestern Arizona and for major rivers that rise along the Mogollon Rim. Such trends originate in regional mean winter precipitation that has no altitude effect in Northern Arizona [45,56].
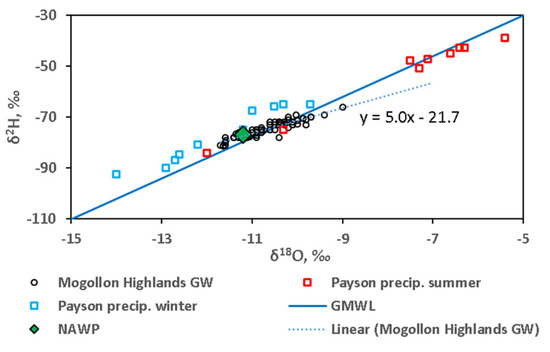
Figure 10.
δ2H vs. δ18O in groundwater (GW) from the Mogollon Highlands. Also shown are seasonal amount-weighted mean data for precipitation. NAWP = Northern Arizona winter precipitation, independent of altitude effect [45,56] Data source [40].
3.11. Groundwater, Sacramento Mts
The data (Figure 11) represent springs and precipitation sampled in 2006–2009, which were wetter than average years [16], and springs and wells sampled in 2003, following several dry years [17]. All samples are from carbonate-dominated strata.
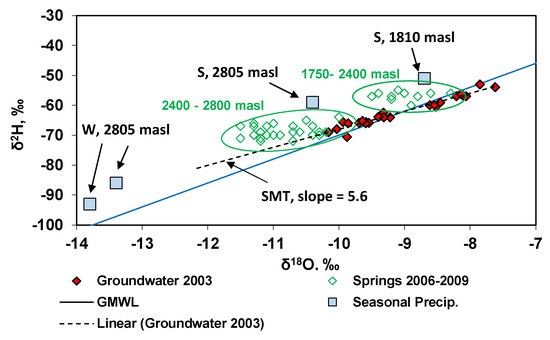
Figure 11.
δ2H vs. δ18O in groundwater (GW) from the Sacramento Mts., differentiated by time of sampling and by altitude (2006−2009 samples only). Also shown are seasonal amount-weighted mean data for precipitation in summer 2007, and winter 2007–2008, collection altitudes indicated. SMT = Sacramento Mts. trend, a suggested evaporation trend. Data sources: groundwater [16,17]; precipitation [16]. W = winter, S = summer.
Data collected in 2003 from springs and wells at 1750 to 2550 masl form a linear trend (SMT) of slope 5.6, consistent with evaporated winter precipitation (measured later, in 2007 and 2008) as the principal source of recharge. The slope is high for an evaporation trend and may be influenced by summer recharge. Summer recharge is clearly present during 2006–2009, when the data for springs discharging between 1750 and 2400 masl form an array stretching between the SMT and summer precipitation. Discharge from springs between 2400 and 2800 masl form a second array stretching between the SMT and a mixture of summer and winter precipitation. The groundwater system is dynamic, susceptible to change in isotope content at annual time scales. Winter recharge with evaporation dominates at all altitudes above 1750 masl in dry years, but in years when above-average summer rainfall occurs, summer recharge appears in groundwater.
3.12. Seasonality of Mountain-front Recharge, Tucson Basin
Water from the Santa Catalina and Rincon Mts. is supplied to Tucson basin by three major catchments: Rillito Creek, Cañada del Oro and Rincon Creek (Figure 12a). Mountain-front recharge occurs at distances up to 10 km from range fronts [44]. Recharge occurs mainly during the wettest 30% of months [45].
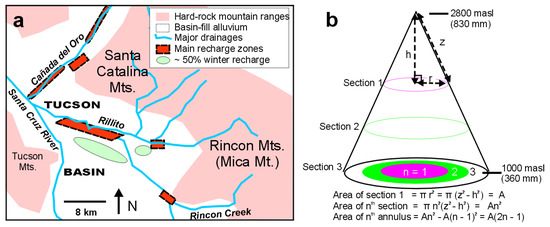
Figure 12.
(a). Map of Tucson Basin, after [44], showing principal drainages, major recharge zones as indicated by tritium, and zones with 50% winter recharge. (b). Sketch diagram of the conical model of a mountain range divided into three layers.
Assumptions for the re-evaluation are: (1) that precipitation amount and isotope lapse rates are linear functions of altitude, established by data for the UA and PRS sites, and (2) that runoff from any altitude has the same likelihood of reaching the basin floor. Therefore, the bulk isotope content of runoff from the mountain block is the isotope content of precipitation at some altitude A, above and below which the volume of precipitation is the same. Altitude A is determined by considering each mountain range as a cone divided into n equally spaced layers (Figure 12b). The results for a pyramid, or for intersecting cones and pyramids are identical to those for the cone, and do not depend on apical angle. Each layer has an interpolated annual precipitation amount and an annular footprint area; the volume of precipitation for the layer is the product annular footprint x precipitation (mm). Volumes are summed for all layers above and below a chosen layer. For the Santa Catalina Mts., using 100 layers from 1000 to 2800 masl, altitude A is about 1660 masl (Supplementary Table S4). Interpolated, amount-weighted, seasonal values of (δ18O, δ2H) in precipitation at 1660 masl are compared with groundwater isotope data for the parts of Tucson Basin recharged from mountain runoff (Figure 13).
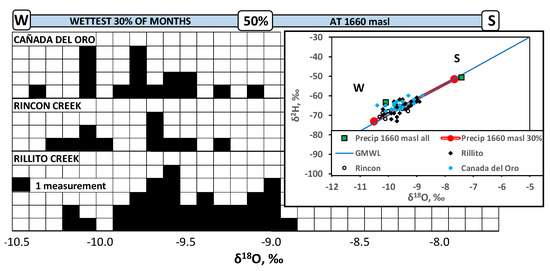
Figure 13.
Frequency histograms of δ18O in groundwater recharged from three major streams in Tucson Basin, compared with the δ18O range of amount-weighted seasonal mean precipitation for the wettest 30% of months at an attitude of 1660 masl (blue bar). Only samples containing less than 1.5 TU [44] are plotted. W = winter, S = summer. Inset: δ2H vs. δ18O for the groundwater samples plotted in the histograms, after [44,45], with amount-weighted seasonal means for precipitation at 1660 masl. Green symbols indicate means for all data, and red symbols for the wettest 30% of months.
The groundwater data do not conform to the LMWL defined by the seasonal means of all precipitation data at 1660 masl (Figure 5b), but instead fall on a modified LMWL corresponding to the wettest 30% of months at 1660 masl. The modified LMWL was calculated by applying the long-term isotope lapse rates for Tucson Basin (Figure 3a) to the amount-weighted mean isotope compositions for the wettest 30% of months at the UA site (Figure 4). In order to avoid scatter of isotope data in younger, less integrated groundwater, only samples containing less than 1.5 TU were used [44]. In areas recharged from Rincon Creek and Cañada del Oro, winter recharge makes up 75% to 90% of the total. In areas recharged from Rillito Creek, winter recharge constitutes 50% to 75% of the total. Water with about 50% winter recharge (samples in Figure 13 with δ18O ≤ −9.3‰) occurs in discrete areas at some distance from recharge sources (Figure 12a).
4. Discussion
4.1. Residence Times
Where tritium data are available, they indicate the prominence of young groundwater in each of the mountain blocks. Residence times of multiple decades are likely. Ancient groundwater is recognized in certain blocks, either from 14C data or from distinctive stable O and H isotope data. Available 14C data without correction suggest residence times of thousands of years. The shortest residence times are found in the carbonate-dominated aquifers of the Sacramento Mountains, where groundwater isotopes change at a time-scale of 5 years or less.
Contrasting systems of young and ancient groundwater have been distinguished in the Rincon and Galiuro Mts, and possibly in the Rosemont area of the Santa Rita Mts. Except in the Galiuro Mts, there is isotope evidence of mixing between old and young water. Preservation of ancient water in a mountain block is likely to be related to the depth and connectivity of fracture systems. In general, the depth of penetration of groundwater in mountain block aquifers is uncertain. Studies from regions of active tectonics have demonstrated groundwater flow in fractured rock to depths reaching 300 m below the surface [66] and references therein. In the Mont Blanc massif between France and Italy, 1950s or younger recharge has penetrated to a depth exceeding 2000 m on the basis of tritium measurements of water dripping into a highway tunnel [67]. Measurements of 36Cl and tritium in a tunnel within the unsaturated zone at Yucca Mountain, Nevada, USA indicated post-bomb groundwater infiltration along fractures to depths as great as 500 m [68]. The presence of warm water seems consistent with deep flow in the Galiuro Mts. In the Tucson Mts., ancient water is produced from fractured rock up to 170 m below the surface. In the Rosemont area, close juxtaposition of wells producing young and ancient groundwater [33] suggests limited connectivity between sets of fractures.
Climate is also implicated in the persistence of ancient groundwater. O and H isotope data like those for ancient water in this study are interpreted as evidence that ancient water was recharged in the late Pleistocene, at a time of cooler and wetter climate in the Southwest USA [69]. Recharge was more abundant than at present under such conditions. In the low-elevation Tucson Mts., present rainfall may be insufficient to bring about recharge, leading to the dominance of ancient groundwater in much of that mountain block.
4.2. Multiple Recharge Mechanisms
The patterns of stable isotope data described above result from multiple recharge mechanisms affecting young groundwater, in combination with mixing between young and ancient groundwater. The data patterns may be grouped as follows. (i) Data plotting on a modified present-day LMWL defined by seasonal amount-weighted means for the wettest months; (ii) data falling along the present-day LMWL drawn through amount-weighted means for all summer and winter precipitation, and plotting between the means; (iii) data falling along evaporation trends; (iv) data with no relationship to present-day LMWLs or evaporation trends.
Group (i) matches Pattern 2 of groundwater in alluvial basins [45], and process B (Figure 1). It occurs at Rosemont in the Santa Rita Mts., and in recent recharge in the Tucson Mts., in both cases at altitudes below 1700 masl. This data pattern arises when recharge occurs during the wettest 30% (approximately) of months and reflects the loss of surface water to evaporation during drier months. At Rosemont, equal amounts of summer and winter recharge are typical (Figure 8), and in the Tucson Mts., more summer than winter recharge (Figure 7). Mixing of recent recharge with ancient groundwater is indicated in both cases. Groundwater from springs discharging at elevations below 1400 masl in the Santa Catalina Mts. also largely fits this pattern, relative to mean isotope compositions for precipitation at 1400 masl (Figure 5a).
Group (ii) is characteristic of groundwater from elevations above 1800 masl in the Santa Rita and Rincon Mts. (Figure 6 and Figure 8), and matches process A (Figure 1). Precipitation from wettest months at such altitudes is collinear with the LMWL for all precipitation (Figure 6). Both summer and winter recharge are indicated in both ranges, but the proportions remain uncertain because of the collinearity of the LMWL and the modified LMWL, and the possibility of summer recharge mainly during the wettest months.
Group (iii) corresponds to Pattern 1 recharge in alluvial basins of Central and Northwestern Arizona [45] and process C (Figure 1). The pattern reflects recharge of winter precipitation only, typically evaporated, in a region with no altitude dependence of O and H isotopes in winter precipitation. Group (iii) is observed in the Mogollon Highlands (Figure 10) and the Galiuro Mts. until 1996, but possibly not since 2012 (Figure 9). In both cases, the evaporation trend passes through the point (δ18O, δ2H) = (−11.2, −77‰), corresponding to mean winter precipitation in the Pattern 1 region [45]. The persistent evaporation trend in the Sacramento Mts. [17] also originates in winter precipitation, in this case with (δ18O, δ2H) near (−13.5, −87‰); after wet summers, however, isotope compositions move towards the LMWL (Figure 11). The evaporation trend at Rosemont in the Santa Rita Mts. originates in a mixture of summer and winter recharge (Figure 8). The evaporation trend in the Rincon Mts. originates mainly as high-elevation summer precipitation (Figure 7). In both cases, the isotope data are consistent with multiple cycles of infiltration, discharge into streambeds, evaporation and renewed infiltration.
Group (iv) comprises other patterns, and includes ancient groundwaters, as established by 14C data in the Rincon, Tucson and Galiuro Mts. (Figure 6, Figure 7 and Figure 9; Supplementary Table S2). Transmission of such water into basin alluvium (process D of Figure 1) has been documented near the Rincon Mts. [65].
In the Santa Catalina Mts., Group (iv) also includes spring waters from 1400 to 2300 masl (Figure 5a), many of which cannot be derived from long-term mean winter precipitation, regardless of the altitude of recharge (Figure 5b). Precipitation from certain events or seasons (Figure 3b,c) might account for the very low values of (δ18O, δ2H) in springs between 1400 and 2300 masl, but an explanation of that nature is problematic because it requires preferential infiltration of water of extreme isotope composition. A similar infiltration phenomenon was identified, but not satisfactorily explained, in soil water in the Marshall Gulch catchment, at 2300 to 2600 masl in the Santa Catalina Mts. [70]. Infiltration may be favored by progressive wetting of soil during a precipitation season, later precipitation events being more likely to survive evapotranspiration and lead to recharge. However, precipitation events with low (δ18O, δ2H) values occur randomly in both summer or winter rainy seasons in the Santa Catalina Mts. (Supplementary Table S2). Infiltration may also be favored by precipitation intensity (Figure 4b), as explained above. The highest precipitation intensity in summer corresponds with bulk monthly values of (δ18O, δ2H) as low as (−10.3, −67‰) in rainwater, insufficient to explain the observed values in spring water. In winter, precipitation intensity fails as an explanation because highest precipitation intensity corresponds with monthly (δ18O, δ2H) values that are higher than the long-term winter mean.
4.3. Seasonality of Recharge
As in surrounding alluvial basins [45], recharge in mountain blocks is locally dominated by winter precipitation, by summer precipitation, or by subequal mixtures. A particular recharge seasonality may be characteristic of an entire mountain range (e.g., Mogollon Highlands, Galiuro Mts. in the 1990s) or part of a range (Rincon Mts). Alternatively, recharge seasonality may depend upon altitude (Santa Rita Mts., Santa Catalina Mts.). Altitude-dependence may reflect the tendency of winter snow to accumulate in banks and melt in bulk at winter’s end at high altitudes, whereas snow from individual events melts separately throughout winter at lower levels. Such an effect may account for the greater importance of winter infiltration above 2400 masl in the Sacramento Mts. (Figure 11). It may also explain the relative isotope uniformity of spring water (near mean winter precipitation) above 2300 masl in the Santa Catalina Mts., contrasting with the broad range of δ18O at 1400–2300 masl (Figure 5a), but leaves unexplained the implied preferential recharge from low− δ18O events.
4.4. Influence of Geology
All ranges studied consist predominantly of silicate rocks, except for the carbonate-dominated Sacramento Mts. Unhindered infiltration into the highly permeable limestones of the Sacramento Mts. is reflected in the short-term changes in isotope data in that range. Thick soil profiles in typical high-elevation valleys appear to play a role in generating the dry-period evaporation trend in groundwater of the range [17]. A contrast in permeability is present at the crest and on the north slope of the Santa Catalina Mts, where tilted strata overlie less fractured, less permeable granite. Most of the springs of the range discharge from these strata [26]. Whether this geological environment is implicated in the unusual distribution of groundwater isotopes with altitude (Figure 5b) is not known.
The very different isotope patterns in groundwater from the Santa Catalina and Rincon Mts. (Figure 5a and Figure 6) occur in proximate ranges with closely similar lithology. The greater influence of summer recharge in the Rincon Mts. may arise from structural geology, the stepped topography governed by intrusion style at the range crest enhancing retention of summer runoff more effectively than the V-shaped canyons of the Santa Catalina Mts.
In the Tucson Mts., the Galiuro Mts., and the Mt Wrightson massif of the Santa Rita Mts., groundwater is hosted by fractured volcanic rock. In these cases, geology does not appear to impose a single pattern on isotope data in groundwater, and altitude, as discussed above, may be the primary control. The evaporation trend of groundwater in the Galiuro Mts. is like that in the Mogollon Highlands. Both mountain blocks are contiguous with, and behave as part of, a regional zone in North-Central Arizona in which winter recharge is dominant, and no isotope altitude effect is present [45].
4.5. Future Research
The complexity of (δ18O, δ2H) data patterns and recharge mechanisms in the mountain blocks reviewed here stands in sharp contrast to the simpler zonation of neighboring alluvial basins [45]. From the discussion above, it emerges that hydrologic processes in the mountain blocks reflect a complicated interplay of factors including precipitation seasonality, altitude, precipitation intensity, groundwater age and geology. The recharge mechanisms described in this article operate within a small number of mountain blocks that lie within a small portion of the North American Cordillera. In that area, the isotopic distinction between winter and summer precipitation provides a useful means of evaluating groundwater isotope data. Detailed studies of groundwater in other mountain blocks, both in the region of subequal winter and summer precipitation and beyond, will add to the understanding of mountain block hydrogeology. It is impossible to predict, given the complexity of results from the present study, the recharge mechanisms that will operate in neighboring mountain blocks, let alone in more distant examples. Detailed study of each mountain block will be required. Such research will benefit greatly from additional detailed information about isotope lapse rates in precipitation. The two detailed datasets [28,31] for sites in Arizona reveal intricacies that can be resolved only through long-term commitment to the gathering of data.
5. Conclusions
- In 1995–2004, precipitation at 2420 masl at PRS in the Santa Catalina Mts. had seasonal amount-weighted averages of (δ18O, δ2H) and LMWLs as follows: in summer (−8.3, −53‰), and δ2H = 7.0δ18O + 4.2; in winter, (−10.8, −70‰) and δ2H = 8.3δ18O + 20.1. Wetter months have lower (δ18O, δ2H) in summer, but higher (δ18O, δ2H) in winter.
- In 2008–2013, snow-bank samples defined a line δ2H = 9.0δ18O + 26.3; in 2007, isotope metamorphism gave rise to (δ18O, δ2H) values deviating strongly from this line.
- Long-term coefficients for isotope altitude effect (δ18O, δ2H) between Tucson and PRS are (−1.6, −7.7 ‰ per 1000 m) in summer, and (−1.1, −8.9 ‰ per 1000 m) in winter. Altitude effect was absent in 25% of seasons examined.
- Groundwater containing finite tritium predominates in all ranges studied except the Tucson Mts., and is interpreted as young groundwater, or mixtures containing young groundwater. Ancient groundwater, indicated by 14C and distinctive (δ18O, δ2H) data, is present in the Galiuro, Tucson, Rincon and Santa Rita Mts.
- Multiple recharge mechanisms of young groundwater are indicated by patterns of (δ18O, δ2H) data. The patterns are influenced by altitude, geology and mixing with ancient groundwater.
- Regional, zoned recharge mechanisms of neighboring alluvial basins [45] are present in the silicate mountain blocks. Winter-only recharge with evaporation occurs in the Mogollon Highlands and the Galiuro Mts. Infiltration of winter and summer infiltration from the wettest months, in various proportions, occurs below 1700 masl in the Santa Rita and Tucson Mts, and below 1400 masl in the Santa Catalina Mts.
- Additional recharge mechanisms include: (1) infiltration of both winter and summer precipitation in various proportions at high elevations in the Rincon and Santa Rita Mts., yielding (δ18O, δ2H) data plotting along high-altitude LMWLs; (2) Infiltration of high-elevation summer-dominant precipitation, with strong evaporation, in the Rincon Mountains; (3) recharge of water with (δ18O, δ2H) values below those of long-term mean winter precipitation above 1400 masl in the Santa Catalina Mts.; and (4) alternation of winter recharge with evaporation (dry years) and recharge of mixed winter and summer precipitation without evaporation (wet years) in the carbonate rocks of the Sacramento Mts.
- A complex interplay of isotope effects related to altitude, precipitation seasonality, precipitation intensity and groundwater age is responsible for the multiple patterns of isotope data.
- Assuming that mountain runoff from any altitude has an equal likelihood of reaching the basin floor, mountain-front recharge to alluvium in Tucson Basin consists of 50%–90% winter runoff from surrounding mountain blocks.
Supplementary Materials
The following previously unpublished data are available online at https://www.mdpi.com/2076-3263/9/11/461/s1: Isotopes in precipitation at Palisades Ranger Station, Santa Catalina Mts. in Supplementary Table S1; Isotopes in groundwater, with sample location data, in Supplementary Table S2; Isotopes in snowbanks on Mt. Bigelow, Santa Catalina Mts. in Supplementary Table S3. Supplementary Table S4 shows the calculation of average isotope composition in runoff from a conical mountain. Other Supplementary Material gives isotope data for springs in the Huachuca and Chiricahua Mts.
Author Contributions
Conceptualization, C.J.E.; methodology, validation, laboratory analyses C.J.E., W.E.W.; writing—original draft preparation, C.J.E., writing—review and editing, C.J.E., W.E.W.; visualization C.J.E.
Funding
Funding for isotope analyses listed in Supplementary Tables S1–S3 was provided by the Environmental Isotope Laboratory at the University of Arizona, except for analyses of groundwater in the Rincon Mts., which were funded by the U.S. National Parks Service.
Acknowledgments
The authors acknowledge the National Park Service for permission to use data for the Rincon Mts., and numerous private owners for access to their property. The authors are grateful to two anonymous reviewers and the editors for suggestions that improved the quality of the manuscript.
Conflicts of Interest
The authors know of no conflicts of interest related to this work.
References
- Fenneman, N.M. (Ed.) Physiography of Western United States; McGraw Hill: New York, NY, USA, 1931. [Google Scholar]
- Wilson, J.L.; Guan, H. Mountain-block hydrology and mountain front recharge. In Groundwater Recharge in a Desert Environment: The Southwestern United States; Hogan, J.F., Phillips, F.M., Scanlon, B.R., Eds.; American Geophysical Union: Washington, DC, USA, 2004; pp. 113–138. [Google Scholar]
- Katsuyama, M.; Ohte, N.; Kabeya, N. Effects of bedrock permeability on hillslope and riparian groundwater dynamics in a weathered granite catchment. Water Resour. Res. 2005, 41. [Google Scholar] [CrossRef]
- Graham, C.B.; Van Verseveld, W.; Barnard, H.R.; McDonnell, J.J. Estimating the deep seepage component of the hillslope and catchment water balance within a measurement uncertainty framework. Hydrol. Process. 2010, 24, 3631–3647. [Google Scholar] [CrossRef]
- Aishlin, P.; McNamara, J.P. Bedrock infiltration and mountain block recharge accounting using chloride mass balance. Hydrol. Process. 2011, 25, 1934–1948. [Google Scholar] [CrossRef]
- Ajami, H.; Troch, P.A.; Maddock, T., III; Meixner, T.; Eastoe, C. Quantifying mountain block recharge by means of catchment-scale storage-discharge relationships. Wat. Res. Res. 2011, 47, W04504. [Google Scholar] [CrossRef]
- Gabrielli, C.; McDonnell, J.; Jarvis, W. The role of bedrock groundwater in rainfall–runoff response at hillslope and catchment scales. J. Hydrol. 2012, 450, 117–133. [Google Scholar] [CrossRef]
- Dwivedi, R.; Meixner, T.; McIntosh, J.C.; Ferre, P.A.T.; Eastoe, C.J.; Niu, G.-Y.; Minor, R.L.; Barron-Gafford, G.A.; Chorover, J. Hydrologic functioning of the deep Critical Zone and contributions to streamflow in a high elevation catchment: testing of multiple conceptual models. Hydrol. Proc. 2019, 33, 476–494. [Google Scholar] [CrossRef]
- Andrew, H.M.; Douglas, K.S. Constraining mountain-block recharge in eastern Salt Lake Valley, Utah with dissolved noble gas and tritium data. In Groundwater Recharge in a Desert Environment: The Southwestern United States; James, F.H., Fred, M.P., Bridget, R.S., Eds.; American Geophysical Union: Washington, DC, USA, 2004; pp. 139–158. [Google Scholar]
- Thiros, S.A.; Manning, A.H. Quality and sources of ground water used for public supply in Salt Lake Valley, Salt Lake County, Utah, 2001. Available online: https://pubs.usgs.gov/wri/wri034325/ (accessed on 25 October 2019).
- Burgers, C.; Rawoot, F.; Harris, C.; Miller, J. O- and H-isotope record of Cape Town rainfall from 1996 to 2008, and its application to recharge studies of Table Mountain groundwater, South Africa. South Afr. J. Geol. 2010, 113, 33–56. [Google Scholar]
- James, E.; Manga, M.; Rose, T.; Hudson, G. The use of temperature and the isotopes of O, H, C, and noble gases to determine the pattern and spatial extent of groundwater flow. J. Hydrol. 2000, 237, 100–112. [Google Scholar] [CrossRef]
- Isaac, J.W.; Alan, C.R.; Tyler, B.C. The relative contributions of summer and cool-season precipitation to groundwater recharge, Spring Mountains, Nevada, USA. Hydrogeol. J. 1998, 6, 77–93. [Google Scholar]
- Earman, S. Groundwater recharge and movement through mountain-basin systems of the Southwest: a case study in the Chiricahua Mountains-San Bernardino valley system, Arizona and Sonora. Ph.D. Thesis, New Mexico Institute of Mining and Technology, Socorro, New Mexico, USA, 2004. [Google Scholar]
- Wahi, A.K.; Hogan, J.F.; Ekwurzel, B.; Baillie, M.N.; Eastoe, C.J. Geochemical Quantification of Semiarid Mountain Recharge. Ground Water 2008, 46, 414–425. [Google Scholar] [CrossRef]
- Newton, B.T.; Rawling, G.C.; Timmons, S.S.; Land, L.; Johnson, P.S.; Kludt, T.J.; Timmons, J.M. Sacramento Mountains Hydrogeology Study. Available online: https://www.google.com.hk/url?sa=t&rct=j&q=&esrc=s&source=web&cd=1&ved=2ahUKEwi7qpaPyLflAhWFJaYKHfvbCpcQFjAAegQIARAC&url=https%3A%2F%2Fgeoinfo.nmt.edu%2Fpublications%2Fopenfile%2Fdownloads%2F500-599%2F543%2FOFR543_june12_LR.pdf&usg=AOvVaw2Z7X7neXgV6MSeV3C4dl_a (accessed on 25 October 2019).
- Eastoe, C.J.; Rodney, R. Isotopes as Tracers of Water Origin in and Near a Regional Carbonate Aquifer: The Southern Sacramento Mountains, New Mexico. Water 2014, 6, 301–323. [Google Scholar] [CrossRef]
- Dickinson, W.R. The Basin and Range Province as a Composite Extensional Domain. Int. Geol. Rev. 2002, 44, 1–38. [Google Scholar] [CrossRef]
- Richard, S.M.; Shipman, T.C.; Greene, L.C.; Harris, R.C. Estimated depth to bedrock in Arizona. Available online: http://repository.azgs.az.gov/uri_gin/azgs/dlio/584 (accessed on 25 October 2019).
- Anderson, T.W.; Freethey, G.W.; Tucci, P. Geohydrology and water resources of alluvial basins in south-central Arizona and parts of adjacent states. Available online: https://pubs.er.usgs.gov/publication/pp1406B (accessed on 25 October 2019).
- Tillman, F.; Callegary, J.; Nagler, P.; Glenn, E.; Tillman, F.; Callegary, J. A simple method for estimating basin-scale groundwater discharge by vegetation in the basin and range province of Arizona using remote sensing information and geographic information systems. J. Arid. Environ. 2012, 82, 44–52. [Google Scholar] [CrossRef]
- Eastoe, C.; Dettman, D.; Eastoe, C. Isotope amount effects in hydrologic and climate reconstructions of monsoon climates: Implications of some long-term data sets for precipitation. Chem. Geol. 2016, 430, 78–89. [Google Scholar] [CrossRef]
- Eric, R.F. (Ed.) Geology and Mineral Resources of the Santa Catalina Mountains, Southeastern Arizona; The University of Arizona Press: Tucson, AZ, USA, 1997; p. 134. [Google Scholar]
- Bezy, J.V. A Guide to the Geology of Saguaro National Park.; Arizona Geological Survey: Tucson, AZ, USA, 2005; p. 35. [Google Scholar]
- Dickinson, W.R. Geologic framework of the Catalina Foothills, outskirts of Tucson (Pima County, Arizona); Plate 1, East. Arizona Geol. Surv. Contributed Map 1999, CM-99-B, 31. [Google Scholar]
- Cunningham, E.E.B.; Long, A.; Eastoe, C.; Bassett, R.L. Migration of recharge waters downgradient from the Santa Catalina Mountains into the Tucson basin aquifer, Arizona, USA. Hydrogeol. J. 1998, 6, 94–103. [Google Scholar] [CrossRef]
- Olson, M.C. Mountain-front recharge to the Tucson basin from Tanque Verde Canyon, Arizona. Master’s Thesis, The University of Arizona, Tucson, AZ, USA, 1982; p. 124. [Google Scholar]
- Wright, W.E. δD and δ18O in mixed conifer systems in the U.S. Southwest: The potential of δ18O in Pinus ponderosa tree rings as a natural environmental recorder. Ph.D. Thesis, University of Arizona, Tucson, AZ, USA, 2001; 328p. [Google Scholar]
- Desilets, S.L.E.; Ferré, T.P.A.; Ekwurzel, B. Flash flood dynamics and composition in a semiarid mountain watershed. Water Resour. Res. 2008, 44, W12436. [Google Scholar] [CrossRef]
- Desilets, S.L.E.; Lyon, S.W.; Troch, P.A. Characterizing the response of a catchment to an extreme rainfall event using hydrometric and isotopic data. Water Resour. Res. 2008, 44. [Google Scholar] [CrossRef]
- Beisner, K.R.; Paretti, N.V.; Tucci, R.S. Analysis of stable isotope ratios (δ18O and δ2H) in precipitation of the Verde River watershed, Arizona 2003 through 2014. Available online: https://pubs.er.usgs.gov/publication/ofr20161053 (accessed on 25 October 2019).
- Drewes, H. Mesozoic stratigraphy of the Santa Rita Mountains, southeast of Tucson, Arizona. Available online: https://pubs.er.usgs.gov/publication/pp658C (accessed on 25 October 2019).
- Errol L. Montgomery and Associates Inc. Results of Phase 2 Hydrogeologic Investigations and Monitoring Program, Rosemont Project, Pima County, Arizona. Available online: https://www.rosemonteis.us/documents/012065 (accessed on 25 October 2019).
- Drewes, H. New and revised stratigraphic names in the Santa Rita Mountains of southeastern Arizona. Available online: https://pubs.er.usgs.gov/publication/b1274C (accessed on 25 October 2019).
- Johnson, B.J.; Ferguson, C.A. Geologic Map of the Rosemont area, northern Santa Rita Mountains, Pima County, Arizona. Available online: https://www.rosemonteis.us/documents/johnson-ferguson-2007 (accessed on 25 October 2019).
- Creasey, S.C.; Jinks, J.E.; Williams, F.E.; Meeves, H.C.; Davis, W.E. Mineral resources of the Galiuro Wilderness and contiguous further planning areas, Arizona. Available online: https://pubs.er.usgs.gov/publication/b1490 (accessed on 25 October 2019).
- Adar, E. Quantification of Aquifer Recharge Distribution Using Environmental Isotopes and Regional Hydrochemistry. Ph.D. Thesis, The University of Arizona, Tucson, AZ, USA, 1984; p. 250. [Google Scholar]
- Gaeorama, Inc. Geology and Structural Controls of Groundwater, Mogollon Rim Water Resources Management Study. Available online: https://www.usbr.gov/lc/phoenix/reports/mogollonrim/appatt1A.pdf (accessed on 15 February 2019).
- Parker, J.T.C.; Steinkampf, W.C.; Flynn, M.E. Hydrogeology of the Mogollon Highlands, Central Arizona. Available online: https://pubs.er.usgs.gov/publication/sir20045294 (accessed on 25 October 2019).
- Eastoe, C.J. Report on an isotope study of groundwater from the Mogollon Highlands area and adjacent Mogollon Rim, Gila County, Arizona. Available online: https://www.usbr.gov/lc/phoenix/reports/mogollonrim/appatt1C.pdf. (accessed on 15 September 2019).
- Simpson, E.S.; Thorud, D.B.; Friedman, I. Distinguishing seasonal recharge to groundwater by deuterium analysis in southern Arizona. Int. Assoc. Hydrol. Publ. 1970, 92, 112–121. [Google Scholar]
- Kalin, R.M. The hydrogeochemical evolution of the groundwater of the Tucson Basin with application to 3-dimensional groundwater flow modeling. Ph.D. Thesis, University of Arizona, Tucson, AZ, USA, 1994. [Google Scholar]
- Kalin, R.M.; Long, A. Application of Hydrogeochemical Modelling for Validation of Hydrologic Flow Modeling in the Tucson Basin Aquifer, Arizona, United States of America; International Atomic Energy Agency: Vienna, Austria, 1994; pp. 209–254. [Google Scholar]
- Eastoe, C.J.; Gu, A.; Long, A. The origins, ages and flow paths of groundwater in Tucson basin: Results of a study of multiple isotope systems. In Groundwater Recharge in a Desert Environment: The Southwestern; James, F.H., Fred, M.P., Bridget, R.S., Eds.; American Geophysical Union (AGU): Washington, DC, USA, 2004; Volume 9, pp. 217–234. [Google Scholar]
- Eastoe, C.; Towne, D. Regional zonation of groundwater recharge mechanisms in alluvial basins of Arizona: Interpretation of isotope mapping. J. Geochem. Explor. 2018, 194, 134–145. [Google Scholar] [CrossRef]
- Jasechko, S.; Taylor, R.G. Intensive rainfall recharges tropical groundwaters. Environ. Res. Lett. 2015, 10, 124015. [Google Scholar] [CrossRef]
- Abbott, M.; Lini, A.; Bierman, P. δ18O, δD and 3H measurements constrain groundwater recharge patterns in an upland fractured bedrock aquifer, Vermont, USA. J. Hydrol. 2000, 228, 101–112. [Google Scholar] [CrossRef]
- Dansgaard, W. Stable isotopes in precipitation. Tellus 1964, 16, 436–468. [Google Scholar] [CrossRef]
- Clark, I.; Fritz, P.; Michel, F.A.; Souther, J.G. Isotope hydrology and geothermometry of the Mount Meager geothermal area. Can. J. Earth Sci. 1982, 19, 1454–1473. [Google Scholar] [CrossRef]
- Blasch, K.W.; Bryson, J.R. Distinguishing sources of ground water recharge by using δ2H and δ18O. Ground Water. 2007, 45, 294–308. [Google Scholar] [CrossRef]
- Mulch, A.; Chamberlain, C.P. Stable isotope paleoaltimetry in orogenic belts – the silicate record in surface and crustal geological archives. Rev. Mineral. Geochem. 2007, 66, 89–118. [Google Scholar] [CrossRef]
- Kohn, M.J.; Dettman, D.L. Paleoaltimetry from stable isotope compositions of fossils. Rev. Mineral. Geochem 2007, 66, 111–154. [Google Scholar] [CrossRef]
- Poage, M.A.; Chamberlain, C.P. Empirical relationships between elevation and the stable isotope composition of precipitation and surface waters: considerations for studies of paleoelevation change. Am. J. Sci. 2001, 301, 1–15. [Google Scholar] [CrossRef]
- Lechler, A.R.; Niemi, N. Controls on the Spatial Variability of Modern Meteoric 18O: Empirical Constraints from the Western U.S. and East Asia and Implications for Stable Isotope Studies. Am. J. Sci. 2011, 311, 664–700. [Google Scholar] [CrossRef]
- Coplen, T.B. Uses of environmental isotopes. In Regional Ground-Water Quality; Alley, W.M., Ed.; Van Nostrand Reinhold: New York, NY, USA, 1993; pp. 227–254. [Google Scholar]
- Beisner, K.R.; Gray, F. Assessment of Geochemical and Hydrologic Conditions Near Old Yuma Mine in Saguaro National Park, Arizona, 2014–17; U.S. Geological Survey Scientific Investigations Report 2018–5019; U.S. Geological Survey: Reston, VA, USA, 2018; 52p.
- Coplen, T.B. Reporting of stable carbon, hydrogen and oxygen isotopic abundances. Geothermics 1993, 825, 31–34. [Google Scholar] [CrossRef]
- Craig, H. Isotopic variation in meteoric waters. Science 1961, 133, 1702–1703. [Google Scholar] [CrossRef] [PubMed]
- Hughes, C.E.; Crawford, J. A new precipitation weighted method for determining the meteoric water line for hydrological applications demonstrated using Australian and global data. J. Hydrol. 2012, 464, 344–351. [Google Scholar] [CrossRef]
- Earman, S.; Campbell, A.R.; Phillips, F.M.; Newman, B.D. Isotopic exchange between snow and atmospheric water vapor: Estimation of the snowmelt component of groundwater recharge in the southwestern United States. J. Geophys. Res. 2006, 111, D09302. [Google Scholar] [CrossRef]
- Friedman, I.; Benson, C.; Gleason, J. Isotopic changes during snow metamorphism. In Stable Isotope Geochemistry: A Tribute to Samuel Epstein; Taylor, H.P., O’Neill, J.R., Kaplan, I.P., Eds.; Special Publication No.3; The Geochemical Society: San Antonio, TX, USA, 1991; pp. 211–221. [Google Scholar]
- Valentine-Darby, P.; Baril, L.; Struthers, K.; Filippone, C.; Swann, D.; Mathis, A.; Chambers, N. Saguaro National Park Natural Resource Condition Assessment Natural Resource Report NPS/SODN/NRR—2017/1364; National Park Service: Washington, DC, USA, 2017.
- Tucci, R.S. Using isotopes and solute tracers to infer groundwater recharge and flow in the Cienega Creek watershed, SE Arizona. Master’s Thesis, University of Arizona, Tucson, AZ, USA, 2018; 75p. [Google Scholar]
- Smalley, R.S. An isotopic and geochemical investigation of the hydrogeologic and geothermal systems in the Safford Basin, Arizona. Master’s Thesis, University of Arizona, Tucson, AZ, USA, 1983; 85p. [Google Scholar]
- Gu, A. Stable isotope geochemistry of sulfate in groundwater of southern Arizona: Implications for groundwater flow, sulfate sources, and environmental significance. Ph.D. Thesis, University of Arizona, Tucson, AZ, USA, 2005; 256p. [Google Scholar]
- Welch, L.A.; Allen, D.M. Consistency of groundwater flow patterns in mountainous topography: Implications for valley bottom water replenishment and for defining groundwater flow boundaries. Water Resour. Res. 2012, 48. [Google Scholar] [CrossRef]
- Fontes, J.C.; Bortolami, G.C.; Zuppi, G.M. Hydrologie isotopique du massif du Mont-Blanc. In Isotope Hydrology 1978, Proceedings of an International Symposium on Isotope Hydrology; International Atomic Energy Agency: Vienna, Austria, 1978; pp. 411–440. [Google Scholar]
- Flint, A.L.; Flint, L.E.; Kwicklis, E.M.; Gudmundur, S.B.; Fabryka-Martin, J.M. Hydrology of Yucca Mountain, Nevada. Rev. Geophys. 2001, 39, 447–470. [Google Scholar] [CrossRef]
- Phillips, F.M.; Peeters, L.A.; Tansey, M.K.; Davis, S.N. Paleoclimatic Inferences from an Isotopic Investigation of Groundwater in the Central San Juan Basin, New Mexico. Quat. Res. 1986, 26, 179–193. [Google Scholar] [CrossRef]
- Dwivedi, R.; Eastoe, C.J.; Knowles, J.F.; Wright, W.E.; Hamann, L.; Minor, R.; Mitra, B.; Meixner, T.; McIntosh, J.; Ferre, P.A.; et al. Vegetation source water identification using isotopic and hydrometric observations from a subhumid mountain catchment. Ecolhydrol. In press.
© 2019 by the authors. Licensee MDPI, Basel, Switzerland. This article is an open access article distributed under the terms and conditions of the Creative Commons Attribution (CC BY) license (http://creativecommons.org/licenses/by/4.0/).