Abstract
Continental break-up is controlled by several parameters and processes (rheology, inherited structures, magmatism, etc). Their impact, chronology and interactions are still poorly known and debated, particularly when rifting interacts with cratons. In order to better understand the rifting initiation in a cratonic lithosphere, we analysed 22 magnetotelluric (MT) soundings collected along two East-West profiles in two different rift segments of the North Tanzanian Divergence. The North Tanzanian Divergence, where the East African Rift is at its earliest stage, is a remarkable example of the transition between magmatic to amagmatic rifting with two clearly identified segments. Only separated by a hundred kilometers, these segments, Natron (North) and Manyara (South), display contrasted morphological (wide versus narrow), volcanic (many versus a few edifices) and seismic (shallow versus deep activity) signatures. Magnetotelluric profiles across the two segments were inverted with a three-dimensional approach and supplied the resistive structure of the upper lithosphere (down to about 70 km). The Natron segment has a rather conductive lithosphere containing several resistive features (Proterozoic Belt), whereas the Manyara segment displays highly resistive blocks probably of cratonic nature encompassing a conductive structure under the axial valley. The joint interpretation of these models with recent local and regional seismological studies highlights totally different structures and processes involved in the two segments of the North Tanzanian Divergence. We identified contrasted CO2 content, magma upwelling or trapping, in depth regarding the Manyara or the Natron branch and the influence of inherited cratonic structures in the rifting dynamics.
1. Introduction
Initiation of continental rifting is a complex and not yet fully understood phenomenon. The respective roles of regional stress, rheology, magmatism and inherited structures are not clear and are still studied either through data analysis (e.g., seismic refraction [1] or tectonic measurements [2]) or modelling (e.g., Reference [3]). One of the most appropriate candidate to address these issues is the North Tanzanian Divergence (NTD), at the southern end of the Eastern Branch of the East African rift system (EARS) where the earliest stage of continental break-up occurs.
In Northern Tanzania, the southerly-propagating rift interacts with a strong and heterogeneous cratonic lithosphere [4]. Important changes in structural styles and magmatic patterns are observed (Figure 1A [4,5,6,7,8,9,10]) resulting from the interaction between tectonic and magmatic processes. Our study focusses on two segments of the NTD: the Natron and the Manyara rift segments. Separated by the Kilimanjaro Quaternary volcanic belt [5], these two branches, 100 km apart, present contrasted morphotectonic and seismological patterns. In the northern part of the NTD the Natron segment encloses several volcanoes (e.g., Lengai, Gelai). Seismicity is there mainly restricted to the first ∼20 km depth and is partly attributed to dyke emplacement during the 2007 Gelai seismo-volcanic crisis [11] as well as to fluid migration along the border faults [10,12]. In contrast the Manyara southern segment corresponds to a nearly amagmatic rift with only two isolated volcanoes (Hanang and Kwaraha) and a deep seismicity (∼30 km depth), possibly related to fluid flows [13].
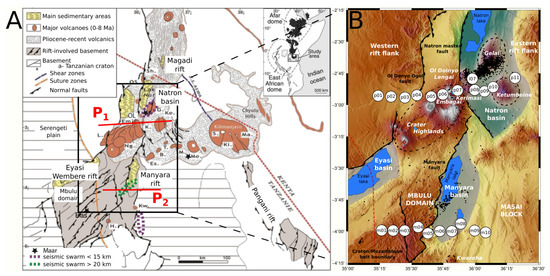
Figure 1.
(A) Main structural and magmatic features of the North Tanzanian Divergence (modified from Le Gall et al. [4]). The red lines P1 and P2 indicate the two magnetotelluric (MT) profiles location. (B) Zoom showing the morphostructural framework (Shuttle Radar Topography Mission (SRTM) Digital Elevation Model) and the two MT profiles (numbered circles). Black dots are the earthquakes from Albaric [14] relocated in a 3-D velocity model [15]. Volcanoes: B. Burko, Em. Embagai, Es. Essimingor, G. Gelai, H. Hanang, K. Kerimasi, Ke. Ketumbeine, Ki. Kibo, Kw. Kwaraha, L. Lemagrut, M. Monduli, Ma. Mawenzi, Me. Meru, Ng. Ngorongoro, Ol. Ol Doinyo Lengai, OS. Ol Doinyo Sambu, P. Pello.
Because of its sensitivity to fluids and melt, magnetotellurics (MT) is a suitable method to investigate volcanic areas at a lithospheric scale. It has been successfully applied in the East African Rift at either crustal or mantle scales (e.g., References [16,17,18,19]). The MT method is used to image underground electrical resistivity variations. Depending on both the time varying electromagnetic fields and the electrical resistivity distribution in the subsurface, the penetration depth of MT varies between hundred of meters to several hundreds of kilometers [20].
We collected new MT data in the NTD along two EW transects, ca. 100 km-long each, to investigate the differences between the Natron and Manyara lithospheric architecture (Figure 1) and to understand how the Natron magmatic segment evolves southward into the almost amagmatic Manyara segment. The 3-D inversion of the MT data along each profile highlights two different rifting patterns. Our results are discussed in terms of CO2 content, melt location, nature/composition of the lithosphere, inherited structures. We also discuss the interactions between those factors and their consequences on rift propagation.
2. Geological Setting
The EARS outlines the boundary between the Somalian and Nubian plates [21]. It extends over more than 3000 km in a NS direction from the Red Sea to the Mozambique margin (Figure 1A). South of the Ethiopian rift, the EARS splits into two branches that encircle the Tanzanian Archean craton. These two branches are mainly located in Proterozoic orogenic belts [4,22,23,24] and strongly differ in terms of magmatism: the western branch is amagmatic, whereas the eastern one is magma-rich. This contrast could rise from their respective location from the African mantle plume [3]. Bagley et al. [25] propose that the shallow structural pattern of the entire Afro-Arabian rift system is strongly influenced by lower mantle flows, which could be deflected and channeled along the Eastern side of the Tanzanian craton [3,26,27].
In northern Tanzania the NS-oriented Magadi-Natron axial rift segment (Figure 1A) displays a typical 50–80 km wide half-graben-like structure caught between the Tanzanian Craton in the West and the Mozambique Belt in the East (Figure 1). Its axial valley infill comprises Pliocene-recent volcanic rocks overlying Proterozoic metamorphic basement terrains [28,29]. At latitude −2° 45 the rift domain widens (100–120 km [4]) through the Ol Doinyo Ogol east-facing half-graben, uplifted in the footwall of the Natron master fault (Figure 1). Several volcanoes are present within this segment including the Gelai (active between 1.5–1 Ma [30]), Kerimasi (active between 0.6–0.32 Ma [31]), Ketumbeine and the still active Ol Doinyo Lengai [11,32]. The crust beneath the axial valley of the Natron segment thins (∼34 km) compared to its eastern flank (Pan-African basement rocks, 39–42 km) and its western flank (Tanzanian craton, 37–38 km [33,34,35]).
Near Ketumbeine volcano, the rift splits southwards into three segments with diverging orientations (Figure 1A): the Eyasi-Wembere, the Manyara-Balangida and the Pangani rift arms. The ∼N-S Manyara segment is pinched between the Mbulu domain (West) and the Masai cratonic block (East) (Figure 1 [4]). The Manyara and Balangida east-facing bounding faults are highly segmented with N20°E- and N50°E-trending segments, the latter following inherited basement fabrics. In contrast with the Natron-Magadi rift, this segment presents only two extinct volcanic edifices (Kwaraha and Hanang, Figure 1) located ca. 40 km south of the Manyara MT profile.
The transition from the Natron magmatic to the Manyara amagmatic segment coincides with the Quaternary volcanic chain running over 200 km along an EW direction from the Crater Highlands to Kilimanjaro volcano (Figure 1 [5,7,31]). The Crater Highlands is a moderate seismically active region composed by a number of Pliocene-Recent eruptive centers [5,9]. Magmatism has migrated from ∼5.9 My to 0.5 My northward and eastward from the Eyasi area with a maximum of activity at about 2.3 My. Plasman et al. [35] and Roecker et al. [36] highlight a clear low-velocity lower crust (∼15–30 km) beneath the Crater Highlands and Gelai areas. This feature has a complex 3-D geometry and does not seem to be fully correlated with the surface location of volcanic edifices.
The seismic activity is also quite different between the Natron and Manyara segments. The Natron branch presents a shallow seismicity (∼20 km), mainly localized under the Lengai and Gelai volcanoes [14] although some earthquakes related to deep fluids/gas activity were recently recorded at greater depths in the lower crust (∼30 km [10,12]). The Manyara-Balangida segment presents a deeper seismicity (∼30 km) clustered South of Lake Manyara without any associated magmatic activity observed at the surface [13,37,38,39].
3. Magnetotelluric Data Acquisition and Processing
The MT data used in this study were collected along two EW profiles, perpendicular to the main axis of the rift (Figure 1A). The 120 km-long northern profile runs across the southern end of the Natron segment and comprises 12 MT sites (Figure 1B). The southern profile extends over 100 km through the Manyara segment and comprises 10 sites (Figure 1B). The average distance between MT sites is ca. 10 km, depending on field accessibility. All MT soundings were recorded with Metronix ADU-07 acquisition systems. The horizontal magnetic field was measured with MFS06 induction coils and the eletric field is the voltage difference between two non-polarizable Pb-PbCl2 electrodes 100 m apart on average. Magnetic and electric fields were recorded along the magnetic North-South and East-West directions during 1 or 2 days resulting in data ranging from 0.0013–2048 s.
The complex MT impedance tensor Z between the horizontal electric field (, ) and the horizontal magnetic field (, ) was computed with the algorithm BIRRP (Bounded Influence Remote Reference Processing [40]). The amplitudes (scaled as apparent resistivity) and phases of the off-diagonal (Zxy and Zyx) and the diagonal (Zxx and Zyy) terms are shown in the Appendix A in Figure A1 and Figure A2 as pseudo sections (a function of the sites position with the period considered as a depth proxy) and in Figure A3 and Figure A4 with the impedance predicted by the best-fitting 3-D model. Examples of MT impedance for both profiles (sites p01 and m06) are presented in Figure 2 as representative of the whole data set quality.
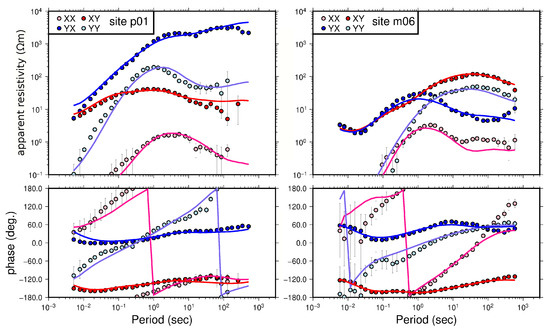
Figure 2.
MT impedance tensor for sites p01 and m06 (northern and southern profiles respectively, see Figure 1B for location). The four complex tensor components are Zxx (pink), Zyy (cyan), Zxy (red) and Zyx (blue) shown as apparent resistivity and phase (dots). The error bars are one standard deviation. Full lines correspond to the response of the best 3-D model. See text for details.
4. Data Analysis and 3-D Inversion
4.1. Geoelectrical Strike
The MT tensor provides structural information that may be characterized by the tensor strike as a function of period. This direction is also called the geoelectrical strike. We used the formalism of Counil et al. [41] to compute this strike. The maximum electrical direction (MED) is the rotation angle assumed to be real for the electric field while the rotation angle of the magnetic field is a complex number. Both rotations maximize (or minimize) the impedance tensor in its off-diagonal form. Thus in 2-D, the MED is period independent and corresponds to the geological strike (or its perpendicular) depending on the resistivity structure underneath. For 3-D structures, the geoelectric strike may change with period, an indication of a possible control by different geological trends. The MEDs at different periods and along both profiles are presented in Figure A5 and Figure A6. The long period MEDs seem to be controlled by the NNE-SSW rift direction, while at shorter periods MEDs seem to be locally controlled by the presence of smaller scale structures and/or pre existing basement directions that will be discussed below. Both the MEDs and the large amplitude of the diagonal components in the MT impedance tensors (Figure 2) indicate 3-D structures at different scales, which required 3-D inversion.
4.2. Three-Dimensional Inversion
Despite the fact that the data were acquired along profiles it is advisable to use 3-D inversion to include the full MT tensor in the analysis, as the tensor strike variability with position and period indicates three-dimensional structures. This approach accounts for some of the heterogeneity on both sides of the profiles [42,43]. It also improves the model at depth (Figure 3) by taking into account the three-dimensionality of the structures.
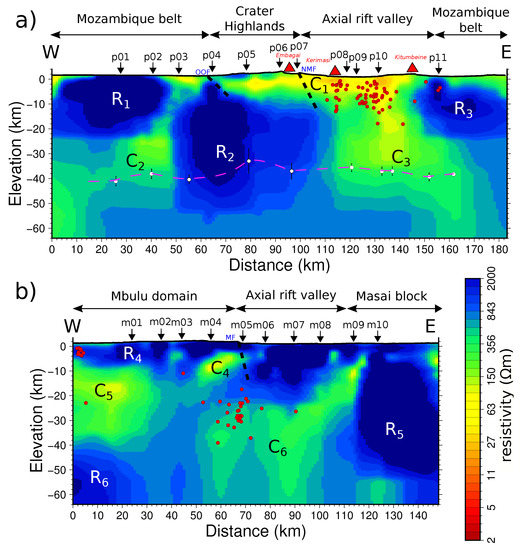
Figure 3.
Electrical resistivity ∼EW cross-sections of the two 3-D resistivity models for the Natron (a) and Manyara (b) profiles. The letters correspond to regions discussed in the text. In (a) the pink dashed line and the white circles indicate the position of the Moho from Plasman et al. [35], only available for the northern profile. Red dots are the earthquakes from Albaric et al. [14] relocated in a 3-D velocity model [15]. OOF: Ol Doinyo Ogol fault, NMF: Natron master fault, MF: Manyara fault.
We applied the full 3-D MT inversion algorithm MINIM3D by Hautot et al. [44,45] to the MT data along each profile. We used the full MT tensor at all available periods and at all available sites. The data error ranges from a minimum error floor of 1.5 of the impedance amplitude for the off-diagonal to the standard deviation obtained from the data processing. The minimum error floor raised to 3% for the diagonal components.
The inversion is based on a local minimum search algorithm derived from Rosenbrock et al. [46] based on a steepest gradient method. The approach allows to easily implement an inversion grid (IG) independent from the forward calculation grid (FCG). The FCG is much finer with adequate boundary conditions for accurate results. In practice, the IG is built by merging several cells of the FCG into larger blocks. The merging takes into account the data distribution and the resolution loss with depth [45]. The minimal cell size is 4.25 km. For both models, we divided the FCG into 15 layers of increasing thickness with depth. In order to optimize the number of unknown parameters, the northern profile grid was 10° N rotated. In the horizontal direction, the northern model FCG is discretized with 10 blocks in the 10° N direction and 32 blocks in the 80° N direction. The southern model FCG is discretized with 10 blocks in the North direction and 26 blocks in the East direction. The average horizontal size of the blocks in the central area is 5 km and 4.5 km for northern and southern profiles, respectively. The final model volume is 90 × 195 × 64 km3 for the northern profile and 81 × 157 × 64 km3 for the southern profile. For both profiles, the initial model was a homogeneous half-space with a resistivity of 300 Ωm.
In the inversion process, we look for a minimum value of the objective function and stop the inversion when this minimum does not change anymore. This is in contrast with other techniques such as in Patro et al. [47] or Gao et al. [48]. With our approach, we are not compelled to adjust the error floor to reach some preassigned RMS values. For the 300 Ωm initial half space starting RMS values were 83.5 for the Northern profile and 74.8 for the Southern profile. Because we used small error floors, the final RMS is in general large, here 3.85 for the Natron model (north) and 4.77 for the Manyara model (south). This is counterbalanced by the fact that most of the four components of the MT tensor are well modelled (examples for both profiles are shown in Figure 2 and for all sites in the Appendix A in Figure A3 and Figure A4).
4.3. Sensitivity Analysis
We carried out a full non linear sensitivity analysis to estimate the model parameters uncertainty in each IG cell of the two vertical sections. We ran the sensitivity analysis (SA) on both profiles (Figure A7 and Figure A8) based on Hautot et al. [44,45] with an improved sensitivity estimator. For each model parameter of a vertical section, we modified its resistivity on a logarithmic scale. When changing one parameter did not change the misfit significantly, we also changed the ones of the adjacent cells. This in general occured for the deepest structures, justifying the large blocks in depth (Figure A7 and Figure A8). We increased (and decreased) the model parameter values until the misfit has changed by a given percentage value of of the best-fitting model RMS. This value is the mean relative data uncertainty. The sections in Figure A7 and Figure A8 represent the variations of the resistivity values in percentage for both profiles and for increasing and decreasing variations. We consider values larger than 100% (in grey) as an indicator for model parameters only weakly constrained by the data. We ran 12 computations per model parameters thus resulting in about 6000–7000 forward calculations per model.
The SA showed that the northern profile is quite well constrained. The MT impedance is more sensitive to changes in high conductivity values than in high resistivity values. Percentage values greater than 100% are observed for high resistive values in the increase mode. It means that the resistivity values are bounded for the lowest values (about 30% for the northern profile and 70% for the most resistive parts) but not for the highest ones. The geometry of the structures are well constrained on the entire profile. A similar conclusion is reached for the southern profile. All the conductive structures are well constrained (both increase and decrease modes) while the resistive structures are more or less constrained for the upper bounds, especially the bottom and the surface of the model. Finally the most resistive structure located east of both profiles is well constrained for both increase and decrease modes.
5. Results and Discussion
5.1. The Northern MT Profile
The resistivity model for the northern profile is presented in Figure 3a. We identify the following main structures:
- -
- a well resolved shallow conductive layer (∼30 Ωm, Figure 3a and Figure A7) of about ∼5 km thick and localized between MT sites p05 and p11. We relate this structure to either a sediment layer representing axial infilling sequences [49,50] or a deep volcanic/sedimentary sequence beneath the Quaternary transverse volcanic belt (Figure 1A [7,31]). We favour the second interpretation in light of the extension of this conductive layer towards the Crater Highlands (through the Embagai and Kerimasi volcanoes, Figure 1 and Figure 3).
- -
- a large resistive structure located between p03 and p07 and observed from the surface down to ∼50 km depth. The SA (Figure A7) shows that only the lower bound of the resistivity is resolved which means that the structure can be more resistive than this value (∼2000 Ωm).
- -
- a shallow (0–∼20 km) resistor () located beneath the Mozambique belt (Figure 1) West of and with a resolved lower bound only for the resistivity value.
- -
- a narrow vertical conductive conduit which links the surface (p03) to a conductive structure located at 30 km depth beneath p02. The SA shows that this feature is resolved (Figure A7).
- -
- a large conductive body in the eastern part of the profile down to the Moho. Its lateral boundaries are well resolved. With depth (∼40 km) the eastern side becomes less resolved. The small variations in the central part of the structure are not well resolved either (∼25 km depth under p10, Figure A7). In contrast the transition between and this structure is well defined. Its width encompasses the whole axial rift valley (between p08–p11).
- -
- a shallow resistive structure located at the easternmost part of the profile (p11) which extends down to ∼25 km depth. Its resistivity value is only a lower bound (Figure A7).
Based on the MT results and previous study [51], we linked the large resistive bodies (, and ) to the Proterozoic basement of the rift. The complex geological history of the Pan-African lithosphere with multiple collisional events [23] makes quite uncertain the boundary between the Tanzanian craton and the Proterozoic at depth. Its surface expression reported in Figure 1 could be shifted west of the Crater Highlands, in agreement with the westward dipping interface imaged between the craton and the neighboring mantle from large-scale tomographic records [52]. The conductive bottom left corner (40–60 km depth, Figure 3a) probably corresponds to the Tanzanian Craton which could be more hydrated than the Proterozoic Mobile belt [51]. The nature and origin of and are discussed later in the article.
5.2. The Southern MT Profile
The resistivity model for the southern profile is shown in Figure 3b. The overall resistivity pattern significantly differs from the northern model, in agreement with the morphological difference observed between the Natron and Manyara segments. Several salient features are observed (Figure 3b):
- -
- a moderate conductive structure located between m04–m08, ranging from 25 to 60 km depth and encompassing the rift valley. Above this conductive feature, the resistivity considerably increases up to the surface. This transition is well resolved (Figure A8). The upper eastern part of is composed by a west-dipping geometry structure, well resolved, reaching ∼5 km depth under m09–m10 (Figure A8).
- -
- a 50 km-thick well resolved resistive unit () in the eastern side of the model, which correlates well with the surface expression of Masai block (Figure 1).
- -
- a 10 km thick resistive area () located on the top of the western part of the model (from m01 to m04) which corresponds to the surface expression of Mbulu domain.
- -
- the structure overlies a conductive body , which extends from 10 to 40 km depth beneath m01 and m02 sites.
- -
- a resistive structure is observed at about 50 km depth in the western corner of the profile. This feature is reasonably well resolved despite its location at the edge of the profile (m01, Figure A8).
- -
- the resistive central and shallow parts of the model (from the surface to 15 km depth) encloses a narrow conductive body between m04–m05 at ca. 10 km depth. From the SA results, a connection of this structure with the other conductive structures and seems possible.
These results provide new constraints on the crustal geometry of the major basement terrains particularly on the Masai block (Figure 1 and Figure 3b). This unit is associated to high resistivity values from the surface down to ∼50 km depth ( structure), suggesting that the Masai block corresponds to a strong and rigid lithosphere that could have obstructed the Cenozoic rifting and the southward propagation of both brittle deformation and magmatism [4,50]. We relate the large resistivity of the crust in the western part and in the axial valley to the Proterozoic Belt and terranes of the Mbulu domain. To the West, the highly deformed Mbulu oblique rifted domain [53] appears as a more conductive medium. It is especially the case on the hanging wall of the Manyara Fault (, Figure 1 and Figure 3b), where the shear zone probably focuses fluids and conductive charges (e.g., graphite) increasing the conductivity of the medium.
5.3. Comparison with Seismology
Factors controlling the electrical resistivity of the rocks are numerous and include temperature, fluids (partial melting, CO2) and hydratation among others [20,54,55]. In the NTD region, the interaction between faults and magmatic processes would probably lead to a complex combination of these factors. In order to determine the origin of the observed resistivity contrasts in the two profiles, we compared our results with recent seismological analyses [13,35,36,56] to help discriminating between a change of temperature or the presence of melt or gas.
At large scale, both crustal [36] and lithospheric seismic tomographies [56] show low velocity anomalies correlated with conductive bodies, as expected when temperature or fluid in the lithosphere controls the geophysical parametres (e.g., References [57,58]). In contrast this correlation is reversed beneath the Crater Highlands where a low velocity anomaly [13,36] coincides with a very resistive zone (, Figure 3a). In general there is a good agreement between the geometry of the main resistivity structures and the major velocity features. However the comparison between these recent published velocity models and our models are limited because of significant differences in terms of resolution or maximum depth investigation. In order to further investigate this correlation between resistivity and velocity patterns, we compared our models with a new local tomography [15], which completes and improves the model of Roecker et al. [36] by including data from a previous network [14] and new data acquired around the Manyara lake (Figure 1, [56]).
We carried out a sensitive analysis on the tomography results to quantify the model resolution and the reliability of the structures discussed later. Two kinds of tests have been performed: checkerboard tests to quantify both the global resolution of the model (lateral and vertical extension) and the minimum resolved anomaly size and spike tests to quantify the resolution of a particular structure. For both tests a synthetic input velocity model is constructed by adding a velocity perturbation to the final tomographic model. The velocity perturbation is ±700 m/s for the P-wave velocity and ±400 m/s for the S-wave (Figure A9). These values are strong enough to get out of the numerical noise level and also small enough to avoid noticeable disturbances in the ray coverage. Then synthetic travel-times are computed [59] in the input velocity models using the source-receiver distribution of the real dataset. A noise term is added to the synthetic data set from a uniform distribution between −0.05 s and 0.05 s. This simulates errors in the arrival times such as for example picking errors. Then the resulting synthetic data-set is inverted using the same procedure and parameterisation that was used for the real dataset. Finally this new velocity model is compared to the input model (with the checkerboard or spike anomalies) to estimate the model resolution with respect to several parameters of the model (e.g., amplitude, location, size and shape of the reconstructed anomalies, earthquake parameters).
Figure A10 presents results from a first checkerboard test with anomalies of 40 km dimension. Anomalies can be clearly and distinctly retrieved until 25 km depth. Then down to 45–50 km, the resolution is still good for the central part of the area (which corresponds to the central part of the northern MT profile). On the contrary, the southern MT profile appears to be located at the edge of the tomography model resolution and a direct comparison will be hazardeous. The Vp/Vs ratio model is computed from the P and S waves (Figure A10) and displays a similar resolution (Figure A11, on the left). Similar global resolution is reached for ∼30 km wide anomalies.
We particularly test the velocity model resolution at R2 and C3 location with spike tests. The velocity of one node has been modified for several depths and the responses are presented in Figure A12. Red lines represent the initial model (with a spike), while blue lines correspond to inversion results. Solid lines correspond to P-wave velocity and dashed lines to S-wave velocity. For R2 structure (Figure A12a), the location in depth of the different spikes is always well retrieved, with however a small smearing with depth, while the recovered amplitude decreases with depth. This means that both location and vertical geometry of velocity anomalies at R2 location are correctly resolved until ∼30 km depth while the velocity amplitude is probably underdetermined compared to the real one. For the lowest Vp/Vs ratio value associated to the C3 structure (Figure A12b), at 35–40 km depth, we retrieve the depth with a small smearing, while the amplitude is underestimated.
The Vp/Vs ratio is sensitive to the bulk composition of the lithosphere [60,61,62]. Low values of Vp/Vs ratio are often related to felsic rock composition (e.g., 1.71 for granite and 1.78 for granodiorite), whereas mafic rocks present a higher ratio (e.g., 1.84 for gabbro). The Vp/Vs ratio increases with the fluid content or partial melt (e.g., Reference [63]). Conversely, the ratio decreases with the presence of gas (e.g., Reference [64]). Both fluids and gas contents produce opposite effects on the electrical resistivity parameter. In general fluids decreases the resistivity while free gas may increase it [65,66].
We extracted two cross-sections from the Vp/Vs ratio model of Gautier et al. [15] (Figure 4) corresponding to the MT profiles (Figure 3). The location of the northern Vp/Vs ratio profile coincides with the MT station distribution. For the southern part, given the position of the MT profile compared to the geographic resolution of the tomography model (Figure A10) we selected an EW profile located 35 km north of the MT profile, where the resolution of the tomography model begins to be acceptable. The 2007 and 2013–2014 seismicity was relocated in this new 3-D velocity model and was reported in the two cross-sections [14,15] as well as in the resistivity models (Figure 3). The approximative contours of the identified electrical structures are reported on the Vp/Vs ratio sections (Figure 4). We also added a mask for non resolved areas, deduced from the checkerboard test (Figure A10 and Figure A11). In general, the northern profile is well resolved until ∼50 km depth for the center part and ∼40 km depth on the edges. The southern profile is well resolved down to ∼45 km depth for the center part and 35–40 km depth for the edges.
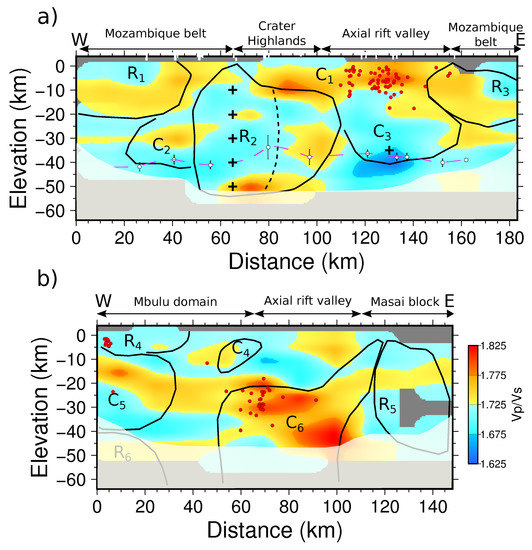
Figure 4.
Vp/Vs ratio vertical sections of the tomography model [15] along the two MT profiles (Natron on the (a) and Manyara on the (b)). Letters corresponds to structures imaged in the resistivity models. Black lines represent the limits of these structures. The pink dashed line and the white circles are the position of the Moho from Plasman et al. [35], only for the northern profile. The red dots are the earthquakes from Albaric et al. [14] relocated in a 3-D velocity model [15]. The white transparent mask delimits non resolved areas (deduced from Figure A10 and Figure A11). Black crosses correspond to the location of spyke tests (see text for explanations).
For the northern region, the Vp/Vs ratio pattern confirms the overall agreement between the distribution of seismic parameters and resistivity. In particular the low Vp/Vs ratio values under the Crater Highland area coincides with the aforementioned low velocity anomaly [35,36,56] and the high resistivity unit (Figure 4a). The highest resistivity values of are not well resolved (Figure A7), meaning that the resistivity decrease from West to East may not be significant. Nevertheless the Vp/Vs ratio profile displays the same east-west trend and thus can reflect a real physical change. For the southern part, despite a shift between the location of the two profiles (∼35 km) the larger resistive anomalies are in reasonable agreement with the distribution of Vp/Vs values. In particular the largest conductive body overlaps a strong high Vp/Vs ratio ratio anomaly, which is also the nucleation site of many earthquakes (Figure 4b).
Because the Vp/Vs ratio and resistivity sections have the same location for the northern profile, we plotted the Vp/Vs ratio as a function of resistivity (in log10) in Figure 5. Each model was sampled with a neighbour interpolation to extract values at the same location. The conductive bodies (, , ) encompass zones of larger Vp/Vs ratio amplitude (∼1.66–1.77), while resistive values spread over more restricted range (∼1.71–1.76). The largest Vp/Vs ratio values are observed for , interpreted as a mix of sedimentary and volcanic deposits. The conductor , located under the axial rift valley is associated with the lowest Vp/Vs ratio values (1.67). The resistive zone corresponds to a Vp/Vs ratio slightly higher than the reference value (1.73), while combines larger (1.76) and smaller (1.69) Vp/Vs ratios. In order to thoroughly explore the dispersion of the Vp/Vs ratio values observed for , we divided the unit in three parts in order to distinguish the western, eastern and lower parts (Figure 6).
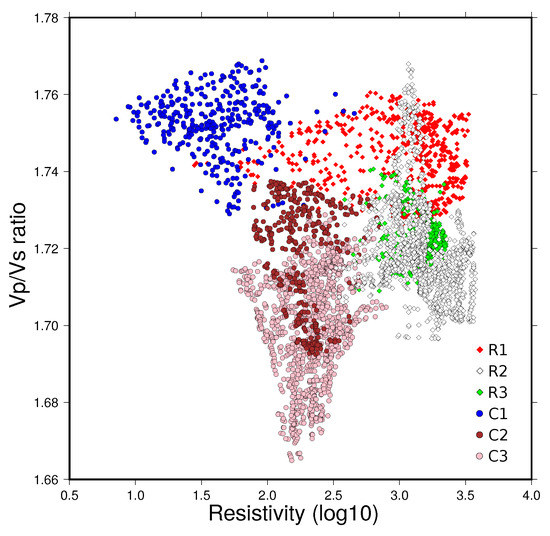
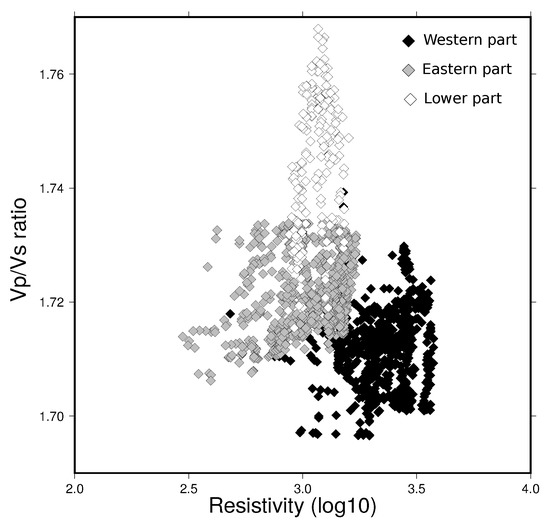
Figure 6.
Vp/Vs ratio vs resistivity values (log10) for the resistive structure (white diamonds in Figure 5). Each color corresponds to a specific portion of , discussed in the text.
Figure 6 points out that the scatter of the Vp/Vs ratio values observed in is related to the lateral and vertical extent of this unit. Down to ∼40 km depth, the lower part of is characterized by higher Vp/Vs ratio values than the upper part of the anomaly. Figure 6 emphasizes the eastward trend with a decrease of the resistivity and a slight increase of the Vp/Vs ratio values. From sensitivity analysis (Figure A11, Figure A12 and Figure 4), body is well resolved. Smearing effect probably artificially increases its size at depth while its amplitude is probably underdetermined. Whatever, the aforementioned change from west to east is clear in both resistivity and Vp/Vs ratio and seems to give evidence for a real pattern.
5.4. Presence of CO2?
The apparent contradiction between a crustal high resistivity, a low velocity and a low Vp/Vs ratio for can be solved by involving free gas such as CO2.
CO2 content strongly decreases the P-wave velocity, mainly because of the increase of the bulk compressibility [67,68,69]. On the contrary, the S-wave velocity is only little affected by CO2 flooding [70] and leads to a decrease of the Vp/Vs ratio [69,71]. For the electrical resistivity, CO2 content has either no effect or increases the resistivity [72,73], depending on the temperature, CO2 fraction and so forth.
Outgassing near the Natron Lake [10] and the composition of the Lengai lava [74] demonstrate the presence of gas, in particular CO2, in the northern part of the studied area. In this context, there is a possibility that the resistivity values of the unit may be related to the gas content as well as the lack of conducting phase such as melt, brine or carbon films (Figure 3a and Figure A7). Particularly beneath the Crater Highland where lays (Figure 3a). CO2 degassing is one of the processes that can produce the low velocity zone in the lower crust associated with a moderate Vp/Vs ratio observed in recent seismic models [35,36]. However, from seismic observations only, it is difficult to favour a CO2 degassing rather than a temperature or composition change [75] or the presence of anisotropy [76]. Our resistivity results partly remove the ambiguity. The presence of high resistive values rejects the melting hypothesis. However compositional effects cannot be ruled out because they are unlikely to significantly change the resistivity if they do not involve a highly conductive phase. The presence of CO2 could be an alternate explanation in agreement with the observed CO2 emission [10].
The structure seems to be associated at the surface with the Ol Doinyo Ogol Fault (OOF) [4,77]. The surface location of the OOF also coincides with crustal thinning observed at depth on the western flank of the rift [35]. This major tectonic structure exhibits a sigmoid trend with an almost EW direction where it meets the MT sites p03–p04 (Figure 1). This particular geometry seems to control the MT tensor distortion at several sites. The MED at p05 (Figure A5 and Figure A6) is NS while it is ∼50° N at p03–p04 (Figure A5 and Figure A6). Our results suggest the extension of the OOF at depth and its interaction with potential CO2 storage in the lower crust (, Figure 3a). Thus we hypothesize that the OOF is a drain for the CO2 outgassing.
If CO2 presence seems to be a plausible explaination for the particular geophysical signature of , its nature and shape at these depths is still uncertain. The apparent lateral widening of the resistive structure at depth (Figure 3a) could have two origins. First, it can come from an artefact from the resolving power of both seismic and MT methods. If the CO2 ascends through drains of small size, such small structures (few kilometers) can not be precisely imaged at these depths (Figure A7, Figure A10 and Figure A11). Instead, an integrated Vp/Vs ratio or resistive medium will be imaged, artificially increasing the size of the anomaly while decreasing its amplitude (Figure A12a). Second, it could correspond to a real structure and not to an artefact from the inversion. A lateral diffusion of the gas is consistent with the extension of low velocities and low Vp/Vs ratio signatures beneath the western part of the Crater Highland. However a CO2 degassing at the surface in the Crater Highland area, as it is the case in West Natron [10,12], can not be ruled out with our models.
In contrast with the northern profile, the different locations and data coverage of the Manyara profiles prevent from a quantitative and accurate comparison between seismic Vp/Vs ratio and resistivity. Nevertheless, seismic parameters and resistivity values in this area display a positive correlation (high resistivity correlated with high velocity and low Vp/Vs ratio) suggesting that the CO2 outgassing is either absent or a minor process in the Manyara branch.
5.5. Tectonic and Magmatism Interactions
The Manyara and Natron rift segments display strong differences in terms of volcanic and seismic activities (Figure 1). Many major volcanoes are present in the Natron segment (e.g., Crater Highlands area, Lengai, Ketumbeine, Gelai) while only two discrete edifices (Hanang and Kwahara) are found in the Manyara rift, far away from the MT profile. This discrepancy is also strongly marked at depth with very contrasted geophysical signatures (Figure 3).
The northern MT profile (Natron) starts from the Tanzanian craton limit crosses the Crater Highlands volcanic complex (CHVC, Figure 1) and the axial rift valley (ARV) and ends at the Mozambique belt (p11). The eastern end of the upper part of the body is bordered by the Natron master fault (NMF, Figure 3a). The NMF is well marked in the MEDs (Figure A5) at long periods (sites p07, p08 and p09) and suggests a deep root for this fault (∼15 km).
The shallow conductor (Figure 3a) which spreads from the CHVC to the ARV, may underline a volcanic/sedimentary sequence related to the rifting and volcanic activity over the last million years [7,31]. This conductive structure (30–100 Ωm) is associated with a high Vp/Vs ratio (1.825), a clustered seismicity (Figure 3a and Figure 4a) and low densities [36,56]. This is particularly true beneath the ARV. These observations support the presence of a structure mainly of sedimentary origin but with possible small and confined magma upwelling (e.g., dykes) explaining the seismicity, rather than a large storage of magma in the first ∼10 km. At depth the moderate conductor C3 encompasses the whole rift axial valley. It connects deep structures with the shallow conductor and coincides with moderate low velocity, density [56] and Vp/Vs ratio values (ranging from 1.65 to 1.73). All of these values are inconsistent with large amount of fluids and can rather express small amount of magma distributed along the whole area. From our analysis, there is no evidence for a large melt storage within the crust. Therefore our results suggest a deep mantle source component for the volcanism [78].
Moreover the C3 structure is associated with the lowest Vp/Vs ratio of the northern profile (∼1.63), at the transition between the crust and the mantle (Figure 4). Considering results from the seismic sensitivity analysis (Figure A11 and Figure A12), this feature is well resolved even if potential smearing effect artificially increases the size of the anomaly while decreasing its amplitude. This low Vp/Vs ratio value can reflect the signature of CO2 presence, as we propose for Crater Highlands signature. However, the well resolved conductive value (∼200 Ωm) of C3 challenges this interpretation. Other plausible hypotheses would involve a change in the expression of the CO2 (e.g., nature, medium saturation [79,80]) or variation of the lithospheric bulk composition [60,61,62].
The Crater Highlands overlay the eastern part of the resistive structure located between 10–50 km depth (Figure 3a). This part of the structure is more conductive than its western part (beneath p03–p05). The upper bound values are not resolved for the whole structure given its rather resistive signature. However its lower bound is resolved (values and geometry, Figure A7). This area is also characterized by a heterogeneous distribution of Vp/Vs ratio values reaching high value (∼1.75) (Figure 4a and Figure 6). Considering tomography sensitivity analysis results (Figure A11 and Figure A12) these structures probably exist but their size and amplitude may be respectively over (smearing effect) and under determined. This contrast between the eastern and western part of the Crater Highlands area has been highlighted by Plasman et al. [35] and Roecker et al. [36] who imaged a different signature between these two areas. Nevertheless they do not give conclusive explanations. One possibility would involve the hypothesis of an east-west evolution in the fluids and CO2 content. The CO2 concentration increases westward, up to the conduit outlet (i.e., OOF fault), creating the high resistive and low Vp/Vs ratio signature, while melt or fluids increases eastward up to the ARV region, leading to lower resistive values and patchs of higher Vp/Vs ratio values. We explain the resistive nature of the eastern part of by either a small amount of melt within the crust beneath the Crater Highland or distributed melt through crustal sills or dykes. We favour the second hypothesis, which is consistent with the complex and layered crustal structure deduced from receiver function analysis [35]. The resistivity decreases with depth to reach a minimum value below the Moho, which exhibits a localized uplift and a high Vp/Vs ratio beneath p05 (Figure 3a and Figure 4a). These results seems to confirm a larger melt concentration within the mantle beneath the NTD, rather than in the crust [35].
The southern profile, across the Manyara rift, is located 30 km north from the nearest Kwahara and Hanang volcanoes (Figure 1). The MT crustal signature is attributed to a much more reduced volume of magmatism compared to the Natron segment. We observe a conductive structure beneath the rift valley ( Figure 3b) deeper than for the northern profile (20–50 km in depth). This conductor is overlaid by a thick resistive layer. The conductor is also characterised by a large Vp/Vs ratio (1.80, Figure 4b). The top of this structure coincides with the location of earthquakes hypocenters [15] that point out the existence of a magmatic zone from which hot material could rise. The highly alkalin magma from the Hanang volcano (Figure 1) displays ∼7% CO2 and ∼0.5% H2O [81]. Deduced from the Sifré et al. [55]’s results, this composition is compatible with a resistivity value of ∼100–150 Ωm at a depth of ∼45 km (1.5 GPa) as observed in the MT model (Figure 3b).
Taking into account the good resolution of the resistivity values in the model (Figure A8), both the channels above , (Figure 3b) and the easternmost shallow conductor exist, suggesting a storage for melt within the deep body. For the west-dipping geometry structure on top of , if a melt origin is plausible, we cannot totally rule out a tectonic component. Indeed this structure is located at the transition between the axial rift valley and the Masai block. This contact could then correspond to a shear zone and be the locus of fluids and conductive phases concentration (e.g., References [82,83,84]). Finally a mixed origin is also a plausible hypothesis with a magma upwelling from the center of along this shear zone. This mixed origin can also be an alternative for which can corresponds to the signature of the Manyara fault and/or a magma upwelling from . The different locations of the resistivity and the Vp/Vs ratio profiles prevents us from confirming the presence of melt. If the hypothesis of magma storage areas hold, then they are not connected to the surface, suggesting a tighter medium as the Mozambique belt than for in the northern profile. The nature of this medium may thus be cratonic [51].
5.6. Western Conductive Crustal Structure
At the westernmost part of both northern and southern profiles, we observe two crustal conductive bodies labelled and (Figure 3). They both start at ∼40 km depth and reach ∼20 km depth for the northern profile and ∼10 km depth for the southern one. Despite their location, these structures are reasonably well resolved (Figure A7 and Figure A8). Such crustal conductive pattern in EAR has been previously pointed out. Several processes have been proposed to explain those anomalous bodies, such as underplated mafic magma complex [85], crustal scale detachments [84] or the brittle-ductile transition [86]. This transition could act as an impermeable barrier to the upward flow of brines trapped in the lower crust. These brines could deposit graphite (e.g., References [83,87]) or sulphide (e.g., Reference [86]) that would cause the conductive bodies. The high content of sulphide in the lower crust could also be the result of Pan-African events [83,84]. The presence of important shear zones resulting in fluid, sulphides and/or graphite accumulations has also been proposed (e.g., References [82,83,84]). However, those shear zones tend to be more vertical and have a narrower impact. None of these hypotheses is totally conclusive. It is worth noting that mid-crustal conductors are also observed in other deformed areas (e.g., Reference [88]) and particularly in rifted provinces [89,90]. Their understanding is yet very poor and includes fluids injection or geochemical changes (e.g., Reference [91]). The C2 body can correspond to geochemical modification or fluid intrusion to connect the west flank of OOF (Figure 1 and Figure 3a).
could also be related to the conductive craton [51] or a conductive phase in a contact zone between the craton and the Mozambique belt. There is no seismic model available at this location to compare with. location coincides with a low velocity zone in Albaric et al. [13] tomographic model, which presents a poor vertical resolution. This structure could actually be related to the Eyasi branch and be similar in nature to or . This interpretation is supported by the fact that the two westernmost MEDs (Figure A5) exhibit a strike similar to the Eyasi rift orientation at all periods. An alternative model would involve a continuous structure from north to south, as there is no data encompassing both locations to rule this hypothesis out. In this scenario, could be the southern extension of the low velocity zone observed beneath the Crater Highland [35,36] and be related to magmatic and rifting process.
6. Conclusions
The North Tanzanian Divergence is characterized by important variations in the surface expression of the rifting processes at the southern extremity of the Eastern branch of the EAR. The Natron segment displays a varied tectonic morphology, associated with a more widely-distributed volcanic activity and a shallower seismicity compared to the Manyara segment (Figure 1). The electrical resistivity models obtained from the 3-D inversion of the MT data along two E-W profiles located in these two rift segments display similar crustal contrasts (Figure 3).
The previous assertion that the magma distribution is controlled by inherited structures [92] is here supported by the recognition of a conductive body () beneath the Manyara rift branch bounded by resistive structures. These strong bodies correspond to the Masai block (), the Mbulu domain () and what seems to be the Tanzanian craton (). We correlate the conductive body to ascending partial melts, the top of which coincides with the deep and long-lasting seismicity at 30 km depth. Our results shed light on the strong control of the inherited fabrics over the magmatic processes, restricted to depth deeper than 10 km in the southern part of the NTD. It results in a discrete distribution of synrift volcanics at the surface and a deeply-clustered seismicity [14,93].
The Natron segment exhibits a different structure where the Proterozoic mobile Belt greatly favours melt upwelling. This results in numerous volcanic edifices along the transverse Quaternary volcanic belt or within the axial trough (Ol Doinyo Lengai, etc.). Our results support this tectonic model with the hypothesis of a melt accumulation zone at ∼40 km depth under the Crater Highlands, potentially connected to the volcanic edifices at the surface by dyke or sills swarms. The joint study of resistivity and Vp/Vs ratio highlights original and spatial correlation between resistive and low-velocity structures, probably related to high CO2 content. It is especially the case in the westernmost part of the rift (west of ) where the Ol Doinyo Ogol fault might act as an outlet for the CO2 release. Then, near the Natron master fault (eastern part of R2) the melt content seems more important than the CO2 one, leading to a change of the electrical and seismic signatures of this eastern part compared to the western one. The melt amount seems maximum under the axial rift valley, where the main conductive structure () links the base of the lithosphere to shallow conductive structures (). Even if the presence of gas is a common feature for both the eastern and western parts of the northern profile [10], our resistivity results clearly show two different magmatic intrusion systems. It could be explained by contrasted plumbing systems, compositional effects or various nature of the surrounding lithospheric rock. Contrasting with the northern part, Manyara segment does not present evidence of CO2 interaction.
Finally, we challenge the generally accepted concept about the influence of inherited structures as “cratonic features acting as a barrier to rift propagation and magmatism” [94]. The presence of a conductive body () beneath Mbulu domain may be the evidence for the propagation of the Eyasi branch throughout the Tanzanian Craton. Inherited structure like the Proterozoic belt seems to act differently in Natron and Manyara; we evidence magma upwelling in the north, while its ascent is blocked in the southern part. In order to explain this apparent paradox, others processes may be involved to either facilitate or prevent rift propagation (shear zone, magma intrusion, etc.). An alternative is that 3-D geometry of units as craton or Proterozoic belt is more complex and differs from its surface expression. Recent study proposes [95] that the Mbulu domain mainly consists of Tanzanian Craton while the Proterozoic Belt only spreads over it as a thin superficial layer. The presence of a cratonic unit for the Manyara area can then more easily explain the magma trapping at depth.
Author Contributions
Conceptualization, M.P., S.H., P.T. and C.T.; Formal analysis, M.P. and S.H.; Funding acquisition, P.T. and C.T.; Investigation, M.P., S.H., P.T., K.M. and R.G.; Methodology, S.H. and S.G.; Project administration, P.T. and C.T.; Supervision, P.T. and C.T.; Writing—original draft, M.P., S.H., P.T. and C.T.; Writing—review & editing, M.P., S.H., P.T., S.G., C.T. and B.L.G.
Funding
We thank three anonymous reviewers and the editor for their constructive remarks. The MT instruments were provided by CNRS-INSU. The MT data were collected thanks to CoLiBrEA (ANR-12-JS06-0004) and Electrolith (ANR-10-BLAN-0621) ANR fundings. We are very grateful for the assistance of Kevin Balem from IUEM and Alfred Muzuka at the Nelson Mandela African Institution for Science and Technology. This work was conducted with approval by the Commission for Science and Technology (COSTECH, Tanzania). We are grateful for logistical support from Tanzania National Parks Commission and to the Ngorongoro Conservation Area which provided full access and authorizations to the sites. We could not have achieved this work without logistical assistance from primary and secondary school teachers throughout the region, the Masai clans in Tanzania, driver-guides from Fortes Tours, Tanapa and the French Ambassy. Then we want to thank Majura Songo and Sindato Moreto and all the colleagues from CoLiBrEA (ANR-12-JS06-0004), Electrolith (ANR-10-BLAN-0621) and Crafti (EAR-1261681) projects.
Conflicts of Interest
The authors declare no conflict of interest.
Appendix A
Appendix A.1. Data
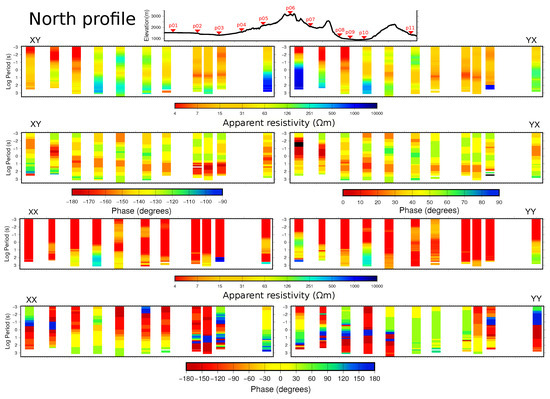
Figure A1.
Northern profile (p01–p11): cross sections of apparent resistivity and phase for the four components of the impedance tensor for all sites.
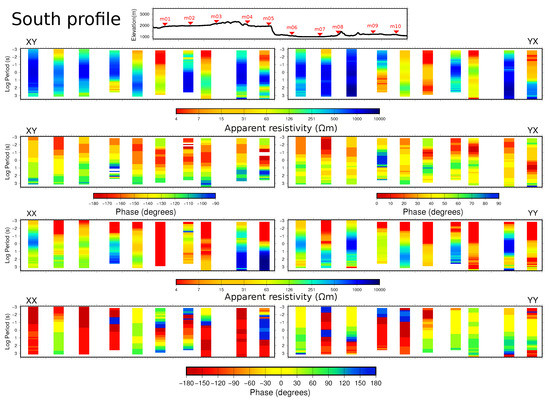
Figure A2.
Southern profile (m01–m10): cross sections of apparent resistivity and phase for the four components of the impedance tensor for all sites.
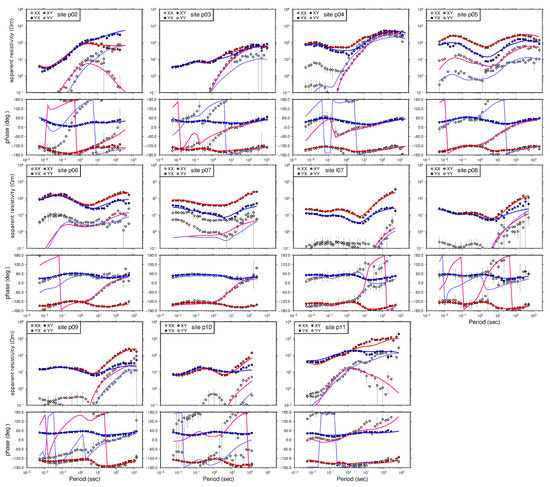
Figure A3.
MT impedance tensor for all northern profile sites (see Figure 1B for location). The four complex tensor components are Zxx (pink), Zyy (cyan), Zxy (red) and Zyx (blue) shown as apparent resistivity and phase (dots). The error bars are one standard deviation. Full lines correspond to the response of the best 3-D model. See text for details.
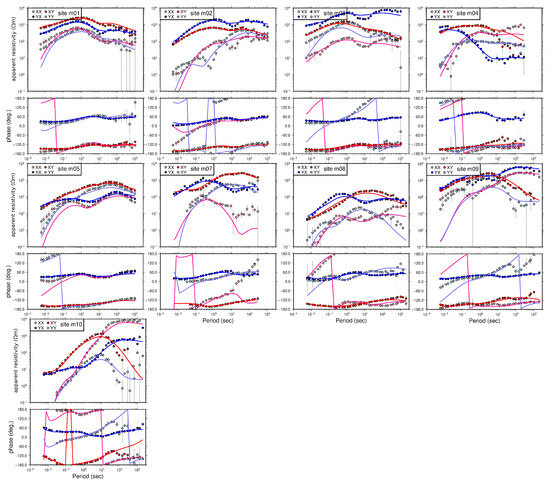
Figure A4.
MT impedance tensor for all southern profile sites (see Figure 1B for location). The four complex tensor components are Zxx (pink), Zyy (cyan), Zxy (red) and Zyx (blue) shown as apparent resistivity and phase (dots). The error bars are one standard deviation. Full lines correspond to the response of the best 3-D model. See text for details.
Appendix A.2. Maximum Electrical Direction
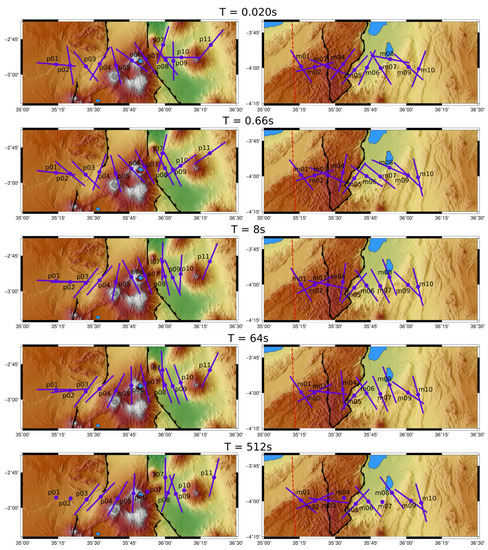
Figure A5.
Maximum electrical direction (MED) for both northern (left) and southern (right) profiles at 5 distinct periods represented on a portion of the Figure 1. See text for details.
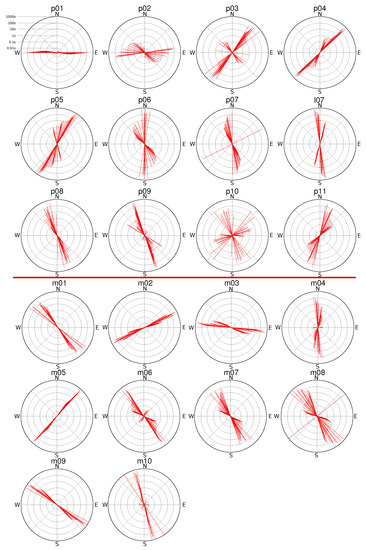
Figure A6.
Rose diagram of the maximum electrical direction (MED) for all periods and all sites of the northern and southern profile. The circles represent the period scale (see diagram for site p01 for more details about the period scale).
Appendix A.3. Sensitivity Analysis
Appendix A.3.1. Electrical Resistivity Model
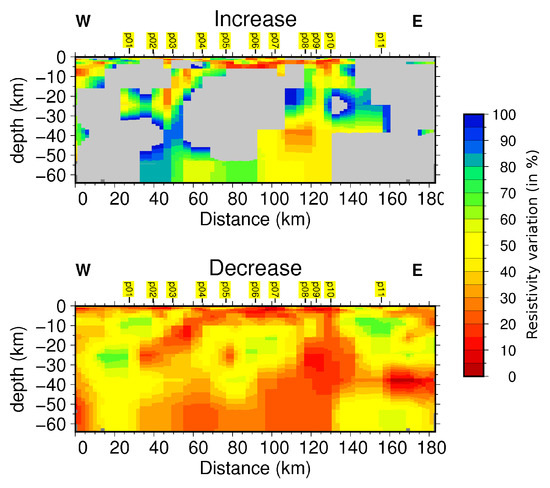
Figure A7.
Results of the sensitivity analysis for the MT northern profile. On the top: increasing resistivity variations. On the bottom: decreasing variations. The grey values represent percentages greater than 100% (badly constrained values). See text for explanations.
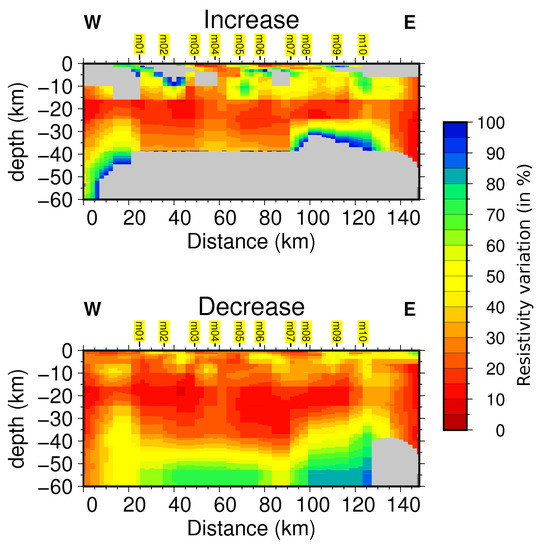
Figure A8.
Results of the sensitivity analysis for the MT southern profile. On the top: increasing resistivity variations. On the bottom: decreasing variations. The grey values represent percentages greater than 100% (badly constrained values). See text for explanations.
Appendix A.3.2. P- and S-Wave Velocity Models
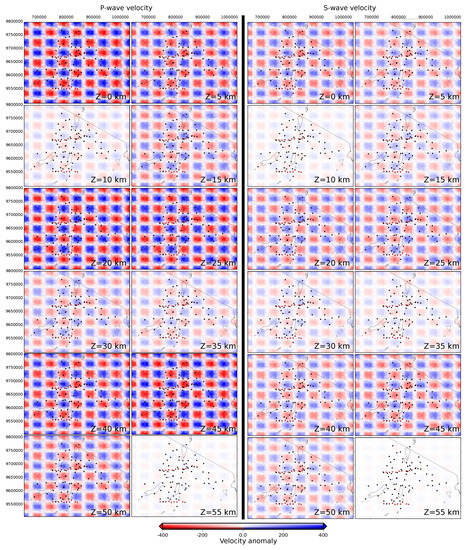
Figure A9.
Geometry and amplitude of the anomalies added on the the final model presented in Figure 4 to build the initial synthetic test for the sensitivity analysis (see text for more explanations). On the left, anomalies for the P-wave velocity model and on the right for the S-wave velocity.
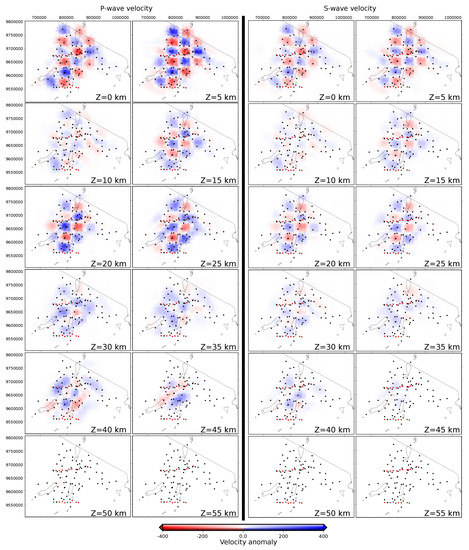
Figure A10.
Results from checkerboard test for the tomography model. On the left results for the P-wave velocity model, on the right for the S-wave velocity. The white color indicates zones not constrained by seismic rays. See text for more explanations.
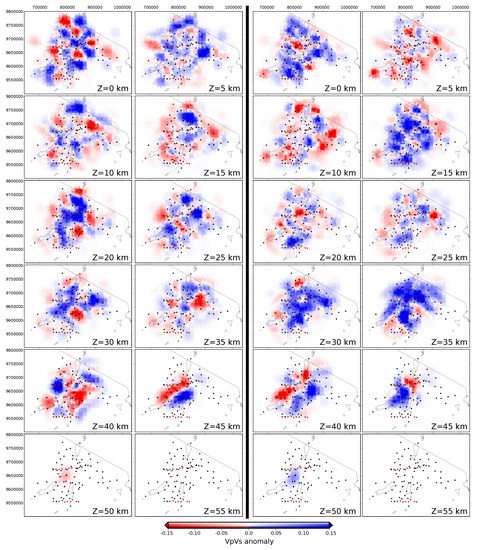
Figure A11.
On the left: Vp/Vs ratio checkerboard test model computed from P- and S-wave velocity model in Figure 3. On the right: Vp/Vs ratio checkerboard test model computed with smaller anomalies. The white color indicates zones not constrained by seismic rays. See text for more explanations.
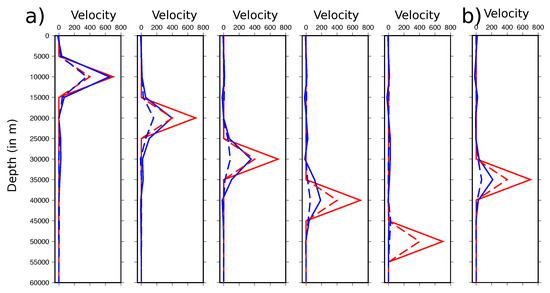
Figure A12.
Results from spyke tests for two different case. We analyzed the resolution of (a) the R2 structure (distance = 65 km on the profile in Figure 4) at different depths (10–20–30–40–50 km). (b) the lowest Vp/Vs ratio value of structure C3 at distance = 130 km and 35 km depth. Red lines corresponds to the initial model while the blue lines are for the inversion results. Solid lines correspond correspond to P-wave velocity and dashed lines for S-wave velocity. See text for explanations.
References
- Prodehl, C.; Fuchs, K.; Mechie, J. Seismic-refraction studies of the Afro-Arabian rift system—A brief review. Tectonophysics 1997, 278, 1–13. [Google Scholar] [CrossRef]
- Corti, G. Continental rift evolution: From rift initiation to incipient break-up in the Main Ethiopian Rift, East Africa. Earth-Sci. Rev. 2009, 96, 1–53. [Google Scholar] [CrossRef]
- Koptev, A.; Calais, E.; Burov, E.; Leroy, S.; Gerya, T. Dual continental rift systems generated by plume-lithosphere interaction. Nat. Geosci. 2015, 8, 388–392. [Google Scholar] [CrossRef]
- Le Gall, B.; Nonnotte, P.; Rolet, J.; Benoit, M.; Guillou, H.; Mousseau-Nonnotte, M.; Albaric, J.; Deverchère, J. Rift propagation at craton margin: Distribution of faulting and volcanism in the North Tanzanian Divergence (East Africa) during Neogene times. Tectonophysics 2008, 448, 1–19. [Google Scholar] [CrossRef]
- Dawson, J. Neogene tectonics and volcanicity in the North Tanzania sector of the Gregory Rift Valley: Contrasts with the Kenya sector. Tectonophysics 1992, 204, 81–92. [Google Scholar] [CrossRef]
- Foster, A.; Ebinger, C.; Mbede, E.; Rex, D. Tectonic development of the northern Tanzanian sector of the East African Rift System. J. Geol. Soc. 1997, 154, 689–700. [Google Scholar] [CrossRef]
- Nonnotte, P.; Guillou, H.; Le Gall, B.; Benoit, M.; Cotten, J.; Scaillet, S. New K–Ar age determinations of Kilimanjaro volcano in the North Tanzanian diverging rift, East Africa. J. Volcanol. Geotherm. Res. 2008, 173, 99–112. [Google Scholar] [CrossRef]
- Ebinger, C.J.; van Wijk, J.; Keir, D. The time scales of continental rifting: Implications for global processes. Geol. Soc. Am. Spec. Pap. 2013, 500, 371–396. [Google Scholar]
- Muirhead, J.D.; Kattenhorn, S.A.; Le Corvec, N. Varying styles of magmatic strain accommodation across the East African Rift. Geochem. Geophys. Geosyst. 2015, 16, 2775–2795. [Google Scholar] [CrossRef]
- Lee, H.; Muirhead, J.D.; Fischer, T.P.; Ebinger, C.J.; Kattenhorn, S.A.; Sharp, Z.D.; Kianji, G. Massive and prolonged deep carbon emissions associated with continental rifting. Nat. Geosci. 2016, 9, 145. [Google Scholar] [CrossRef]
- Calais, E.; d’Oreye, N.; Albaric, J.; Deschamps, A.; Delvaux, D.; Déverchère, J.; Ebinger, C.; Ferdinand, R.W.; Kervyn, F.; Macheyeki, A.S.; et al. Strain accommodation by slow slip and dyking in a youthful continental rift, East Africa. Nature 2008, 456, 783–787. [Google Scholar] [CrossRef] [PubMed]
- Weinstein, A.; Oliva, S.; Ebinger, C.; Roecker, S.; Tiberi, C.; Aman, M.; Lambert, C.; Witkin, E.; Albaric, J.; Gautier, S.; et al. Fault-magma interactions during early continental rifting: Seismicity of the Magadi-Natron-Manyara basins, Africa. Geochem. Geophys. Geosyst. 2017, 18, 3662–3686. [Google Scholar] [CrossRef]
- Albaric, J.; Déverchère, J.; Perrot, J.; Jakovlev, A.; Deschamps, A. Deep crustal earthquakes in North Tanzania, East Africa: Interplay between tectonic and magmatic processes in an incipient rift. Geochem. Geophys. Geosyst. 2014, 15, 374–394. [Google Scholar] [CrossRef]
- Albaric, J.; Perrot, J.; Déverchère, J.; Deschamps, A.; Le Gall, B.; Ferdinand, R.; Petit, C.; Tiberi, C.; Sue, C.; Songo, M. Contrasted seismogenic and rheological behaviours from shallow and deep earthquake sequences in the North Tanzanian Divergence, East Africa. J. Afr. Earth Sci. 2010, 58, 799–811. [Google Scholar] [CrossRef]
- Gautier, S.; Plasman, M.; Tiberi, C.; Lopez, M.; Peyrat, S.; Perrot, J.; Albaric, J.; Déverchère, J.; Deschamps, A.; Ebinger, C.; et al. Interaction between an incipient rift and a cratonic lithosphere: The North Tanzania Rift seen from some seismic tools. In Proceedings of the EGU General Assembly Conference Abstracts, Vienna, Austria, 17–22 April 2016; Volume 18, p. 8935. [Google Scholar]
- Rooney, D.; Hutton, V. A magnetotelluric and magnetovariational study of the Gregory Rift Valley, Kenya. Geophys. J. Int. 1977, 51, 91–119. [Google Scholar] [CrossRef]
- Sakkas, V.; Meju, M.A.; Khan, M.A.; Haak, V.; Simpson, F. Magnetotelluric images of the crustal structure of Chyulu Hills volcanic field, Kenya. Tectonophysics 2002, 346, 169–185. [Google Scholar] [CrossRef]
- Meju, M.A.; Sakkas, V. Heterogeneous crust and upper mantle across southern Kenya and the relationship to surface deformation as inferred from magnetotelluric imaging. J. Geophys. Res. Solid Earth 2007, 112. [Google Scholar] [CrossRef]
- Samrock, F.; Grayver, A.V.; Eysteinsson, H.; Saar, M.O. Magnetotelluric image of transcrustal magmatic system beneath the Tulu Moye geothermal prospect in the Ethiopian Rift. Geophys. Res. Lett. 2018, 45, 12–847. [Google Scholar] [CrossRef]
- Simpson, F.; Bahr, K. Practical Magnetotellurics; Cambridge University Press: Cambridge, UK, 2005. [Google Scholar]
- Calais, E.; Ebinger, C.; Hartnady, C.; Nocquet, J. Kinematics of the East African Rift from GPS and earthquake slip vector data. Geolog. Soc. Lond. Spec. Publ. 2006, 259, 9–22. [Google Scholar] [CrossRef]
- McConnell, R. Geological development of the rift system of eastern Africa. Geol. Soc. Am. Bull. 1972, 83, 2549–2572. [Google Scholar] [CrossRef]
- Smith, M.; Mosley, P. Crustal heterogeneity and basement influence on the development of the Kenya Rift, East Africa. Tectonics 1993, 12, 591–606. [Google Scholar] [CrossRef]
- Simiyu, S.M.; Keller, G.R. An integrated analysis of lithospheric structure across the East African plateau based on gravity anomalies and recent seismic studies. Tectonophysics 1997, 278, 291–313. [Google Scholar] [CrossRef]
- Bagley, B.; Nyblade, A.A. Seismic anisotropy in eastern Africa, mantle flow, and the African superplume. Geophys. Res. Lett. 2013, 40, 1500–1505. [Google Scholar] [CrossRef]
- Koptev, A.; Burov, E.; Calais, E.; Leroy, S.; Gerya, T.; Guillou-Frottier, L.; Cloetingh, S. Contrasted continental rifting via plume-craton interaction: Applications to Central East African Rift. Geosci. Front. 2016, 7, 221–236. [Google Scholar] [CrossRef]
- Koptev, A.; Burov, E.; Gerya, T.; Le Pourhiet, L.; Leroy, S.; Calais, E.; Jolivet, L. Plume-induced continental rifting and break-up in ultra-slow extension context: Insights from 3D numerical modeling. Tectonophysics 2018, 746, 121–137. [Google Scholar] [CrossRef]
- Baker, B.T.; Wohlenberg, J. Structure and evolution of the Kenya Rift Valley. Nature 1971, 229, 538–542. [Google Scholar] [CrossRef] [PubMed]
- Fairhead, J.; Mitchell, J.G.; Williams, L. New K/Ar determinations on rift volcanics of S. Kenya and their bearing on age of rift faulting. Nature 1972, 238, 66–69. [Google Scholar] [CrossRef]
- Evans, A.L.; Fairhead, J.; Mitchell, J. Potassium—Argon ages from the volcanic province of Northern Tanzania. Nat. Phys. Sci. 1971, 229, 19. [Google Scholar] [CrossRef]
- Mana, S.; Furman, T.; Turrin, B.D.; Feigenson, M.D.; Swisher, C.C. Magmatic activity across the East African North Tanzanian Divergence Zone. J. Geol. Soc. 2015, 172, 368–389. [Google Scholar] [CrossRef]
- Baer, G.; Hamiel, Y.; Shamir, G.; Nof, R. Evolution of a magma-driven earthquake swarm and triggering of the nearby Oldoinyo Lengai eruption, as resolved by InSAR, ground observations and elastic modeling, East African Rift, 2007. Earth Planet. Sci. Lett. 2008, 272, 339–352. [Google Scholar] [CrossRef]
- Last, R.J.; Nyblade, A.A.; Langston, C.A.; Owens, T.J. Crustal structure of the East African Plateau from receiver functions and Rayleigh wave phase velocities. J. Geophys. Res. Solid Earth 1997, 102, 24469–24483. [Google Scholar] [CrossRef]
- Dugda, M.T.; Nyblade, A.A.; Julia, J.; Langston, C.A.; Ammon, C.J.; Simiyu, S. Crustal structure in Ethiopia and Kenya from receiver function analysis: Implications for rift development in eastern Africa. J. Geophys. Res. Solid Earth 2005, 110. [Google Scholar] [CrossRef]
- Plasman, M.; Tiberi, C.; Ebinger, C.; Gautier, S.; Albaric, J.; Peyrat, S.; Déverchère, J.; Le Gall, B.; Tarits, P.; Roecker, S.; et al. Lithospheric low-velocity zones associated with a magmatic segment of the Tanzanian Rift, East Africa. Geophys. J. Int. 2017, 210, 465–481. [Google Scholar] [CrossRef]
- Roecker, S.; Ebinger, C.; Tiberi, C.; Mulibo, G.; Ferdinand-Wambura, R.; Mtelela, K.; Kianji, G.; Muzuka, A.; Gautier, S.; Albaric, J.; et al. Subsurface Images of the Eastern Rift, Africa, from the Joint Inversion of Body Waves, Surface Waves, and Gravity: Investigating the Role of Fluids in Early-Stage Continental Rifting. Geophys. J. Int. 2017, 210, 931–950. [Google Scholar] [CrossRef]
- Albaric, J.; Déverchère, J.; Petit, C.; Perrot, J.; Le Gall, B. Crustal rheology and depth distribution of earthquakes: Insights from the central and southern East African Rift System. Tectonophysics 2009, 468, 28–41. [Google Scholar] [CrossRef]
- Mulibo, G.; Nyblade, A. The 1994–1995 Manyara and Kwamtoro earthquake swarms: Variation in the depth extent of seismicity in Northern Tanzania. S. Afr. J.Geol. 2009, 112, 387–404. [Google Scholar] [CrossRef]
- Craig, T.; Jackson, J.; Priestley, K.; McKenzie, D. Earthquake distribution patterns in Africa: Their relationship to variations in lithospheric and geological structure, and their rheological implications. Geophys. J. Int. 2011, 185, 403–434. [Google Scholar] [CrossRef]
- Chave, A.D.; Thomson, D.J. Bounded influence magnetotelluric response function estimation. Geophys. J. Int. 2004, 157, 988–1006. [Google Scholar] [CrossRef]
- Counil, J.; Le Mouel, J.; Menvielle, M. Associate and conjugate directions concepts in magnetotellurics. Ann. Geophys. 1986, 4, 115–130. [Google Scholar]
- Siripunvaraporn, W.; Egbert, G.; Lenbury, Y.; Uyeshima, M. Three-dimensional magnetotelluric inversion: Data-space method. Phys. Earth Planet. Inter. 2005, 150, 3–14. [Google Scholar] [CrossRef]
- Hautot, S.; Tarits, P. 3-D magnetotelluric inversion of 2-D profiles: Application to land and Marine data for shallow crustal investigation. ASEG Ext. Abstr. 2010, 2010, 1–4. [Google Scholar] [CrossRef]
- Hautot, S.; Tarits, P.; Whaler, K.; Le Gall, B.; Tiercelin, J.J.; Le Turdu, C. Deep structure of the Baringo Rift Basin (central Kenya) from three-dimensional magnetotelluric imaging: Implications for rift evolution. J. Geophys. Res. Solid Earth 2000, 105, 23493–23518. [Google Scholar] [CrossRef]
- Hautot, S.; Single, R.; Watson, J.; Harrop, N.; Jerram, D.; Tarits, P.; Whaler, K.; Dawes, D. 3-D magnetotelluric inversion and model validation with gravity data for the investigation of flood basalts and associated volcanic rifted margins. Geophys. J. Int. 2007, 170, 1418–1430. [Google Scholar] [CrossRef]
- Rosenbrock, H. An automatic method for finding the greatest or least value of a function. Comput. J. 1960, 3, 175–184. [Google Scholar] [CrossRef]
- Patro, P.K.; Egbert, G.D. Application of 3D inversion to magnetotelluric profile data from the Deccan Volcanic Province of Western India. Phys. Earth Planet. Inter. 2011, 187, 33–46. [Google Scholar] [CrossRef]
- Gao, J.; Zhang, H.; Zhang, S.; Chen, X.; Cheng, Z.; Jia, X.; Li, S.; Fu, L.; Gao, L.; Xin, H. Three-dimensional magnetotelluric imaging of the geothermal system beneath the Gonghe Basin, Northeast Tibetan Plateau. Geothermics 2018, 76, 15–25. [Google Scholar] [CrossRef]
- Birt, C.; Maguire, P.; Khan, M.; Thybo, H.; Keller, G.R.; Patel, J. The influence of pre-existing structures on the evolution of the southern Kenya Rift Valley—Evidence from seismic and gravity studies. Tectonophysics 1997, 278, 211–242. [Google Scholar] [CrossRef]
- Ebinger, C.; Djomani, Y.P.; Mbede, E.; Foster, A.; Dawson, J. Rifting Archaean lithosphere: The Eyasi-Manyara- Natron rifts, East Africa. J. Geol. Soc. 1997, 154, 947–960. [Google Scholar] [CrossRef]
- Selway, K. Negligible effect of hydrogen content on plate strength in East Africa. Nat. Geosci. 2015, 8, 543–546. [Google Scholar] [CrossRef]
- Mulibo, G.D.; Nyblade, A.A. The P and S wave velocity structure of the mantle beneath eastern Africa and the African superplume anomaly. Geochem. Geophys. Geosyst. 2013, 14, 2696–2715. [Google Scholar] [CrossRef]
- Macheyeki, A.S.; Delvaux, D.; De Batist, M.; Mruma, A. Fault kinematics and tectonic stress in the seismically active Manyara–Dodoma Rift segment in Central Tanzania–Implications for the East African Rift. J. Afr. Earth Sci. 2008, 51, 163–188. [Google Scholar] [CrossRef]
- Gaillard, F.; Malki, M.; Iacono-Marziano, G.; Pichavant, M.; Scaillet, B. Carbonatite melts and electrical conductivity in the asthenosphere. Science 2008, 322, 1363–1365. [Google Scholar] [CrossRef] [PubMed]
- Sifré, D.; Gardés, E.; Massuyeau, M.; Hashim, L.; Hier-Majumder, S.; Gaillard, F. Electrical conductivity during incipient melting in the oceanic low-velocity zone. Nature 2014, 509, 81–85. [Google Scholar] [CrossRef]
- Tiberi, C.; Gautier, S.; Ebinger, C.; Roecker, S.; Plasman, M.; Albaric, J.; Déverchère, J.; Peyrat, S.; Perrot, J.; Wambura, R.F.; et al. Lithospheric modification by extension and magmatism at the craton-orogenic boundary: North Tanzania Divergence, East Africa. Geophys. J. Int. 2018, 216, 1693–1710. [Google Scholar] [CrossRef]
- Marquis, G.; Hyndman, R.D. Geophysical support for aqueous fluids in the deep crust: Seismic and electrical relationships. Geophys. J. Int. 1992, 110, 91–105. [Google Scholar] [CrossRef]
- Meju, M.A.; Gallardo, L.A.; Mohamed, A.K. Evidence for correlation of electrical resistivity and seismic velocity in heterogeneous near-surface materials. Geophys. Res. Lett. 2003, 30. [Google Scholar] [CrossRef]
- Podvin, P.; Lecomte, I. Finite difference computation of traveltimes in very contrasted velocity models: A massively parallel approach and its associated tools. Geophys. J. Int. 1991, 105, 271–284. [Google Scholar] [CrossRef]
- Tatham, R.H. V p/V s and lithology. Geophysics 1982, 47, 336–344. [Google Scholar] [CrossRef]
- Domenico, S.N. Rock lithology and porosity determination from shear and compressional wave velocity. Geophysics 1984, 49, 1188–1195. [Google Scholar] [CrossRef]
- Christensen, N.I. Poisson’s ratio and crustal seismology. J. Geophys. Res. Solid Earth 1996, 101, 3139–3156. [Google Scholar] [CrossRef]
- Watanabe, T. Effects of water and melt on seismic velocities and their application to characterization of seismic reflectors. Geophys. Res. Lett. 1993, 20, 2933–2936. [Google Scholar] [CrossRef]
- Rojas, E.; Davis, T.L.; Batzle, M.; Prasad, M.; Michelena, R.J. V p-V s ratio sensitivity to pressure, fluid, and lithology changes in tight gas sandstones. In SEG Technical Program Expanded Abstracts 2005; Society of Exploration Geophysicists: Tulsa, OK, USA, 2005; pp. 1401–1404. [Google Scholar]
- Kim, J.; Matsuoka, T.; Xue, Z. Monitoring and detecting CO2 injected into water-saturated sandstone with joint seismic and resistivity measurements. Explor. Geophys. 2011, 42, 58–68. [Google Scholar] [CrossRef]
- Riedel, M.; Collett, T.S.; Kim, H.S.; Bahk, J.J.; Kim, J.H.; Ryu, B.J.; Kim, G. Large-scale depositional characteristics of the Ulleung Basin and its impact on electrical resistivity and Archie-parameters for gas hydrate saturation estimates. Mar. Pet. Geol. 2013, 47, 222–235. [Google Scholar] [CrossRef]
- Wang, Z.; Nur, A.M. Effects of CO2 flooding on wave velocities in rocks with hydrocarbons. SPE Reserv. Eng. 1989, 4, 429–436. [Google Scholar] [CrossRef]
- Mavko, G.; Chan, C.; Mukerji, T. Fluid substitution: Estimating changes in Vp without knowing Vs. Geophysics 1995, 60, 1750–1755. [Google Scholar] [CrossRef]
- Harris, J.M.; Langan, R.T.; Fasnacht, T.; Melton, D.; Smith, B.; Sinton, J.; Tan, H. Experimental verification of seismic monitoring of CO2 injection in carbonate reservoirs. In SEG Technical Program Expanded Abstracts 1996; Society of Exploration Geophysicists: Tulsa, OK, USA, 1996; pp. 1870–1872. [Google Scholar]
- Krief, M.; Garat, J.; Stellingwerff, J.; Ventre, J. A petrophysical interpretation using the velocities of P and S waves (full-waveform sonic). Log Anal. 1990, 31. Available online: https://www.onepetro.org/journal-paper/SPWLA-1990-v31n6a2 (accessed on 8 September 2019).
- Foulger, G.; Julian, B.; Pitt, A.; Hill, D.; Malin, P.; Shalev, E. Three-dimensional crustal structure of Long Valley caldera, California, and evidence for the migration of CO2 under Mammoth Mountain. J. Geophys. Res. Solid Earth 2003, 108. [Google Scholar] [CrossRef]
- Fleury, M.; Deschamps, H. Electrical conductivity and viscosity of aqueous NaCl solutions with dissolved CO2. J. Chem. Eng. Data 2008, 53, 2505–2509. [Google Scholar] [CrossRef]
- Schmidt-Hattenberger, C.; Bergmann, P.; Kießling, D.; Krüger, K.; Rücker, C.; Schütt, H.; Group, K. Application of a Vertical Electrical Resistivity Array (VERA) for monitoring CO2 migration at the Ketzin site: First performance evaluation. Energy Procedia 2011, 4, 3363–3370. [Google Scholar] [CrossRef]
- Dawson, J.; Pinkerton, H.; Norton, G.; Pyle, D. Physicochemical properties of alkali carbonatite lavas: Data from the 1988 eruption of Oldoinyo Lengai, Tanzania. Geology 1990, 18, 260–263. [Google Scholar] [CrossRef]
- Julià, J.; Ammon, C.J.; Nyblade, A.A. Evidence for mafic lower crust in Tanzania, East Africa, from joint inversion of receiver functions and Rayleigh wave dispersion velocities. Geophys. J. Int. 2005, 162, 555–569. [Google Scholar] [CrossRef]
- Hammond, J.; Kendall, J.M.; Wookey, J.; Stuart, G.; Keir, D.; Ayele, A. Differentiating flow, melt, or fossil seismic anisotropy beneath Ethiopia. Geochem. Geophys. Geosyst. 2014, 15, 1878–1894. [Google Scholar] [CrossRef]
- MacIntyre, R. Age of fault movements in Tanzanian sector of East African Rift System. Nature 1974, 247, 354–356. [Google Scholar] [CrossRef]
- Baudouin, C.; Parat, F.; Michel, T. CO2-rich phonolitic melt and carbonatite immiscibility in early stage of rifting: Melt inclusions from Hanang volcano (Tanzania). J. Volcanol. Geotherm. Res. 2018, 358, 261–272. [Google Scholar] [CrossRef]
- Archie, G.E. The electrical resistivity log as an aid in determining some reservoir characteristics. Trans. AIME 1942, 146, 54–62. [Google Scholar] [CrossRef]
- Alemu, B.L.; Aker, E.; Soldal, M.; Johnsen, Ø.; Aagaard, P. Effect of sub-core scale heterogeneities on acoustic and electrical properties of a reservoir rock: A CO2 flooding experiment of brine saturated sandstone in a computed tomography scanner. Geophys. Prospect. 2013, 61, 235–250. [Google Scholar] [CrossRef]
- Baudoin, C. Volcanisme Alcalin à L’initiation de la Rupture Continentale. Rift Est Africain, Nord Tanzanie, Bassin de Manyara. Ph.D. Thesis, Université de Montpellier, Montpellier, France, 2016. [Google Scholar]
- Spratt, J.E.; Jones, A.G.; Jackson, V.A.; Collins, L.; Avdeeva, A. Lithospheric geometry of the Wopmay orogen from a Slave craton to Bear Province magnetotelluric transect. J. Geophys. Res. Solid Earth 2009, 114. [Google Scholar] [CrossRef]
- Miensopust, M.P.; Jones, A.G.; Muller, M.R.; Garcia, X.; Evans, R.L. Lithospheric structures and Precambrian terrane boundaries in northeastern Botswana revealed through magnetotelluric profiling as part of the Southern African Magnetotelluric Experiment. J. Geophys. Res. Solid Earth 2011, 116. [Google Scholar] [CrossRef]
- Sarafian, E.; Evans, R.L.; Abdelsalam, M.G.; Atekwana, E.; Elsenbeck, J.; Jones, A.G.; Chikambwe, E. Imaging Precambrian lithospheric structure in Zambia using electromagnetic methods. Gondwana Res. 2018, 54, 38–49. [Google Scholar] [CrossRef]
- Khoza, D.; Jones, A.; Muller, M.; Evans, R.; Webb, S.; Miensopust, M. Tectonic model of the Limpopo belt: Constraints from magnetotelluric data. Precambrian Res. 2013, 226, 143–156. [Google Scholar] [CrossRef]
- Ritter, O.; Weckmann, U.; Vietor, T.; Haak, V. A magnetotelluric study of the Damara Belt in Namibia: 1. Regional scale conductivity anomalies. Phys. Earth Planet. Inter. 2003, 138, 71–90. [Google Scholar] [CrossRef]
- Santos, F.A.M.; Mateus, A.; Almeida, E.P.; Pous, J.; Mendes-Victor, L.A. Are some of the deep crustal conductive features found in SW Iberia caused by graphite? Earth Planet. Sci. Lett. 2002, 201, 353–367. [Google Scholar] [CrossRef]
- Ogawa, Y.; Honkura, Y. Mid-crustal electrical conductors and their correlations to seismicity and deformation at Itoigawa-Shizuoka Tectonic Line, Central Japan. Earth Planets Space 2004, 56, 1285–1291. [Google Scholar] [CrossRef]
- Schmucker, U. Anomalies of geomagnetic variations in the southwestern United States. J. Geomagn. Geoelectr. 1964, 15, 193–221. [Google Scholar] [CrossRef][Green Version]
- Jiracek, G.R.; Ander, M.E.; Holcombe, H.T. Magnetotelluric Soundings of Crustal Conductive Zones in Major Continental Rifts. Rio Grande Rift Tecton. Magmat. 1979, 14, 209–222. [Google Scholar]
- Jiracek, G.R.; Gustafson, E.P.; Mitchell, P.S. Magnetotelluric results opposing magma origin of crustal conductors in the Rio Grande rift. Tectonophysics 1983, 94, 299–326. [Google Scholar] [CrossRef]
- Isola, I.; Mazzarini, F.; Bonini, M.; Corti, G. Spatial variability of volcanic features in early-stage rift settings: The case of the Tanzania Divergence, East African rift system. Terra Nova 2014, 26, 461–468. [Google Scholar] [CrossRef]
- Nyblade, A.A.; Langston, C.A.; Last, R.J.; Birt, C.; Owens, T.J. Seismic experiment reveals rifting of craton in Tanzania. EOS Trans. Am. Geophys. Union 1996, 77, 517–521. [Google Scholar] [CrossRef]
- Currie, C.A.; van Wijk, J. How craton margins are preserved: Insights from geodynamic models. J. Geodyn. 2016, 100, 144–158. [Google Scholar] [CrossRef]
- Fletcher, A.W.; Abdelsalam, M.G.; Emishaw, L.; Atekwana, E.A.; Laó-Dávila, D.A.; Ismail, A. Lithospheric Controls on the Rifting of the Tanzanian Craton at the Eyasi Basin, Eastern Branch of the East African Rift System. Tectonics 2018, 37, 2818–2832. [Google Scholar] [CrossRef]
© 2019 by the authors. Licensee MDPI, Basel, Switzerland. This article is an open access article distributed under the terms and conditions of the Creative Commons Attribution (CC BY) license (http://creativecommons.org/licenses/by/4.0/).