Abstract
A rifted margin can be regarded, in the first place, as a crustal thinning taper framed by “box-shaped” continental and oceanic crusts whose top basement and Moho are parallel. Attempts to understand the relationship between lithosphere extension, crustal thinning and strain localization have been addressed in part by characterizing and modeling rift modes. However, a weakness of models stems from their using generalized physical parameters and initial conditions, while each system is unique in terms of its geological complexity. In this study, we develop a new approach to investigate the relation between crustal shape, the nature of the top basement and the accommodation space to reveal the link between extension, strain localization and crustal thinning in the northern South China Sea (N-SCS). Our results show the following: (1) box-shaped crusts may indicate no or minor extension, or extension compensated by crustal flow and/or magmatic additions; (2) crustal thinning and strain localization occurred through extensional detachment faults coevally during the rifting of the N-SCS; (3) strain localization was triggered or enhanced by magmatic weakening, and the weak crustal rheology at the onset of the rifting favored the formation of detachment faults; and (4) the inherited composition of the crust (magmatic rocks in the arc and meta-sediments in the forearc) controls the distribution of crustal thinning. We propose that the different initial conditions, changes in extension rates and the presence/absence of subduction dynamics account for the different rift evolutions observed in the SCS and Atlantic-type rift systems.
1. Introduction
Successful rift systems initiate as wide and distributed lithosphere deformations before strain and crust and lithosphere thinning localize, leading to lithospheric breakup and the onset of steady-state seafloor spreading [1,2]. A consequence of this evolution is that the final rifted margins take the form of a tapering crust separated continent- and oceanward by “box-shaped” crusts whose top basement and Moho are parallel [3,4]. The first-order evolution and final crustal architecture of rifted margins are relatively well understood, in contrast to the physical conditions (the geothermal, compositional and structural inheritance) prevailing at the onset of rifting (here referred to as the initial conditions). This is supported by kinematic and dynamic models that can reproduce the first-order evolution of rift systems and their final crustal architecture using simple initial and boundary conditions [5,6]. The strength of these models is that they rely on reasonably well-defined physical parameters and use simple initial conditions, which makes them reproducible. However, the assumption of simple initial conditions is also a weakness of these models; they can produce a wide range of rift evolutions depending on the initial and boundary conditions that are used. It is difficult, perhaps impossible, to determine the geological reality both near and deep beneath the subsurface through the modeling of initial conditions. Observational constraints may also be sparse or absent in the form of not only drill hole data, but also due to the non-uniqueness of seismic reflection interpretations, in particular the nature of the top basement, as discussed further in this paper. These limitations have important implications for the evaluation of the mode of extension, strain localization and crustal thinning, which are fundamental to understanding rift processes.
An early attempt to outline the relation between lithosphere extension and crustal thinning was the depth-uniform, pure-shear model of McKenzie [7], in which extension and thinning are linked by the ß factor, where ß is defined as the ratio between the initial and final crustal thickness. However, Kusznir and Karner [8] showed, like many others, that the link between extension, strain localization and crustal thinning may be better described by depth-dependent stretching. Yet in such models the relation between extension, strain localization and crustal/lithospheric thinning is complex and non-unique. This complexity is well illustrated in the northern South China Sea (N-SCS) rift system, which is the focus of the present contribution (Figure 1).
In the past few years, numerous publications have focused on the description of the crustal structure and on the stratigraphic and magmatic evolution linked to crustal thinning in the SCS (e.g., in the Xisha Trough [9] and the Baiyun Subbasin [10]). These studies have highlighted the presence of large-offset detachment systems forming spectacularly imaged metamorphic core complexes (MCCs) [11,12,13]. Some of the recent N-SCS studies have focused on individual parts of the extensional system, such as faults, sediment architecture and facies, and magmatic processes [14,15]. However, a holistic description of the transition from distributed/wide rifting to localized/narrow rifting and a description of the link between extension, strain localization and crustal/lithospheric thinning are still missing.
It is interesting to note major differences not only between the structures of Atlantic- and marginal sea-type rifted margins [2], but also between their evolutions. While in Atlantic-type rifting, the onset of crustal thinning can precede lithospheric breakup by more than 30 My, it preceded by less than 8 My in marginal seas such as the SCS [12,16]. Is this time difference controlled by the initial conditions, i.e., the pre-rift thermal/compositional/structural inheritance prevailing prior to the onset of extension, or by the boundary conditions, such as changes in strain rate during the rifting process? Also, how can these different hypotheses be tested?
This study aims to gain insights into the evolution of the SCS by analyzing extension, strain localization and crustal thinning during rifting, as well as their controlling factors. We propose a new approach to investigate the relation between crustal shape, the nature of the top basement and the accommodation space. We focus on the N-SCS because it is one of the world’s best-observed rifted margins due to the existence of high-resolution seismic profiles and drilling data [17]. Major questions addressed in our study include the following: When and where did the change from distributed to localized extension and crustal thinning occur in the SCS, and what are the processes controlling this evolution? Subsidiary questions include to what extent inheritance and subduction dynamics have controlled the strain distribution, and can either one or both explain the difference in rift evolution between the SCS (i.e., a marginal sea) and Atlantic-type rift systems?
2. Geological Setting
The SCS is one of the largest marginal seas at the southeastern margin of the Eurasian continent (Figure 1A). It initiated with an Andean-type orogenic collapse [18,19,20] that occurred during Mesozoic time and was associated with the flat subduction of the paleo-Pacific plate beneath the South China Block [21,22,23] (Figure 2A). Gilder et al. [24] proposed the term “Basin and Range Tectonics of South China” to describe the geodynamics of the Late Mesozoic in the South China Block. The MCCs and domes, composed of arc-related batholiths, developed during the Mesozoic orogenic collapse and magmatic underplating in the hanging wall of the paleo-Pacific subduction (Figure 2A) [25,26]. The emplacement of large amounts of granitoids that migrated southeastwards [27,28] (Figure 2B) was likely associated with extension in response to slab rollback [23,29].

Figure 1.
Datasets and location of the study area relative to the northern margin of the South China Sea (SCS). (A) Bathymetric map showing the study area in the N-SCS and possible distribution of Mesozoic volcanic arc magma (red hatched pattern) related to the subduction of the paleo-Pacific plate [30]. (B) High-resolution bathymetric map showing the dataset used in this research, including 2D seismic reflection sections (red lines), 3D seismic data covering the Liwan Subbasin (blue polygon), and the drill sites of an oil company and the IODP Expeditions 367/368 (red circle and yellow stars, respectively). The Mesozoic volcanic arc and forearc are delimited by the black dotted line. The lithospheric breakup line (light blue) is after Zhang et al. [31]. (C) Seismic section imaging the whole margin at a crustal scale showing the position of the box-shaped proximal and oceanic domains and intervening tapering domain (see location in Figure 1A). PRMB: Pearl River Mouth Basin; Tb: top of seismic basement; TWT: two-way travel time.

Extension during the Late Cretaceous–Early Paleocene in the proto-SCS realm has been interpreted by Li [32] as a wide rift. When and why a transition from wide to narrow rifting occurred is not well understood, but it preceded the lithospheric breakup that occurred at 30 Ma (Early Oligocene/magnetic anomaly C10r [33,34]; Figure 2C). The N-SCS distal rifted margin connects the South China Block that underwent post-orogenic, wide rift extension to the north and an oceanic domain to the south [24,35,36,37]. As a consequence, the distal N-SCS rifted margin reflects a change in the deformation process both in time and space with domains of markedly distinct deformation modes and ages. This complex evolution is documented by (i) an ultra-wide margin reaching up to 800 km, (ii) a highly heterogeneous basement comprising an igneous arc crust and a (meta-)sediment-rich forearc crust [17,38,39,40], (iii) the occurrence of MCCs with exhumed mid–lower crustal rocks [41,42,43], and (iv) a vigorous syn-rift magmatic activity [15,44,45].
To what extent the rift process can be linked to the geodynamic evolution is unclear (see Figure 2A), as the change from slab rollback to slab pull [46] is not well constrained. Li et al. [30] and Taylor [47] proposed a likely distribution of the Mesozoic volcanic arc related to the subduction of the paleo-Pacific plate, which trends NE-SW (Figure 1B), and suggested that the forearc setting was limited to the central and NE-SCS prior to the onset of extension. As a consequence, the composition, structure and thermal state of the crust and the underlying mantle lithosphere were strongly controlled by subduction inheritance, which likely controlled the crustal/mantle rheology at the onset of rifting [44,48,49].

Figure 2.
The first-order tectonic evolution of the northern SCS region as a function of the plate reorganization (modified from Li et al. [50]). (A) Schematic illustration of the transition from the post-orogenic extension in the South China Block to breakup of the N-SCS showing the main characteristics of their tectonics and magmatism. The N-SCS developed over the Mesozoic volcanic arc and forearc setting related to the flat subduction of the paleo-Pacific plate. Note the diachroneity of the wide rifting. (B) Map showing the southeastward migration of the large amounts of granitoids from the South China Block to N-SCS (modified from Li and Li [27] and Li et al. [28]); likewise, the MCCs and/or magmatic domes marked in orange migrated southeastward. (C) Chronostratigraphic chart showing the age of the major regional unconformities and seismic reflectors in the N-SCS (after Pang et al. [44], Li et al. [11], Zhang Z. et al. [51] and Zhang et al. [31]). PRMB: Pearl River Mouth Basin; OCT: ocean–continent transition.

3. Dataset and Methodology
3.1. Dataset
This study is based on the description and interpretation of seismic reflection profiles, IODP borehole data and present-day crustal basement thickness and isopach maps. The seismic data discussed here includes high-resolution 2D long-cable surveys in the time domain recorded down to 12 s two-way travel time (TWT) and one section from a 3D seismic survey that is depth-migrated. They image the crustal structure and sedimentary sequence along a corridor across the central N-SCS (Figure 1B). The seismic data was acquired by CNOOC from 2002 to 2015. The trace interval for the 2D seismic survey is 6.25 m, and that for the 3D survey is 12.5 m. The 3D seismic data covers the main Liwan Subbasin, with a total surface area of 1600 km2 (Figure 1B), and has been previously published by Zhang et al. [43] and Deng et al. [41]. The seismic profiles passing across the Baiyun Subbasin have been compiled and summarized using published sections by Zhao et al. [10], to which new data, observations and interpretations have been added.
IODP Expeditions 367, 368 and 368X penetrated the seismic basement at six sites, including two (U1501 and U1504) at structural highs in the distal margin, another two (U1499 and U1502) at the ocean–continent transition (OCT) and the remaining two (U1500 and U1503X) at the oceanic crust. Together with the borehole Lw116 located at the Yunli High (Figure 1B), the drilling results are described and correlated with the seismic reflection data.
3.2. Seismic Interpretation Approach
Structures accommodating extension, in particular exhumed detachment faults, are challenging to identify on reflection seismic images due to insufficient seismic resolution and non-unique interpretations. Herein, we provide a short summary of the main constitutive elements that we use, in combination with the crustal shape approach described below, for our interpretation of the N-SCS seismic data.
(1) Stratigraphic framework: In our study we follow the stratigraphic framework of the China National Offshore Oil Company (CNOOC) [44] (Figure 2C). It is based on a large set of seismic observations and drill-hole data and allows the definition of first-order interfaces and isochrones that include Tg, T80, T70 and T60 (Figure 2C). Note that these regional unconformities vary in time/duration along and across strikes. Tg is referred to as the “top of pre-rift stratigraphic horizon” or the “rift-onset unconformity”. The age of Tg ranges between 66 and 56.5 Ma across the N-SCS and is dated as 56.5 Ma in the N-SCS central segment [11]. T80 corresponds to a major unconformity dated as 40–37 Ma (Late Eocene) in the N-SCS central segment. T70 is dated as 34–30 Ma (Early Oligocene) and is superposed by a large global sea level fall that occurred at 34 Ma. T60 is referred to as a major post-rift unconformity in the N-SCS central corridor. Its age ranges between 24.7 and 23.8 Ma.
(2) Nature of the acoustic basement: The acoustic basement flooring the N-SCS is highly heterogeneous. It includes substantial subduction-related Mesozoic granitoids emplaced before 70 Ma along the arc, generating considerable radiogenic heat and contributing to a high heat flow in the arc domain [52,53]. Southeast of the arc lies a former forearc basin comprising thick Mesozoic (meta-)sediments that formed accretionary/collision complexes contiguous with the SE-SCS-to-Palawan/Calamian block [30,54]. Thus, the basement includes former arc and forearc lithologies, indicating an important subduction inherited origin [39,40,55,56], as well as syn-rift magmatic additions [15,57]. The lithospheric mantle may have been depleted beneath the arc, and rifting may have initiated with a high geothermal gradient in the former arc domain. In contrast, the mantle flooring the forearc may have been colder at the onset of rifting.
(3) Syn-rift magmatic additions: The volume of syn-rift magma and its interaction with extensional processes in the SCS remain controversial. One of the reasons may be that rifting was sediment-rich, which may have influenced the emplacement mechanism of magma (e.g., the dykes or laccolith of Sun et al. [45] and Zhang et al. [15]) and renders the identification of magmatic additions difficult.
3.3. Workflow Used to Reconstruct the SCS Crustal Configuration
The first-order architecture of rifted margins can be defined as a crustal taper bounded continent- and oceanward by box-shaped crusts [58]. Mapping the limits/inflection points in the top basement and Moho is the first step in locating and characterizing the crustal taper. The next step is the description of the structures controlling crustal extension and thinning and their link to the syn-tectonic sedimentary sequence [12,16]. Each of these steps requires a specific approach, which we explicate below.
(1) Defining the crustal shape: This requires identifying the top of the seismic basement (referred to as Tb) and the seismic Moho. Two first-order types of shape can be defined, namely, box-shaped with a parallel Tb and Moho and taper-shaped with a converging Tb and Moho [3]. Sutra et al. [58] subdivided the crustal taper of the Iberian and Newfoundland margins into two domains, the necking and hyperextended domains, and a subdivision that can be applied to most Atlantic-type magma-poor rifted margins but not to the SCS, as shown hereafter. Therefore, we introduce here the tapering domain that we define as the domain between the necking line (NL), which marks the outer limit of the proximal domain [58], and the breakup line (BL), which marks the landward limit of oceanic crust resulting from steady-state seafloor spreading (Figure 1C). The advantage of the crustal shape approach is that it neither requires a precise location of the Moho nor high-resolution depth-migrated reflection seismic data. This approach can be used for both depth- and time-migrated reflection seismic lines, and the inflection point of the crustal shape remains the same between time- and depth-migrated sections. In seismic reflection sections in time, the Moho is largely horizontal (see the 10 s rule of Warner [59]) and the inflection points/domains can only be identified along Tb.
(2) Defining the structures controlling crustal extension and thinning: While high-angle normal faults are relatively straightforward to recognize in seismic sections, downward concave faults, here referred to as exhumation faults, are more challenging to interpret. The challenge of their interpretation is shown in Figure 3, where the evolution of an exhumation fault is shown in the dynamic model published by Lavier et al. [60] (Figure 3A). The final section of the model shows limited thinning of the crust due to ductile flow of the lower crust and hence limited top-basement topography. A rift system showing a largely flat Tb and Moho would be a priori considered as a low-ß extensional system. Thus, an interpretation with high-angle faults with relatively little horizontal offset (Figure 3C, left side) would likely have a high level of acceptance despite being incorrect. An interpretation of a long-offset detachment fault (Figure 3C, right side) would likely be seen as too model-driven, despite being correct.
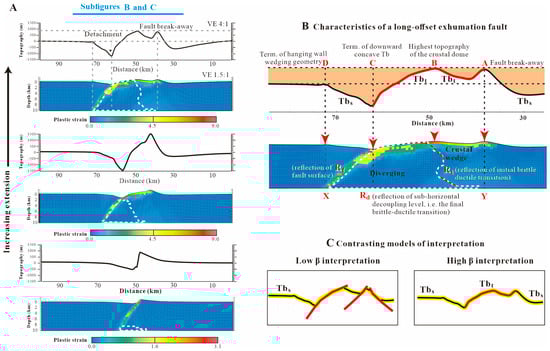
Figure 3.
Model used to illustrate the challenge in interpreting the structures controlling crustal extension and thinning (after Lavier et al. [60]) and defining observational fingerprints in seismic reflection data that can support the presence of top-basement detachment faults. (A) Topography and plastic strain showing the evolution of the downward concave exhumation fault with the uplift of lower crustal material (bounded by white dashed contour). (B) Zoom-in of the top section in panel (A) showing the limited thinning and top-basement topography of the upper crust due to crustal flow counterbalancing the exhumation of crustal material owing to the large-offset exhumation fault. Note the occurrence of the points A, B, C and D and the key interfaces Rf, Rd and Ri. The focal point of the intra-basement fanning structures lies at point Y, which vertically lies below point A. Rd intersects Rf at point X and Ri at point Y. The fanning reflections are delimited by X-Y, Y-B and Rf. (C) To the left, a classical low-ß interpretation (i.e., with only high-angle normal faults) of the topographic profile displayed in (B); to the right, a high-ß interpretation (i.e., with an exhumation fault) of the same topographic profile. Tb: top basement; Tbs: pre-rift stratigraphic top basement; Tbt: top basement of tectonic origin (i.e., exhumed fault plane).
It is important to note that in seismic sections, distinguishing between the two conflicting interpretations remains difficult in the absence of borehole calibration. However, distinguishing between a low-ß vs. high-ß system (sensu Wilson et al. [61]; see Figure 3C) not only has major implications for the interpreted amount of horizontal extension (ß values), the type of Tb (stratigraphic (Tbs) vs. tectonic/exhumed footwall (Tbt)), but it is also essential to define the mode of extension. It is therefore key to link the interpretation of the nature of Tb with characteristic reflections in the underlying basement and overlying sediments. In Figure 3B, inspired by dynamic modeling, some of the characteristics of large-offset exhumation fault systems are shown. They include a characteristic top-basement topography with a breakaway (point A) located behind a crustal dome (point B); correspondingly, intra-basement fanning structures whose focal point lies at Y are expected in the area delimited by X-Y, Y-B and Rf. Additionally, wedging geometries are expected in sediments between D and B and between B and A.
(3) Defining the syn-tectonic sedimentary sequence: The architecture of the syn-rift sedimentary sequence depends primarily on the accommodation (subsidence) and sedimentation rates. Accommodation faster than sedimentation results in deepening if the two equal, shallow conditions can prevail. Reckoning that the total accommodation is simpler in basins with high syn-rift sedimentation rates, as was the case in the N-SCS, since the evaluation of the paleo-bathymetry is notoriously difficult and uncertain in the absence of abundant syn-rift sedimentation. Also important in the evaluation of syn-tectonic sequences is the access to time markers that allow the correlation of sedimentary sequences across the margin, i.e., from proximal to distal. Such data is only available for few margins globally, among which the N-SCS central corridor is the best-calibrated example. This is particularly important since rift systems have been shown to be diachronous along dips. As a consequence, the syn-rift sequence in the SCS can contain both syn- and post-tectonic sequences. Indeed, in systems where rifting migrates and localizes oceanwards, syn-tectonic sequences in the distal margin can be temporally equivalent to post-tectonic sequences in the proximal margin [16]. Due to the high sedimentation rates and the existence of drill-hole data, the syn-rift stratigraphic record of the N-SCS is particularly well recorded (e.g., Figure 12 in Chao et al. [16]).
4. The Crustal Taper in the SCS
To map the three domains with distinct crustal shapes and thicknesses at the scale of the SCS, we use the crustal thickness map published by Gozzard et al. [62] (Figure 4A). This map is based on a gravity modeling approach (for modeling details and calibration of the map, see Gozzard et al. [62]). As our shape-domain mapping relies on the identification of inflection points in the top basement and Moho trends, it is insensitive to the precision with which the Moho and crustal thickness are determined.
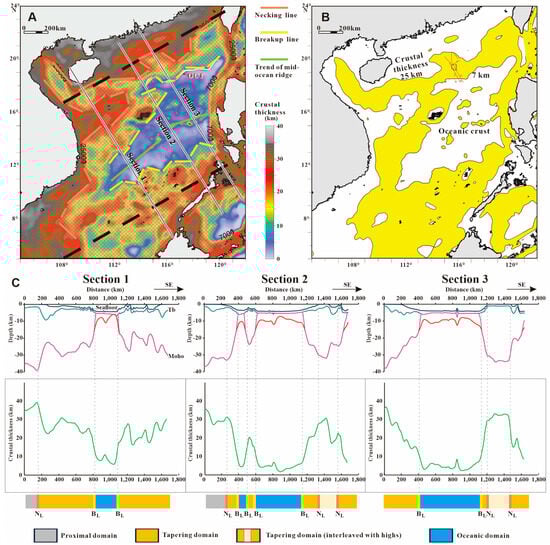
Figure 4.
Crustal thickness map of the SCS area and domains defined based on crustal shape and thickness. (A) Map showing the variation in crustal thickness based on the gravity inversion by Gozzard et al. [62]; note the segmentation and relative position of the NL and BL; the hatched area in between represents the tapering domain with a crustal thickness ranging from 25 to 7 km. The location of the OCT is after Zhang et al. [31]. (B) Location of the tapering domain highlighted in yellow. Locations of the seismic sections used in this study in the framework of the SCS (see Figure 1B for detailed locations). Yellow stars mark the drill sites of the IODP Expeditions 367/368. (C) Three parallel sections across the gravity inversion model displaying the variability of the tapering domain along the strike of the SCS (see panel A for location). The upper panels show the crustal shape and the lower ones the crustal thickness along the dip. The position of the NL at the southern margin is inferred. NL: necking line; BL: breakup line.
In the map in Figure 4A, two box-shaped crustal domains, shown in grey and blue colors, respectively, can be defined, separated by the tapering domain. The grey domain on the continent-ward side, which we refer to as the proximal domain, corresponds to a ca. 30 ± 5 km thick continental crust. The blue domain displays a 6 to 4 km thick oceanic crust typical of steady-state seafloor spreading (also referred to as a Penrose-type crust). The multicolor tapering domain in between, shown in yellow in Figure 4B, corresponds to a crust ranging from 30 to 5 km in thickness. It is separated from the proximal domain by the necking line (NL, orange line) and from the oceanic domain by the breakup line (BL, yellow line). A third line, in green, corresponds to the trend of the relict Mid-Ocean Ridge (MOR).
NL is well defined in the crustal thickness map along the N-SCS and trends ENE-WSW (Figure 4A). It is segmented by sharp NNW-SSE-trending segment boundaries. It is important to note that the NL is either sub-perpendicular or sub-parallel to the relict MOR in the SCS (Figure 4A), suggesting that there was a link to the kinematic transport direction. The trend of the NL in the southern SCS (S-SCS) margin cannot be determined either because the NL was subducted or because it lies in the hanging wall of the subduction forming the backstop behind the accretionary prism.
The position of the BL along the N-SCS (the yellow line in Figure 4A) has been defined and discussed in detail by Zhang et al. [31]. It trends ENE-WSW and is segmented. The BLs proposed by Song et al. [63] are shown for the SW subbasin and the conjugate S-SCS margin. It is important to note that the major trend of the well-defined BL in the N-SCS is not parallel to the MOR. This suggests that, locally, the BL cannot be considered, strictly speaking, as an isochron. Note that segmentation is more pronounced along the NL than along the BL and that the direction of the segmentation varies between the two.
Figure 4C shows three sections parallel to the segment boundaries offsetting the necking line, which trend NW-SE, which we consider as the kinematic transport direction during necking. The sections, derived from the gravity inversion model developed by Gozzard et al. [62], show the tapering of the crust. The upper panels show the depth of the seafloor, the Tb and the Moho along the dip, while the lower panels show the crustal thickness along the dip. The three sections display major variability in their tapering domain: while the western section displays different necking domains separated by a thicker but < 30 km thick crustal ribbon, the eastern section shows a simpler taper geometry. The central section shows two oceanic domains, indicating that the breakup by itself was a complex process [31] and that the tapering domain can include several areas with high thinning gradients surrounded by blocks of thicker crust referred to as ribbons.
5. Crustal Architecture, Structures and Accommodation in the N-SCS Central Corridor
5.1. Nature of Tb and Its Relation to the Underlying Basement and Overlying Sediments
5.1.1. Seismic Character of Tb
In Figure 5C,D, two parallel NW-SE-directed dip lines across the eastern Baiyun Subbasin are shown (for their locations, see Figure 1B). The Tb is well defined in the two sections. It is offset by high-angle normal faults whose interpretation is unequivocal, suggesting, at a first glance, only minor extension. We propose a “low-ß” interpretation of the two seismic sections (Figure 5A,B). However, these interpretations ignore reflections from both the underlying basement and overlying sediments.
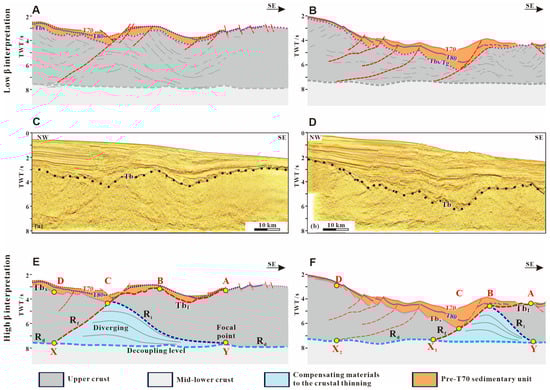
Figure 5.
Seismic observations and interpretation of two profiles across the Baiyun Subbasin (modified from Zhao et al. [10]). (A,B) Line drawing of seismic basement and low-ß interpretation with high-angle normal faults. (C,D) Seismic image with interpretated Tb; note the fanning structures in the basement and dome shape of Tb. (E,F) Alternative high-ß interpretation to explain the nature of Tb, intra-basement fanning structures and sedimentary architecture below T70. The high-ß interpretation shows striking similarities with the modeling result of Figure 3B. The locations of the sections are shown in Figure 1B. The points (A, B, C, D, X and Y), reflections (Rd, Rf and Ri) and interfaces (Tb, Tbs and Tbt) have the same meaning as in Figure 3. Rd intersects Rf at point X and Ri at point Y.
In Figure 5C, a set of SE-ward-dipping, intra-basement reflections can be observed. Where these reflections are truncated by the Tb, the latter shows a downward concave dome shape. Among the SE-ward-dipping reflections, we define the reflection Ri that separates parallel from fanning reflections. The focal point of the fanning reflections lies at point Y, at 7 s TWTT. At the same depth, a strong, sub-horizontal reflection, Rd, can be observed. The fanning reflections thicken into a NW-dipping reflection (Rf) that intersects Rd at point X and Tb at point C. Note that point C also corresponds to the NW termination of the downward concave Tb and that point X lies, like point Y, along the sub-horizontal reflection Rd. It is noteworthy that the pivot point (Y) of the fanning intra-basement reflections is located below the SE termination of the orange unit at point A and that the intersection point (X) between reflections Rf and Rd is located below the NW termination of the orange unit located at point D.
In the sedimentary section overlying Tb, a sedimentary unit (colored in orange) shows two double-verging, sag-type sequences. The base and top of the orange sequence converge toward points D, B and A. Between points A and B, the top of the orange sequence is tilted towards the SE. Between points B and X, the orange sequence is thickest at point C. The depositional architecture of the orange unit shows tilting and thickening geometries reminiscent of a syn-tectonic origin of this unit.
Neither the wedging nor the tilting observed in the sediments and in the basement of Figure 5C can be explained by the high-angle faults shown in the low-ß interpretation of Figure 5A. The occurrence of back-tilted seismic reflections beneath a corrugated top basement is reminiscent of the fingerprints linked to detachment faults produced in numerical models (Figure 3). Hence, we prefer the high-ß interpretation shown in Figure 5E, where a major, northwestward-dipping extensional detachment fault runs from A to X via B and C. In the basement (between C and X), this fault corresponds to a high-angle fault that soles out at 7 s at point X, presumably at a decoupling level that corresponds to reflection Rd. To explain the fanning structures in the basement and their related focal point, the breakaway must be located at point A. In this interpretation, Ri and Rd would respectively represent the initial and final brittle ductile transition, and the Tb between A and C would represent an exhumed fault plane (Tbt). This interpretation implies a horizontal extension of several tens of kilometers (offset of points A and C).
Figure 5D shows a parallel section across the Baiyun Subbasin (for the location, see Figure 1B). In the section’s analogous reflections (Rf, Ri and Rd) and points (A, B, C, D, X1 to -4, and Y), similar geometrical relationships and fan-shaped sequences (orange and blue areas) to those described in Figure 5C can be observed. These similarities suggest similar controlling processes, which is not surprising, since the two sections image the same subbasin. However, in contrast to the section shown in Figure 5C, where Tb and Rd are sub-parallel, in the section in Figure 5D, Tb and Rd converge, as indicated by the deepening of Tb from 2 to 6 s. Comparing the two sections suggests that the relationship between horizontal extension and crustal thinning (taper) not only depends on the amount of extension (ß), i.e., the occurrence or absence of detachment systems, but also on processes that can compensate crustal thinning, i.e., crustal flow and/or magmatic additions.
5.1.2. Drill-Hole Observations
The ultimate test to distinguish between different types of Tb and therefore to select between low-ß and high-ß interpretations is drilling. A calibrated example of a stratigraphic top basement (Tbs) can be seen at IODP Site U1501 [64], drilled at the outer marginal high (OMH) at the seaward boundary of the Liwan Subbasin (for the location, see Figure 1B). Strongly lithified sandstones and conglomerates at the top of the basement (Figure 6A), which have been interpreted as pre-rift sediments [64], were recovered. On seismic profiles, the contact between the syn- and pre-rift sequences and underlying upper crust exhibits a striking contrast in seismic reflectivity (Figure 6A). While the syn-rift sediments present fairly continuous, high-frequency reflections, the pre-rift and underlying basement show chaotic or poorly continuous low-frequency reflections. In this study we define Tbs (stratigraphic top basement) as an equivalent of Tg, which is a stratigraphic marker topping the upper crust.
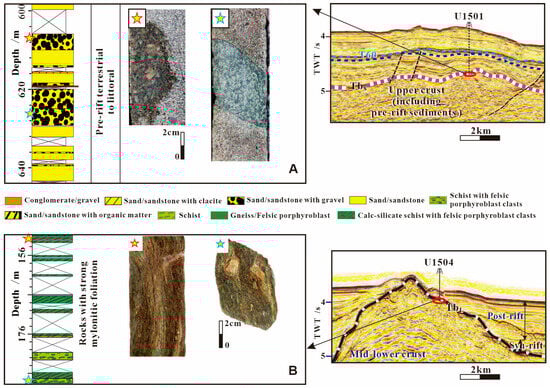
Figure 6.
Interpretation of different types of (top) basement based on lithostratigraphic summary and photos of the basement rocks at Sites U1501 and U1504. (A) Drilling result at Site U1501 [64] and interpreted Tbs (an equivalent of Tg) which tops the pre-rift sediments. (B) Drilling result at the Site U1504 [65] and interpreted Tbt (an exhumation fault) which tops the mid–lower crust [42]. Note that the upper and mid–lower crusts show different seismic facies.
In contrast, IODP Site U1504 penetrated epidote–chlorite schists with angular, heavily veined granofels clasts within the top basement [65] (Figure 6B). The schists show a strong greenschist facies with subvertical mylonitic foliation. Sun et al. [66] presented a detailed macrostructural and mineral analysis suggesting that the schists experienced two episodes of deformation: an early one linked to ductile mylonitic shear deformation, interpreted to have occurred at mid-crustal levels (6~9 km deep, i.e., 2 to 3 kbar/300~400 °C) and dated as Early Cretaceous, and a later one that occurred in the brittle field at shallower crustal levels in the presence of hydrothermal fluids at an undetermined time. Whether both events are Early Cretaceous and linked to deformation in a forearc setting, or if the brittle, non-dated deformation overprinting the greenschist facies mylonites formed during the Late Eocene rifting [66] is debated. It is important to note that the retrograde mineral paragenesis and fluid-controlled deformation in the epidote-chlorite schists is very similar to that of rocks drilled from exhumed detachment surfaces offshore of Iberia (ODP Site 1068 [67]). Moreover, these basement rocks are directly overlain by Late Eocene syn-rift sediments. Pre-rift sediments have not been encountered at the drill site [65]. In the seismic section, Tb at IODP Site U1504 shows a strong reflection (Figure 6B). The sedimentary units on both sides of the basement high show different geometrical relationships. While they are tilted on the northern side (the left side of the seismic section in Figure 6B), the syn-rift sequence is onlapping on the south-dipping, tapering crust on the southern side. In the absence of absolute dating of the brittle deformation phase, it cannot be excluded that Tb was already exhumed during the Early Cretaceous. However, such an interpretation can neither explain the lack of Tg in the drill hole, nor the geometrical relationships between subvertical mylonites and the south-dipping Tb, both of which are compatible with an exhumed fault surface (Tbt). Thus, we consider here that the Tb at IODP Site U1504 exemplifies a top basement formed of an exhumed fault zone (Tbt).
5.2. Crustal Structure of the N-SCS Central Corridor According to Seismic Sections
In the N-SCS, many recent publications [12,68] have shown convincing evidence supporting the existence of long-offset detachment faults associated with MCCs and exhumation of the lower crust, reinforcing the hypothesis that Tb may either be stratigraphic (Tbs) or tectonic (Tbt). In this section, we apply this approach to four seismic sections showing characteristic aspects of the tapering domain across the N-SCS central corridor. To simplify the comparison, we use the same labels for points and reflections that are in a similar geometrical position with respect to those displayed in Figure 5E. That is, we use points A, B, C and D for points located at Tb; points X and Y for points located along a horizontal intra-basement reflection; and Rf, Ri and Rd for intra-basement reflections.
5.2.1. Profile 100
The seismic section shown in Figure 7 trends from 10 to 95 km N-S and from 95 to 120 km NW-SE. In our interpretation we only show the N-S-trending part of the section that is sub-parallel to the kinematic transport direction. Stratigraphic marker levels T80, T70 and T60 were added following the interpretation of Pang et al. [44]. Tb deepens from 2 s at 10 km down to 5 s at 40 and 70 km and is offset at several occurrences along N-dipping interfaces. We define two sets of structures that create intersections of points, A1_C1 and A2, A2′, A2″_C2, C2′, C2″, and we introduce Rf1 and Rf2 to define the intra-basement continuation of the structures offsetting Tb. Sediment packages bounded by Tb and T80 thicken southward into the upward termination of Rf1 and Rf2 and have their focal points, D1 and D2, at 20 km and 90 km, respectively.
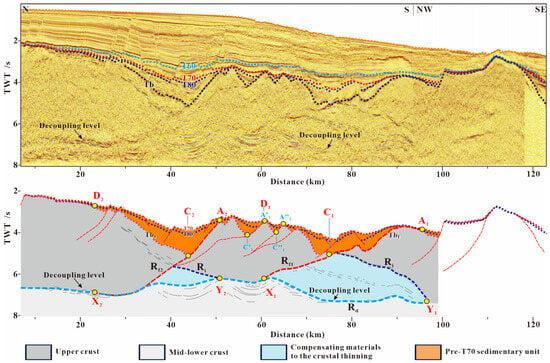
Figure 7.
Seismic observations and interpretation of profile 100. The interpretation shows the occurrence of two major detachment faults controlling related intra-basement fanning structures and sedimentary packages below T70. Most of the extension occurred prior to T80. See Figure 1B,C for the location of this section. Tb is clearly visible and marked with a black dotted line. The points (A, C, D, X and Y), reflections (Rd, Rf and Ri) and interfaces (Tb, Tbs and Tbt) have the same meaning as in Figure 3. Rd intersects Rf at point X and Ri at point Y.
Smaller wedges can be seen between T80 and T70, and minor fault offsets occur in T60; however, these late faults show negligible crustal thinning and extension. Within the basement, a bundle of strong, south-dipping and converging reflections, referred to as Ri, are floored by a sub-horizontal reflection package (Rd) located at 7 to 8 s. The Ri reflections form two focal points (Y1 and Y2) on Rd. The fanning reflections diverge northward into Rf1 and Rf2, the latter intersecting with Rd at X1 and X2. It is interesting to note that X1 lies vertically below D1 and that X2 lies vertically below D2. Thus, like in Figure 5E, the blue growth packages in the basement and the orange packages in the sediments can be best explained if Rf1 and Rf2 are extensional detachment faults. An alternative interpretation assuming an array of steeper planar normal faults with superimposed hanging-wall and footwall blocks can neither explain the observed reflection geometries in the sediments nor those in the underlying basement and is therefore rejected. It is important to note that most of the extension had to occur before T80 formed the top of the orange sequence, while most of the accommodation occurred post-T80. Notably, crustal tapering is not very pronounced in this section.
5.2.2. Profile 2512
Profile 2512 images the architecture of the Yunli High drilled by Lw116 (Figure 8; for the location, see Figure 1B). Note that the section strikes NE -SW, which is almost perpendicular to the kinematic transport direction; thus, it can be considered as a strike line. Tb (black dotted line) corresponds to a strong reflection that can be traced across the whole section at about 3 s. Tb truncates intra-basement reflections, in particular those at 5, 32 and 45 km. The seismic Moho is not imaged. A strong, sub-horizontal reflection occurs at about 7 s TWT, which we refer to as Rd. Fanning reflections (Ri) intersect with Rd at point Y. A prominent SW-dipping reflection (Rf) intersects Tb at point C. In the overlying sedimentary section, reflections are parallel, with the exception of the NE termination between 50 and 60 km, where a sedimentary wedge can be observed. The sedimentary section has been drilled in the nearby Lw116. The drill hole penetrated marker levels (T60 and T70) that directly overlie basement rocks consisting of schists similar to those drilled at Site U1504 (for a description, see Section 5.2.2). Thus, Tb may correspond to an exhumed basement from 0 to 45 km, and Tg is likely absent.
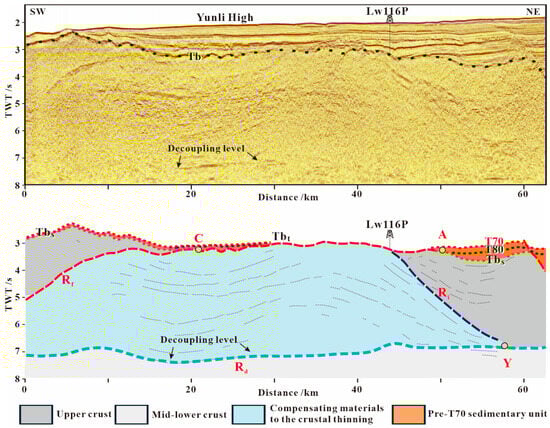
Figure 8.
Seismic observations and interpretation of profile 2512 at Yunli High. The interpretation with borehole Lw116 showing the architecture of Yunli High and the occurrence of the detachment fault. Line drawing in the basement shows that the fanning reflections diverge southwestward into Rf, and Tb strongly truncating the intra-basement reflectors. See Figure 1B for the location of this section. The points (A, C, X and Y), reflections (Rd, Rf and Ri) and interfaces (Tb, Tbs and Tbt) have the same meaning as in Figure 3. Rd intersects Ri at point Y.
Despite the fact that the section is highly oblique to the kinematic transport direction, the diagnostic reflections and intersections described in Figure 5E can be observed in section 2512 (Figure 8), i.e., a Tb at about 3 s, an Rd at about 7 s, fanning reflections (Ri) intersecting with Rd at point Y, and a reflection (Ri) that is in a similar position to a long-offset fault in Figure 3B. Note that the top of the orange wedging section is T80, indicating that deformation had to occur before T80. Note also that most of the accommodation is post-T80.
5.2.3. Profile 6200
This N-S-directed section located in the eastern part of the Liwan Subbasin (Figure 9) is taken from a depth-migrated 3-D seismic dataset. In the section, Tb corresponds to a strong continuous reflection (Figure 9A). The seismic Moho, not recorded in the image, must be deeper than 10 km. Sediments overlying Tb are deformed and show complex structures that downlap onto Tb. The top of this sequence is defined by T70, and the overlying sediments are only slightly deformed and onlap northward onto T70. Note also that the seafloor lies at about a 3.5 km water depth at the southern termination of the section.
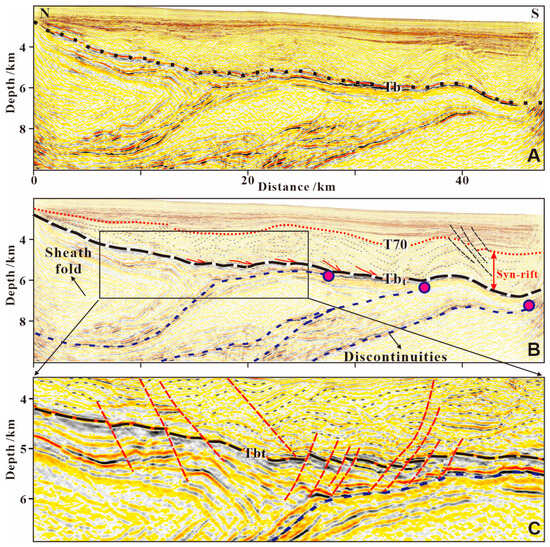
Figure 9.
Seismic observations and interpretations in the depth-migrated profile 6200 from the Liwan Subbasin. (A) Tb showing strong continuous reflections. (B) The interpretation of intra-basement structures and the supra-basement syn-rift sedimentary sequence with downlapping geometry on to Tb. The intra-basement sheath folds and anastomosing discontinuities imply strong heterogeneity and ductility of the basement, which was interpreted to correspond to the exhumed mid–lower crust [41,43]; in other words, Tb equals Tbt. Note that the intersections between Tbt and discontinuities show southward migration from shallow to deep levels reflecting the gradual exhumation towards the ocean. (C) Some high-angle normal faults offsetting Tbt. The recognized facies of the mid–lower crust in this profile and Figure 6B, as well as the upper crust in Figure 6A, provide constraints for the interpretation of other seismic profiles. The location of this profile is shown in Figure 1B. The interfaces Tb and Tbt have the same meaning as in Figure 3.
The basement is characterized by sheath folds and discontinuities with strong reflections (Figure 9B). The discontinuities are anastomosing and juxtapose different basement units with a variety of amplitudes diagnostic of convergent structures [43]. The intra-basement sheath folds (for detailed observations and explanations, see Zhang et al. [43]) and anastomosing discontinuities are reminiscent of networks of lenticular ductile shear zones in the ductile crust (for analogue structures, see Reston [69] or Clerc et al. [70]). Because Tb seems to truncate the northward tilted discontinuities and Tb is directly overlain by sediments, we interpret Tb as a detachment fault (Tbt), in line with the interpretations of Deng et al. [41] and Zhang et al. [43]. Tbt forms a corrugated surface with axes trending N-S, parallel to the extension direction, showing similarities to fault grooves in core complex structures [41].
Similar structures and the same N-S-directed transport direction have been reported in the Kaiping detachment fault system (see Figure 4 in Li et al. [11]). However, in the Liwan Subbasin, Tbt is at about 6 to 7 s (Figure 10), while in Kaiping and Yunli, Tb is at about 3 s (Figure 8). It is noteworthy that Tbt is crosscut and offset by high-angle faults (Figure 9C). These normal faults show, however, small offsets (<0.1 km), and most terminate at shallow levels in the basement and do not prominently control the sedimentary infill.
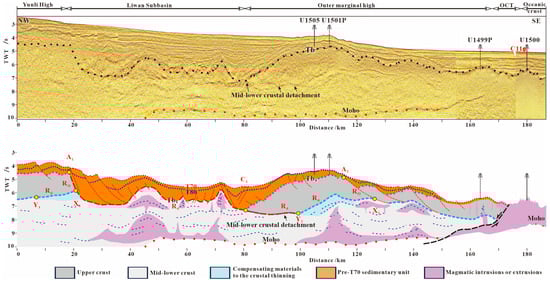
Figure 10.
Seismic observations and interpretations in profile 1555. Tb, indicated by the black dotted line, shows significant topographic variations. Interpretation of the different natures of the top basement is well constrained by the drilling result in Figure 6 and the interpreted mid–lower crust in Figure 9. The basement at the outer marginal high (OMH) shows contrasting seismic facies of the upper and mid–lower crust, which are delimited by Rd (light-blue dashed line). Large-scale upwarping structures representing the intrusion of magma into the crust and sediments, for instance, at 45, 58 and 73 km. See Figure 1B for the location of this section. The points (A, C, X and Y), reflections (Rd, Rf and Ri) and interfaces (Tb, Tbs and Tbt) have the same meaning as in Figure 3. Rd intersects Rf at point X and Ri at point Y.
5.2.4. Profile 1555
Profile 1555 (Figure 10) images the crustal architecture from the Yunli High in the northwest, across the Liwan Subbasin and the Outer Marginal High (OMH) drilled at IODP Sites U1501 and U1505 to the OCT drilled at IODP Site U1499 (located 25 km to the west of this profile) and further to the oceanic domain drilled at IODP Sites U1500 and U1503. The line may be slightly oblique to the kinematic transport direction.
The Tb is well imaged and exhibits significant variations in depth, changing from 4.5 s in the north (Yunli High) to 7 s in the Liwan Subbasin. Seismic Moho with strong reflections is imaged between 9 s and 10 s TWT and remains relatively flat from 45 to 150 km in the Liwan Subbasin and beneath the OMH. Oceanward, it shallows and loses its distinct reflections in the OCT. The interpretation of the first-order interfaces is generally consistent with the studies of Gao et al. [71] and Nirrengarten et al. [72].
T80 and T70 correspond to moderate-continuity and low- to high-amplitude reflections that can be easily mapped and correlated across the whole subbasin. At the top of the OMH, T80 represents erosive truncations and T70 is absent. From 120 to 150 km at the distal OMH, the syn-rift sedimentary sequence is remarkably thin, locally thickening into high-angle faults. T60 characterizes another significant hiatus at IODP Site U1501, expressing as a strong reflection that can be traced along the whole profile. Some high-angle normal faults offset the Tb by less than 0.5 s TWT. Most faults are sealed by the interface T60.
Two types of basement can be distinguished. Between 0 and 20 km and 80 and 150 km, the contact between the sediments and the underlying basement exhibits a strong reflection, and the underlying basement shows chaotic or poorly continuous low-frequency reflections. At 110 km, drilling at Site U1501 (for details, see Section 5.2.2 and Figure 6A) penetrated syn- and pre-rift sediments, clearly indicating that Tb corresponds to a Tbs. Within the basement below, a set of fairly continuous strong reflections at a depth of 6~8 s TWT show prominent topographic variations and divide the pre-rift basement into two packages (Figure 10): an upper package with chaotic reflections (including pre-rift sediments) and a lower package with continuous, locally high-amplitude anastomosing reflections. Between 20 and 80 km, this basement is in direct contact with sediments. This type of basement is equivalent to the one shown in Figure 9.
In the section, two main breakaway points (A1 and A2) of structures Rf1 and Rf2 intersect a strong reflection (Rd) at points X1 and X2, respectively. The reflection Rd limits the two types of basements described above. Note that Rd floors the sedimentary section between X1 and C1 that forms the intersection between Rd and Tbs (drilled at Site U1501). Southeast of C1, Rd presents again an intra-basement reflection, separating the two types of basements. At X2 it is intersected by a second major fault system that has a breakaway in A2. From 120 to 150 km, we can find at least four other faults that affect the upper basement and that also offset Rd. Within the lower basement, we can locally find wedging packages that are not well defined. They may have focal points at Y1 and Y2 and may be explained by fault activity along Rf1 and Rf2. However, Tb and the overlying marker levels T80 and T70 show large-scale upwarping structures that have been described by Sun et al. [45] and Zhang et al. [15] as magmatic bodies (laccoliths) that intrude into the crust and sediments. Such structures can be observed at 45, 58 and 73 km, representing dome-shaped topographies in the 3D section (see Figure 9 in Zhang et al. [15]). The associated cores show pull-up artifacts. These structures correspond to denser bodies within a basement of relatively lower background density [72]. Likewise, the upper to mid–lower crust boundary at the OMH exhibits updoming at both 115 and 140 km, which at depth is linked with subvertical structures. Most structures are sealed by T80, while the upwarping is younger and continues during T70 and is over by T60.
5.3. Sediment Accommodation in the Central N-SCS
Sediment accommodation during the wide rift phase (Tg to T80; Figure 11A) occurred predominantly in the Baiyun Subbasin. During the tapering phase (T80 to T70; Figure 11B), accommodation was more distributed but also less important, before increasing during the final rifting and early seafloor spreading phase (T70 to T60; Figure 11C). These isopach maps can provide direct information on accommodation if the sediments remained continental or shallow-marine throughout the rifting process, which was the case in the SCS for most of the syn-rift phase, almost up to T70. Therefore, we can consider these maps as a proxy for the total creation of accommodation related to the wide rift (Figure 11A) and tapering phases (Figure 11B). However, during the final rifting and after breakup (T70 to T60), the entire margin began to subside due to post-tectonic thermal subsidence, and, in combination with a change in sedimentation rate at T60, the margin went to deep water. Consequently, the sediment accommodation shown in Figure 11C cannot be interpreted as a proxy for subsidence between T70 and T60, since it does not include bathymetry.
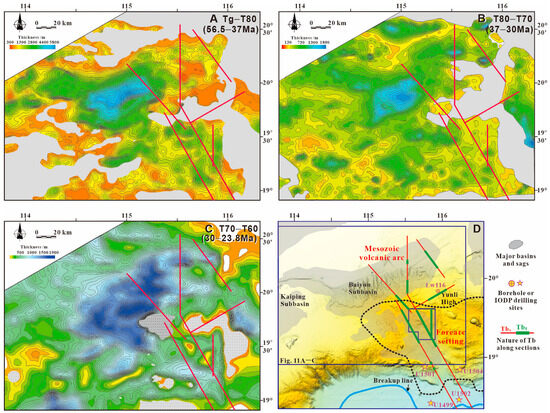
Figure 11.
Isopach maps for different phases. (A) Tg–T80 (wide rift phase). (B) T80–T70 (tapering phase). (C) T70–T60 (final rifting and early seafloor spreading). (D) Distribution of Tbs and Tbt around T80 time along the seismic traces based on interpretation of previous sections. The Baiyun and Liwan Subbasins formed over a Mesozoic volcanic arc and forearc (delimited by black dotted line after Zhang et al. [31]), respectively. Note that MCCs occur in areas where little accommodation is created, with the exception of the Liwan Subbasin. The interfaces Tbs and Tbt have the same meaning as in Figure 3. The red lines mark the sections presented above.
To identify the relationships between accommodation and MCCs, we mapped the latter based on our interpretation of the sections shown in this contribution. It is important to note that MCCs (e.g., Tbt) formed across the entire study area, as shown by the mapped distribution of Tbs and Tbt along the seismic traces (Figure 11D). The distribution of the mapped Tbt around T80 time is taken from the seismic section in Figure 5, Figure 7, Figure 8, Figure 9 and Figure 10. Most important is that MCCs occur in areas where little accommodation is observed. Relatively little accommodation was created at the onset of necking (around T80), and it is notable that during crustal thinning in the Liwan Subbasin (around T80), accommodation was only moderate. This indicates that crustal thinning did not lead everywhere to immediate subsidence, contrary to what is suggested by the depth-uniform extension model [7]. Figure 11 shows that accommodation in the Baiyun Subbasin was created during crustal thinning, while in the Liwan Subbasin the creation of accommodation was delayed relative to crustal thinning. Possible reasons for this key observation are discussed in Section 6.2.
6. Discussion
Unravelling the link between extension, strain localization, crustal thinning and magmatism is challenging but a prerequisite to describe and understand the evolution of a rift system such as the SCS. In the following, we first summarize (Section 6.1) the new approach we have developed to link crustal shape, the nature of top basements and accommodation to rift evolution. In Section 6.2 we discuss the role of syn-extensional crustal flow and magmatic additions in localizing strain. In Section 6.3, new concepts are introduced to explain the rift evolution of the N-SCS based on our observations. In the last section (Section 6.4), we address the complex link between the mechanical/rheological and thermal conditions during rifting in the N-SCS and explore the potential control of inheritance and strain rates linked to subduction systems in rift evolution. Finally, we compare the rift evolution of the SCS marginal sea with that of Atlantic-type rift systems.
6.1. A New Approach to Describe Rift Evolution
6.1.1. The Crustal Shape Approach
Rifted margins in general can be regarded as being formed of a tapering crust framed by a box-shaped crust in the proximal and oceanic domains (where Tb and Moho are parallel). Mapping Tb and Moho allows the definition of crustal shapes and rift domains. As shown in the conceptual section in Figure 12, the tapering domain is limited by the necking line (NL) inboard and the breakup line (BL) outboard. Hence, NL and BL correspond to inflection points at both Tb and Moho in depth-migrated seismic sections. In time-migrated seismic sections, due to the 10 s rule of Warner [59], only Tb shows inflection points, while the Moho is sub-horizontal at a depth of 10 to 9 s TWT.
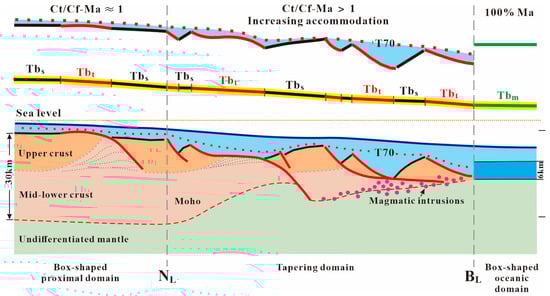
Figure 12.
Conceptual model illustrating an approach combining crustal shape with recognition of the nature of Tb and fault geometry for understanding the rifting processes. Tb could be of stratigraphic, tectonic or magmatic origin. The crustal shape is a function of extension, ductile flow and/or magmatic addition. Extension does not lead everywhere to crustal thinning; a box-shaped crust can remain if the thinning of the crust is compensated by ductile flow and/or magmatic additions. The interfaces (Tb, Tbs and Tbt) have the same meaning as in Figure 3. Ct: crustal thinning; Cf: crustal flow; Ma: magmatic additions.
In a continental domain, the box shape of the crust can be explained in two ways. Either it results from a thermal and gravitational equilibrium associated with a long phase of post-tectonic equilibration, or it results from a process compensating crustal thinning (Ct), for instance, crustal flow (Cf) or magmatic additions (Ma). As long as Ct/(Cf + Ma) equals 1, which is the case in a wide rift mode (Figure 12), the crust keeps a box shape. In the oceanic domain, the crust is box-shaped if the ratio of the magma production rate to the divergence rate remains constant. Two main points can be concluded when using a crustal shape approach: (1) a box-shaped crust does not mean that the crust was not extended, and (2) a tapering crust requires that Ct is larger than (Cf + Ma), which means that deformation is localized (narrow rift mode). It is important to note that Ct, Cf and Ma cannot be independently measured or estimated from seismic images or other geophysical data alone, since such methods provide velocities or densities that are not unique to one rock type. Additionally, Ct, Cf and Ma, are also defined by their temporal and spatial evolution, whose evaluation requires mapping and dating. However, the shape approach is an elegant way to describe crustal thinning by linking Ct and Cf + Ma based on seismic observations. This leads to the question of what additional observation is needed to determine the existence of crustal flow and/or magmatic additions and how they can be quantified in an extensional system. Since both are difficult to estimate and remain interpretative, here we propose an approach that is based on the recognition of the nature of the top basement (Tb).
6.1.2. Defining the Nature of Tb: A Key to Understand Extension Modes
As shown in Figure 5 and Figure 6, Tb can either represent a pre-rift stratigraphic contact (Tbs; in the case of the N-SCS, referred to as Tg) or a tectonically exhumed surface (Tbt). In Section 5, we systematically distinguished between Tbs and Tbt. The distribution of Tbs and Tbt along each trace (Figure 11D) suggests that areas with Tbt occur in the eastern Baiyun Subbasin, at the Yunli High, in the Liwan Subbasin and along the oceanward side of the OMH. A key finding is that the nature of Tb repeatedly shifts between Tbs and Tbt along dips of sections crossing the N-SCS central corridor and that two geometries of Tbt can be observed. In the Liwan Subbasin (Figure 10), Tbt floors about 60 km and up to 2.3 s TWT thick syn-rift sedimentary sequence and shows a spoon-like, concave upward geometry. In contrast, the Tbt in the Yunli High and Baiyun Subbasin is dome-shaped (Figure 5 and Figure 8), caps a 30~25 km thick crust (for crustal thickness estimations, see Yan et al. [73] and Zhao et al. [49]) and is overlain by a thin syn-rift sequence.
The interpretation of Tb as either an exhumed fault plane (Tbt) or a pre-rift stratigraphic contact (Tbs) is a source of conflicting interpretations and major disagreements, notably in domains where the crust is box-shaped and appears not to be thinned. The occurrence of a Tbt asks for a high-ß interpretation (e.g., Figure 3C and Figure 5). Such an interpretation touches on a fundamental debate that persisted in the description of extensional systems for decades, namely, that over depth-uniform vs. depth-dependent thinning (e.g., [74]). Here we propose that the combination of the crustal shape approach with the analysis of the nature of Tb and the related fault geometries allow us to correctly deduce the processes that accommodate extension.
6.2. Control of Crustal Flow and Magma in Localizing Strain and Crustal Thinning
6.2.1. Crustal Flow vs. Crustal Thinning
Crustal flow in extensional systems has been proposed by Hopper and Buck [75], Clerc et al. [70], Clift et al. [76], Clift [77], Morley and Westaway [78], and Brune et al. [6] based on theoretical considerations, seismic observations and numerical dynamic modeling. Long-offset detachment faults and related MCCs have been recently reported from the N-SCS central corridor [11,12,13,79]. The authors ascribed them as either crustal flow or magmatic additions. Distinguishing between the two is difficult, the more so given that one does not exclude the other. Li et al. [11] showed convincing evidence for detachment faults forming simultaneously with ductile flow at deeper crustal levels in the Kaiping area (Figure 1B). In their example, deformation is decoupled between localized faulting in the brittle upper crust and ductile flow in the lower crust. Our observations support this interpretation. The blue-colored, intra-basement packages in Figure 5 and Figure 7 are interpreted as the ductile flow of lower crust into the footwall of an exhumation surface, similar to what is shown in the dynamic model in Figure 3A. That ductile flow of the weak mid–lower crust is important for MCC growth, as has been shown by Brun et al. [80], Martínez-Martínez et al. [81], Rey et al. [82] and Tirel et al. [83]. The main argument for such an interpretation is the occurrence of both diverging intra-basement reflections forming a focal point and a wedging geometry compatible with a downward concave detachment fault that can explain the overlying geometries in the syn-tectonic sediments (see the orange packages in Figure 5E,F and Figure 7). These examples demonstrate that crustal flow can hinder crustal thinning, even in high-ß settings. However, the exhumation of ductile crust eventually results in the embrittlement and consumption of the initially ductile lower crust. Therefore, one could expect that, during crustal thinning, a critical stage is reached when attenuated crust is not able to flow any more, resulting in a thin, fully embrittled crust, as predicted by Pérez-Gussinyé and Reston [84]. Continual consumption and embrittlement of the pre-rift ductile lower crust during extension should eventually result in crustal thinning and tapering of the crust.
Seismic images from the tapering domain (Figure 9 and Figure 10) allow distinguishing between two types of basements with distinct seismic characters and different types of Tb. A first type, corresponding to the pre-rift upper crust, shows a contact with pre-rift sediments (Tg; see IODP Site 1501, Figure 6A) and is characterized by a strong Tb reflection floored by chaotic or poorly continuous low-frequency reflections. A second type, interpreted as exhumed lower crust, shows fairly continuous strong reflections at a depth of 6~8 s TWT. In our interpretation, in Figure 10, the lower crust remains continuous and box-shaped with sub-horizontal intra-basement reflections. The brittle crust, in contrast, appears offset, resulting in an approximately 60 km wide window, where the lower crust is exhumed and directly overlain by syn-rift sediments (Figure 9). This interpretation sounds contradictory, since it is unlikely that the lower crust remains ductile when it is exhumed to the seafloor. Thus, the observed box shape of the lower crust may require that compensation continued, unlike at Atlantic-type magma-poor rifted margins, where the thin crust is fully embrittled and tapers [84]. This explains why a subdivision of the tapering domain into a necking and a hyperextended domain is not possible in the N-SCS. It can also explain why mantle exhumation did not occur, despite the high ß values. However, it begs the question of why the lower crust did not fully embrittle. Was the heat flow high enough to allow the crust to remain ductile, or was there an excess of ductile material? But if so, why did the crust eventually neck? An alternative explanation, discussed below, is that magmatic additions were able to compensate for crustal thinning.
6.2.2. Syn-Rift Magma and Its Role in Crustal Thinning and Strain Localization
Along the N-SCS central corridor, no SDR sequences, characteristic of significant magmatic activity at Atlantic-type rifted margins, have been observed [85]. In the Baiyun MCCs, Zhao et al. [49] interpreted magmatic intrusions to occur in the footwalls of rolling-hinge detachment faults. In both the Liwan Subbasin and the Outer Marginal High, subvertical structures within the mid–lower crust have been interpreted to be linked with the emplacement of laccoliths [15] or dykes [45]. Further evidence for the presence of magmatic additions flooring the distal domain are high-velocity bodies at the base of the crust [86]. Moreover, drilling penetrated magmatic rocks dated as syn-rift (42–38 Ma; Pang et al. [44]). However, the magmatic plumbing system in the N-SCS is likely more complex than that of magma-rich Atlantic-type rifted margins. A main reason may be that extension was associated with high syn-rift sedimentation rates forming a thick, low-density cover sequence. For magma, it may have been difficult to rise through such low-density material and extrude at the surface, which favored the formation of laccoliths, sills and crustal underplating [15,86]. In Figure 10, we highlight the importance of these magmatic additions; however, it is difficult to estimate how much of the thinning in the distal part of the taper was compensated by ductile flow and/or magmatic additions. Zhang et al. [15] estimated the timing and volume of magmatism and suggested that magmatic activity was subliminally present before and after rifting; the volume can be comparable to the median and mean SDR volumes, as defined by Gallahue et al. [87]. Magma retained at lower crustal levels could explain the relatively high thermal gradient measured in drill holes over the Outer Marginal High [72]. Moreover, the syn-tectonic magma additions in the crust may also explain why the lower crust did not taper, conversely to the overlying upper crust.
6.3. Rift Evolution Along the N-SCS
The combination of the crustal architecture with the syn-kinematic stratigraphic record and the age of syn-rift extensional structures and magmatic additions allows the proposing an evolution for the N-SCS central corridor that can be subdivided into four phases, as shown in Figure 13. Particular attention will be paid to four aspects: (1) the pre-rift inherited thermal state; (2) the bulk mantle and crustal composition; (3) the relative timing between fault activity and the accommodation creation with respect to the Tg, T80 and T70 time markers; and (4) the volume and timing of magmatic additions.
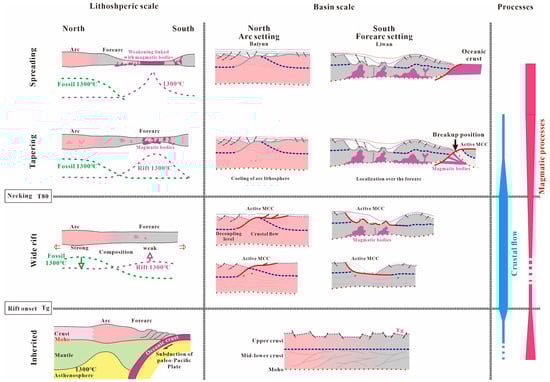
Figure 13.
The necking processes of the N-SCS central corridor and their link to initial and boundary conditions related to the evolution of the N-SCS from Andean-type subduction system to early seafloor spreading.
6.3.1. The Inherited, Pre-Tg Stage
The initial stage, here referred to as the pre-Tg/pre-rift stage, is not well constrained in terms of crustal thickness. However, it is generally accepted that rifting leading to the formation of the SCS directly followed an Andean-type subduction system [47] (Figure 2A). Andean-type subduction stopped only ~5–10 My before the onset of the Cenozoic rifting, as indicated by arc-related granitoid magmas emplaced up to 70 Ma. These arc-related, highly differentiated granitoids may have generated considerable radiogenic heat, contributing to a high heat flow at the onset of Cenozoic rifting [47]. At the same time, a forearc basin comprising a thick Mesozoic (meta-)sedimentary section with folds, thrust faults and widespread erosion was bordering the arc to the SE and along the entire SCS, from the NE to northern Palawan [40,54]. Thus, the N-SCS central corridor discussed here formed over an arc setting with major differences between the northern and southern parts at the onset of rifting. The NW part (Baiyun) was floored by plutonic, arc-derived rocks, while the SE part (Liwan) was floored by a meta-sediment-rich basement belonging to the former forearc [47] (see the inherited stage in Figure 13). Heat flow measurements for this stage do not exist and cannot be determined, as the thermal structure equilibrated through time. However, the fact that the Andean-type subduction stopped only ~5–10 My before the onset of the Cenozoic rifting suggests that at onset of the Cenozoic rifting, the lithosphere was still not thermally equilibrated and may have been comparable to that of present-day arc/forearc setting. Measurements over present-day supra-subduction systems show that heat flow between arc and forearc settings can vary by as much as 100 mW/m2, with values of 20 to 40 mW/m2 over the forearcs and much higher values of 120–250 mW/m2 over the arc area [88,89,90,91,92]. Assuming such major differences in the heat flow values before the onset of rifting would imply prominent deformation in the northern (arc) and southern (forearc) domains.
6.3.2. The Wide Rift Stage (Tg to T80)
The wide rift stage initiated post-Tg and lasted until T80; the initially continuous Tbs/Tg is crosscut and offset by both high- and low-angle faults (e.g., Figure 5C,D). We assume that during this stage the whole N-SCS central corridor was rather weak in the arc domain, due to a high geothermal gradient, and in the forearc, due to a weak meta-sedimentary crust [31]. Major faults and associated depocenters may have formed locally, preferentially over the arc and at its limits. In areas dominated by a weaker crust and high heat flow, MCCs may have formed. Examples are the Eastern Baiyun Subbasin and the Yunlin High (Figure 5 and Figure 11), where along-strike crustal flow and possible magma were able to compensate extension, preserving a box-shaped crust despite the formation of MCCs (Figure 5C). In other areas of the Baiyun domain, the crust was thinning and local depocenters may have formed during the wide rift stage (Figure 5D and Figure 11A). However, at the scale of the SCS, extension was decoupled, and high geothermal gradients and weak meta-sediments may have favored crustal flow, hindering large-scale crustal thinning.
6.3.3. The Tapering Stage (T80 to T70)
The tapering stage started around T80 and coincided with the transition from wide to localized crustal thinning. At present it is unclear if localized crustal thinning initiated everywhere at the same time in the SCS or if it started independently in each basin. While major extension stopped in the Baiyun domain (Figure 5), extension continued in the Liwan domain. In contrast, subsidence and accommodation in the Liwan domain remained moderate during crustal thinning (Figure 11B), and most of the accommodation occurred post-tectonically, i.e., post-T70.
6.3.4. The Spreading Stage (Post-T70)
The spreading stage occurred when magma became dominant and the magma budget was high enough to sustain a steady-state seafloor spreading system. Indeed, almost all major extensional faults ceased activity before T80, with the exception of those in the area of later breakup [15].
6.4. Factors Controlling Rift Evolution in the SCS and Comparison with Atlantic-Type Systems
6.4.1. Localized Crustal Thinning: From Observations to Interpretations
The rift evolution documented in the N-SCS central corridor shows a transition from wide rifting to seafloor spreading. MCC formation, lower crustal flow and magmatic activity are not diagnostic of a particular rift stage and occur throughout rift evolution (Figure 13). Thus, none of these processes can account by itself for rift localization and crustal thinning. Three main observations can be made:
- When crustal tapering occurs, crustal thinning (Ct) dominates over crustal flow (Cf) and magmatic additions (Ma) (i.e., Ct > Cf + Ma);
- When crustal thinning initiates, extension localizes within the tapering domain;
- In the tapering domain, accommodation space creation is delayed relative to crustal thinning.
These three observations need to be integrated into the discussion of what may control rift localization and crustal thinning. As discussed above, the initial conditions and evolution of the northern (Baiyun) and southern (Liwan) domains along the N-SCS central corridor were very different, the former corresponding to an arc, the latter to a forearc setting. Moreover, rifting occurred during ongoing subduction further to the south. Thus, two possible factors may have controlled rifting in the SCS: (1) subduction inheritance and/or (2) subduction-controlled boundary conditions.
Control of Subduction Inheritance
Our interpretation of the control of subduction inheritance is shown in Figure 13. Since heat flow at the onset of rifting cannot be determined, we use heat flow estimates from present-day arc and forearc settings and assume that Cretaceous and present arc settings are comparable. Based on this assumption, the arc domain (Baiyun) may be characterized best by high heat flow (>120 mW/m2), a depleted mantle and an igneous granitoid arc crust at the onset of rifting. In contrast, the forearc domain (Liwan) may have shown much lower heat flow (20–40 mW/m2), with a hydrated forearc mantle overlain by a crust mainly formed of weak accreted meta-sediments [88,89,90,91,92]. Thus, rifting in the Baiyun domain may have started with a hot, and hence ductile, crust. In contrast, the heat flow was likely lower in the Liwan domain, but the crust, made of thick accreted meta-sediments, was weaker due to compositional inheritance. This initial situation can explain most of the observations reported in this study, for instance, that rifting initiated over a wide area controlled by a weak crust. Then, cooling of the arc lithosphere and crust resulted in a strengthening of the northern arc crust, while the meta-sediments in the forearc remained weak. This evolution may explain why deformation stopped in the arc region to localize over the forearc, resulting in the thinning of the underlying lithosphere. The thinning of the lithosphere in the forearc may have generated further weakening of this domain, increased the geothermal gradient (which would account for the delayed subsidence) and increased magma production. Thus, the necking line (NL) separating the Baiyun and Liwan domains may not only divide two subbasins but also two domains with different inheritance, rift mode and thermal subsidence histories.
Importance of Boundary Conditions
The switch from distributed to localized deformation and the onset of significant crustal thinning appears to occur over a relatively short time, with little before T80. This raises the question of what triggered the onset of crustal thinning and strain localization. Two scenarios can be envisaged.
The first scenario is that strain localization and crustal thinning were controlled by the inherited crustal composition and heat flow. If so, the onset of localized crustal thinning may have occurred when the ductile layers were consumed. In this scenario, similar to the weld in salt tectonics, localized crustal thinning may have occurred at different moments across the SCS, and the controlling mechanism would likely have been the thermal and compositional inheritance owing to the Mesozoic paleo-Pacific subduction system.
The second scenario is that localized crustal thinning may have resulted in an increase in strain rates, or that changes in strain rate triggered the onset of rift localization (e.g., Brune et al. [93]). Indeed, based on a kinematic restoration of the NW-SCS, Chao et al. [16] showed that an increase in strain rates occurred during strain localization and onset of crustal thinning. Whether such an increase was related to the yield strength of the lithosphere, as proposed by Brune et al. [93], or to a change in the pulling forces due to a reorganization of the paleo-Pacific system is difficult to determine. In the first case, the increasing rate would have resulted from the yielding of the lithosphere, and therefore it would have resulted from strain localization. In the second case, localized crustal thinning would have been the result of an external event (for instance, the reorganization of the subduction system). This could explain that strain localization and crustal thinning occurred over wide areas around T80 and coincided with the onset of more regular magma production [15]. Moreover, higher strain rates would also have increased the viscosity and strength of formerly ductile material, which could explain rifting localization and the mechanical coupling of the crust, and hence the start of localized crustal thinning, as suggested by Corti et al. [94], based on analogue modeling.
6.4.2. Factors Controlling Rifting in the SCS
Based on the interpretation of the NE- and NW-SCS by Peng et al. [95] and Chao et al. [16], at the scale of the whole SCS, localized crustal thinning is likely to have occurred earlier in the east and later in the southwest. Moreover, localized crustal thinning in the east and central parts of the SCS occurred mainly at the limit between inherited arc and forearc domains. In contrast, in the western N-SCS, localized crustal thinning penetrated the arc domain. In the crustal thickness map (Figure 4), NL is sub-parallel to the failed MOR in the S-SCS propagator, and the segment boundaries are parallel to the Red River Fault, perpendicular to the failed MOR and sub-parallel to corrugations on the Kaiping and Liwan MCCs [11,41,68]. This suggests that localized crustal thinning formed more or less perpendicularly to the kinematic transport direction. Thus, we consider that inherited weaknesses (compositional or structural) may have facilitated strain localization during localized crustal thinning, but at first order, strain localization may have been controlled by a change in extension rates and the kinematic transport direction.
An additional observation is that the oceanic domain of the SCS never successfully penetrated the former arc domain. Our interpretation above supports the general agreement that initial weaknesses can control rift localization. But can inheritance also explain rift failure? A key observation is that lithospheric breakup stalls when entering the arc lithosphere, and nowhere was lithospheric breakup able to affect the arc domain, suggesting that the inherited arc lithosphere was not favorable to breakup. A possible reason for this may be that the depleted sub-arc mantle was not favorable to magma production for oceanization and therefore prevented breakup; a similar case from the southern N-Atlantic magma-poor margins has been discussed [96]. This may be an additional point explaining why the evolution observed along the central N-SCS was different from that of the western N-SCS. In this context it is interesting to note that the only basin where mantle exhumation has been confirmed in the SCS so far is the Phu Khanh basin offshore of Vietnam, which overlies a back-arc domain [97]. However, other controlling factors, such as far-field compression, may also account for the observed rift failure [98].
6.4.3. Localized Crustal Thinning (Necking): SCS vs. Atlantic
So far, comparisons between the SCS and Atlantic rift systems have mainly focused on the magmatic budget (e.g., Pérez-Gussinyé et al. [2]). Meanwhile, the necking process, called “localized crustal thinning” in this paper, has not been analyzed in detail in the SCS and has therefore not been compared with Atlantic-type magma-poor rifted margins yet. The observations reported herein show significant differences in the necking process in the SCS compared to that at Atlantic-type magma-poor rifted margins, as well as in dynamic models [96]. Numerical modeling shows that necking initiates at Atlantic-type magma-poor rift systems when the strongest layer breaks, resulting in strain localization and thinning of the crust/lithosphere where the strongest layer yields [96]. Our observations from the SCS (Figure 13) suggest, however, that necking was initially prevented by weak layers (a hot crust and/or meta-sediment-rich crust) that were flowing. In the Atlantic-type magma-poor Iberian margin, necking affected a lithosphere that had experienced thermal and isostatic equilibration during the more than 60 myrs that elapsed between post-orogenic collapse and the onset of rifting, and hence the lithosphere is assumed to have been approaching thermal equilibrium due to the onset of rifting [94].
From a lithosphere-scale perspective, two possibilities can be envisaged for necking in the SCS. Either the strongest layer in the lithosphere was located within the upper mantle, and hence the upper mantle yielded but crustal necking was delayed because of the weak lower crust that flowed, or there was no strength in the upper mantle and hence crustal necking controlled lithospheric yield. In the former case, the control was from the bottom upwards, while in the latter case the control was from the top downwards. A key point is that understanding crustal/lithospheric processes requires understanding the initial conditions of rift systems.
Rifting is usually assumed to either initiate at a former suture zone following a post-orogenic collapse or to develop from a “Basin-and-Range”-type supra-subduction system, as was the case for the SCS. However, the time gap between the end of the orogenic event and the onset of rifting strongly controls the initial conditions, in particular the thermal state of the rift system [99]. In Atlantic-type systems, the upper lithospheric mantle was the strongest layer at the onset of rifting, and necking occurred when the lithospheric mantle yielded [96]. In marginal sea systems such as the SCS, the initial state was controlled by the very complex thermal state over a subduction system with a hot (weak) arc and a colder (strong) forearc mantle. Moreover, the composition of the forearc (mainly weak, accreted meta-sediments) contrasted with that of the arc (a stronger igneous crust and depleted sub-arc mantle).
Other differences arise from the fact that Atlantic-type systems rifted a crust/lithosphere that was thermally equilibrated, which resulted in immediate tectonic subsidence followed by later thermal subsidence. In marginal sea-type systems, the evolution is more complex since the crust/lithosphere is not equilibrated at the onset of rifting. While the arc domain may cool during extension, which creates fast subsidence and accommodation space formation, the forearc domain may behave more like Atlantic-type rifts, which show an increase in heat flow as extension progresses, and hence show post-tectonic thermal subsidence. Moreover, strong variations in the thermal and compositional content of the sub-continental mantle can be expected between forearc and arc domains. This may also explain the hybrid behavior of the SCS, where rifting started, like in the basin and range, over a former arc domain, while final rifting stepped back into the former forearc domain. Note also that this evolution can explain the migration of rifting, the thermal state and accommodation, as well as the magmatic budget observed in the SCS. Moreover, while the arc mantle may be depleted and may not be prone to magma production, the forearc mantle may be easier to break, which may explain why successful breakup and seafloor spreading occurred predominantly over the forearc domain in the SCS.
7. Conclusions and Outlook
In this study, we investigated the relation between crustal shape, the nature of top basements, and sediment and magma accommodation to better understand the link between extension, strain localization and crustal thinning. Our study focused on the northern South China Sea (N-SCS), which is among the world’s best-observed rifted margins. Our aim was to decipher when, where and how localized crustal necking occurred during rifting. The main results can be summarized as follows:
(1) The onset of strain localization along the N-SCS occurred around 38 Ma (T80) and was related to significant crustal thinning and strain localization, and subsidence was delayed with respect to crustal thinning.
(2) Metamorphic core complexes (MCCs) formed throughout rifting and do not represent a rift mode but rather an extensional process that can operate at any stage of rifting.
(3) Localized crustal thinning in the N-SCS occurred when crustal thinning (Ct) was not fully compensated by crustal flow (Cf) and magmatic additions (Ma), i.e., when Ct > (Cf + Ma).
(4) The location of localized crustal thinning may have been controlled by inheritance (initial conditions), and its timing by a change in the externally determined extension rate (boundary conditions).
(5) The process of localized crustal thinning in the N-SCS shows well-defined differences compared to the necking process in Atlantic-type margins, which may be linked to their different inheritance and boundary conditions.
(6) The conditions at rift initiation in the N-SCS may have been controlled: (i) in the northwest by an arc domain with a high inherited heat flow and a depleted mantle overlain by a hot, weak igneous crust; and (ii) in the southeast by a forearc domain with a colder heat flow, a hydrated forearc mantle and a crust mainly formed by weak, accreted meta-sediments.
These results may allow us to predict the evolution of rift systems in marginal seas and provide a new conceptual framework that can help model and quantify the evolution of marginal seas. Although simple physical models such as the pure-shear rift model of McKenzie [7] can explain the first-order evolution of rift systems, we advocate that the inherited initial conditions associated with subduction setting and changes in extension rates may explain differences between the rift evolution of marginal seas (e.g., SCS) and Atlantic-type margins.
Author Contributions
This study is the product of the collective efforts of all contributors. The authors’ respective contributions are as follows: C.Z.: geological–geophysical interpretation, writing—original draft. G.M.: supervision, writing—original draft, project administration, methodology. P.C.: conceptualization, model improvement, editing; N.K.: crustal thickness and necking domain mapping, editing. S.L.: supervision, geological–geophysical interpretation, editing, resources. Y.S.: data curation, model improvement, formal analysis, editing. Z.Z.: data curation, resources. We affirm that our manuscript was submitted with the consent of all co-authors and that it is not under consideration for publication elsewhere. All authors have read and agreed to the published version of the manuscript.
Funding
This research was financially supported by the NSFC Program (No. 42572267), the key program of the NSFC (No. U2244221), the Guangdong Basic and Applied Basic Research Foundation (No. 2023A1515012803) and the National Key Research and Development Program of China (Nos. 2023YFF0803402 and 2024YFB3908104).
Data Availability Statement
This research used drilling data produced by the International Ocean Discovery Program (IODP). All the seismic reflection data used in this work has been published previously.
Acknowledgments
We are grateful to Zhen Sun and Brian Taylor for inspiring discussions and valuable help on an earlier version of this paper. The authors also much appreciated the constructive comments from Juan I Soto and two anonymous reviewers.
Conflicts of Interest
The authors declare no conflicts of interest.
Abbreviations
The following abbreviations are used in this manuscript:
| NL | Necking line |
| BL | Breakup line |
| Tb | Top of basement |
| Tbt | Top basement of tectonic origin |
| Tbs | Top basement of stratigraphic origin |
| Ri | Reflection of initial brittle ductile transition |
| Rd | Reflection of sub-horizontal decoupling level |
| Rf | Reflection of fault surface |
| Ct | Crustal thinning |
| Ma | Magmatic additions |
| Cf | Crustal flow |
| OCT | Ocean–continent transition |
| N-SCS | Northern South China Sea |
References
- Buck, W.R. Modes of continental lithospheric extension. J. Geophys. Res. 1991, 96, 20161–20178. [Google Scholar] [CrossRef]
- Pérez-Gussinyé, M.; Collier, J.S.; Armitage, J.J.; Hopper, J.R.; Sun, Z.; Ranero, C.R. Towards a process-based understanding of rifted continental margins. Nat. Rev. Earth Environ. 2023, 4, 166–184. [Google Scholar] [CrossRef]
- Osmundsen, P.T.; Redfield, T.F. Crustal taper and topography at passive continental margins. Terra Nova 2011, 23, 349–361. [Google Scholar] [CrossRef]
- Chenin, P.; Tomasi, S.; Kusznir, N.; Manatschal, G. Linking rifted margin crustal shapewith the timing and volume of magmatism. Terra Nova 2024, 36, 53–61. [Google Scholar] [CrossRef]
- Huismans, R.; Beaumont, C. Depth-dependent extension, two-stage breakup and cratonic underplating at rifted margins. Nature 2011, 473, 74–78. [Google Scholar] [CrossRef] [PubMed]
- Brune, S.; Heine, C.; Perez-Gussinye, M.; Sobolev, S.V. Rift migration explains continental margin asymmetry and crustal hyper-extension. Nat. Commun. 2014, 5, 4014. [Google Scholar] [CrossRef]
- McKenzie, D. Some remarks on the development of sedimentary basins. Earth Planet. Sci. Lett. 1978, 40, 25–32. [Google Scholar] [CrossRef]
- Kusznir, N.J.; Karner, G.D. Continental lithospheric thinning and breakup in response to upwelling divergent mantle flow: Application to the Woodlark, Newfoundland and Iberia margins. Geol. Soc. Lond. Spec. Publ. 2007, 282, 389–419. [Google Scholar] [CrossRef]
- Huang, H.; Klingelhoefer, F.; Qiu, X.; Li, Y.; Wang, P. Seismic imaging of an intracrustal deformation in the northwestern margin of the South China Sea: The role of a ductile layer in the crust. Tectonics 2021, 40, e2020TC006260. [Google Scholar] [CrossRef]
- Zhao, Y.; Ren, J.; Pang, X.; Yang, L.; Zheng, J. Structural style, formation of low angle normal fault and its controls on the evolution of Baiyun Rift, northern margin of the South China Sea. Mar. Pet. Geol. 2018, 89, 687–700. [Google Scholar] [CrossRef]
- Li, G.; Ye, Q.; Peng, G.; Liu, Z.; Zhang, L.; Hao, S.; Xu, X.; Mei, L. Development of detachment fault system associated with a mature metamorphic core complex: Insight from the Kaiping Sag, northern South China Sea rifted margin. Basin Res. 2024, 36, e70006. [Google Scholar] [CrossRef]
- Xu, Y.; Ren, J.; Zhao, Y.; Zheng, J.; Lei, C.; Zhu, D. Consequences of continental core complexes on rifting patterns: Insights from multichannel seismic data from the northern margin of the South China Sea. Tectonics 2024, 43, e2023TC007870. [Google Scholar] [CrossRef]
- Ye, Q.; Mei, L.; Jiang, D.; Xu, X.; Delogkos, E.; Zhang, L.; Camanni, G. 3-D structure and development of a metamorphic core complex in the northern south China sea rifted margin. J. Geophys. Res. 2022, 127, e2021JB022595. [Google Scholar] [CrossRef]
- Wang, J.; Pang, X.; Liu, B.; Zheng, J.; Wang, H. The Baiyun and Liwan Sags: Two supradetachment basins on the passive continental margin of the northern South China Sea. Mar. Pet. Geol. 2018, 95, 206–218. [Google Scholar] [CrossRef]
- Zhang, C.; Sun, Z.; Manatschal, G.; Pang, X.; Qiu, N.; Su, M.; Zheng, J.; Li, H.; Gu, Y.; Zhang, J.; et al. Syn-rift magmatic characteristics and evolution at a sediment-rich margin: Insights from high-resolution seismic data from the South China Sea. Gondwana Res. 2021, 91, 81–96. [Google Scholar] [CrossRef]
- Chao, P.; Manatschal, G.; Chenin, P.; Ren, J.; Zhang, C.; Pang, X.; Zheng, J.; Yang, L.; Kusznir, N. The tectono-stratigraphic and magmatic evolution of conjugate rifted margins: Insights from the NW South China Sea. J. Geodyn. 2021, 148, 101877. [Google Scholar] [CrossRef]
- Larsen, H.C.; Mohn, G.; Nirrengarten, M.; Sun, Z.; Stock, J.; Jian, Z.; Klaus, A.; Alvarez-Zarikian, C.A.; Boaga, J.; Bowden, S.A.; et al. Rapid transition from continental breakup to igneous oceanic crust in the South China Sea. Nat. Geosci. 2018, 11, 782–789. [Google Scholar] [CrossRef]
- Coney, P.J.; Harms, T.A. Cordilleran metamorphic core complexes: Cenozoic extensional relics of Mesozoic compression. Geology 1984, 12, 550–554. [Google Scholar] [CrossRef]
- Crittenden, M.; Coney, P.J.; Davis, G. Tectonic significance of metamorphic core complexes in the north American Cordillera. Geology 1978, 6, 135–151. [Google Scholar] [CrossRef]
- Lister, G.S.; Davis, G.A. The origin of metamorphic core complexes and detachment faults formed during Tertiary continental extension in the northern Colorado River Region, U.S.A. J. Struct. Geol. 1989, 11, 65–94. [Google Scholar] [CrossRef]
- Li, J.; Zhang, Y.; Dong, S.; Johnston, S.T. Cretaceous tectonic evolution of South China: A preliminary synthesis. Earth Sci. Rev. 2014, 134, 98–136. [Google Scholar] [CrossRef]
- Zahirovic, S.; Seton, M.; Müller, R.D. The Cretaceous and Cenozoic tectonic evolution of Southeast Asia. Solid Earth 2014, 5, 227–273. [Google Scholar] [CrossRef]
- Zhou, D.; Ru, K.; Chen, H.Z. Kinematics of Cenozoic extension on the South China Sea continental margin and its implications for the tectonic evolution of the region. Tectonophysics 1995, 251, 161–177. [Google Scholar] [CrossRef]
- Gilder, S.A.; Gill, J.; Coe, R.S.; Zhao, X.; Liu, Z.; Wang, G.; Yuan, K.; Liu, W.; Kuang, G.; Wu, H. Isotopic and paleomagnetic constraints on the Mesozoic tectonic evolution of south China. J. Geophys. Res. 1996, 101, 16137–16154. [Google Scholar] [CrossRef]
- Shu, L.; Sun, Y.; Wang, D.; Faure, M.; Monie, P.; Charvet, J. Mesozoic doming extensional tectonics of Wugongshan, South China. Sci. China Ser. D Earth Sci. 1998, 41, 601–608. [Google Scholar] [CrossRef]
- Wang, D.Z.; Shu, L.S.; Faure, M.; Zhan, S. Mesozoic magmatism and granitic dome in the Wugongshan Massif, Jiangxi province and their genetical relationship to the tectonic events in southeast China. Tectonophysics 2001, 339, 259–277. [Google Scholar] [CrossRef]
- Li, Z.-X.; Li, X.-H. Formation of the 1300-km-wide intracontinental orogen and postorogenic magmatic province in Mesozoic South China: A flat-slab subduction model. Geology 2007, 35, 179–182. [Google Scholar] [CrossRef]
- Li, Z.-X.; Li, X.-H.; Chung, S.-L.; Lo, C.-H.; Xu, X.; Li, W.-X. Magmatic switch-on and switch-off along the South China continental margin since the Permian: Transition from an Andean-type to a Western Pacific-type plate boundary. Tectonophysics 2012, 532–535, 271–290. [Google Scholar] [CrossRef]
- Schlüter, H.U.; Hinz, K.; Block, M. Tectono-stratigraphic terranes and detachment faulting of the South China Sea and Sulu Sea. Mar. Geol. 1996, 130, 39–51, 58–78. [Google Scholar] [CrossRef]
- Li, F.; Sun, Z.; Yang, H. Possible Spatial Distribution of the Mesozoic Volcanic Arc in the Present-Day South China Sea Continental Margin and Its Tectonic Implications. J. Geophys. Res. 2018, 123, 6215–6235. [Google Scholar] [CrossRef]
- Zhang, C.; Manatschal, G.; Taylor, B.; Sun, Z.; Zhao, M.; Zhang, J. Characterization and mapping of continental breakup and seafloor spreading initiation: The example of the northern rifted margin of the South China Sea. Basin Res. 2024, 36, e12882. [Google Scholar] [CrossRef]
- Li, P. Cenozoic tectonic movement in the Pearl River Mouth Basin. China Offshore Oil Gas (Geol.) 1993, 7, 11–17. [Google Scholar]
- Briais, A.; Patriat, P.; Tapponnier, P. Updated interpretation of magnetic anomalies and seafloor spreading stages in the South China Sea: Implications for the Tertiary tectonics of Southeast Asia. J. Geophys. Res. 1993, 98, 6299–6328. [Google Scholar] [CrossRef]
- Taylor, B.; Hayes, D.E. Origin and history of the South China Sea basin. Geophys. Monogr. Ser. 1983, 27, 23–56. [Google Scholar] [CrossRef]
- Ji, W.; Faure, M.; Lin, W.; Chen, Y.; Chu, Y.; Xue, Z. Multiple emplacement and exhumation history of the Late Mesozoic Dayunshan–Mufushan batholith in southeast China and its tectonic significance: 1. Structural analysis and geochronological constraints. J. Geophys. Res. 2018, 123, 689–710. [Google Scholar] [CrossRef]
- Shu, L.; Zhou, X.M.; Deng, P.; Zhu, W. Mesozoic-Cenozoic basin features and evolution of Southeast China. Acta Geol. Sinica [English edition] 2007, 81, 573–586. [Google Scholar]
- Shu, L.S.; Zhou, X.M.; Deng, P.; Wang, B.; Jiang, S.Y.; Yu, J.H.; Zhao, X.X. Mesozoic tectonic evolution of the Southeast China Block: New insights from basin analysis. J. Asian Earth Sci. 2009, 34, 376–391. [Google Scholar] [CrossRef]
- Li, C.-F.; Zhou, Z.; Hao, H.; Chen, H.; Wang, J.; Chen, B.; Wu, J. Late Mesozoic tectonic structure and evolution along the present-day northeastern South China Sea continental margin. J. Asian Earth Sci. 2008, 31, 546–561. [Google Scholar] [CrossRef]
- Yan, P.; Wang, L.; Wang, Y. Late Mesozoic compressional folds in Dongsha Waters, the northern margin of the South China Sea. Tectonophysics 2014, 615–616, 213–223. [Google Scholar] [CrossRef]
- Pan, Z.; Lu, S.; Gao, H.; He, Q.; Chen, H. The effect of pre-existing structures on the Cenozoic rifting processes: Insights from seismic reflection imaging of the northeastern South China Sea. J. Struct. Geol. 2024, 188, 105257. [Google Scholar] [CrossRef]
- Deng, H.; Ren, J.; Pang, X.; Rey, P.F.; McClay, K.R.; Watkinson, I.M.; Zheng, J.; Luo, P. South China Sea documents the transition from wide continental rift to continental break up. Nat. Commun. 2020, 11, 4583. [Google Scholar] [CrossRef]
- Sun, L.; Sun, Z.; Huang, X.; Jiang, Y.; Stock, J.M. Microstructures documenting Cenozoic extension processes in the northern continental margin of the South China Sea. Int. Geol. Rev. 2020, 62, 1094–1107. [Google Scholar] [CrossRef]
- Zhang, C.; Manatschal, G.; Pang, X.; Sun, Z.; Zheng, J.; Li, H.; Sun, L.; Zhang, J.; Zhao, Y. Discovery of mega-sheath folds flooring the Liwan subbasin (South China Sea): Implications for the rheology of hyperextended crust. Geochem. Geophys. Geosyst 2020, 21, e2020GC009023. [Google Scholar] [CrossRef]
- Pang, X.; Zheng, J.; Mei, L.; Liu, B.; Zhang, Z.; Wu, Z.; Feng, X. Structural diversity of fault depressions under the background of preexisting subduction continental margin, Pearl River Mouth Basin, China. Pet. Exp. Dev. 2021, 48, 1–11. [Google Scholar] [CrossRef]
- Sun, Z.; Lin, J.; Qiu, N.; Jian, Z.M.; Wang, P.X.; Pang, X.; Zheng, J.; Zhu, B. The role of magmatism in the thinning and breakup of the South China Sea continental margin. Nat. Sci. Rev. 2019, 6, 871–876. [Google Scholar] [CrossRef]
- Hall, R. Reconstructing Cenozoic SE Asia. In Tectonic Evolution of SE Asia; Hall, R., Blundell, D.J., Eds.; Geological Society of London: London, UK, 1996; Volume 106, pp. 153–184. [Google Scholar]
- Taylor, B. Reappraisal of the Continental Rifting and Seafloor Spreading That Formed the South China Sea. Geosciences 2025, 15, 152. [Google Scholar] [CrossRef]
- Ye, Q.; Mei, L.; Shi, H.; Camanni, G.; Shu, Y.; Wu, J.; Yu, L.; Deng, P.; Li, G. The Late Cretaceous tectonic evolution of the South China Sea area: An overview, and new perspectives from 3D seismic reflection data. Earth Sci. Rev. 2018, 187, 186–204. [Google Scholar] [CrossRef]
- Zhao, Y.; Ding, W.; Ren, J.; Li, J.; Tong, D.; Zhang, J. Extension Discrepancy of the Hyper-Thinned Continental Crust in the Baiyun Rift, Northern Margin of the South China Sea. Tectonics 2021, 40, e2020TC006547. [Google Scholar] [CrossRef]
- Li, F.; Sun, Z.; Yang, H.; Lin, J.; Stock, J.M.; Zhao, Z.; Xu, H.; Sun, L. Continental interior and edge breakup at convergent margins induced by subduction direction reversal: A numerical modeling study applied to the South China Sea margin. Tectonics 2020, 39, e2020TC006409. [Google Scholar] [CrossRef]
- Zhang, Z.; Fang, N.; Sun, Z. The sedimentary record of the Sanshui Basin: Implication to the Late Cretaceous tectonic evolution in the northern margin of South China Sea. J. Oceanol. Limnol. 2023, 41, 532–549. [Google Scholar] [CrossRef]
- Nissen, S.S.; Hayes, D.E.; Yao, B.; Zeng, W.; Chen, Y.; Nu, X. Gravity, heat flow, and seismic constraints on the processes of crustal extension: Northern margin of the South China Sea. J. Geophys. Res. 1995, 100, 22447–22483. [Google Scholar] [CrossRef]
- Webb, M.; Endinanda, F.; Gough, A. Mesozoic magmatism of Natuna Island, Indonesia: Impplications for the Subduction history of eastern Sundaland. Gondw. Res. 2023, 119, 45–67. [Google Scholar] [CrossRef]
- Kudrass, H.R.; Wiedicke, M.; Cepek, P.; Kreuzer, H.; Müller, P. Mesozoic and Cainozoic rocks dredged from the South China Sea (Reed Bank area) and Sulu Sea and their significance for plate-tectonic reconstructions. Mar. Pet. Geol. 1986, 3, 19–30. [Google Scholar] [CrossRef]
- Shao, L.; You, H.; Hao, H.; Wu, G.; Qiao, P.; Lei, Y. Petrology and depositional environments of Mesozoic strata in the Northeastern South China Sea. Geol. Rev. 2007, 53, 164–169. [Google Scholar]
- Shi, H.; Li, C.-F. Mesozoic and early Cenozoic tectonic convergence-to-rifting transition prior to opening of the South China Sea. Int. Geol. Rev. 2012, 54, 1801–1828. [Google Scholar] [CrossRef]
- Pang, X.; Chen, C.; Peng, D.; Zhu, M.; Shu, Y.; He, M.; Shen, J.; Liu, B. Sequence stratigraphy of deepwater fan system of Pearl River, South China Sea. Earth Sci. Front. 2007, 14, 220–229. [Google Scholar] [CrossRef]
- Sutra, E.; Manatschal, G.; Mohn, G.; Unternehr, P. Quantification and restoration of extensional deformation along the Western Iberia and Newfoundland rifted margins. Geochem. Geophys. Geosyst 2013, 14, 2575–2597. [Google Scholar] [CrossRef]
- Warner, M.R. Seismic reflections from the Moho: The effect of isostasy. Geophys. J. Int. 1987, 88, 425–435. [Google Scholar] [CrossRef]
- Lavier, L.L.; Buck, W.R.; Poliakov, A.N.B. Self-consistent rolling-hinge model for the evolution of large-offset low-angle normal faults. Geology 1999, 27, 1127–1130. [Google Scholar] [CrossRef]
- Wilson, R.C.L.; Manatschal, G.; Wise, S. Rifting along non-volcanic passive margins: Stratigraphic and seismic evidence from the Mesozoic succession of the Alps and western Iberia. In Non-Volcanic Rifting of Continental Margins: Evidence From Land and Sea; Wilson, R.C.L., Whitmarsh, R.B., Taylor, B., Froitzheim, N., Eds.; Geological Society of London: London, UK, 2001; Volume 187, pp. 429–452. [Google Scholar]
- Gozzard, S.; Kusznir, N.; Franke, D.; Cullen, A.; Reemst, P.; Henstra, G. South China Sea crustal thickness and oceanic lithosphere distribution from satellite gravity inversion. Pet. Geosci. 2019, 25, 112–128. [Google Scholar] [CrossRef]
- Song, T.; Li, C.-F.; Wu, S.; Yao, Y.; Gao, J. Extensional styles of the conjugate rifted margins of the South China Sea. J. Asian Earth Sci. 2019, 177, 117–128. [Google Scholar] [CrossRef]
- Larsen, H.C.; Jian, Z.; Alvarez Zarikian, C.A.; Sun, Z.; Stock, J.M.; Klaus, A.; Boaga, J.; Bowden, S.A.; Briais, A.; Chen, Y.; et al. Site U1501. In Proceedings of the International Ocean Discovery Program 367/368, 2018a; Sun, Z., Jian, Z., Stock, J.M., Larsen, H.C., Klaus, A., Alvarez Zarikian, C.A., et al., Eds.; IODP Publication Services: College Station, TX, USA, 2018. [Google Scholar] [CrossRef]
- Larsen, H.C.; Jian, Z.; Alvarez Zarikian, C.A.; Sun, Z.; Stock, J.M.; Klaus, A.; Boaga, J.; Bowden, S.A.; Briais, A.; Chen, Y.; et al. Site U1504. In Proceedings of the International Ocean Discovery Program 367/368, 2018b; Sun, Z., Jian, Z., Stock, J.M., Larsen, H.C., Klaus, A., Alvarez Zarikian, C.A., et al., Eds.; IODP Publication Services: College Station, TX, USA, 2018. [Google Scholar] [CrossRef]
- Sun, L.; Sun, Z.; Zhang, Y.; Zhao, Z.; Zhao, J.; Zhang, C.; Zhang, Z.; Sun, L.; Zhu, X. Multi-stage carbonate veins at IODP Site U1504 document early Cretaceous to early Cenozoic extensional events on the South China Sea margin. Mar. Geol. 2021, 442, 106656. [Google Scholar] [CrossRef]
- Whitmarsh, R.B.; Beslier, M.-O.; Wallace, P.J.; Abe, N.; Basile, C.; Beard, J.S.; Froitzheim, N.; Gardien, V.; Hébert, R.; Hopkinson, L.J.; et al. Proceedings of the Ocean Drilling Program, Initial Report, 173; Ocean Drilling Program: College Station, TX, USA, 1998. [Google Scholar] [CrossRef]
- Hao, S.; Mei, L.; Ranero, C.R.; Zhou, Z.; Pang, X.; Zheng, J. 3D crustal architecture and along-strike variation in the mid-northern South China Sea rifted margin. J. Geophys. Res. 2024, 129, e2023JB026876. [Google Scholar] [CrossRef]
- Reston, T.J. Evidence for shear zones in the lower crust offshore Britain. Tectonics 1988, 7, 929–945. [Google Scholar] [CrossRef]
- Clerc, C.; Jolivet, L.; Ringenbach, J.-C. Ductile extensional shear zones in the lower crust of a passive margin. Earth Planet. Sci. Lett. 2015, 431, 1–7. [Google Scholar] [CrossRef]
- Gao, J.; Wu, S.; McIntosh, K.; Mi, L.; Yao, B.; Chen, Z.; Jia, L. The continent–ocean transition at the mid-northern margin of the South China Sea. Tectonophysics 2015, 654, 1–19. [Google Scholar] [CrossRef]
- Nirrengarten, M.; Mohn, G.; Kusznir, N.J.; Sapin, F.; Despinois, F.; Pubellier, M.; Chang, S.P.; Larsen, H.C.; Ringenbach, J.C. Extension modes and breakup processes of the southeast China-Northwest Palawan conjugate rifted margins. Mar. Pet. Geol. 2020, 113, 104123. [Google Scholar] [CrossRef]
- Yan, P.; Zhou, D.; Liu, Z. A crustal structure profile across the northern continental margin of the South China Sea. Tectonophysics 2001, 338, 1–21. [Google Scholar] [CrossRef]
- Reston, T.J. The structure, evolution and symmetry of the magma-poor rifted margins of the North and Central Atlantic: A synthesis. Tectonophysics 2009, 468, 6–27. [Google Scholar] [CrossRef]
- Hopper, J.R.; Buck, W.R. The effect of lower crustal flow on continental extension and passive margin formation. J. Geophys. Res. 1999, 101, 20175–20194. [Google Scholar] [CrossRef]
- Clift, P.; Lin, J.; Barckhausen, U. Evidence of low flexural rigidity and low viscosity lower continental crust during continental break-up in the South China Sea. Mar. Petrol. Geol. 2002, 19, 951–970. [Google Scholar] [CrossRef]
- Clift, P.D. Coupled onshore erosion and offshore sediment loading as causes of lower crust flow on the margins of South China Sea. Geosci. Lett. 2015, 2, 13. [Google Scholar] [CrossRef]
- Morley, C.K.; Westaway, R. Subsidence in the super-deep Pattani and Malay basins of Southeast Asia: A coupled model incorporating lower-crustal flow in response to post-rift sediment loading. Basin Res. 2006, 18, 51–84. [Google Scholar] [CrossRef]
- Ren, J.; Pang, X.; Lei, C.; Yuan, L.; Liu, J.; Yang, L. Ocean and continent transition in passive continental margins and analysis of lithospheric extension and breakup process: Implication for research of the deepwater basins in the continental margins of South China Sea. Earth Sci. Front. 2015, 22, 102–114. [Google Scholar]
- Brun, J.P.; Sokoutis, D.; Van Den Driessche, J. Analogue modeling of detachment fault systems and core complexes. Geology 1994, 22, 319–322. [Google Scholar] [CrossRef]
- Martínez-Martínez, J.M.; Soto, J.I.; Balanyá, J.C. Orthogonal folding of extensional detachments: Structure and origin of the Sierra Nevada elongated dome (Betics, SE Spain). Tectonics 2002, 21, 1012. [Google Scholar] [CrossRef]
- Rey, P.F.; Teyssier, C.; Whitney, D.L. Extension rates, crustal melting, and core complex dynamics. Geology 2009, 37, 391–394. [Google Scholar] [CrossRef]
- Tirel, C.; Brun, J.-P.; Burov, E. Dynamics and structural development of metamorphic core complexes. J. Geophys. Res. 2008, 113, B04403. [Google Scholar] [CrossRef]
- Pérez-Gussinyé, M.; Reston, T.J. Rheological evolution during extension at nonvolcanic rifted margins: Onset of serpentinization and development of detachments leading to continental breakup. J. Geophys. Res. 2001, 106, 3961–3975. [Google Scholar] [CrossRef]
- Yang, P.; Pérez-Gussinyé, M.; Liu, S.; García-Pintado, J.; RaghuRam, G. Interactions between syn-rift magmatism and tectonic extension at intermediate rifted margins. Earth Planet. Sci. Lett. 2025, 671, 119682. [Google Scholar] [CrossRef]
- Zhang, J.; Zhao, M.; Ding, W.; Ranero, C.R.; Sallares, V.; Gao, J.; Zhang, C.; Qiu, X. New insights into the rift- to- drift process of the northern South China Sea margin constrained by a three- dimensional OBS seismic velocity model. J. Geophys. Res. 2023, 128, e2022JB026171. [Google Scholar] [CrossRef]
- Gallahue, M.M.; Stein, S.; Stein, C.A.; Jurdy, D.; Barklage, M.; Rooney, T.O. A compilation of igneous rock volumes at volcanic passive continental margins from interpreted seismic profiles. Mar. Pet. Geol. 2020, 122, 104635. [Google Scholar] [CrossRef]
- Nagao, T.; Uyeda, S. Heat flow measurements in the northern part of Honshu, northeast Japan, using shallow holes. Tectonophysics 1989, 164, 301–314. [Google Scholar] [CrossRef]
- Springer, M.; Förster, A. Heat-flow density across the Central Andean subduction zone. Tectonophyiscs 1998, 291, 123–139. [Google Scholar] [CrossRef]
- Taylor, B.; Huchon, P. Active Continental Extension in the Western Woodlark Basin: A Synthesis of Leg 180 results. In Proceedings of the Ocean Drilling Program Scientific Results; Huchon, P., Taylor, B., Klaus, A., Eds.; Ocean Drilling Program: College Station, TX, USA, 2002; Volume 180, pp. 1–36. [Google Scholar] [CrossRef]
- Hyndman, R.D.; Currie, C.A.; Mazzotti, S.P. Subduction zone backarcs, mobile belts, and orogenic heat. GSA Today 2005, 15, 4–10. [Google Scholar] [CrossRef]
- Manea, V.C.; Manea, M.; Ferrari, L.; Orozco-Esquivel, T.; Valenzuela, R.W.; Husker, A.; Kostoglodov, V. A review of the geodynamic evolution of flat slab subduction in Mexico, Peru, and Chile. Tectonophysics 2017, 695, 27–52. [Google Scholar] [CrossRef]
- Brune, S.; Williams, S.; Butterworth, N.; Müller, R.D. Abrupt plate accelerations shape rifted continental margins. Nature 2016, 536, 201–204. [Google Scholar] [CrossRef]
- Corti, G.; van Wijk, J.; Cloetingh, S.; Morley, C.K. Tectonic inheritance and continental rift architecture: Numerical and analogue models of the East African Rift system. Tectonics 2007, 26, TC6006. [Google Scholar] [CrossRef]
- Peng, X.; Li, C.; Song, T.; Wan, X.; Hou, W.; Wen, Y.; Li, Y.; Liu, Y.; Tang, F. Deep structures and lithospheric breakup processes at the northern continent-ocean transition zone of the South China Sea. Earth Sci. 2022, 47, 4245–4255. [Google Scholar] [CrossRef]
- Chenin, P.; Manatschal, G. Fingerprints of necking domains at rifted margins: A review of the best-documented examples worldwide. Earth Sci. Rev. 2025, 265, 105110. [Google Scholar] [CrossRef]
- Savva, D.; Pubellier, M.; Franke, D.; Chamot-Rooke, N.; Meresse, F.; Steuer, S.; Auxietre, J.L. Different expressions of rifting on the South China Sea margins. Mar. Pet. Geol. 2014, 58, 579–598. [Google Scholar] [CrossRef]
- Le Pourhiet, L.; Chamot-Rooke, N.; Delescluse, M.; May, D.A.; Watremez, L.; Pubellier, M. Continental break-up of the South China Sea stalled by far-field compression. Nat. Geosci. 2018, 11, 605–609. [Google Scholar] [CrossRef]
- Salazar-Mora, C.A.; Sacek, V. Effects of tectonic quiescence between orogeny and rifting. Tectonics 2023, 42, e2022TC007492. [Google Scholar] [CrossRef]


Disclaimer/Publisher’s Note: The statements, opinions and data contained in all publications are solely those of the individual author(s) and contributor(s) and not of MDPI and/or the editor(s). MDPI and/or the editor(s) disclaim responsibility for any injury to people or property resulting from any ideas, methods, instructions or products referred to in the content. |
© 2026 by the authors. Licensee MDPI, Basel, Switzerland. This article is an open access article distributed under the terms and conditions of the Creative Commons Attribution (CC BY) license.