Abstract
With the rapid development of infrastructure and the need to protect natural ecosystems, manufactured sand is used to replace river sand in concretes. To compare the deterioration patterns of concretes made with different sands, C50 specimens using basalt (C50X), tuff (C50N), and granite (C50H) manufactured sands and river sand (C50T) were prepared, then tested outdoors by full burial in a sulfate saline soil and indoors by accelerated freeze–thaw in a sulfate solution. The outdoor experiments indicate that C50X deteriorated the slowest, whereas the resistance to mass loss ranking was: C50X > C50H > C50N > C50T. In the indoor freeze–thaw experiments, C50X also performed best, retaining 51% relative dynamic modulus of elasticity (RDME) after 450 cycles. X-ray diffraction and scanning electron microscopy showed that C50T was weakened by abundant MgSO4·7H2O crystals, while C50X formed a denser matrix that limits salt-crystallization expansion. Moreover, a GM(1,1)-Markov model was developed to forecast long-term durability. For C50X, the model predicted an estimated service life of 68 months in the outdoor environment, at which point it is projected to reach the 5% mass loss failure threshold. Separately, it forecasted that the RDME would remain above 41% after 450 indoor freeze–thaw cycles.
1. Introduction
China’s infrastructure boom has caused a shortage of river sand, which can no longer satisfy the growing demands of the construction industry. To address this “sand crisis”, manufactured sand produced from specific rocks has become the mainstream fine aggregate in concrete. This transition not only alleviates the sand shortage but also reduces the risks of disturbing river morphology and ecosystems [1,2,3]. Compared with river sand, manufactured sand differs in rock lithology, particle morphology, and stone powder content, which directly impacts its long-term durability. Recent experimental works have shown that an appropriate amount of well-graded stone powder can improve paste filling and optimize the pore size distribution. However, excessive or improperly sized fines can lead to deterioration of durability [4,5,6,7]. The performance of concrete varies with the type of parent rock, necessitating tailored mix designs for different manufactured sands [8].
In Northwest China, concrete endures saline exposure with coupled freeze–thaw and sulfate attack [9,10]. This combined physical and chemical assault creates a complex damage mechanism that accelerates deterioration far beyond what either factor would cause alone. Research has explored this issue from various angles, including the impact of freeze–thaw on material stress–strain behavior [11], the role of moisture content [12], and the performance of recycled aggregates [13]. Moreover, Saboori established a load-freeze–thaw coupled constitutive model that provides guidance for dam and bridge engineering [14]; Kessler demonstrated through sulfate ion migration experiments that the synergistic action of de-icing salts and freeze–thaw cycles exacerbates concrete damage [15]; and Cho’s response surface method for limit state functions enabled a probabilistic quantitative assessment of freeze–thaw damage [16]. Field exposure studies have shown that concrete structures exposed for 21 years in the Qingdao area exhibit uneven chloride distribution on the surface but stable diffusion in deeper layers [17], and crack widths exceeding 0.15 mm significantly accelerate steel reinforcement corrosion [18]. For the special conditions of cold and saline environments, recent research has begun to focus on optimizing the durability of manufactured sand concrete, providing theoretical support for infrastructure construction in Northwest China through studies of typical aggregates like basalt and tuff [19].
Accurately predicting the long-term service life of concrete in such complex environments is crucial for durability design. However, traditional models are difficult to apply effectively due to random environmental disturbances and a lack of long-term observation data. To address this challenge, researchers have developed many theories: the first involves mechanistic models based on constitutive laws to describe the thermodynamic behavior of different salts at low temperatures and their reaction expansion coupling [20,21]. The second paradigm is data-driven, integrating methods like Response Surface Methodology [22,23], ensemble learning [24,25,26], and Grey System Theory [27,28] for the rapid prediction and multi-objective optimization of durability indicators. The Grey System Theory, proposed by Chinese scholar Deng Julong in 1982 [29], pioneered the solution to modeling problems with small samples and poor information. It uncovers underlying patterns through accumulated generating operations and correlation analysis, making it suitable for complex systems with incomplete information [30]. Such models have been successfully used to evaluate material performance under complex conditions. By constructing a comprehensive durability index using the entropy weight method and incorporating a GM model, the needs of engineering scenarios involving multiple indicators, time-variation, and uncertainty can be met [31,32]. These models can also be coupled with microstructural testing techniques like nuclear magnetic resonance to establish a grey modeling relationship between pore structure and macroscopic performance, providing a basis for the quantitative linkage between material parameters and service life [33].
In summary, current research on the durability of concrete under salt-freeze–thaw corrosion is mostly limited to laboratory environments, which can hardly simulate the damage mechanisms under the coupled action of cold and saline conditions. Therefore, this study, focusing on typical engineering concrete in Northwest China, compares the resistance of concretes made with basalt, tuff, and granite manufactured sands versus river sand to sulfate freeze–thaw action. It relies on a field observation base to conduct outdoor tests in 6% sulfate saline soil and indoor accelerated freeze–thaw tests. The study aims to reveal the durability deterioration laws and predict the change patterns of durability indicators using a GM(1,1)-Markov model, thereby promoting the application of typical manufactured sand in the infrastructure construction of Northwest China.
2. Materials and Methods
2.1. Experimental Material
The principal material is P.O 42.5 ordinary Portland cement; its properties are listed in Table 1. The coarse aggregate is crushed stone graded 5–10 and 10–20 mm, meeting GB/T 14685-2022 for crushing value and mud content [34]. The mineral admixtures included Class II fly ash supplied by Lanzhou Xigu Thermal Power Plant in Lanzhou, China, and S95-grade ground granulated blast-furnace slag with a Blaine specific surface area of 423 m2/kg, a flowability ratio of 109%, and a 7-day activity index of 75%. As shown in Figure 1, the fine aggregates included river sand from Jingyuan County, Baiyin, and three manufactured sands. The manufactured sands are tuff from Yongjing, Linxia; granite from Bashigou, Yuzhong; and basalt from Liuyuan, Dunhuang. As shown in Table 2, the basalt manufactured sand had the highest MB value, 10.2; the tuff manufactured sand had the largest crushing value index, 25.6%; the river sand had the lowest stone-powder content, 2.91%; and the basalt manufactured sand had the highest fineness modulus, 3.83. Overall, the basalt manufactured sand exhibits superior basic physical characteristics, which helps explain its wider use in concrete engineering [35]. In addition, a polycarboxylate high-performance water reducer with 30% water reduction by mass supplied by Sobute was used, and sodium chloride of purity greater than 99.5% was employed.

Table 1.
Physical and chemical properties of cement.
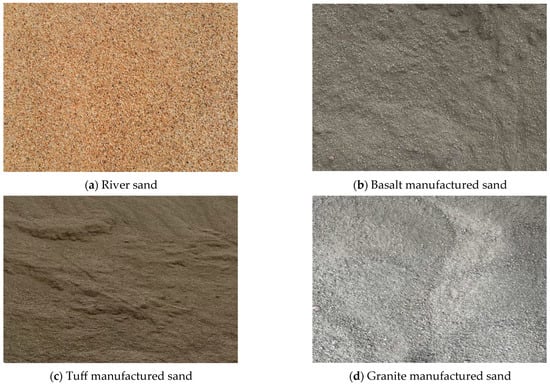
Figure 1.
Comparison between typical manufactured sand and river sand.

Table 2.
Basic physical indicators of four types of sand.
2.2. Specimen Preparation
C50 using basalt, granite, tuff, and river sand are referred to as C50X, C50H, C50N, and C50T, see Table 3. This base mix proportion was kept constant for all four concrete groups, with the only variable being the type of fine aggregate. To ensure a consistent comparison of mechanical and durability performance, all specimens were designed to a uniform slump of 180 mm. Two specimen sizes were prepared: 100 × 100 × 100 mm cubes and 100 × 100 × 400 mm prisms. Specimens were demolded 24 h after casting and then cured for 28 days in a humidity chamber at 20 ± 2 °C and 95% relative humidity.

Table 3.
Concrete mix proportions.
2.3. Design of Outdoor and Indoor Experiments
Outdoor experiments were conducted at the Field Scientific Observation and Research Base for the Long-Term Performance of Highway Infrastructure in the Cold and Arid Northwest Region. The site experiences extreme conditions, including instantaneous maximum wind speeds up to 50 m/s, about 143 freeze–thaw days per year, an average diurnal temperature range of 25.6 °C, and a dryness index of 21.67, classifying it as an extremely arid area. As shown in Figure 2, specimens were fully buried in soil replaced with local saline soil containing 6% sulfate by mass. The test duration was four years. After a 28-day curing period, baseline measurements were taken, and sampling continued at 90-day intervals for mechanical, mass-loss, carbonation-depth, and microstructural evaluations.
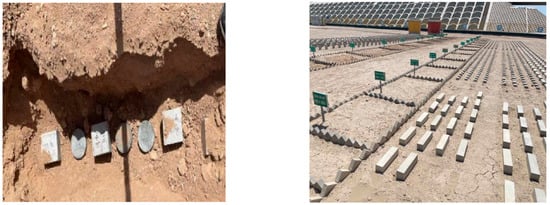
Figure 2.
Outdoor experiments of specimens in 6% sulfate saline soil.
The indoor accelerated salt-freeze deterioration experiments were conducted using an HC-HDK9 freeze–thaw testing machine, with a 6% Na2SO4 solution serving as the freeze–thaw medium, see Figure 3a. For each 4 h freeze–thaw cycle, the maximum temperature was set to 5 ± 2 °C and the minimum temperature was −18 ± 2 °C. Upon reaching the preset number of freeze–thaw cycles, the macroscopic mechanical properties of the specimens, such as compressive strength, flexural strength, and mass loss, were evaluated using a universal testing machine, see Figure 3b. In these indoor tests, the mass loss rate is a critical measure of internal damage, where less loss means better durability. For this study, specimens were tested in groups of three, and the mass loss rate was calculated according to Equation (1):
where negative values indicate mass gain and positive values indicate mass loss. is the mass loss rate, and and are the average masses of the specimens after 0 and n freeze–thaw cycles, respectively. The negative values indicate mass gain. According to the Chinese national standard (GB/T 50082-2024) [36], failure is deemed to occur when the relative mass loss reaches 5%.
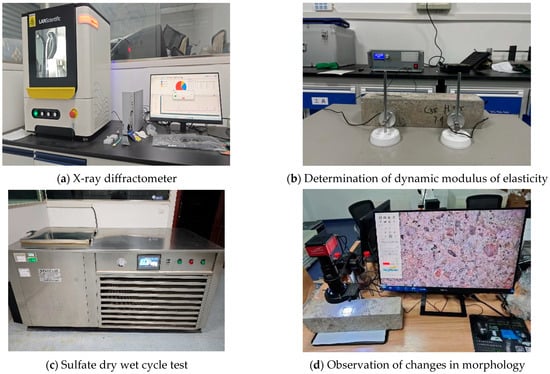
Figure 3.
Indoor test and instruments.
The relative dynamic modulus of elasticity (RDME) is another key index for internal damage. After the freeze–thaw cycles, a non-metallic ultrasonic detector was used to measure the acoustic velocity of the specimens, and the RDME was calculated according to Equation (2). Furthermore, surface changes were captured by an industrial camera, and SEM and XRD were used for microstructural analyses, see Figure 3c,d.
where denotes the RDME, and and are the ultrasonic pulse velocities at 0 and n cycles, respectively. Failure is deemed to occur when the RDME reaches 60%.
3. Experimental Results
3.1. Deterioration Analysis of Concretes in Outdoor Saline Soil
As shown in Figure 4, the mass of all specimens increased initially and then decreased. During the first 15 months of the test, all specimens were in a phase of mass gain. C50X showed the slowest increase, whereas the C50T and C50N rose more rapidly at early ages. This increase is attributed to two factors: continuous ingress of corrosive ions that fill pores, and capillary absorption of water into microcracks. Differences in the rate of mass gain reflect the compactness of the internal pore structure. The slower gain in the C50X and C50H indicates a denser matrix that better resists external ingress. After about 15 months, the specimens transitioned from mass gain to mass loss. This deterioration was jointly driven by chemical attack and physical crystallization. The combined action of multiple corrosive ions, dominated by SO42− and accompanied by Cl− and CO32−, began to exceed the intrinsic resistance of the concrete matrix. In particular, SO42− and CO32− reacted with Ca(OH)2, forming products such as ettringite, gypsum, and calcite, which imposed circumferential tensile stresses on pore walls and led to cracking and spalling. Prolonged chemical exposure also degraded the C–S–H gel, reducing strength so that the time to reach the critical damage threshold shortened. By approximately 24 months, the rate of deterioration accelerated, owing to the coupled effects of sulfate ingress and carbonation. Over the entire experiment, resistance to mass loss ranked as: C50X > C50H > C50N > C50T.
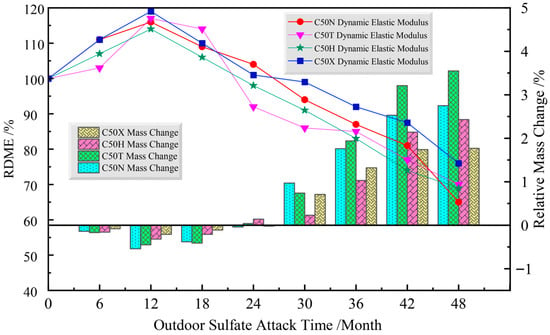
Figure 4.
The variation in mass and RDME in outdoor experiments.
Similar to mass loss, RDME of all specimens followed a two-stage pattern: an initial rise, peaking within 12 months, followed by a steady decline. For example, C50X attained 117% at month 12 but had fallen to 102% by month 21, indicating significant physicochemical interaction with salts in the saline soil. The initial RDME increase was driven by two key mechanisms. First, a moisture gradient triggered the secondary hydration of cement, which densified the concrete’s microstructure and increased its stiffness. Second, slow ingress of chloride ions led to the formation of stable reaction products that further filled and refined the pore structure. With longer exposure, RDME entered a phase of decline. After four years, RDME of C50N, C50T, C50H, and C50X decreased to 65%, 70%, 69%, and 76%, respectively. This decline reflects the accelerated ingress of multiple corrosive ions, including Cl−, SO42−, CO32−, HCO3−, and Mg2+. For example, the reaction of chloride ions with calcium hydroxide generates products that induce crystallization expansion stress within the pores. This leads to the initiation and propagation of microcracks, which compromise the stiffness of the matrix. Based on the experimental results, the final ranking of RDME for the concretes is C50X > C50H > C50T > C50N.
3.2. Deterioration Analysis of Concretes Under Indoor Accelerated Freeze–Thaw in Sulfate Solution
As shown in Figure 5, mass for all specimens under indoor accelerated freeze–thaw in sulfate solution increased initially and then decreased. Overall, C50X exhibits better salt–freeze resistance than other concretes. During the initial stage of 0 to 50 cycles, the mass of all specimens increases. This is because the physical damage from freeze–thaw action was not yet pronounced. The mass increase was primarily caused by two factors: the penetration of corrosive ions reacting with hydration products to fill pores, and the absorption of water into micro-cracks. During the stage of 0 to 100 cycles, the manufactured sand concretes show similar mass loss rates. As cycling continued, the mass loss of C50N and C50H began to exceed that of C50X. By contrast, C50T shows earlier visible deterioration such as surface spalling and aggregate exposure. In the late stage of experiment, internal microcracks propagate, surface spalling and aggregate exposure appear, and mass loss increases sharply. The RDME follows a trend similar to mass change, with an initial rise followed by a decline. C50T specimen degraded most severely, reaching the failure criterion first at 250 and 275 cycles. By 50 cycles the C50T shows a faster RDME drop than manufactured sand concretes, implying earlier internal damage. This poor durability is due to the fact that freeze–thaw cycles promote the diffusion of SO42−, increasing their concentration and erosion depth, which in turn exacerbates internal damage. Furthermore, fluctuations in mass and RDME were observed, which can be attributed to the macroscopic manifestation of the competing effects of thermal stress and the expansion from internal crystallization [21].
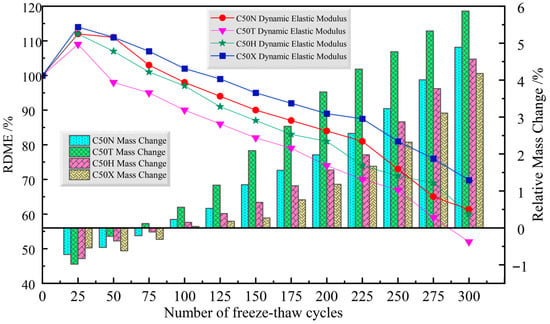
Figure 5.
The variation in mass and RDME in indoor experiments.
3.3. Morphology and Microstructural Analysis of Specimens Under Indoor Accelerated Freeze–Thaw
Figure 6a–d show the surface morphology of the different concretes after 50, 100, 150, and 200 freeze–thaw cycles in sulfate solution. As can be seen in Figure 6d, all specimens exhibited varying degrees of mortar spalling and exposure of fine aggregate. Among them, the deterioration of C50T was the most severe; its outer layer had almost completely spalled off, leading to large-scale exposure of aggregate. In contrast, the surface of C50X remained relatively intact, showing the least amount of damage. Figure 6e–h, captured by the industrial camera, provide a magnified view of the surface morphology and micro texture after 200 cycles, revealing the distinct failure modes of each concrete. The deterioration of the river sand concrete, C50T, was the most severe. Its surface shows extensive spalling and pitting, where the cement paste has been eroded away, leaving coarse aggregates fully exposed and ‘popping out.’ This visible loss of paste cohesion and matrix integrity directly explains its rapid failure and the significant mass loss recorded in the tests.
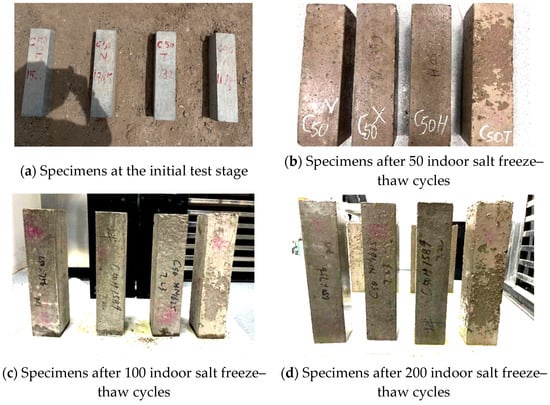
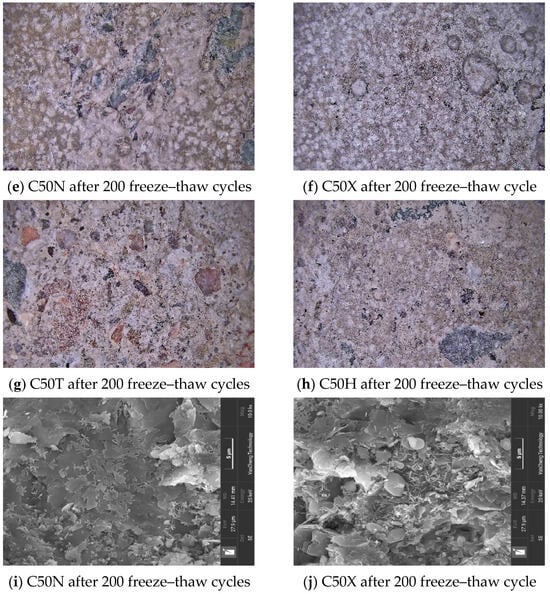
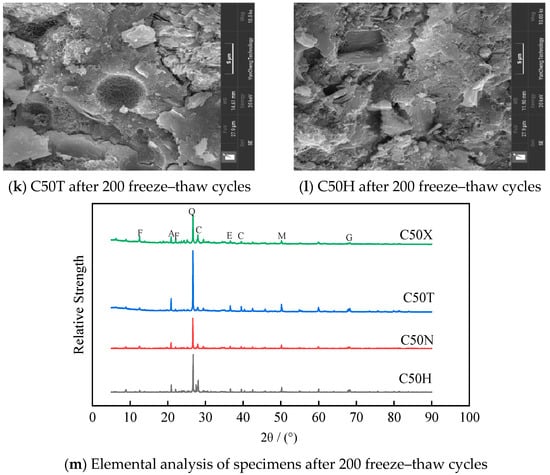
Figure 6.
Morphology and microstructural analysis of specimens.
The SEM images in Figure 6i–l reveal the microstructural features. A large number of acicular and lath-shaped crystals of unequal diameter were generated within the concrete. These crystals were either independently distributed in pores or grew out from the surrounding gel matrix, leading to a porous and loose gel structure with poor adhesion to the aggregate. This degradation of the gel matrix and the loss of adhesion at the aggregate interface are the direct microstructural causes for the reduction in material stiffness, as measured by the decline in RDME. In C50T, pores were filled with crisscrossing acicular crystals. C50H shows short rod clusters emanating from gel with associated cracking. The crystals are mainly products of sulfate reacting with hydration phases, including ettringite, gypsum, and Friedel’s salt. These products not only destroy the pore structure through crystallization pressure but also consume a large amount of the cementitious gel, weakening the bond between aggregates. The XRD patterns in Figure 6m were used to analyze the specific phases of the corrosion products: Q = SiO2, F = Friedel’s salt, C = CaCO3, E = Ettringite, A = Antarcticite, M = MgSO4·7H2O, MH = Mg(OH)2. Overall, C50T contains more corrosion products, with particularly high MgSO4·7H2O that aggravates damage. Under the combined action of unbalanced stresses from freeze–thaw cycles and the expansion pressure of corrosion products, the concrete is highly prone to cracking. This internal cracking network disrupts the concrete’s structural integrity and continuity, which directly manifests as the significant and rapid drop in RDME observed in specimens like C50T. As the width and number of cracks increase, corrosion products and internal hydration products are continuously leached out through these cracks. This continuous leaching and surface spalling of material is the primary mechanism for the accelerating mass loss measured during the later stages of the freeze–thaw tests. In an outdoor environment, strong ultraviolet radiation and repeated freeze–thaw cycles would further accelerate this deterioration process.
In summary, the salt-induced damage in concrete is a multi-mechanism coupled process. The chemical composition of the original cementitious gel changes, and it exhibits various deteriorated morphologies such as fibrous and flaky forms [37]. Concurrently, new lath-shaped crystals preliminarily identified as aggregates of ettringite and gypsum are formed internally. The crystallization expansion pressure from these corrosion products, combined with thermal stress from temperature differences, appears to be a primary driver for initiating and propagating cracks within the matrix. This process fatally reduces the cohesion of the matrix, which directly explains the macroscopic performance failure observed as a critical decrease in RDME and the onset of mass loss.
4. Service Life Prediction of Concretes Based on the GM(1,1)-Markov Model
4.1. Development of the GM(1,1)-Markov Model
In the framework of Grey System Theory, the GM(1,1) model serves as a fundamental and widely applied prediction tool [38]. Owing to its computational efficiency and low data requirements, it has become one of the core models for predicting the service life of concrete. The model targets a single variable within a system, establishing a grey prediction model through first-order cumulative generation and the construction of a differential equation based on limited historical data. Its primary advantage is its ability to capture the intrinsic patterns of system change even in cases of scarce or incomplete information, thereby providing reliable scientific support for life prediction. In this study, the development of this prediction model began with the original mass or RDME sequence. A first-order Accumulated Generating Operation was applied to this sequence . This operation is a key step in Grey Theory, which functions as a cumulative summing process: a new data sequence, , is generated where each point is the running total of the original sequence. The primary purpose of this operation is to dampen random fluctuations and “noise” in the original data, which is often irregular in systems with small samples. By accumulating the data, the AGO transforms the erratic sequence into a much smoother one, revealing a more pronounced exponential pattern that the GM(1,1) model can then effectively capture. Subsequently, a grey differential equation was established for the newly generated sequence , and the model parameters, a and b, were estimated using the least squares method. The time response function was then solved, and the predicted value sequence was obtained through an inverse accumulated generating operation. Finally, the relative error was calculated to evaluate the model’s baseline fitting and extrapolation performance. The specific formulas used in the GM(1,1) model are as follows:
The Time Response Function is expressed as
The final predicted value is calculated by
The relative error between predicted and actual values is determined using
where is the relative error, is the original data, and is the predicted value.
However, the GM(1,1) model struggles to comprehensively incorporate various influencing factors, especially when experimental data exhibit significant fluctuations [39]. To solve this problem, this study introduces a combined GM(1,1)-Markov model. This model first generated an initial prediction using the GM(1,1) model, then calculated the residuals between the predicted and observed values to construct a residual sequence model. Subsequently, a Markov transition matrix was used to analyze the state transition patterns of the residuals. Finally, a more precise prediction was obtained by correcting the residuals. This method effectively improves upon the accuracy limitations of the GM(1,1) model under conditions of high randomness and more accurately characterizes the dynamic features of the system.
The GM(1,1)-Markov Model is formulated as
The Markov Correction Process is as follows: The residuals were categorized into two states based on their sign: State 1 for positive errors and State 2 for negative errors. The probability of transitioning between these states was calculated as follows:
where is the probability of moving from state to state , is the number of times that transition occurred, and is the total count of state .
A state transition matrix is then created:
Finally, the initial prediction is adjusted with the corrected residual to get the final value:
To make sure the model is reliable, its accuracy was checked using a method called the a posteriori error test. This test assesses the model’s performance using two key metrics: the mean square error ratio (C) and the small error probability (P). According to the criteria in Table 4, a C-value below 0.35 and a p-value above 0.95 indicate an “Excellent” prediction performance.

Table 4.
Model accuracy reference.
4.2. Prediction Results
4.2.1. Service Life Prediction in Outdoor Saline Soil
Figure 5 compares the measured values of the four C50 concrete types with the predictions from the GM(1,1)-Markov model. The predictive adequacy of the models was validated using the posteriori error test, with the key statistics presented in Table 5. The models for C50T, C50N, and C50X all achieved a “Level I” accuracy grade. The C50H mass model also performed strongly, achieving a “Level II” rating with a C-value of 0.3405 and a p-value of 0.90. Crucially, the model parameters a and b directly reflect the physical deterioration patterns observed. The parameter ‘a’ represents the development coefficient, which dictates the rate of exponential change. In the mass loss models, the C50X specimen, which exhibited the highest durability and slowest degradation, corresponds to the smallest development coefficient. This small ‘a’ value mathematically signifies the slowest exponential decay, thus aligning the model’s internal logic with the observed superior material performance.

Table 5.
Model parameters and C/P statistics for outdoor tests.
According to Figure 7a, the times required to reach the failure threshold of 5% mass loss are 68, 49, 48, and 58 months for C50X, C50H, C50T, and C50N, respectively. This result indicates that C50X exhibits the highest resistance to deterioration, whereas C50T has the poorest durability. As shown in Figure 7b, the predicted times required for RDME to decrease to 60% were 69, 52, 67, and 51 months for C50X, C50H, C50T, and C50N, respectively. The outdoor saline soil environment accelerates deterioration for several reasons. First, the concrete is full contact with the sulfate soil, allowing sulfate ions to penetrate the concrete from all sides. Second, stable salt and moisture shorten the pathways for these ions to seep in through capillary action and diffusion, which speeds up the breakdown of the cement. This allows the corrosive ions to continuously attack the concrete’s internal structure, worsening microcracks and reducing strength, which ultimately leads to a decline in both mass and RDME.
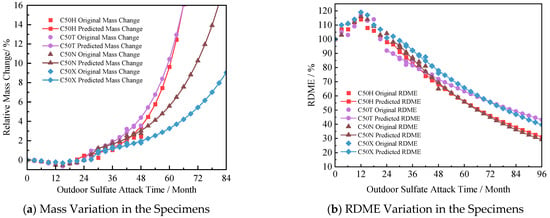
Figure 7.
Predictions of specimen mass loss and RDME in outdoor tests.
4.2.2. Service Life Prediction Under Indoor Accelerated Freeze–Thaw
For the indoor accelerated freeze–thaw experiments, GM(1,1) models were also established to predict the mass and RDME. The predictive adequacy of these models was substantiated using the a posteriori error test, with the detailed C/P statistics presented in Table 6. The validation results demonstrate a uniformly high level of accuracy across all eight models. For both mass change and RDME, all four concrete types achieved a “Level I” accuracy grade. The mean square error ratios were all well below the 0.35 threshold, ranging from 0.1108 to 0.2074, and all small error probabilities were 1.0. The subsequent predictions, shown in Figure 8, are therefore based on these validated models.

Table 6.
Model parameters and C/P statistics for indoor freeze–thaw tests.
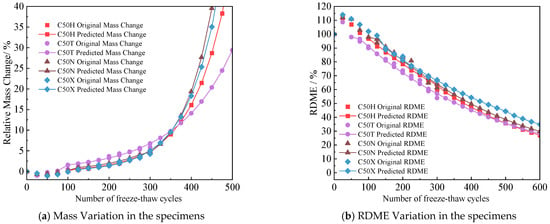
Figure 8.
Predictions of specimen mass loss and RDME in indoor tests.
According to Figure 8a, the deterioration rates of C50N and C50T were the fastest in the indoor experiments. When mass loss reaches 20%, the predicted numbers of freeze–thaw cycles required for C50X, C50H, C50T, and C50N were 440, 410, 380, and 360 cycles, respectively. The deterioration rate of C50X was approximately 22% slower than that of C50N. The prediction results in Figure 8b indicate that after 450 freeze–thaw cycles, the RDME for C50X, C50H, C50T, and C50N were expected to reach 51%, 41%, 39%, and 44%, respectively. There are several reasons for the superior frost resistance exhibited by C50X. First, basalt has a high hardness, resulting in manufactured sands with sharp angles that create a stronger mechanical interlock with the cement. Concurrently, its low water absorption rate effectively inhibits the propagation of microcracks during freeze–thaw cycles. Second, an appropriate stone powder content (5–7%) fills the matrix pores, enhancing the compactness of the concrete. This powder also promotes the cement hydration reaction, generating more gel substances that impede sulfate penetration and mitigate damage from salt crystallization pressure. In contrast, tuff has high porosity and less active stone powder. River sand lacks the angularity effects of manufactured sand, making these materials more susceptible to surface spalling in freeze–thaw cycles.
5. Conclusions
This study investigated the deterioration patterns of C50 made with manufactured sands and river sand, using a combined methodology of outdoor tests and indoor accelerated freeze–thaw tests. A GM(1,1)-Markov model was subsequently developed to predict their service life. The main conclusions are as follows:
(1) Outdoor tests indicate a two-stage deterioration characteristic of “initial strengthening followed by degradation”. In the 0–15 months, moisture gradients drove secondary hydration of cement, increasing both mass and RDME. After 15 months, the coupled effects of sulfate attack and carbonation, causing an accelerated decline in mass and RDME. The overall ranking of deterioration resistance throughout the test period was: C50X > C50H > C50N> C50T.
(2) Similar patterns were observed in the indoor accelerated freeze–thaw tests. Both mass and RDME exhibited a trend of an initial increase followed by a decrease. C50X showed the best deterioration resistance among the samples. C50T deteriorated the fastest, exhibiting earlier signs of surface spalling and aggregate exposure. Between 0 and 100 freeze–thaw cycles, the mass loss rates of the C50N, C50H, and C50X specimens were nearly identical, but in later stages, the mass loss of C50N and C50H gradually surpassed that of C50X.
(3) Microstructural analysis via SEM and XRD revealed the intrinsic damage mechanism. Under accelerated freeze–thaw cycles, a large number of lath-shaped crystals formed within the concrete, primarily ettringite and gypsum. XRD analysis further confirmed that the C50T specimen, which exhibited the poorest durability, contained a high concentration of the highly corrosion product MgSO4·7H2O. The expansion pressure from these crystals, combined with freeze–thaw stress, causes internal cracking and failure.
(4) Based on the GM(1,1)–Markov model and the unified failure criteria, the predicted times to reach 5% mass loss under outdoor saline soil were about 68, 49, 48, and 58 months for C50X, C50H, C50T, and C50N, respectively. C50X exhibits the slowest degradation: its mass loss rate is reduced by about 22% and 31% relative to C50N and C50T. Under indoor saline freeze–thaw, after 450 cycles the predicted RDME values are 51%, 41%, 39%, and 44% for C50X, C50H, C50T, and C50N, respectively, all at or below the RDME ≤ 60% failure threshold. C50X retained the highest stiffness. The superior performance of C50X is attributed to its physical attributes: a harder parent rock and angular particles that enhance mechanical interlock with paste, together with low water absorption that suppresses the propagation of freeze–thaw microcracks.
Author Contributions
Conceptualization, L.Z., H.Q. and A.S.; methodology, L.Z.; software, Y.D. and F.Z.; validation and investigation, S.S.; resources, H.Q. and F.Z.; writing—original draft preparation, L.Z.; writing—review and editing, Y.D.; funding acquisition, L.Z. and A.S. All authors have read and agreed to the published version of the manuscript.
Funding
This research was funded by the National Natural Science Foundation of China (NSFC), through the Joint Funds (grant number U23A20658) and the Young Scientists Fund (grant number 52508370); and by the Natural Science Foundation of Liaoning Province (Doctoral Start-up Fund; grant number 2025080377-JH3/101).
Data Availability Statement
All data generated or analyzed during this study are included in this paper.
Acknowledgments
The authors would like to thank the National Natural Science Foundation of China, through the Joint Funds (U23A20658) and the Young Scientists Fund (52508370), and the Natural Science Foundation of Liaoning Province (Doctoral Start-up Fund, 2025080377-JH3/101) for their funding support. The authors also wish to express their sincere gratitude to Xiaosen Yang and Hanghang Wang for their valuable assistance and technical support during the experimental process and data validation.
Conflicts of Interest
The authors declare that they have no known competing financial interests or personal relationships that could have appeared to influence the work reported in this paper.
Abbreviations
The following abbreviations are used in this manuscript:
| C50 | Concrete strength grade 50 |
| C50X | C50 concrete with basalt manufactured sand |
| C50H | C50 concrete with granite manufactured sand |
| C50N | C50 concrete with tuff manufactured sand |
| C50T | C50 concrete with river sand |
| RDME | Relative Dynamic Modulus of Elasticity |
| GM(1,1) | Grey Model, first-order, one-variable |
| GM(1,1)–Markov | Combined Grey Model and Markov chain model |
| MB (value) | Methylene Blue value |
| SEM | Scanning Electron Microscopy |
| XRD | X-ray Diffraction |
| C–S–H | Calcium silicate hydrate gel |
| SO42− | Sulfate ion |
| Cl− | Chloride ion |
| CO32− | Carbonate ion |
| HCO3− | Bicarbonate ion |
| Mg2+ | Magnesium ion |
| MgSO4·7H2O | Magnesium sulfate heptahydrate/Epsomite |
| Mg(OH)2 | Magnesium hydroxide |
| CaCO3 | Calcium carbonate |
References
- Wang, H.; Wang, P.; Zhang, X.; Chen, W.-Q.; Tzachor, A.; Fishman, T.; Schandl, H.; Acuto, M.; Yang, Y.; Lu, Y.; et al. Substantial increase in China’s manufactured sand supply since 2010. Nat. Geosci. 2024, 17, 833–836. [Google Scholar] [CrossRef]
- Ma, Y.; Chai, Y.; Xu, Y.J.; Li, Z.; Zheng, S. Spatial and temporal changes of sand mining in the Yangtze River basin since the establishment of the Three Gorges Dam. Int. J. Environ. Res. Public Health 2022, 19, 16712. [Google Scholar] [CrossRef] [PubMed]
- Xue, W.; Peng, X.; Alam, M.S.; Wang, Z.; Wu, H.; Lin, J. Pore structure, mechanical property and permeability of concrete under sulfate attack exposed to freeze–thaw cycles. Arch. Civ. Mech. Eng. 2024, 24, 130. [Google Scholar] [CrossRef]
- Zhou, A.; Miao, G.; Zhang, Y.; Qian, R.; Zhang, Y.; Shi, J.; Yang, Y.E. Effects of stone powder on microstructure of manufactured-sand concrete and its gas permeability. J. Build. Eng. 2024, 91, 109539. [Google Scholar] [CrossRef]
- Huang, J.; Xu, G.; Chen, S.; Yu, D.; Fu, T.; Feng, C.; Wang, Y. Enhancing Mechanical Properties and Microstructures of Mass-Manufactured Sand Concrete by Incorporating Granite Powder. Materials 2024, 17, 2234. [Google Scholar] [CrossRef]
- Zhang, M.; Xu, J.; Li, M.; Yuan, X. Influence of stone powder content from manufactured sand concrete on shrinkage, cracking, compressive strength, and penetration. Buildings 2023, 13, 1833. [Google Scholar] [CrossRef]
- Zhou, A.; Qian, R.; Miao, G.; Zhang, Y.; Xue, C.; Zhang, Y.; Qiao, H.; Shi, J. Gas permeability characteristics of granite-manufactured sand concrete and its numerical simulation using NMR-MIP modified method. Constr. Build. Mater. 2024, 431, 136520. [Google Scholar] [CrossRef]
- Wang, Z.; Li, H.; Huang, F.; Yang, Z.; Wen, J.; Shi, H. Mechanical Properties of Railway High-strength Manufactured Sand Concrete: Typical Lithology, Stone Powder Content and Strength Grade. J. Wuhan Univ. Technol.-Mat. Sci. Ed. 2025, 40, 194–203. [Google Scholar] [CrossRef]
- Wu, H.; Lv, C.; Xu, Y.; Sun, Y.; Qu, S.; Zhou, X. Deterioration of Concrete Under the Combined Action of Sulfate Attack and Freeze–Thaw Cycles: A Review. Materials 2025, 18, 4309. [Google Scholar] [CrossRef]
- Hu, S.; Yin, Y. Fracture properties of concrete under freeze–thaw cycles and sulfate attack. Constr. Build. Mater. 2022, 350, 128856. [Google Scholar] [CrossRef]
- Liu, X.; Lei, Y.; Sun, Y.; Zhou, J.; Niu, D. Influence of freeze–thaw damage gradient on stress–strain relationship of stressed concrete. Front. Struct. Civ. Eng. 2023, 17, 1326–1340. [Google Scholar] [CrossRef]
- Yuan, P.; Zhu, Y.; Li, D.; Lu, X. Effect of freeze-thaw cycle and moisture content on compressive and energy properties of alkali slag ceramsite concrete. KSCE J. Civ. Eng. 2024, 28, 1980–1991. [Google Scholar] [CrossRef]
- Zheng, C.; Li, L.; Zong, Z. Study on the sulfate freezethaw resistance of recycled coarse aggregate self-compacting concrete. Structures 2024, 61, 105973. [Google Scholar] [CrossRef]
- Saboori, A. Application of Damage Mechanics to Describe the Behavior of Concrete Under Fatigue and Freeze-Thaw Processes. Master’s Thesis, North Dakota State University, Fargo, ND, USA, 2015. [Google Scholar]
- Kessler, S.; Thiel, C.; Grosse, C.U.; Gehlen, C. Effect of freeze–thaw damage on chloride ingress into concrete. Mater. Struct. 2017, 50, 121. [Google Scholar] [CrossRef]
- Cho, T. Prediction of cyclic freeze–thaw damage in concrete structures based on response surface method. Constr. Build. Mater. 2007, 21, 2031–2040. [Google Scholar] [CrossRef]
- Leng, F.; Ma, X.; Ding, W.; Wang, J.; Zhou, Y.X.; Ji, X.K. Durability analysis of reinforced concrete piles exposed for 17 years in a coastal saline-soil environment. Build. Struct. 2011, 41, 148–151. (In Chinese) [Google Scholar]
- Feng, G.; Jin, Z.; Xiong, C.; Fan, J. Corrosion behavior of corrosion-resistant steel in cracked concrete exposed to the marine tidal zone for 700 days. Mater. Rep. 2020, 34, 8064–8070. (In Chinese) [Google Scholar]
- Zhou, Z.; Sun, M. Stochastic damage model of concrete during freeze-thaw process. Adv. Mater. Res. 2012, 450, 102–109. [Google Scholar] [CrossRef]
- Zhang, M.; Zou, D.; Fan, Z.; Qin, S.; Zhou, A.; Liu, T. Thermo-hydro-chemo-mechanical coupled modeling of concrete under sulfate attack and freeze-thaw cycles. Constr. Build. Mater. 2025, 494, 143504. [Google Scholar] [CrossRef]
- Gan, L.; Xu, W.; Shen, Z.; Xu, L.; Zhang, W.; Zhang, H.; Abbas, M.A.; Chen, G. Experimental and numerical investigations on damage evolution of concrete under sulfate attack and freeze-thaw cycles. J. Build. Eng. 2023, 71, 106469. [Google Scholar] [CrossRef]
- Wang, X.; Cui, F.; Cui, L.; Jiang, D. Research on a Multi-Objective Optimization Design for the Durability of High-Performance Fiber-Reinforced Concrete Based on a Hybrid Algorithm. Coatings 2023, 13, 2054. [Google Scholar] [CrossRef]
- Alani, A.H.; Johari, M.A.M.; Aldosary, M.H.; Majid, T.; Bunnori, N.M. Optimizing Sustainable High-performance Green-concrete Characteristics with Minimum Cement Content: Experimental Program. Jordan J. Civ. Eng. 2025, 19, 57–73. [Google Scholar]
- Chen, H.; Deng, T.; Du, T.; Chen, B.; Skibniewski, M.J.; Zhang, L. An RF and LSSVM–NSGA-II method for the multi-objective optimization of high-performance concrete durability. Cem. Concr. Compos. 2022, 129, 104446. [Google Scholar] [CrossRef]
- Yang, S.; Chen, H.; Feng, Z.; Qin, Y.; Zhang, J.; Cao, Y.; Liu, Y. Intelligent multiobjective optimization for high-performance concrete mix proportion design: A hybrid machine learning approach. Eng. Appl. Artif. Intell. 2023, 126, 106868. [Google Scholar] [CrossRef]
- Liu, W.; Liu, G.; Zhu, X. Applicability of machine learning algorithms in predicting chloride diffusion in concrete: Modeling, evaluation, and feature analysis. Case Stud. Constr. Mater. 2024, 21, e03573. [Google Scholar] [CrossRef]
- Ansari, M.A.; Shariq, M.; Mahdi, F. Multi-optimization of FA-BFS based geopolymer concrete mixes: A synergistic approach using grey relational analysis and principal component analysis. Structures 2025, 71, 108007. [Google Scholar] [CrossRef]
- Ali, A.; Khan, Q.U.Z.; Mehboob, S.S.; Tayyab, A.; Hayyat, K.; Khan, D.; Haq, I.U.; Qureshi, Q.B.A.I.L. Enhancing multi-objective mix design for GGBS-based geopolymer concrete with natural mineral blends under ambient curing: A Taguchi-Grey relational optimization. Ain Shams Eng. J. 2024, 15, 102708. [Google Scholar] [CrossRef]
- Liu, S.; Forrest, J.; Vallée, R. Emergence and development of grey systems theory. Kybernetes 2009, 38, 1246–1256. [Google Scholar] [CrossRef]
- Liu, S. Grey Systems Analysis: Methods, Models and Applications, 2nd ed.; Springer: Singapore, 2025. [Google Scholar] [CrossRef]
- Qin, Y.; Guan, K.; Kou, J.; Ma, Y.; Zhou, H.; Zhang, X. Durability evaluation and life prediction of fiber concrete with fly ash based on entropy weight method and grey theory. Constr. Build. Mater. 2022, 327, 126918. [Google Scholar] [CrossRef]
- Lan, S.; Tian, W.; Zhang, H.; Han, Z.; Li, H. Durability evaluation and life prediction of steel slag coarse aggregate concrete based on entropy weight method and grey theory. Bull. Chin. Ceram. Soc. 2023, 42, 3710–3721. [Google Scholar]
- Zhang, S.; Zheng, S.; Wang, E.; Dai, H. Grey model study on strength and pore structure of self-compacting concrete with different aggregates based on NMR. J. Build. Eng. 2023, 64, 105560. [Google Scholar] [CrossRef]
- GB/T 14685-2022; Pebble and Crushed Stone for Construction. Standardization Administration of China: Beijing, China, 2022.
- Lu, L.; Yang, Z.; Li, K.; Zhang, K.; Yan, X.; Marano, G.C.; Briseghella, B. Synergy of inert granite powder and active mineral admixture in manufactured sand mortar: The effect on mechanical properties, chloride permeability and water absorption properties. Constr. Build. Mater. 2023, 408, 133660. [Google Scholar] [CrossRef]
- GB/T 50082-2024; Standard for Test Methods of Long-Term Performance and Durability of Concrete. China Architecture & Building Press: Beijing, China, 2024.
- Wang, R.; Zhang, Q.; Li, Y. Deterioration of concrete under the coupling effects of freeze–thaw cycles and other actions: A review. Constr. Build. Mater. 2022, 319, 126045. [Google Scholar] [CrossRef]
- Fu, Y.; Qiao, H.; Hakuzweyezu, T. Reliability Analysis of Reinforcement Based on GM (1, 1)-Markov Semi-immersion Test. J. Wuhan Univ. Technol.–Mater. Sci. Ed. 2024, 39, 1177–1187. [Google Scholar] [CrossRef]
- Yu, J.; Liu, D.; Zhang, Z. Durability and life prediction analysis of recycled aggregate concrete with ceramic waste powder under freeze-thaw conditions based on impact-echo method and Grey-Markov model. Front. Mater. 2022, 9, 1060294. [Google Scholar] [CrossRef]
Disclaimer/Publisher’s Note: The statements, opinions and data contained in all publications are solely those of the individual author(s) and contributor(s) and not of MDPI and/or the editor(s). MDPI and/or the editor(s) disclaim responsibility for any injury to people or property resulting from any ideas, methods, instructions or products referred to in the content. |
© 2025 by the authors. Licensee MDPI, Basel, Switzerland. This article is an open access article distributed under the terms and conditions of the Creative Commons Attribution (CC BY) license (https://creativecommons.org/licenses/by/4.0/).