Abstract
Urbanization poses significant challenges for fault investigation, as it can obscure or even hide surface fault expressions and limit access to potential study sites. This paper reports the preliminary results of Electrical Resistivity Tomography combined with geological field surveys in the urbanized area of Villa d’Agri (Marsicovetere, Basilicata Region, Southern Italy), which has undergone significant expansion in recent decades. This area is located at the northeastern border of the High Agri Valley, characterized by the Eastern Agri Fault System, one of the fault systems believed to have caused the M 7.0 earthquake in 1857 in Southern Italy. The combined use of Electrical Resistivity Tomography and geological field investigations in previously inadequately explored areas, along with the reprocessing of data provided by the technical office of Marsicovetere, allowed imaging of a previously unknown fault and reconstruction of sedimentary cover and substratum geometries, particularly in the urban and peri-urban sectors of Villa d’Agri. These preliminary findings provide valuable insights for geological and structural studies and have prompted the attention of the municipal decision makers, supporting further research aimed at enhancing urban management and seismic risk assessment.
1. Introduction
Fault investigation is crucial for earthquake risk assessment because faults are the primary sources of earthquakes, and their characteristics directly influence ground shaking during seismic events. Additionally, studying faults is important as they affect the geological setting, which in turn influences seismic ground motion and overall hazard evaluation. The surface traces of faults are not always clearly visible. In some cases, faults are blind, while in others, extensive urbanization and/or centuries-long agricultural activities can obscure or completely hide surface fault expressions, limiting access to potential study sites. The investigation of such faults often requires a multidisciplinary approach, employing complementary remote sensing and in situ techniques to address the weaknesses and limitations of each technique. Remote sensing techniques, performed from satellites, aircraft, or drones, offer spatially extensive data over large areas, which is critical for studying faults at regional scales. They include synthetic aperture radar interferometry (InSAR) [1], LiDAR [2], optical imaging [3], airborne gravity, magnetic and electromagnetic surveys [4], among others.
In situ geophysical techniques, on the other hand, provide more detailed and localized information. These include ground penetrating radar [5,6], electrical resistivity tomography [7,8], gravity surveys [9,10], magnetic and electromagnetic surveys [11], radiomagnetotelluric and very low frequency electromagnetic induction techniques [12], magnetotelluric investigation [13,14,15], active and passive seismic techniques (e.g., multichannel analysis of surface waves, ambient noise measurements, seismic reflection/refraction surveys, etc.) [16,17], and various other in situ geophysical techniques. Notably, Electrical Resistivity Tomography (ERT) is increasingly used, although there is currently no standardized protocol for its effective application. The effectiveness of ERT depends on the specific case study, the equipment employed, and the operator’s expertise in data acquisition, processing, and interpretation.
This work considers the urban and peri-urban areas of Villa d’Agri (Basilicata Region, Southern Italy) as a case study, which has experienced significant expansion in recent decades in zones affected by the Eastern Agri Fault System, one of the fault systems considered responsible for the M 7.0 1857 earthquake in the southern Apennines [18]. Although various geological and geophysical studies have been conducted, to date no faults have yet been documented within the urban area of Villa d’Agri [19,20,21,22,23,24,25]. Furthermore, recent municipal projects, such as the reconstruction of a nursery school, as well as the first-level seismic microzonation study, have not identified any faults in this area, despite the abundance of data acquired from multiple geophysical and geological investigations. These include borehole surveys, seismic ambient noise measurements, electrical resistivity tomography, seismic down hole surveys, multichannel analysis of surface waves, and field geological mapping [19,26]. All these investigations seem to have failed to identify faults due to improper execution, investigation in inappropriate locations, misprocessing of data, and/or misinterpretation of results.
By reprocessing data provided by the municipal technical office of Marsicovetere, combined with additional ERT surveys and geological field investigations in previously inadequately explored areas, an unknown fault was imaged. The geometries of the substratum and sedimentary cover were also inferred, particularly in the urban sector of Villa d’Agri. The identified fault has been termed the Villa d’Agri Fault.
2. Geological Framework
The High Agri Valley (HAV) is an intermontane basin trending NW-SE, situated in the axial zone of the Southern Apennines. The basin extends approximately 30 km in length and 12 km in width and is filled with Quaternary continental clastic deposits overlying downthrown pre-Quaternary rocks. These mainly consist of Mesozoic-Cenozoic platform carbonates (Monte Marzano-Monti della Maddalena Unit [27]), which predominantly outcrop along the western side of the HAV. These carbonate units are thrust over coeval pelagic successions (Lagonegro units, [28]) and their Miocene synorogenic terrigenous cover. The Lagonegro units mainly crop out along the eastern flank of the HAV and in sparse tectonic windows beneath the Monti della Maddalena thrust sheet, on the western side of the HAV (Figure 1).
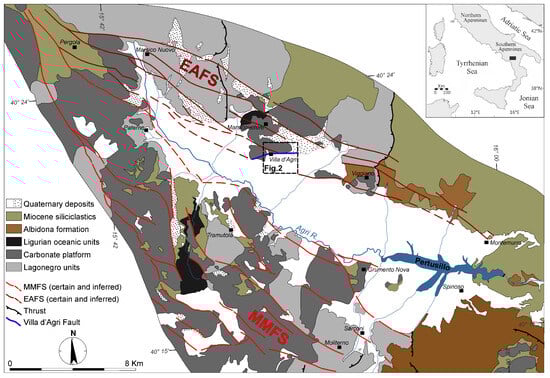
Figure 1.
Schematic geological map of the High Agri Valley (modified by [29]).
Quaternary deposits include Lower–Middle Pleistocene talus breccias (Brecce di Marsico, [30]), Middle–Upper Pleistocene alluvial-lacustrine sediments (Complesso Val d’Agri, [31]), and Upper Pleistocene-Holocene alluvial deposits or talus debris fans. The structural evolution of the basin has been strongly influenced by brittle tectonics, which can be divided into two main stages. The Early-Middle Pleistocene phase was characterized by N120° left-lateral transtensive master faults that controlled most of the sedimentation at releasing bends, followed by a Middle Pleistocene to present extensional regime with a NE-SW tensional axis [32,33]. This later phase reactivated pre-existing structures with normal fault kinematics and generated new normal faults, contributing to the progressive widening and deepening of the basin [34].
The HAV encompasses western Europe’s largest onshore oil field, operated by Eni S.p.A. In 2020, this field yielded roughly 4.4 million tonnes of oil and 1.5 billion cubic meters of gas [35,36].
Seismic activity and fault-related deformation of loose slope deposits and paleosols over the last 40 ka provide clear evidence of ongoing tectonic processes [33,37,38]. The HAV was affected by the M 7.0 earthquake in 1857, one of the most severe seismic events in Southern Italy [18], whose seismogenic source remains the subject of scientific debate. Currently, two main hypotheses have been proposed about the seismogenic fault systems in the HAV. The first hypothesis concerns the Monti della Maddalena Fault System (MMFS), a NE-dipping normal fault system located along the western boundary of the HAV [34,39,40]. The second hypothesis focuses on the Eastern Agri Fault System (EAFS), which comprises left-lateral strike-slip faults trending N120°, along with right-lateral faults trending N020–N030°, left-lateral transpressional faults trending N130–N150°, and normal to left-lateral transtensional faults trending N080–N100°. Kinematic fault analysis reveals a secondary set of NE-SW slip lineations, suggesting a subsequent phase of normal fault reactivation of the EAFS [33,34,41,42,43,44,45,46].
Recent instrumental seismicity is mainly characterized by small, induced earthquakes linked to industrial hydrocarbon exploitation activities [47] as well as time-varying water level of the Pertusillo reservoir [48,49]. These seismic events are organized into three clusters occurring in Sarconi (associated with the water level fluctuations of the Pertusillo reservoir), and in Montemurro and Villa d’Agri (linked to hydrocarbon exploitation activities).
3. Results
3.1. Geological Field Survey
Villa d’Agri is a hamlet of the municipality of Marsicovetere, located at the northeastern border of the HAV, which is characterized by the EAFS. In recent years, population growth and significant urban expansion have led to new constructions altering the urban fabric. Several geological and geophysical studies have been carried out, and no faults have been documented within the urban area of Villa d’Agri. In particular, a first-level seismic microzonation study [19], several scientific articles [20,21,22,23,24,25], and recent subsurface exploration carried out in the framework of municipal projects have reported no evidence of faults within the urban area.
During the geological field survey conducted by the authors, it was observed that part of the urban area of Villa d’Agri is located at the foot of a S-facing slope, directly on the Lower-Middle Pleistocene, poorly consolidated sedimentary talus breccias (B in Figure 2), with a thickness ranging from 5 to 20 m or on its overlying cover, composed of Holocene alluvial fans or talus debris fans with thicknesses up to 20 m (S in Figure 2). The foot of the slope is also characterized by a suspected, smoothed warp/scarp, which is more evident in peri-urban areas but is obscured or completely hidden in the urban area. Other buildings are instead situated in the upper part of the slope on the pre-Quaternary substratum constituted by dolostones (D in Figure 2) and limestones (L in Figure 2) of the Monte Marzano-Monti della Maddalena Unit, whereas the remaining part of the urban area lies on a flat surface underlain by Upper Pleistocene-Holocene alluvial deposits (A in Figure 2) of the HAV.
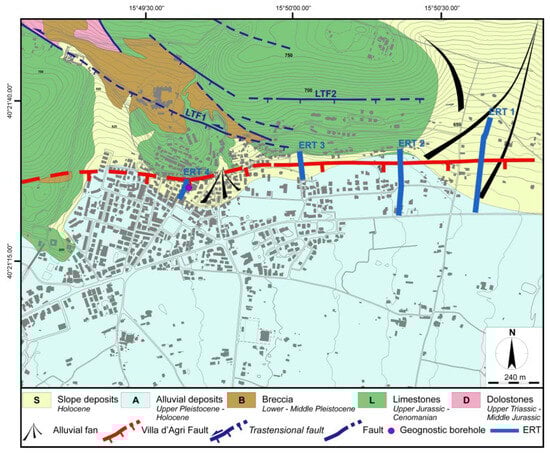
Figure 2.
Simplified preliminary geological map of Villa d’Agri showing the distribution of the surveys (see location of this frame in Figure 1). Only the main N120° and N080–N100° trending faults, such as LTF1 and LTF2 [20,24], are shown, along with the Villa d’Agri Fault. The latter is represented by a single line, although it consists of multiple synthetic fault splays, as shown by ERT1, ERT2, ERT3, and ERT4 in Figure 3, Figure 4 and Figure 5. The borehole log at the nursery school site is shown in Figure 5.
The pre-Quaternary substratum commonly appears densely fractured. Faults trending N120°, N020–N030° and N080–N100° are mainly exposed in the upper part of the slope, where the pre-Quaternary substratum outcrops. In particular, faults documented in the literature mainly affect sectors outside the urban area of Villa d’Agri, such as the left-lateral transtensional fault (LTF1 in Figure 2) documented by [20,24], and the normal to left-lateral transtensional faults (LTF2 in Figure 2), reported by [20].
Particular focus was placed on the suspected warp/scarp that characterizes the foot of the slope. By reprocessing data provided by the municipal technical office of Marsicovetere along with additional ERT and geological field investigations in previously inadequately explored areas, an unknown fault beneath the suspected scarp was imaged. The identified fault has been termed the Villa d’Agri Fault, which consists of S-dipping multiple fault splays with a staircase geometry.
3.2. Electrical Resistivity Tomography
Electrical Resistivity Tomography (ERT) is a non-destructive, rapid, and cost-effective geophysical technique widely used to obtain high-resolution 2D, 3D, and 4D images of subsurface electrical resistivity. This technique has proven its effectiveness in a wide range of geological and engineering applications, such as the study of faults [29,50,51], structural and geological settings [29,52], volcanic areas [53], landslides [54], liquefaction [55], urban areas [56,57], and building-infrastructure foundations [58,59], among others.
In this work, ERT was used to investigate the suspected south-dipping scarp at four sites (ERT1–ERT4 in Figure 2) within the urban and peri-urban areas of Villa d’Agri.
Only ERT4 was conducted as part of a project of the municipal administration of Marsicovetere for the reconstruction of a nursery school. The initial ERT4, obtained after six iterations, showed a high error (i.e., 29.5%). Therefore, the raw data supplied by the municipal technical office were reprocessed to improve the quality of the electrical resistivity model in terms of iterations/convergence and errors reduction.
ERT1, ERT2, and ERT3 were performed using a Syscal Junior resistivity meter (Iris Instruments) with a multielectrode system. Both Dipole–Dipole and Wenner–Schlumberger arrays were used, and apparent electrical resistivity data were inverted using RES2DINV software [60] to obtain 2D subsurface electrical resistivity models. Different inversion methods were applied, including least squares (L2 norm), robust (L1 norm), and combined inversion approaches. The models were selected based on error analysis, number of iterations, and consistency with geological data. The best results were obtained with the combined inversion method, which aims to leverage the strengths of both the robust and smooth least squares inversion methods. In all cases, the data acquired with the Wenner-Schlumberger array exhibited greater sensitivity to variations in both horizontal and vertical electrical resistivity, a higher signal-to-noise ratio, and greater depth of investigation.
For each electrical resistivity model, the iteration was selected at the point after which the Root Mean Square (RMS) error showed minimal change, which typically occurred between the third and fourth iterations. All electrical resistivity models showed an RMS error below 10%, with resistivity values ranging from 5 to over 556 ohm∙m (Figure 3, Figure 4 and Figure 5).
Using data from geological field surveys, aerial photo interpretation, and exploratory boreholes, it was possible to calibrate the electrical resistivity models and directly correlate electrical resistivity values with lithologies. Thus, lower electrical resistivity values are related to alluvial deposits (A < 100 ohm∙m), higher resistivity values are attributed to limestone (L > 140 ohm∙m), whereas moderate resistivity values can be associated with breccias (15 ohm∙m < B < 250 ohm∙m) or slope deposits (35 ohm∙m < S < 250 ohm∙m).
3.2.1. ERT1 and ERT2
In the peri-urban area of Villa d’Agri, a suspected smooth scarp facing southward characterizes the foot of the S-facing slope. ERT1 and ERT2 were performed to determine whether the scarp is a geomorphic feature (i.e., erosional scarp) or a tectonic landform (i.e., fault scarp).
ERT1 was conducted using a 48-multielectrode acquisition system with 10 m electrode spacing. The 470 m long ERT1 provided a maximum investigation depth of 90 m (Figure 3). Similarly, ERT2 employed the same electrode spacing with a 33-multielectrode acquisition system, extending 320 m in length and reaching an investigation depth of 60 m. ERT1 runs N-S across an alluvial-fan deposit (S). ERT2 is about 380 m east of ERT1 and also runs N-S, crossing limestones (L), between 0 and 30 m, and Quaternary deposits (mainly alluvial deposits, A). The scarp is perpendicularly crossed by ERT2 at about 30 m. Geological surface data were employed to constrain the interpretation of ERT1 and ERT2 (Figure 3).

Figure 3.
ERT1 and ERT2 carried out in the peri-urban area of Villa d’Agri (see Figure 2 for ERT1 and ERT2 positions). S, slope deposits. A, alluvial deposits. L, limestones. F, fault splay corresponding to the scarp observed at the surface. Red lines with arrows indicate fault splays (dotted where uncertain). Black lines delineate the non-tectonic contact between different lithologies.
In the upper sector of ERT1, spanning 0 to 410 m, moderate resistivity values are associated with slope deposits (S), which overlie alluvial deposits (A < 100 ohm∙m) outcropping between 410 and 470 m. In the lower part of ERT1, higher electrical resistivity values are associated with limestones (L).
In the upper part of ERT2, from 30 to 320 m, electrical resistivity values below 100 ohm∙m correspond to alluvial deposits (A), whereas values above 120 ohm∙m are related to limestones (L).
From a structural point of view, the most prominent features of the two electrical resistivity models are the abrupt lateral changes in electrical resistivity. In particular, “F” corresponds to the scarp observed at the surface and crossed by ERT2 at about 30 m (Figure 3). These features were interpreted as synthetic fault splays.
In the sectors between 240 and 470 m of ERT1 and 180 to 320 m of ERT2, the substratum was not investigated. Thus, the cumulative vertical displacement of the top of the inferred substratum likely exceeds 90 m.
3.2.2. ERT3
ERT3 was carried out about 480 m west of ERT2 (see Figure 2), across the possible traces of the above-mentioned scarp, which are less evident due to cultivation activities. ERT3 was carried out using a 48-multielectrode acquisition system with a 3 m electrode spacing, along a straight N-S profile. The 141 m long ERT3 achieved a maximum investigation depth of approximately 24 m. The interpretation of ERT3 is supported by surface data (Figure 4).

Figure 4.
ERT3 (see Figure 2 for the position of ERT3). S, slope deposits. A, alluvial deposits. L, limestones. Red lines with arrows indicate fault splays. Black lines delineate the non-tectonic contact between different lithologies.
The 141 m long ERT3 crosses slope deposits (35 ohm∙m < S < 250 ohm∙m), which covers limestones (L > 140 ohm∙m), between 0 and 33 m (N sector), and alluvial deposits (A < 100 ohm∙m) between 33 and 141 m.
Structurally, in the central (approximately 72 m) and northern (between 18 and 40 m) sectors of ERT3, three sharp lateral electrical resistivity variations are observed and interpreted as synthetic fault splays.
3.2.3. ERT 4
In the urban area of Villa d‘Agri, the E-W scarp facing south is obscured or completely hidden by urbanization, including the sector where a nursery school was rebuilt. The municipal technical office of Marsicovetere provided raw data for ERT4 and a geognostic borehole. ERT4 was reprocessed to improve the quality of the electrical resistivity model (Figure 5).
ERT4 was performed using a 31-multielectrode acquisition system with 3.5 m electrode spacing, allowing an investigation depth of approximately 20 m along the 105 m long ERT4 (Figure 5). ERT4 runs N-S across both limestones (L) and slope deposits (S). The interpretation of ERT4 is supported by both surface and borehole data, as shown in Figure 5.

Figure 5.
ERT4 carried out in the urban area of Villa d’Agri at the nursery school site, showing the stratigraphic log of a borehole drilled approximately 10 m from ERT4 (see Figure 2 for positions). U, urban infrastructure. S, slope deposits. A, alluvial deposits. L, limestones. B, breccia. Red lines with arrows indicate fault splays (dotted where uncertain). Black lines delineate the non-tectonic contact between different lithologies.
In the upper sector of ERT4, between 0 and 14 m, high electrical resistivity values are associated with limestones (L > 140 ohm∙m). Between 14 and 105 m, moderate electrical resistivity values correspond to slope deposits and urban infrastructure (35 ohm∙m < S-U < 250 ohm∙m), which overlie lower electrical resistivity alluvial deposits (A < 100 ohm∙m). At the bottom of ERT4, moderate electrical resistivity values at depths greater than approximately 13 m correspond to breccias (15 ohm∙m < B < 250 ohm∙m), as confirmed by the geognostic borehole (Figure 5). The main feature of ERT4 is a sharp lateral electrical resistivity variation at approximately 14 m, interpreted as a fault splay. Although data are missing in the northernmost sector of the electrical resistivity model, an additional fault splay was inferred at about 7 m along ERT4 based on geological observations. These two fault splays are correlated with the fault splay (F) identified beneath the scarp by ERT2 (Figure 3).
4. Discussion and Conclusions
Urbanization poses significant challenges to fault detection and characterization, as it can obscure or completely hide surface fault expressions and limit access to key investigation sites. The case of Villa d’Agri exemplifies these difficulties, where previous extensive geological and geophysical surveys failed to identify faults within the urban area even though it lies at the northeastern border of the High Agri Valley, characterized by the Eastern Agri Fault System. This study demonstrates that a large number of investigations alone are insufficient to detect hidden faults if they are not properly planned, executed, and interpreted. This is especially true for investigation techniques for which there is currently no standardized protocol for their effective application, such as ERT.
In this work, ERT together with geological field surveys and models from the reprocessing of existing data allowed the identification of a previously unknown fault beneath a suspected, smoothed scarp obscured or completely hidden by urbanization and agricultural activities. The identified fault, here named the Villa d’Agri Fault, consists of S-dipping multiple synthetic fault splays with a staircase geometry, and it is part of the Eastern Agri Fault System. Although this result does not clarify whether the Eastern Agri Fault System is the seismogenic structure of the High Agri Valley, it underscores the value of a multidisciplinary approach for investigating obscured-hidden faults in urban environments. The staircase geometry of the fault imaged by ERT provides new insights into the subsurface structural setting, which earlier studies missed due to factors such as inappropriate survey locations, inadequate data processing, and misinterpretation.
This study highlights the importance of critically revisiting and reanalyzing existing datasets, particularly in urban contexts where surface fault expressions may be obscured or even hidden. Moreover, the study confirms that ERT is a valuable, non-invasive, and cost-effective tool for near-surface fault imaging, though its success depends on operator expertise and geological context.
From a seismic hazard perspective, discovering the Villa d’Agri Fault beneath a growing urban area has important implications, as faults directly influence ground shaking during earthquakes and their accurate identification is crucial for risk assessment and urban planning. Seismic waves at engineering-relevant frequencies may be locally amplified by fault zones, often exhibiting greater motion along a specific azimuth characteristic of the site on the horizontal plane. This effect is commonly characterized by maximum amplification occurring perpendicular to the main fracture strike. This discovery supports local authorities in improving urban management and seismic risk mitigation. Future work should focus on the detailed characterization of the fault’s geometry, activity, and seismic potential through integrated geophysical, geological, and seismological studies. This approach can serve as a model for similar investigations in other urbanized regions where fault traces are obscured by human activity.
Author Contributions
Conceptualization, A.G. and N.P.; Methodology, A.G. and N.P.; Writing—original draft, A.G. and N.P. The authors contributed equally to the conception, design, execution, and writing of the manuscript. All authors have read and agreed to the published version of the manuscript.
Funding
The research was conducted under a non-financial framework agreement between ENEA and the University of Pisa. The activities were also aligned with the objectives of the scientific research projects EMILI and MARIE, funded by the FABRE consortium—Research consortium for the evaluation and monitoring of bridges, viaducts, and other structures “www.consorziofabre.it/en (accessed on 25 October 2025)”. Any opinions, findings, conclusions, or recommendations expressed in this paper are those of the authors and do not necessarily reflect the views of the funding organization.
Data Availability Statement
No research datasets are available for this article.
Acknowledgments
The authors gratefully acknowledge the Technical Office of Marsicovetere (PZ) for kindly providing the data related to the nursery school reconstruction project, such as the ERT4 and the geognostic borehole. Special thanks are also extended to Massimiliano Lombardi for his valuable contribution to the execution of the investigations. We also sincerely thank Luigi Vignola for the exchange of valuable information and opinions, and for his availability to carry out future research activities that will integrate the present work. Many thanks also to the Assistant Editor for her kindness, availability, and support.
Conflicts of Interest
The authors declare no conflicts of interest.
Abbreviations
The following abbreviations are used in this manuscript:
| HAV | High Agri Valley |
| MMFS | Monti della Maddalena Fault System |
| EAFS | Eastern Agri Fault System |
| ERT | Electrical Resistivity Tomography |
| RMS | Root Mean Square |
| S | Slope deposits |
| A | Alluvial deposits |
| B | Breccia |
| L | Limestone |
| D | Dolostones |
References
- Atzori, S.; Monterroso, F.; Antonioli, A.; De Luca, C.; Svigkas, N.; Casu, F.; Manunta, M.; Quintiliani, M.; Lanari, R. Automatic seismic source modeling of InSAR displacements. Int. J. Appl. Earth Obs. Geoinf. 2023, 123, 103445. [Google Scholar] [CrossRef]
- Civico, R.; Pucci, S.; De Martini, P.M.; Pantosti, D. Morphotectonic analysis of the long-term surface expression of the 2009 L’Aquila earthquake fault (Central Italy) using airborne LiDAR data. Tectonophysics 2015, 644, 108–121. [Google Scholar] [CrossRef]
- Van Puymbroeck, N.; Michel, R.; Binet, R.; Avouac, J.P.; Taboury, J. Measuring earthquakes from optical satellite images. Appl. Opt. 2000, 39, 3486–3494. [Google Scholar] [CrossRef]
- Vallée, M.A.; Moussaoui, M.; Khan, K. Case Studies of Magnetic and Electromagnetic Techniques Covering the Last Fifteen Years. Minerals 2024, 14, 1286. [Google Scholar] [CrossRef]
- Takao, K.; Sun, C.W.; Choi, J.H. Near-surface fault investigation by Ground Penetrating Radar (GPR) surveys. J. Geol. Soc. Korea 2022, 58, 445–455. [Google Scholar] [CrossRef]
- Changryol, K.; Kim, J.H.; Chwae, U. GPR and Resistivity Investigations of Quaternary Fault in the Marine Terrace Deposits, SE Korea. In Proceedings of the 11th International Conference on Ground Penetrating Radar, Columbus, OH, USA, 26–28 November 2006. [Google Scholar]
- Demanet, D.; Pirard, E.; Renardy, F.; Jongmans, D. Application and processing of geophysical images for mapping faults. Comput. Geosci. 2001, 27, 1031–1037. [Google Scholar] [CrossRef]
- Griffiths, D.; Barker, R.D. Two-dimensional resistivity imaging and modelling in areas of complex geology. J. Appl. Geophys. 1993, 29, 211–226. [Google Scholar] [CrossRef]
- Dilalos, S.; Alexopoulos, J.D.; Lozios, S. New insights on subsurface geological and tectonic structure of the Athens basin (Greece), derived from urban gravity measurements. J. Appl. Geophys. 2019, 167, 73–105. [Google Scholar] [CrossRef]
- Dell’Aversana, P. Integration loop of ‘global offset’ seismic, continuous profiling magnetotelluric and gravity data. First Break 2003, 21, 32–41. [Google Scholar] [CrossRef]
- La Femina, P.C.; Connor, C.B.; Stamatakos, J.A.; Farrell, D.A. Imaging an active normal fault in alluvium by high-resolution magnetic and electromagnetic surveys. Environ. Eng. Geosci. 2002, 8, 193–207. [Google Scholar] [CrossRef]
- Widodo; Tezkan, B. Analysis of the Shallow Structures of Active Fault Zones Using 3D Radiomagnetotelluric Data Set. Procedia Earth Planet. Sci. 2015, 12, 68–76. [Google Scholar] [CrossRef]
- Bedrosian, P.A.; Unsworth, M.J.; Egbert, G.D.; Thurber, C.H. Geophysical images of the creeping segment of the San Andreas fault: Implications for the role of crustal fluids in the earthquake process. Tectonophysics 2004, 385, 137–158. [Google Scholar] [CrossRef]
- Tikhonov, A.N. On determining electrical characteristics of the deep layers of the Earth’s crust. Dokl. Akad. Nauk 1950, 73, 295–297. [Google Scholar]
- Cagniard, L. Basic theory of the magneto-telluric method of geophysical prospecting. Geophysics 1953, 18, 605–635. [Google Scholar] [CrossRef]
- Mase, L.Z.; Refrizon, R.; Pakpahan, N.S.; Shelina, A.; Wu, J.; Chaiyaput, S. Site Characteristics of Musi Fault Zone in Kepahiang Urban Area, Bengkulu Province, Indonesia. Transp. Infrastruct. Geotechnol. 2024, 11, 2453–2482. [Google Scholar] [CrossRef]
- Punzo, M.; Cianflone, G.; Cavuoto, G.; De Rosa, R.; Dominici, R.; Gallo, P.; Lirer, F.; Pelosi, N.; Di Fiore, V. Active and passive seismic methods to explore areas of active faulting. The case of Lamezia Terme (Calabria, southern Italy). J. Appl. Geophys. 2021, 188, 104316. [Google Scholar] [CrossRef]
- Branno, A.; Esposito, E.G.I.; Maturano, A.; Porfido, S.; Rinaldis, V. Studio, su base macrosismica, del terremoto della Basilicata del 16 dicembre 1857. Boll. Soc. Nat. Napoli 1985, 92, 249–338. [Google Scholar]
- Lizza, C.; Tamburiello, G. Studio di microzonazione sismica del Comune di Marsicovetere. Marsicovetere, Italy. 2012, DGR n. 744, 24 May 2011. Unpublished Work.
- Lentini, F.; Carbone, S.; Caliri, A.; Giano, S.I.; Guarnieri, P.; Martorano, S.; Platania, I.; Di Stefano, A.; Romeo, M.; Chiocchini, M.; et al. Carta Geologica d’Italia 1:50.000, F. 505 Moliterno; Istituto Superiore per la Protezione e la Ricerca Ambientale—ISPRA: Rome, Italy, 2014; Available online: https://www.openaccessrepository.it/records/211994 (accessed on 24 October 2025).
- Gangone, G.; Gallipoli, M.R.; Tragni, N.; Vignola, L.; Caputo, R. Soil-building resonance effect in the urban area of Villa d’Agri (Southern Italy). Bull. Earthq. Eng. 2023, 21, 3273–3296. [Google Scholar] [CrossRef]
- Schirripa Spagnolo, G.; Agosta, F.; Aldega, L.; Prosser, G.; Smeraglia, L.; Tavani, S.; Looser, N.; Guillong, M.; Bernasconi, S.M.; Billi, A.; et al. Structural architecture and maturity of Val d’Agri faults, Italy: Inferences from natural and induced seismicity. J. Struct. Geol. 2024, 180, 105084. [Google Scholar] [CrossRef]
- Palladino, G.; Prosser, G.; Olita, F.; Avagliano, D.; Dello Iacovo, B.; Giano, S.I.; Bentivenga, M.; Agosta, F.; Grimaldi, S. Reconstruction of the structural setting of the north-eastern side of the high Agri Valley (Southern Apennines, Italy) based on detailed field mapping. J. Maps 2023, 19, 2257729. [Google Scholar] [CrossRef]
- Bucci, F.; Novellino, R.; Guglielmi, P.; Tavarnelli, E. Growth and dissection of a fold and thrust belt: The geological record of the High Agri Valley, Italy. J. Maps 2020, 16, 245–256. [Google Scholar] [CrossRef]
- Lentini, F.; Carbone, S.; Monaco, C.; Catalano, S.; Romeo, M.; Lazzari, S.; D’Andrea, M. Carta Geologica del Bacino del Fiume Agri. Memorie della Società Geologica Italiana. 1991, Volume XLVII. Available online: https://www.pconti.net/egeo_results.php?id=cbfa001 (accessed on 24 October 2025).
- Priore, A. Progetto di Adeguamento Sismico Scuola Materna Villa d’Agri—Indagini Geognostiche, Committente: Comune di Marsicovetere. 2020, Det. 977 del 30 December 2019. Unpublished Work.
- Bonardi, G.; D’Argenio, B.; Perrone, V. Carta geologica dell’Appennino meridionale alla scala 1:250.000. Breve presentazione. Mem. Della Soc. Geol. Ital. 1988, 41, 1341. [Google Scholar]
- Scandone, P. Studi di geologia lucana: La serie calcareo-silico-marnosa e i suoi rapporti con l’Appennino calcareo. Boll. Soc. Nat. Napoli 1967, 76, 301–469. [Google Scholar]
- Giocoli, A.; Stabile, T.; Adurno, I.; Perrone, A.; Gallipoli, M.R.; Gueguen, E.; Norelli, E.; Piscitelli, S. Geological and geophysical characterization of the southeastern side of the High Agri Valley (southern Apennines, Italy). Nat. Hazards Earth Syst. Sci. 2015, 15, 315–323. [Google Scholar] [CrossRef]
- Di Niro, A.; Giano, S.I. Evoluzione geomorfologica del bordo orientale dell’alta Val d’Agri (Basilicata). Studi Geol. Camerti 1995, 2, 207–218. [Google Scholar]
- Di Niro, A.; Giano, S.I.; Santangelo, N. Primi dati sull’evoluzione geomorfologica e sedimentaria del bacino dell’alta Val d’Agri (Basilicata). Studi Geol. Camerti 1992, 1992, 257–263. [Google Scholar]
- Schiattarella, M.; Ferranti, L.; Giano, S.I.; Maschio, L. Evoluzione Tettonica Quaternaria dell’Alta Val d’Agri (Appennino meridionale). In Congresso della Società Geologica Italiana; Congress of the Italian Geological Society: Palermo, Italy, 1998. [Google Scholar]
- Giano, S.I.; Maschio, L.; Alessio, M.; Ferranti, L.; Improta, S.; Schiattarella, M. Radiocarbon dating of active faulting in the Agri high valley. Southern Italy. J. Geodyn. 2000, 29, 371–386. [Google Scholar] [CrossRef]
- Maschio, L.; Ferranti, L.; Burrato, P. Active extension in Val d’Agri area, Southern Apennines, Italy: Implications for the geometry of the seismogenic belt. Geophys. J. Int. 2005, 162, 591–609. [Google Scholar] [CrossRef]
- Giocoli, A. Produzione di Petrolio e gas Naturale da Riserve Convenzionali. Energy Technology Monitoring and Information System, 2021. Available online: https://simte.enea.it/tecnologie.php?idSettore=3&idBrief=16 (accessed on 24 October 2025).
- Borfecchia, F.; De Canio, G.; De Cecco, L.; Giocoli, A.; Grauso, S.; La Porta, L.; Martini, S.; Pollino, M.; Roselli, I.; Zini, A. Mapping the earthquake-induced landslide hazard around the main oil pipeline network of the Agri Valley (Basilicata, southern Italy) by means of two GIS-based modelling approaches. Nat. Hazards 2016, 81, 759–777. [Google Scholar] [CrossRef]
- D’Addezio, G.; Karner, D.B.; Burrato, P.; Insinga, D.; Maschio, L.; Ferranti, L.; Renne, P.R. Tephrochronology in faulted Middle Pleistocene tephra layer in the Val d’Agri area (Southern Italy). Ann. Geophys. 2006, 49, 1029–1040. [Google Scholar]
- Ferranti, L.; Oldow, J.; D’Argenio, B.; Catalano, R.; Lewis, D.; Marsella, E.; Avellone, G.; Maschio, L.; Pappone, G.; Pepe, F.; et al. Active deformation in Southern Italy, Sicily and southern Sardinia from GPS velocities of the Peri-Tyrrhenian Geodetic Array (PTGA). Ital. J. Geosci. 2008, 127, 299–316. [Google Scholar]
- Pantosti, D.; Valensise, G. Faulting mechanism and complexity of the November 23, 1980, Campania-Lucania earthquake, inferred from surface observation. J. Geophys. Res. 1990, 95, 15319–15341. [Google Scholar] [CrossRef]
- Burrato, P.; Valensise, G. Rise and fall of a hypothesized seismic gap: Source complexity in the 16 December 1857, Southern Italy earthquake (Mw 7.0). Bull. Seismol. Soc. Am. 2007, 98, 139–148. [Google Scholar] [CrossRef][Green Version]
- Benedetti, L.; Tapponier, P.; King, G.C.P.; Piccardi, L. Surface rupture of the 1857 Southern Italian earthquake. TerraNova 1998, 10, 206–210. [Google Scholar] [CrossRef]
- Cello, G.; Mazzoli, S. Apennine tectonics in Southern Italy: A review. J. Geodyn. 1999, 27, 191–211. [Google Scholar] [CrossRef]
- Michetti, A.M.; Serva, L.; Vittori, E. ITHACA Italy Hazard from Capable Faults: A database of Active Faults of the Italian Onshore Territory; ANPA: Rome, Italy, 2000; Available online: https://sgi.isprambiente.it/ithacaweb/Default.aspx (accessed on 24 October 2025).
- Cello, G.; Gambini, R.; Mazzoli, S.; Read, A.; Tondi, E.; Zucconi, V. Fault zone characteristics and scaling properties of the Val d’Agri Fault System (Southern Apennines, Italy). J. Geodyn. 2000, 29, 293–307. [Google Scholar] [CrossRef]
- Cello, G.; Tondi, E.; Micarelli, L.; Mattioni, L. Active tectonics and earthquake sources in the epicentral area of the 1857 Basilicata earthquake (Southern Italy). J. Geodyn. 2003, 36, 37–50. [Google Scholar] [CrossRef]
- Barchi, M.; Amato, A.; Cippitelli, G.; Merlini, S.; Montone, P. Extensional tectonics and seismicity in the axial zone of the Southern Apennines. Boll. Della Soc. Geol. Ital. 2007, 7, 47–56. [Google Scholar]
- Stabile, T.A.; Telesca, L. The Statistical Fingerprint of Fluid-Injection Operations on Microseismic Activity at the Val d’Agri Oil Field (Southern Italy). Energies 2023, 16, 5877. [Google Scholar] [CrossRef]
- Stabile, T.A.; Giocoli, A.; Perrone, A.; Piscitelli, S.; Telesca, L.; Lapenna, V. Relationship between seismicity and water level of the Pertusillo reservoir (southern Italy). Bollettino di Geofisica Teorica ed Applicata 2015, 56, 505–517. [Google Scholar] [CrossRef]
- Valoroso, L.; Piccinini, D.; Improta, L.; Gaviano, S.; Giunchi, C. Characterizing Seismogenic Fault Structures of the Lake Pertusillo Reservoir Induced Seismicity (Southern Italy) Using a Relocated Template-Matching Catalog. J. Geophys. Res.-Solid Earth 2023, 128, 2023. [Google Scholar] [CrossRef]
- Galli, P.A.C.; Giocoli, A.; Naso, J.A.; Piscitelli, S.; Rizzo, E.; Capini, S.; Scaroina, L. Faulting of the Roman aqueduct of Venafrum (southern Italy): Methods of investigation, results, and seismotectonic implications. Anc. Earthq. 2010, 471, 233–242. [Google Scholar] [CrossRef]
- Suzuki, K.; Toda, S.; Kusunoki, K.; Fujimitsu, Y.; Mogi, T.; Jomori, A. Case studies of electrical and electromagnetic methods applied to mapping active faults beneath the thick quaternary. Eng. Geol. 2000, 56, 29–45. [Google Scholar] [CrossRef]
- Storz, H.; Storz, W.; Jacobs, F. Electrical resistivity tomography to investigate geological structures of the earth’s upper crust. Geophys. Prospect. 2000, 48, 455–471. [Google Scholar] [CrossRef]
- Di Maio, R.; Mauriello, P.; Patella, D.; Petrillo, Z.; Piscitelli, S.; Siniscalchi, A. Electric and electromagnetic outline of the Mount Somma-Vesuvius structural setting. J. Volcanol. Geotherm. Res. 1998, 82, 219–238. [Google Scholar] [CrossRef]
- Jhinkwan, V.S.; Chore, H.S.; Agnihotri, A.K. Application of Electrical Resistivity Tomography (ERT) for the Evaluation of Slope Susceptibility: A Review. In Sustainable Infrastructures, Proceedings of the 4th International Conference on Environmental Geotechnology, Recycled Waste Materials and Sustainable Engineering—EGRWSE, Jalandhar, India, 25–27 October 2023; Agnihotri, A.K., Reddy, K.R., Bansal, A., Eds.; Lecture Notes in Civil Engineering; Springer: Singapore, 2025. [Google Scholar] [CrossRef]
- Giocoli, A.; Quadrio, B.; Bellanova, J.; Lapenna, V.; Piscitelli, S. Electrical resistivity tomography for studying liquefaction induced by the May 2012 Emilia-Romagna earthquake (Mw = 6.1, northern Italy). Nat. Hazards Earth Syst. Sci. 2014, 14, 731–737. [Google Scholar] [CrossRef]
- Bellanova, J.; Calamita, G.; Catapano, I.; Ciucci, A.; Cornacchia, C.; Gennarelli, G.; Giocoli, A.; Fisangher, F.; Ludeno, G.; Morelli, G.; et al. GPR and ERT Investigations in Urban Areas: The Case-Study of Matera (Southern Italy). Remote Sens. 2020, 12, 1879. [Google Scholar] [CrossRef]
- Song, S.Y.; Kim, B.; Cho, A.; Jeong, J.; Lee, D.; Nam, M.J. Electrical resistivity survey and interpretation considering excavation effects for the detection of loose ground in urban area. Geomech. Eng. 2023, 35, 109–119. [Google Scholar] [CrossRef]
- Giocoli, A.; Hailemikael, S.; Bellanova, J.; Calamita, G.; Perrone, A.; Piscitelli, S. Site and building characterization of the Orvieto Cathedral (Umbria, Central Italy) by electrical resistivity tomography and single-station ambient vibration measurements. Eng. Geol. 2019, 260, 105195. [Google Scholar] [CrossRef]
- Gündogdu, N.Y.; Demirci, I.; Demirel, C.; Candansayar, M.E. Characterization of the bridge pillar foundations using 3d focusing inversion of DC resistivity data. J. Appl. Geophys. 2020, 172, 103875. [Google Scholar] [CrossRef]
- Loke, M. Tutorial: 2-D and 3-D Electrical Imaging Surveys. 2001. Available online: https://www.researchgate.net/publication/264739285_Tutorial_2-D_and_3-D_Electrical_Imaging_Surveys (accessed on 24 October 2025).
Disclaimer/Publisher’s Note: The statements, opinions and data contained in all publications are solely those of the individual author(s) and contributor(s) and not of MDPI and/or the editor(s). MDPI and/or the editor(s) disclaim responsibility for any injury to people or property resulting from any ideas, methods, instructions or products referred to in the content. |
© 2025 by the authors. Licensee MDPI, Basel, Switzerland. This article is an open access article distributed under the terms and conditions of the Creative Commons Attribution (CC BY) license (https://creativecommons.org/licenses/by/4.0/).