Simple Summary
Diet and living environments can profoundly influence the composition of animal gut microbiota. Current research primarily focuses on detecting bacterial communities in animal intestines, with less attention paid to fungi and protozoa. This study comprehensively characterized bacteria, fungal and protozoan communities in fecal samples from wild and captive Chinese wapiti. Results revealed significant differences in gut microbial communities and functional characteristics between captive and wild wapiti. Fecal microbiota in captive wapiti was enriched with microbes involved in amino acid and fatty acid metabolism, exhibiting predominantly mutually exclusive interactions between bacteria, fungi, and protozoa. Conversely, wild wapiti harbored an abundant fecal microbiota associated with fiber utilization, characterized by largely mutualistic coexistence among bacteria, fungi, and protozoa. These findings suggest that domestication leads to alterations in the intestinal microbiota of wapiti.
Abstract
Diet and living environments exert a profound influence on gut microbiota composition. This study presents the first comprehensive characterization of fecal bacteria, fungi, and protozoa in wild (WA) (n = 10) and captive (DA) (n = 11) wapiti (Cervus canadensis) in China. Results reveal distinct microbial profiles between the two groups. In wild wapiti, Escherichia-Shigella and UCG-005 were the dominant bacterial genera, while Succinivibrio and Treponema predominated in captive individuals. Among fungi, Agaricus and Preussia were most abundant in wild wapiti, whereas Xeromyces was identified in captive ones. For protozoa, Heteromita was the primary genus in wild wapiti, while Heteromita, Entamoeba, and Eimeria were the main genera in captive wapiti. Functional predictions further underscored these differences. In wild wapiti, bacterial and fungal functions were primarily associated with carbon metabolism and the pyruvate cycle, with mutualistic interactions prevailing among bacteria, fungi, and protozoa. Conversely, captive wapiti exhibited functional profiles centered on lipopolysaccharide and amino acid metabolism, also characterized by mutualistic coexistence among microbial communities. These findings highlight the significant impact of dietary composition on the gut microbiome. In summary, wild wapiti appear to possess a superior capacity for plant fiber utilization. These findings provide valuable data for the health management of farmed wapiti and their adaptability in natural habitats.
1. Introduction
Diet stands as the primary determinant influencing and shaping the gastrointestinal microbiota of animals [1]. Owing to their distinct living environments, wild and domestic animals often consume different diets, which, in turn, affects the composition of their intestinal microbiota. For instance, studies have found that wild boars and domestic pigs harbor distinct dominant bacterial genera in their intestines due to dietary variations [2]. Similarly, wild yaks exhibit relatively abundant Ruminococcaceae and Rikenellaceae, which primarily participate in the degradation of fibrous substances, while domestic yaks have higher abundances of Prevotellaceae, Alloprevotella, and Succinivibrio, mainly involved in protein and carbohydrate degradation [3].
Deer, as ruminants, serve as crucial medical models for mammalian tissue and organ regeneration [4], and their digestive tract microbiota composition is also diet-dependent. The microbiota of grazing and captive reindeer may vary due to dietary differences [5]. Studies have shown that Firmicutes and Bacteroides are the predominant phyla in the digestive tracts of both wild and domestic deer. However, Firmicutes are more abundant in wild deer, while Bacteroides are more prevalent in domestic deer [6,7]. For instance, compared to wild sika deer, domestic sika deer exhibit a significant increase in Fibrobacteres, likely attributable to their high-fiber diets, such as hay [6]. In white-livened deer (Cervus albirostris), wild individuals have significantly higher abundances of Firmicutes and Cyanobacteria in their digestive tracts compared to domesticated ones, while Spirochaetae, Bacteroides, and Verrucomicrobia are lower [8]. Interestingly, in Red Deer (Cervus elaphus), captive herds have significantly lower levels of Ruminococcaceae than wild herds, possibly due to the low-fiber diet of captive red deer altering the fecal microbiota’s ability to degrade stubborn substrates like cellulose, hemicellulose, and lignocellulose [7]. These observations lead us to hypothesize that the diverse microbial structures serve distinct functions. However, previous studies have primarily focused on the compositional differences of digestive tract bacteria. Although bacteria are the most numerous microorganisms in the animal intestine and often dominate the intestinal microbiota [8,9,10,11], intestinal fungi, though fewer in number, secrete enzymes to break down lignin, cellulose, and hemicellulose, influencing pathogenic microorganism colonization [12,13]. Protozoa, the least reported group in the gut microbiome, especially in deer, often have symbiotic relationships with other microorganisms [14,15], influencing host immunity and intestinal homeostasis [16]. They also consume carbohydrates like cellulose and starch to provide energy for themselves and the host [17,18]. This knowledge gap significantly impedes our comprehensive understanding of the overall structure and function of the intestinal microbiota in deer.
Compared to common domestic animals such as pigs, cattle, and sheep, deer breeding technology remains relatively underdeveloped. As a unique livestock resource, wapiti are valued for their high-protein, low-fat meat products as well as regenerated antlers [19,20,21]. This study is the first to comprehensively characterize and compare the gut microbiota of wild and captive wapiti. The aim is to investigate the changes and evolutionary patterns of the intestinal flora in wapiti, providing crucial theoretical foundations and data support for the efficient breeding of domestic wapiti and the effective protection of wild wapiti.
2. Materials and Methods
2.1. Animals and Sample Collection
A total of 21 fecal samples were collected, including 10 wild wapiti samples from Gaogesitai Hanwula national nature reserve (Inner Mongolia Autonomous Region, China, 119°03′–119°39′ E, 44°41′–45°08′ N), and 11 captive deer samples from Baocheng Deer Industry Co. (Chifeng, Inner Mongolia Autonomous Region, China, 119°28′ E, 42°04′ N). To ensure the freshness of the samples, reduce environmental pollution, and avoid frightening the wild animals, we waited at the most frequented watering places of the deer herd to obtain fresh samples. Use disposable, sterile gloves to collect fresh captive wapiti droppings in the deer pen, minimizing disturbance to the animal’s activities as much as possible. All samples collected were carefully stripped to the surface using sterile forceps to preserve the internal feces, which were then preserved in sterile centrifuge tubes and immediately stored in liquid nitrogen to ensure that remained at low temperatures until sequencing was completed. All sample collections did not affect the normal activities and feeding habits of the animals.
2.2. Microbial Sequencing and Data Quality Control
Samples were extracted using the CTAB method, and PCR amplification was carried out using the samples as templates after their purity and concentration had been verified [19]. The specific primers for bacterial amplification were 341F (5′-CCTAYGGGRBGCASCAG-3′) and 806R (5′-GGACTACNNGGGTATCTAAT-3′), and the specific primers for archaeal amplification were 515F (5′-GTGCCAGCMGCCGCGGTAA-3′) and 806R (5′-GGACTACHVGGGTWTCTAAT-3′). The primers of fungi were ITS1F (5′-CTTGGTCATTTAGAGGAAGTAA’) and ITS2R (5′-GCTGCGTTCTTCATCGATGC-3′). 528F (5′-GCGGTAATTCCAGCTCCAA-3′) and 706R (5′-AATCCRAGAATTTCACCTCT-3′) for protozoa [20,21,22]. Library construction was performed using TruSeq® DNA PCR-Free Sample Preparation Kit (Illumina, San Diego, CA, USA), and the constructed libraries were quantified by Qubit and Q-PCR, and after the libraries were qualified, they were used on NovaSeq6000 (Illumina, San Diego, CA, USA) for PE250 sequencing [23].
Paired-end reads were assigned to samples based on their unique barcode and truncated by cutting off the barcode and primer sequence. Paired-end reads were merged using FLASH (Version 1.2. 11, http://ccb.jhu.edu/software/FLASH/, accessed on 23 November 2025) [24], a very fast and accurate analysistool, which was designed to merge paired-end reads when at least some of the reads overlap theread generated from the opposite end of the same DNA fragment, and the splicing sequences were called raw tags. The spliced Raw Tags were strictly filtered by fastp software (Version 0.23.1) to obtain high-quality Tags data [25]. The Tags obtained after the above processing need to be processed to remove chimeric sequences, and the Tags sequences were compared with the species annotation database (Silva database (16S/18S), https://www.arb-silva.de/, accessed on 23 November 2025; Unite Database (ITS), https://unite.ut.ee/, accessed on 23 November 2025) to detect chimeric sequences, and the chimeric sequences were finally removed to obtain the final Effective Tag [26]. For the Effective Tags obtained previously, denoise was performed with DADA2 or deblur module in the QIIME2 software (Version QIIME2-202202) to obtain initial ASVs (Amplicon Sequence Variants) (default: DADA2) [27]. Species annotation was performed using QIIME2 software. For 16S/18S, the annotation database is Silva Database, while for ITS, it is Unite Database. The absolute abundance of ASVs was normalized using a standard of sequence number corresponding to the sample with the least sequences.
2.3. Data Analysis and Visualization
To ensure the reliability of downstream analysis, we evaluated the sequencing depth. The Rarefaction curves calculated based on the number of effective Tags have all reached the plateau period, indicating that the current sequencing depth is sufficient to cover the vast majority of microbial diversity in the samples. Subsequently, the Alpha diversity index of each sample was calculated using QIIME2 software to assess the microbial diversity within the samples. The Wilcoxon test was used to analyze the significant differences in the microbial α-diversity index between the DA group and the WA group. The Metastat analysis using RStudio software (4.5.1) (with automatic FDR correction) was used to calculate the significant differences in the genus levels of bacteria, fungi and protists between the DA group and the WA group. The microeco and ggplot2 of the RStudio software were used to calculate and plot the horizontal stacking maps and α diversity indices of bacterial, fungal and protozoan phyla. The functional characteristics of fecal bacteria were predicted by Tax4Fun2, and those of fecal fungi were predicted by PICRUSt2 (v2.6.0) [28]. And the Wilcoxon test was used to analyze the significant differences in metabolic pathways at Level3 between bacteria and fungi. Based on the weighted UniFrac distance and the Bray–Curtis dissimilarity matrix, microbial communities and functions between groups were compared using Principal coordinates analysis (PCoA). Principal component analysis (PCA) was calculated by the prcomp function of the stats package in the RStudio software and the ropls package. Both R2 and p values were analyzed and calculated using the Adonis function from the vegan package, which conducts permutation multivariate analysis of variance [29]. The stats package of the RStudio software is used to calculate the Spearman rank correlation coefficient with thresholds of p < 0.05 and R > 0.6 or <−0.6, and the Gephi software (0.10.1) is used to visualize the correlation network [30].
3. Results
3.1. Compositional Characteristics and Predicted Metagenomic Functions in Bacteria
After denoising and species annotation of the sample sequencing data using the QIIME2 software package, a total of 1,486,121 reads were retained and classified into 6769 OTUs (Table S1). Further classification identified 19 phyla, with Firmicutes (DA, 41.75%; WA, 59.72%), Bacteroidota (DA, 35.42%; WA, 21.23%), and Proteobacteria (DA, 13.82%; WA, 17.25%) dominat phyla (Figure 1A). Thirty-five genera were further confirmed, with the dominant genera differing between the two groups. The relative abundance of Escherichia-Shigella (DA, 0.00%; WA, 9.69%), UCG-005 (DA, 6.18%; WA, 9.19%), and Rikenellaceae-RC9-gut-group (DA, 5.54%; WA, 7.03%) was relatively higher in the WA group. While the relative abuntivities of Succinivibrio (DA, 13.57%; WA, 0.00%) and Treponema (DA, 7.14%; WA, 0.00%) were higher in the DA group (Figure 1B). Analysis of the α-diversity index of the WA group and the DA group indices between the WA and DA groups indicated that the Chao1 index and ACE index were significantly increased in the DA group (p < 0.05), while the other indicators did not differ significantly (p > 0.05) (Figure 1C). Bray–Curtis and Weighted Unifrac analyses revealed a significant difference in the gut microbiome composition between wild and captive wapiti (p = 0.001) (Figure 1D). The abundance of Bacillus (DA, 0.00%; WA, 5.50%), Lysinibacillus (DA, 0.00%; WA, 6.81%), and Ruminiclostridium (DA, 0.00%; WA, 0.03%) were significantly higher in the WA group than those in the DA group. The abundance of Negativibacillus (DA, 0.04%; WA, 0.02%), Fournierella (DA, 0.16%; WA, 0.00%), Blautia (DA, 0.46%; WA, 0.08%), Anaerosporobacter (DA, 0.62%; WA, 0.00%), Unclassified__Lachnospiraceae (DA, 0.01%; WA, 0.00%), Prevotellaceae_UCG-003 (DA, 1.97%; WA, 0.16%), Prevotella_9 (DA, 2.29%; WA, 0.01%), and Clostridium_sensu_stricto_6 (DA, 0.12%; WA, 0.00%) were significantly higher in the DA group than in the WA group (p < 0.05) (Figure 1E). We applied Tax4Fun2 to predict the potential functions of intestinal bacteria in wapiti and compared the differences between the two groups. PCoA results indicated significant differences in metabolic pathways at the KEGG 3 level between the WA and DA groups (Figure 1F) (p < 0.01). In addition, significant differences were observed in 71 metabolic pathways between the WA and DA groups (p < 0.05). The WA group showed a significant positive correlation in pathways related to signal transduction and material circulation, including carbon metabolism, Pyruvate metabolism, steroid hormone biosynthesis, and Citrate cycle (TCA cycle) (p < 0.05). While pathways related to biomolecule anabolism, including lipopolysaccharide biosynthesis, glycosaminoglycan degradation, and Primary bile acid biosynthesis, showed a significant significantly negative correlation (p < 0.05) (Figure 1G).
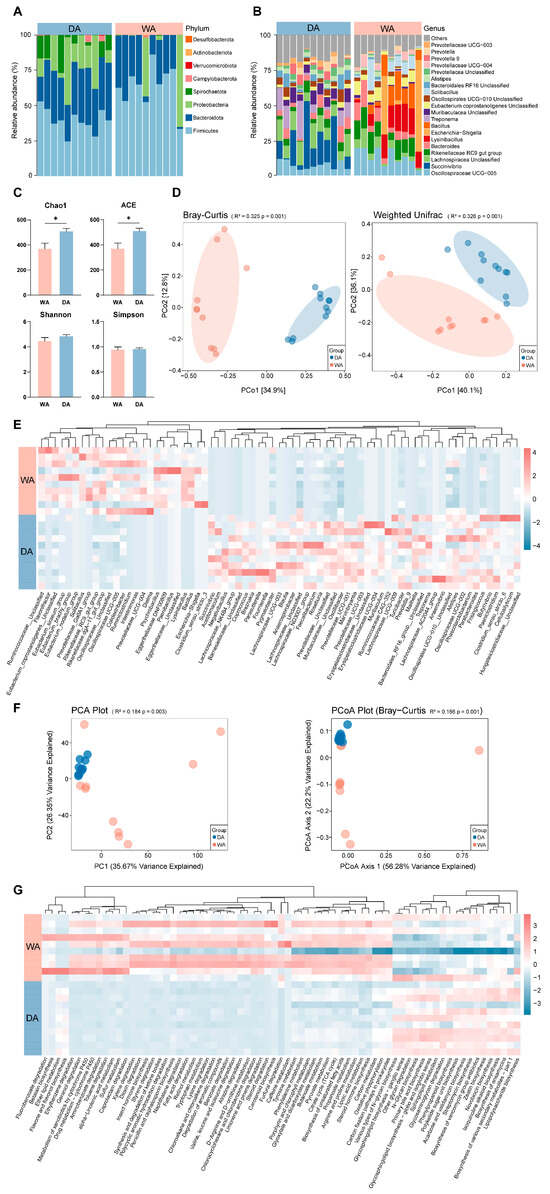
Figure 1.
Composition, diversity and functional prediction of bacterial microbial community in the feces of wild (WA) and captive (DA) wapiti. (A) Microbial composition at the phylum level of the intestinal bacteria of wapiti in the WA and DA groups. (B) Bacterial composition at the genus level of the intestinal bacteria of wapiti in the WA and the DA groups. (C) Comparison of α diversity index between the WA and DA groups. ACE: Abundance-based Coverage Estimator. (D) PCoA (principal co-ordinates analysis) plots based on the Bray–Curtis and Weighted Unifrac algorithms describing the differences in microbial community composition and structure at the OTU level in feces of wapiti between the WA and DA groups. (E) Heat map describing the significant differences in microbial composition between the WA and DA groups (p < 0.05). (F) PCoA plot of the differences in bacterial functional characteristics at the KEGG (Kyoto Encyclopedia of Genes and Genomes) 3 level (relative abundance) based on Bray–Curtis dissimilarity. (G) Description of the significant difference pathways of KEGG 3 between the WA and DA groups (p < 0.05). * p < 0.05.
3.2. Compositional Characteristics and Predicted Metagenomic Functions in Fungi
After denoising and species annotation of the sample sequencing data using the QIIME 2 software package, a total of 956,719 reads were retained and classified into 2114 OTUs (Table S2). Further classification identified 15 phyla, with Ascomycota (DA, 63.43%; WA, 41.11%) and Basidiomycota (DA, 3.29%; WA, 16.53%) being the predominant phyla in both groups. In the WA group, the relative abundances of Mucoromycota (DA, 0.32%; WA, 8.08%) and Neocallimastigomycota (DA, 0.95%; WA, 1.29%) increased (Figure 2A), and a further 35 genera were identified. In the WA group, Agaricus (DA, 0.00%; WA, 7.47%), Preussia (DA, 0.00%; WA, 5.45%), and Thelebolus (DA, 0.00%; WA, 3.86%) was more abundant. In the DA group, Xeromyces (DA, 20.29%; WA, 0.00%), Gibberella (DA, 18.84%; WA, 0.00%), and Fusarium (DA, 6.54%; WA, 0.00%) were more abundant, indicating a more complex fungal microbiome in the WA group (Figure 2B). Analysis of α-diversity indices between the WA and the DA groups indicated that the Chao1 index, ACE index, and Shannon index of the DA group increased significantly (p < 0.05), while the differences in other indices were not statistically significant (p > 0.05) (Figure 2C). The gut fungal composition of wild and captive wapiti was significantly different (p = 0.001) according to Bray–Curtis and Unweighted Unifrac analyses (Figure 2D). The abundances of Beauveria (DA, 0.00%; WA, 0.32%), Paraphaeosphaeria (DA, 0.00%; WA, 0.61%), Naganishia (DA, 0.00%; WA, 0.07%), and Selenophoma (DA, 0.00%; WA, 1.64%) in the WA group were significantly higher than those in the DA group (p < 0.05), while the abundances of Mucor (DA, 0.31%; WA, 0.17%), Acremonium (DA, 0.05%; WA, 0.00%), Fungi_gen_Incertae_sedis (DA, 1.59%; WA, 0.81%), and Bettsia (DA, 0.05%; WA, 0.00%) in the DA group were significantly higher than those in the WA group (p < 0.05) (Figure 2E). When predicting the potential functions of the intestinal microbiota of wapiti, significant differences in metabolic pathways at the KEGG 3-level were found between the WA and DA groups (p < 0.01) (Figure 2F). In addition, there were significant differences in 42 metabolic pathways between the WA group and the DA group (p < 0.05). The signal transduction and material circulation-related pathways in the WA group, including glycolysis III (from glucose), TCA cycle II (plants and fungi), aerobic respiration I (cytochrome c), aerobic respiration II (cytochrome c) (yeast), were significantly positive correlated (p < 0.05). In contrast, pathways related to biomolecular synthesis, including the superpathway of L-serine and glycine, L-proline biosynthesis II (from arginine), urea cycle, pentose phosphate pathway (non-oxidative branch), and D-myo-inositol (1,4,5)-trisphosphate biosynthesis, were significantly negative correlated (p < 0.05) (Figure 2G).
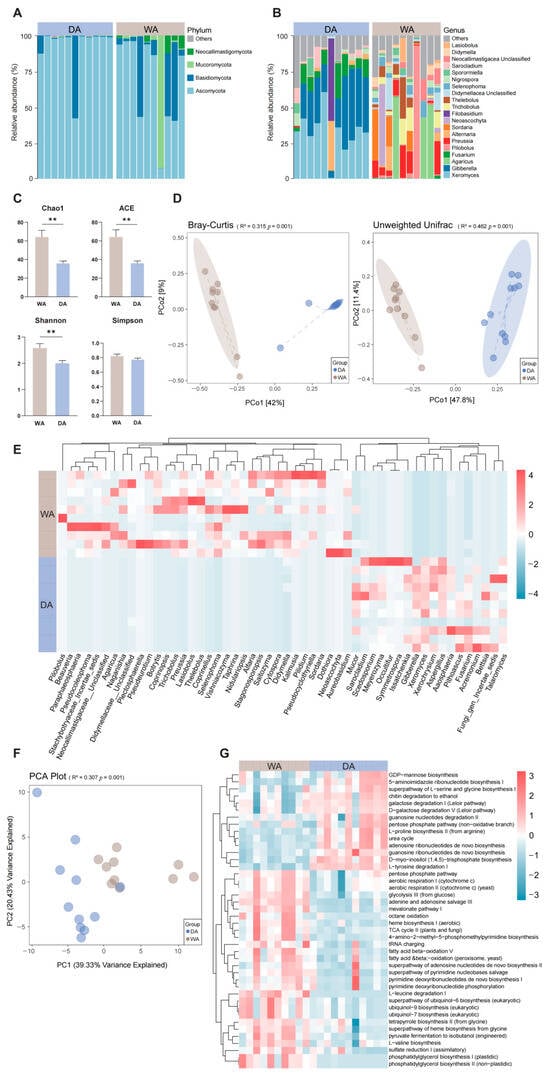
Figure 2.
Composition, diversity and functional prediction of fungal microbial community in the feces of wild (WA) and captive (DA) wapiti. (A) Microbial composition at the fungal phylum level in the intestinal tract of wapiti in the WA and DA groups. (B) Microbial composition at the fungal genus level in the intestinal tract of wapiti in the WA and DA groups. (C) Comparison of α diversity index between the WA and DA groups. ACE: Abundance-based Coverage Estimator. (D) PCoA (principal co-ordinates analysis) plots based on the Bray–Curtis and Unweighted Unifrac algorithms describing the e differences in the members and structure of the fungal microbial community in the feces of wapiti between the WA and DA groups at the OTU level; (E) Heat map describing the significant differences in microbial composition between the WA group and the DA group (p < 0.05); (F) PCA graph based on Bray–Curtis dissimilarity; (G) KEGG (Kyoto Encyclopedia of Genes and Genomes) 3 pathways describing the significant differences of between the WA group and the DA group (p < 0.05). ** p < 0.01.
3.3. Exploration the Protozoa Composition in the Gut of Wapiti
We sought to explore and characterize the presence of protozoa in the intestines of wild and captive wapiti. The noise reduction and annotation of protozoan ASV depended on the pre-analysis removal of chloroplasts and fungi. After quality control. A total of 3726 reads were retained and classified into 41 OTUs (Table S3). At the phylum level, we found that Cercozoa (DA, 33.33%; WA, 66.67%), Apicomplexa (DA, 27.27%; WA, 0.00%), Archamoebae (DA, 24.24%; WA, 3.33%), and Ciliophora (DA, 6.06%; WA, 0.00%) are the dominant phyla in the DA group. While Cercozoa, Apicomplexa, unidentified_Amoebozoa (DA, 0.00%; WA, 6.67%) and Protalveolata (DA, 0.00%; WA, 3.33%) are the dominant phyla in the WA group (Figure 3A). The dominant bacterial genera in the two groups differed. In the WA group, Heteromita (DA, 33.33%; WA, 50.00%), Rhogostoma (DA, 0.00%; WA, 6.67%), Vermamoeba (DA, 0.00%; WA, 3.33%), and Gregarina (DA, 0.00%; WA, 3.33%) was relatively abundant. While in the DA group, soil flagellates such as Heteromita, Entamoeba (DA, 24.24%; WA, 0.00%), Eimeria (DA, 18.18%; WA, 0.00%), and Cryptosporidium (DA, 9.09%; WA, 0.00%) were relatively abundant, and the protozoan composition in the WA group was more complex (Figure 3B). Genus-level analysis revealed significantly higher abundance of Entamoeba and Eimeria in the DA group compared with the WA group (p < 0.05) (Figure 3E). Alpha-diversity index analysis revealed no significant differences in the Chao1 index or Shannon index between the WA and DA groups (p > 0.05) (Figure 3C). Bray–Curtis analysis revealed highly significant differences in the intestinal protozoa composition between wild and captive wapiti (p < 0.01) (Figure 3D).
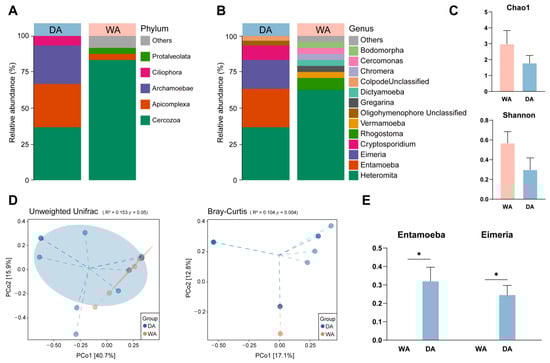
Figure 3.
Composition and diversity of protozoan microbial communities in the feces of wild (WA) and captive (DA) wapiti. (A) Phylum-level composition of protozoa in the intestines of wapiti in the WA and DA groups; (B) Genus-level composition of protozoa in the intestines of wapiti in the WA and DA groups; (C) Comparison of α diversity index between the WA and DA groups; (D) PCoA (principal co-ordinates analysis) plots showing differences in protozoan microbial communities composition and structure at the OTU level in the feces of wapiti between the WA and DA groups, based on the Bray–Curtis and Unweighted Unifrac algorithms, respectively; (E) Bar chart showing significant differences in microbial composition between the WA and DA groups (p < 0.05).* p < 0.05.
3.4. Interaction Analysis of Bacterial, Fungal, and Protozoan Microbial Networks Between Wild and Captive Wapiti
We respectively studied the correlations between the altered microorganisms in the WA group and the DA group (Figure 4). The results revealed that the co-occurrence network for the WA group comprised 141 nodes and 326 edge data points, whereas that for the DA group contained 123 nodes and 218 edge data points (Table S4). Notably, within the WA group, 234 edges representing positive correlations and 83 edges indicating negative correlations were observed in the fungal-bacterial edge data, whereas the fungal-protozoan edge data exhibited 9 positive correlations and 0 negative correlations (Table S5). Within the DA group, fungal-bacterial edge data comprised 91 edges indicating positive correlations and 100 edges indicating negative correlations. Fungal-protozoan edge data comprised 22 edges indicating positive correlations and 5 edges indicating negative correlations (Table S6). Within the WA group, Agaricus exhibits negative correlations with Escherichia-Shigella and positive correlations with Ruminococcus, and Hungateiclostridiaceae__Unclassified. Preussia shows positive correlations with Clostridium_sensu_stricto_3, and Eggerthellaceae__Unclassified, while Prevotellaceae_UCG-004 and Rikenellaceae_dgA-11_gut_group showed negative correlations (Table S5). Within the DA group, Xeromyces exhibited negative correlations with Prevotellaceae__Unclassified and Papillibacter. Gibberella showed a negative correlation with Oscillospiraceae_NK4A214_group, and Fusarium demonstrated a positive correlation with Anaerovibrio (Table S6).
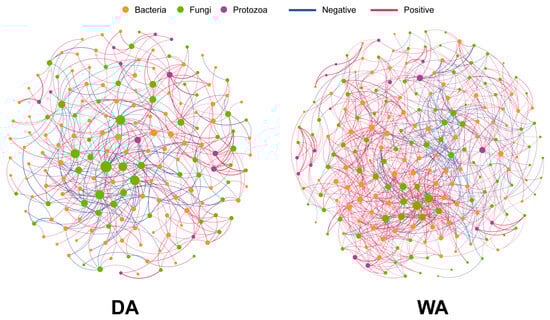
Figure 4.
Spearman correlation analysis of bacterial, fungal, and protozoan microbial interaction networks between wild and captive wapiti. The pink and blue lines indicate positive and negative correlations, respectively.
4. Discussion
Previous studies have demonstrated significant differences in fecal microbial communities between wild and captive reindeer, a finding mirrored in our research on wild and captive wapiti [8]. At the phylum level, Bacteroidetes and Firmicutes dominate the digestive tracts of wapiti in Xinjiang [9], suggesting regional similarity in their gut microbiota composition. Wild sika deer exhibit a higher prevalence of Firmicutes compared to their domesticated counterparts, whereas Bacteroidetes and Proteobacteria are more prevalent in domesticated sika deer [6], aligning with our study. Bacteroidetes facilitate the degradation of monosaccharides, proteins, and carbohydrates, whilst Firmicutes primarily break down cellulose [3,31]. Wild red deer consume untreated, high-fiber natural diets, necessitating a greater presence of fiber-degrading bacteria [32]. In contrast, domesticated animal feed typically contains lower fiber levels and simpler carbohydrates [33], explaining the observed compositional shift. Furthermore, dominant bacterial genera differed between groups. Wild wapiti had higher levels of Escherichia-Shigella and UCG-005. Escherichia-Shigella, a marker for intestinal inflammation in animals [34], has been linked to diarrhea in various species [35] and detected in wild animals like the Alpine musk deer and giant panda [36,37]. Its abundance is subject to seasonal fluctuations, increasing notably in summer [38,39]. Our sampling during the summer-autumn transition suggests seasonal influences should be taken into account. UCG-005, a butyrate-producing bacterium involved in cellulose degradation, converts cellulose into glucose and fructose, which undergo glycolysis to form pyruvate, entering the tricarboxylic acid cycle to generate energy [40,41,42,43]. Research indicates that the relative abundance of propionate metabolic pathways in wild reindeer is significantly higher than in captive reindeer [5], consistent with our findings. These pathways are associated with cellulose degradation and energy metabolism [44], indicating enhanced plant fiber utilization capacity in wild wapiti. Conversely, domesticated wapiti exhibited higher relative abundances of Succinivibrio and Treponema. Treponema, a potential pathogen [45], has unconfirmed pathogenicity in animal gastrointestinal tracts [46,47]. Xue et al. [48] identified Succinivibrio as a common short-chain fatty acid producer in ruminant intestines, with its abundance positively correlated with acetate, propionate, and butyrate levels, which serve growth, development, and energy metabolism. Beyond these abundant genera, Clostridium_sensu_stricto_6 was more prevalent in captive wapiti, potentially participating in amino acid utilization through bile acid metabolism [5], consistent with the enrichment of bile acid metabolic pathways observed in this study. Grain-fed captive wapiti often have high fat and amino acid levels, similar to domestic donkeys whose gut microbiota enriches lipopolysaccharide-associated metabolic pathways [49], aligning with the present findings. However, predictive accuracy depends on database availability and phylogenetic distance from reference genomes [7], necessitating further validation through multi-omics studies (e.g., transcriptomics, metabolomics).
Ruminant gut fungi possess a rich array of carbohydrate-hydrolyzing enzymes, including β-glucosidases and xylanases, crucial for herbivores [50,51,52]. Previous studies have identified Ascomycota and Basidiomycota as predominant fungal phyla in ruminant gastrointestinal tracts [53,54], which is consistent with the digestive tract fungal composition observed in wapiti in the digestive tract of this study. An increased Basidiomycota to Ascomycota ratio may contribute to fungal microbiota dysbiosis and inflammatory bowel disease [16]. Our findings indicate that wild wapiti exhibit higher proportions, suggesting a potential risk of intestinal inflammation within this population. Furthermore, the proportions of Basidiomycota and Ascomycota differ among various animal species, which may be influenced by factors such as their habitat, diet, and the structure of their intestinal microecology [55]. Compared to captive wapiti, wild ones displayed greater relative abundances of Mucoromycota, Neocallimastigomycota, Agaricus, and Preussia. Mucoromycota, frequently found in soil [53], may have been ingested during foraging. Neocallimastigomycota, rich in cellulase and hemicellulase, efficiently degrade plant cell wall components into fermentable monosaccharides, supporting high-quality microbial protein production for the host [56,57], aligning with wild wapiti’s dietary characteristics. Although Agaricus exhibits relatively high abundance in the digestive tracts of wild wapiti, it does not appear to be a common fungal inhabitant of animal intestines, with only a few studies reporting its presence [58,59]. However, due to the absence of comprehensive data on the wild wapiti’s diet, we hypothesize that the observed material may stem from undigested plant residues following foraging activities, rather than indicating a long-term colonization within the gut of wild wapiti [60]. Preussia, currently identified only in plant material and African savanna elephant feces [61,62,63], possesses the capacity to produce cellulase, amylase, or lipase [63,64,65]. Conversely, the specific functions and roles of certain fungi within animal intestines remain ambiguous, necessitating further exploration. Notably, the enrichment of cellulose-degrading fungi resembles the bacterial functional outcomes observed in the digestive tracts of wild wapiti; wild wapiti mirrors the bacterial functional profiles observed in their digestive tracts. Conversely, captive wapiti exhibit higher relative abundances of Xeromyces, Gibberella, and Fusarium. Xeromyces, a drought-tolerant extremophile fungus [66], is prevalent in the intestines and feces of various animals and shows a significant negative correlation with acetic acid production [67]. It is also associated with diseases such as depression and hypertension [68,69], and can influence the secretion of the host’s anti-inflammatory cytokine IL-4 [70]. For wapiti, Gibberella is an exogenous intestinal fungus and a common plant pathogen found in cereals like maize [71], often accompanied by Fusarium [72]. Given that maize and maize stover are primary roughage sources for captive wapiti, the inferior quality of roughage provided by breeders likely contributes to the proliferation of these phytopathogenic fungi [73]. However, this does not imply that there is a significant presence of pathogenic bacteria in the intestines of captive wapiti. This may be attributed to the fact that we collected samples from captive wapiti at only one farm and the sample size was limited, which constrained the generalizability of our findings. Functional predictions reveal that gut fungi in wild wapiti enrich pathways linked to glycolysis, the TCA cycle, and aerobic respiration, all crucial for fiber utilization [42,74]. In contrast, the gut microbiota of captive wapiti show enrichment in pathways related to L-serine and glycine, L-proline biosynthesis II (from arginine), and the urea cycle, which are involved in amino acid and lipid metabolism [75,76]. This pattern mirrors the functional predictions of gut bacteria in both wild and captive wapiti.
Protozoa, particularly ciliates, are intriguing microorganisms. Soil protozoa have been demonstrated to function as bacterial predators and fungal nurturers, among other roles [77]. They typically form symbiotic relationships with their hosts and exhibit co-evolutionary patterns during long-term ecological succession [78,79]. In this study, Heteromita emerged as the dominant genus in the digestive tracts of wild wapiti. Heteromita closely interacts with bacteria, aiding in toluene degradation and hydrocarbon breakdown [80]. Despite being a dominant genus in both wild and captive wapiti, its specific functions within the animal’s digestive tract remain underexplored and warrant further investigation. In contrast, Entamoeba and Eimeria are more abundant in the digestive tracts of captive wapiti. These protozoa are commonly found in animal intestines and may possess pathogenic potential [81,82]. These findings suggest that monitoring animal health should not be limited to bacterial composition alone. However, limitations in sample size and sequencing methods may have led to the underdetection of numerous protozoa.
Research underscores the crucial roles of complex interactions among bacteria, fungi, and protozoa in the development, growth, adaptation, and diversification of organisms [83,84]. Zou et al. [55] observed that gut bacterial and fungal communities in wild herbivores tend towards coexistence rather than mutual exclusion. Conversely, in captive herbivores, these communities exhibit a tendency towards mutual exclusion [85]. Studies indicate that dietary alterations can rapidly induce shifts in gut microbiota and alter intergenic relationships [86,87]. Research on artificially fed Indian camels (Camelus dromedarius) revealed predominantly negative correlations between gastrointestinal fungi and protozoa [88], consistent with our findings. However, this may also result from the influence of antibiotics or biological control agents in captive animals [89]. Factors such as sex may further modulate microbial interactions [90]. This highlights that microbial interactions are influenced by multiple factors, including diet and sex, necessitating further research to resolve these discrepancies and elucidate the contextual drivers of microbial variation. At the specific microbial interaction level, dominant genera in wild wapiti—Agaricus and Preussia—exhibit positive correlations with cellulose-degrading bacteria (Ruminococcus and Clostridium_sensu_stricto_3) [91,92]. Simultaneously, they suppress potential pathogenic bacteria Escherichia-Shigella [34], forming a synergistic coexistence conducive to fiber degradation. Conversely, the core fungi Xeromyces in captive wapiti show negative correlations with primary fiber-degrading bacteria of the Prevotellaceae family [93] and lipid-regulating bacteria Papillibacter [94]. This mutually exclusive development aligns with the bacterial-fungal interactions observed in captive animals.
Our findings reveal distinct microbial structures between captive and wild wapiti, offering valuable insights for wapiti herders, given the gut microbiota’s significance for animal health and productivity [95]. For national nature reserves, providing health monitoring data on wild wapiti is also crucial. However, this study has limitations: findings were derived from a limited sample size of wapiti, highlighting the need for further research. Additionally, wild wapiti samples did not account for sex or age factors, while captive wapiti samples were collected from a single breeding farm, potentially limiting the generalizability of the results. Future research should address these limitations by comparing gut microbial compositions between female and male wapiti and across different seasons, incorporating larger and more diverse samples, and employing methodologies like transcriptomics and metabolomics.
5. Conclusions
We conducted comparative analyses of bacteria, fungi, and protozoa in wild and captive wapiti, revealing significant differences in gut microbiota composition between wild and captive wapiti. The microbial communities in wild wapiti feces were associated with cellulose degradation, whereas those in captive wapiti feces were linked to amino acid and fatty acid utilization. These findings highlight the influence of dietary composition on the gut microbiome and may provide new insights into the husbandry management of captive wapiti, ultimately leading to efficient, scientific, and healthy rearing practices.
Supplementary Materials
The following supporting information can be downloaded at: https://www.mdpi.com/article/10.3390/ani16010044/s1, Table S1. Sequencing depth of fecal bacteria of wild and captive wapiti; Table S2. Sequencing depth of fecal fungi of wild and captive wapiti; Table S3. Sequencing depth of fecal protozoa of wild and captive wapiti; Table S4. The co-occurrence network parameter of wild and captive wild; Table S5. The correlation of bacterial and fungal microbiomes in the feces of wild wapiti; Table S6. The correlation of bacterial and fungal microbiomes in the feces of captive wapiti.
Author Contributions
Conceptualization, Y.Z. (Yalin Zhou), Y.W., C.M., X.R., M.C., Y.Z. (Yulei Zhou), T.L., W.S. and H.L.; methodology, Y.Z. (Yalin Zhou), Y.W. and H.L.; investigation, X.R. and M.C.; resources, X.R. and T.L.; data curation, Y.Z. (Yalin Zhou) and Y.W.; writing—original draft preparation, Y.Z. (Yalin Zhou), Y.W. and C.M.; writing—review and editing, Y.Z. (Yulei Zhou), W.S. and H.L.; visualization, W.S. and H.L.; supervision, T.L. and H.L.; project administration, H.L.; funding acquisition, H.L. All authors have read and agreed to the published version of the manuscript.
Funding
This research was supported by the 2022 Inner Mongolia Autonomous Region Key R&D and Achievement Transformation Project (Science and Technology Support for Northeast Revitalization) titled “Innovation and Promotion of Application of Deer Source Probiotic Preparation” (Grant No. 2022YFDZ0072); as well as the Hohhot Science and Technology Innovation Project (Grant No. 2023RC-Industry-Research-Institute-7).
Institutional Review Board Statement
Since only animal feces were collected in this study and all were done under the premise of not disturbing the animals as much as possible, no discomfort such as stress was caused to the animals. All samples were collected only after obtaining the responsible oral consent of the sample collection site. This study does not involve human experiments.
Informed Consent Statement
Not applicable.
Data Availability Statement
Sequence data that support the findings of this study have been deposited in the National Center for Biotechnology Information: https://www.ncbi.nlm.nih.gov, accessed on 23 November 2025, PRJNA 1172148, 1172087, 1172100, 1172092, 1172002, 1172008, 1171993 and 1168658. The original contributions presented in the study are included in the article, further inquiries can be directed to the corresponding author.
Conflicts of Interest
The authors declare no conflicts of interest.
References
- Schwab, C.; Cristescu, B.; Boyce, M.S.; Stenhouse, G.B.; Gänzle, M. Bacterial Populations and Metabolites in the Feces of Free Roaming and Captive Grizzly Bears. Can. J. Microbiol. 2009, 55, 1335–1346. [Google Scholar] [CrossRef]
- Bae, D.-Y.; Moon, S.-H.; Lee, T.G.; Ko, Y.-S.; Cho, Y.-C.; Kang, H.; Park, C.-S.; Kang, J.-S.; Oh, Y.; Cho, H.-S. Consequences of Domestication on Gut Microbiome: A Comparative Analysis between Wild Boars and Domestic Pigs. Animals 2025, 15, 747. [Google Scholar] [CrossRef]
- Shah, T.; Guo, X.; Song, Y.; Fang, Y.; Ding, L. Comparative Analysis of Gut Bacterial Diversity in Wild and Domestic Yaks on the Qinghai-Tibetan Plateau. Animals 2024, 14, 2380. [Google Scholar] [CrossRef] [PubMed]
- Li, C.; Zhao, H.; Liu, Z.; McMahon, C. Deer Antler—A Novel Model for Studying Organ Regeneration in Mammals. Int. J. Biochem. Cell Biol. 2014, 56, 111–122. [Google Scholar] [CrossRef] [PubMed]
- Zhao, F.; Zhao, Q.; Li, S.; Zhu, Y.; Si, H.; Feng, J.; Li, Z. Comparison of Fecal Microbiota and Metabolites between Captive and Grazing Male Reindeer. Animals 2024, 14, 3606. [Google Scholar] [CrossRef] [PubMed]
- Guan, Y.; Yang, H.; Han, S.; Feng, L.; Wang, T.; Ge, J. Comparison of the Gut Microbiota Composition between Wild and Captive Sika Deer (Cervus nippon hortulorum) from Feces by High-Throughput Sequencing. AMB Express 2017, 7, 212. [Google Scholar] [CrossRef]
- Sun, Y.; Yu, Y.; Guo, J.; Zhong, L.; Zhang, M. Alterations in Fecal Microbiota Linked to Environment and Sex in Red Deer (Cervus elaphus). Animals 2023, 13, 929. [Google Scholar] [CrossRef]
- Li, B.; Gao, H.; Song, P.; Liang, C.; Jiang, F.; Xu, B.; Liu, D.; Zhang, T. Captivity Shifts Gut Microbiota Communities in White-Lipped Deer (Cervus albirostris). Animals 2022, 12, 431. [Google Scholar] [CrossRef]
- Huang, J.; Sheng, Y.; Xue, P.; Yu, D.; Guan, P.; Ren, J.; Qian, W. Patterns of Spatial Variation in Rumen Microbiology, Histomorphology, and Fermentation Parameters in Tarim Wapiti (Cervus elaphus yarkandensis). Microorganisms 2024, 12, 216. [Google Scholar] [CrossRef]
- Jiang, F.; Song, P.; Wang, H.; Zhang, J.; Liu, D.; Cai, Z.; Gao, H.; Chi, X.; Zhang, T. Comparative Analysis of Gut Microbial Composition and Potential Functions in Captive Forest and Alpine Musk Deer. Appl. Microbiol. Biotechnol. 2022, 106, 1325–1339. [Google Scholar] [CrossRef]
- Yan, J.; Wu, X.; Wang, X.; Shang, Y.; Zhang, H. Uncovering the Fecal Bacterial Communities of Sympatric Sika Deer (Cervus nippon) and Wapiti (Cervus canadensis). Animals 2022, 12, 2468. [Google Scholar] [CrossRef]
- Saftien, A.; Puschhof, J.; Elinav, E. Fungi and Cancer. Gut 2023, 72, 1410–1425. [Google Scholar] [CrossRef]
- Sokol, H.; Leducq, V.; Aschard, H.; Pham, H.-P.; Jegou, S.; Landman, C.; Cohen, D.; Liguori, G.; Bourrier, A.; Nion-Larmurier, I.; et al. Fungal Microbiota Dysbiosis in IBD. Gut 2017, 66, 1039–1048. [Google Scholar] [CrossRef]
- Newbold, C.J.; Lassalas, B.; Jouany, J.P. The Importance of Methanogens Associated with Ciliate Protozoa in Ruminal Methane Production in Vitro. Lett. Appl. Microbiol. 1995, 21, 230–234. [Google Scholar] [CrossRef]
- Chabé, M.; Lokmer, A.; Ségurel, L. Gut Protozoa: Friends or Foes of the Human Gut Microbiota? Trends Parasitol. 2017, 33, 925–934. [Google Scholar] [CrossRef]
- Loke, P.; Lim, Y.A.L. A Commensal Protozoan Strikes a Balance in the Gut. Cell Host Microbe 2016, 20, 417–419. [Google Scholar] [CrossRef]
- Ranilla, M.J.; Jouany, J.-P.; Morgavi, D.P. Methane Production and Substrate Degradation by Rumen Microbial Communities Containing Single Protozoal Species in Vitro. Lett. Appl. Microbiol. 2007, 45, 675–680. [Google Scholar] [CrossRef]
- Veira, D.M. The Role of Ciliate Protozoa in Nutrition of the Ruminant. J. Anim. Sci. 1986, 63, 1547–1560. [Google Scholar] [CrossRef] [PubMed]
- Minas, K.; McEwan, N.R.; Newbold, C.J.; Scott, K.P. Optimization of a High-Throughput CTAB-Based Protocol for the Extraction of qPCR-Grade DNA from Rumen Fluid, Plant and Bacterial Pure Cultures. FEMS Microbiol. Lett. 2011, 325, 162–169. [Google Scholar] [CrossRef] [PubMed]
- Caporaso, J.G.; Lauber, C.L.; Walters, W.A.; Berg-Lyons, D.; Lozupone, C.A.; Turnbaugh, P.J.; Fierer, N.; Knight, R. Global Patterns of 16S rRNA Diversity at a Depth of Millions of Sequences per Sample. Proc. Natl. Acad. Sci. USA 2011, 108, 4516–4522. [Google Scholar] [CrossRef] [PubMed]
- Bachy, C.; Dolan, J.R.; López-García, P.; Deschamps, P.; Moreira, D. Accuracy of Protist Diversity Assessments: Morphology Compared with Cloning and Direct Pyrosequencing of 18S rRNA Genes and ITS Regions Using the Conspicuous Tintinnid Ciliates as a Case Study. ISME J. 2013, 7, 244–255. [Google Scholar] [CrossRef] [PubMed]
- Cheung, M.K.; Au, C.H.; Chu, K.H.; Kwan, H.S.; Wong, C.K. Composition and Genetic Diversity of Picoeukaryotes in Subtropical Coastal Waters as Revealed by 454 Pyrosequencing. ISME J. 2010, 4, 1053–1059. [Google Scholar] [CrossRef]
- Mao, Y.; Wang, F.; Kong, W.; Wang, R.; Liu, X.; Ding, H.; Ma, Y.; Guo, Y. Dynamic Changes of Rumen Bacteria and Their Fermentative Ability in High-Producing Dairy Cows during the Late Perinatal Period. Front. Microbiol. 2023, 14, 1269123. [Google Scholar] [CrossRef] [PubMed]
- Magoč, T.; Salzberg, S.L. FLASH: Fast Length Adjustment of Short Reads to Improve Genome Assemblies. Bioinformatics 2011, 27, 2957–2963. [Google Scholar] [CrossRef] [PubMed]
- Bokulich, N.A.; Subramanian, S.; Faith, J.J.; Gevers, D.; Gordon, J.I.; Knight, R.; Mills, D.A.; Caporaso, J.G. Quality-Filtering Vastly Improves Diversity Estimates from Illumina Amplicon Sequencing. Nat. Methods 2013, 10, 57–59. [Google Scholar] [CrossRef]
- Edgar, R.C.; Haas, B.J.; Clemente, J.C.; Quince, C.; Knight, R. UCHIME Improves Sensitivity and Speed of Chimera Detection. Bioinformatics 2011, 27, 2194–2200. [Google Scholar] [CrossRef]
- Zhang, J.; Yang, Y.; Lei, X.; Wang, Y.; Li, Y.; Yang, Z.; Yao, J. Active Dry Yeast Supplementation Benefits Ruminal Fermentation, Bacterial Community, Blood Immunoglobulins, and Growth Performance in Young Dairy Goats, but Not for Intermittent Supplementation. Anim. Nutr. 2023, 13, 289–301. [Google Scholar] [CrossRef]
- Gao, Y.; Zhang, G.; Jiang, S.; Liu, Y. Wekemo Bioincloud: A User-friendly Platform for Meta-omics Data Analyses. Imeta 2024, 3, e175. [Google Scholar] [CrossRef]
- Li, Y.; Zhu, Y.; Yang, B.; Yu, S.; Li, S.; Wright, A.-D.G.; Du, R.; Si, H.; Li, Z. Characteristics and Differences in the Antler Velvet Microbiota during Regeneration. Microorganisms 2024, 13, 36–49. [Google Scholar] [CrossRef]
- Bastian, M.; Heymann, S.; Jacomy, M. Gephi: An Open Source Software for Exploring and Manipulating Networks. In Proceedings of the 3rd International AAAI Conference on Web and Social Media, San Jose, CA, USA, 17–20 May 2009; Volume 3, pp. 361–362. [Google Scholar] [CrossRef]
- Flint, H.J.; Scott, K.P.; Duncan, S.H.; Louis, P.; Forano, E. Microbial Degradation of Complex Carbohydrates in the Gut. Gut Microbes 2012, 3, 289–306. [Google Scholar] [CrossRef]
- Guo, J.; Li, Z.; Jin, Y.; Sun, Y.; Wang, B.; Liu, X.; Yuan, Z.; Zhang, W.; Zhang, C.; Zhang, M. The Gut Microbial Differences between Pre-Released and Wild Red Deer: Firmicutes Abundance May Affect Wild Adaptation after Release. Front. Microbiol. 2024, 15, 1401373. [Google Scholar] [CrossRef]
- Huang, J.; Sheng, Y.; Xue, P.; Guan, P.; Ren, J.; Qian, W. Characteristics of Bacterial Community and Volatile Fatty Acids in the Gastrointestinal Tract of Tarim Wapiti. Ital. J. Anim. Sci. 2024, 23, 259–274. [Google Scholar] [CrossRef]
- Wang, B.; Deng, B.; Yong, F.; Zhou, H.; Qu, C.; Zhou, Z. Comparison of the Fecal Microbiomes of Healthy and Diarrheic Captive Wild Boar. Microb. Pathogen. 2020, 147, 104377. [Google Scholar] [CrossRef]
- Li, Y.; Hu, X.; Yang, S.; Zhou, J.; Qi, L.; Sun, X.; Fan, M.; Xu, S.; Cha, M.; Zhang, M.; et al. Comparison between the Fecal Bacterial Microbiota of Healthy and Diarrheic Captive Musk Deer. Front. Microbiol. 2018, 9, 300. [Google Scholar] [CrossRef]
- Zhang, B.; Shi, M.; Xu, S.; Zhang, H.; Li, Y.; Hu, D. Analysis on Changes and Influencing Factors of the Intestinal Microbiota of Alpine Musk Deer between the Place of Origin and Migration. Animals 2023, 13, 3791. [Google Scholar] [CrossRef]
- Xue, Z.; Zhang, W.; Wang, L.; Hou, R.; Zhang, M.; Fei, L.; Zhang, X.; Huang, H.; Bridgewater, L.C.; Jiang, Y.; et al. The Bamboo-Eating Giant Panda Harbors a Carnivore-like Gut Microbiota, with Excessive Seasonal Variations. mBio 2015, 6, e00022-15. [Google Scholar] [CrossRef] [PubMed]
- Williams, C.E.; Brown, A.E.; Williams, C.L. The Role of Diet and Host Species in Shaping the Seasonal Dynamics of the Gut Microbiome. FEMS Microbiol. Ecol. 2023, 99, fiad156. [Google Scholar] [CrossRef] [PubMed]
- Zeng, Y.; Zeng, D.; Zhou, Y.; Niu, L.; Deng, J.; Li, Y.; Pu, Y.; Lin, Y.; Xu, S.; Liu, Q.; et al. Microbial Biogeography along the Gastrointestinal Tract of a Red Panda. Front. Microbiol. 2018, 9, 1411. [Google Scholar] [CrossRef] [PubMed]
- Xi, L.; Wen, X.; Jia, T.; Han, J.; Qin, X.; Zhang, Y.; Wang, Z. Comparative Study of the Gut Microbiota in Three Captive Rhinopithecus Species. BMC Genom. 2023, 24, 398. [Google Scholar] [CrossRef]
- Zhong, Z.; Sun, P.; Zhang, Y.; Li, L.; Han, D.; Pan, X.; Zhang, R. Differential Responses of Rumen and Fecal Fermentation and Microbiota of Liaoning Cashmere Goats after 2-Hydroxy-4-(Methylthio) Butanoic Acid Isopropyl Ester Supplementation. Sci. Rep. 2024, 14, 8505. [Google Scholar] [CrossRef]
- Lynd, L.R.; Weimer, P.J.; Van Zyl, W.H.; Pretorius, I.S. Microbial Cellulose Utilization: Fundamentals and Biotechnology. Microbiol. Mol. Biol. Rev. 2002, 66, 506–577. [Google Scholar] [CrossRef]
- Sauer, U.; Eikmanns, B.J. The PEP-Pyruvate-Oxaloacetate Node as the Switch Point for Carbon Flux Distribution in Bacteria: We Dedicate This Paper to Rudolf K. Thauer, Director of the Max-Planck-Institute for Terrestrial Microbiology in Marburg, Germany, on the Occasion of His 65th Birthday. FEMS Microbiol. Rev. 2005, 29, 765–794. [Google Scholar] [CrossRef]
- Tang, L.; Gao, Y.; Yan, L.; Jia, H.; Chu, H.; Ma, X.; He, L.; Wang, X.; Li, K.; Hu, D.; et al. Comparative Analysis of Microbiome Metagenomics in Reintroduced Wild Horses and Resident Asiatic Wild Asses in the Gobi Desert Steppe. Microorganisms 2022, 10, 1166. [Google Scholar] [CrossRef]
- Clegg, S.R.; Carter, S.D.; Birtles, R.J.; Brown, J.M.; Hart, C.A.; Evans, N.J. Multilocus Sequence Typing of Pathogenic Treponemes Isolated from Cloven-Hoofed Animals and Comparison to Treponemes Isolated from Humans. Appl. Environ. Microbiol. 2016, 82, 4523–4536. [Google Scholar] [CrossRef]
- Qian, W.; Ao, W.; Jia, C.; Li, Z. Bacterial Colonisation of Reeds and Cottonseed Hulls in the Rumen of Tarim Red Deer (Cervus elaphus yarkandensis). Antonie Leeuwenhoek 2019, 112, 1283–1296. [Google Scholar] [CrossRef]
- Dias, D.; Cruz, A.; Fonseca, C.; Mendo, S.; Caetano, T.S. Antibiotic Resistance and Potential Bacterial Pathogens Identified in Red Deer’s Faecal DNA. Transbound. Emerg. Dis. 2022, 69, e3425–e3429. [Google Scholar] [CrossRef] [PubMed]
- Xue, M.Y.; Sun, H.Z.; Wu, X.H.; Guan, L.L.; Liu, J.X. Assessment of Rumen Bacteria in Dairy Cows with Varied Milk Protein Yield. J. Dairy Sci. 2019, 102, 5031–5041. [Google Scholar] [CrossRef] [PubMed]
- Liu, H.; Zhao, X.; Han, X.; Xu, S.; Zhao, L.; Hu, L.; Xu, T.; Zhao, N.; Zhang, X.; Chen, D.; et al. Comparative Study of Gut Microbiota in Tibetan Wild Asses (Equus kiang) and Domestic Donkeys (Equus asinus) on the Qinghai-Tibet Plateau. PeerJ 2020, 8, e9032. [Google Scholar] [CrossRef] [PubMed]
- Van Kuijk, S.J.A.; Sonnenberg, A.S.M.; Baars, J.J.P.; Hendriks, W.H.; Cone, J.W. Fungal Treated Lignocellulosic Biomass as Ruminant Feed Ingredient: A Review. Biotechnol. Adv. 2015, 33, 191–202. [Google Scholar] [CrossRef]
- Haitjema, C.H.; Solomon, K.V.; Henske, J.K.; Theodorou, M.K.; O’Malley, M.A. Anaerobic Gut Fungi: Advances in Isolation, Culture, and Cellulolytic Enzyme Discovery for Biofuel Production. Biotechnol. Bioeng. 2014, 111, 1471–1482. [Google Scholar] [CrossRef]
- Teunissen, M.J.; Smits, A.A.M.; Op Den Camp, H.J.M.; Huis In’T Veld, J.H.J.; Vogels, G.D. Fermentation of Cellulose and Production of Cellulolytic and Xylanolytic Enzymes by Anaerobic Fungi from Ruminant and Non-Ruminant Herbivores. Arch. Microbiol. 1991, 156, 290–296. [Google Scholar] [CrossRef]
- El-Zaiat, H.M.; Al-Marzooqi, W.; Al-Kharousi, K. Exploring Rumen Fermentation and Microbial Populations in Dhofari Goats Fed a Chitosan-Added Diet. Anim. Biotechnol. 2024, 35, 2337748. [Google Scholar] [CrossRef]
- Li, Y.; Li, X.; Wu, Y.; Zhang, W. Effects of Fecal Microbiota Transplantation from Yaks on Weaning Diarrhea, Fecal Microbiota Composition, Microbial Network Structure and Functional Pathways in Chinese Holstein Calves. Front. Microbiol. 2022, 13, 898505. [Google Scholar] [CrossRef] [PubMed]
- Zou, H.; Li, Q.; Liu, J.; Wang, X.; Gao, Q.; Yang, Y.; Zhao, X. Fecal Microbiota Reveal Adaptation of Herbivores to the Extreme Environment of the Qinghai-Tibet Plateau. Grassl. Res. 2024, 3, 155–170. [Google Scholar] [CrossRef]
- Butkovich, L.V.; Leggieri, P.A.; Lillington, S.P.; Navaratna, T.A.; Swift, C.L.; Malinov, N.G.; Zalunardo, T.R.; Vining, O.B.; Lipzen, A.; Wang, M.; et al. Separation of Life Stages within Anaerobic Fungi (Neocallimastigomycota) Highlights Differences in Global Transcription and Metabolism. Fungal Genet. Biol. 2025, 176, 103958. [Google Scholar] [CrossRef] [PubMed]
- Fang, C.; Su, Y.; He, X.; Han, L.; Qu, H.; Zhou, L.; Huang, G. Membrane-Covered Composting Significantly Decreases Methane Emissions and Microbial Pathogens: Insight into the Succession of Bacterial and Fungal Communities. Sci. Total Environ. 2022, 845, 157343. [Google Scholar] [CrossRef]
- Enaud, R.; Cambos, S.; Viaud, E.; Guichoux, E.; Chancerel, E.; Marighetto, A.; Etchamendy, N.; Clark, S.; Mohammedi, K.; Cota, D.; et al. Gut Microbiota and Mycobiota Evolution Is Linked to Memory Improvement after Bariatric Surgery in Obese Patients: A Pilot Study. Nutrients 2021, 13, 4061. [Google Scholar] [CrossRef]
- Maas, E.; Penders, J.; Venema, K. Modelling the Gut Fungal-Community in TIM-2 with a Microbiota from Healthy Individuals. J. Fungi 2023, 9, 104. [Google Scholar] [CrossRef]
- Suhr, M.J.; Banjara, N.; Hallen-Adams, H.E. Sequence-Based Methods for Detecting and Evaluating the Human Gut Mycobiome. Lett. Appl. Microbiol. 2016, 62, 209–215. [Google Scholar] [CrossRef]
- Crous, P.W.; Cowan, D.A.; Maggs-Kölling, G.; Yilmaz, N.; Thangavel, R.; Wingfield, M.J.; Noordeloos, M.E.; Dima, B.; Brandrud, T.E.; Jansen, G.M.; et al. Fungal Planet Description Sheets: 1182–1283. Persoonia-Mol. Phylogeny Evol. Fungi 2021, 46, 313–528. [Google Scholar] [CrossRef]
- Du Preez, L.L.; Van Der Walt, E.; Valverde, A.; Rothmann, C.; Neser, F.W.C.; Cason, E.D. A Metagenomic Survey of the Fecal Microbiome of the African Savanna Elephant (Loxodonta africana). Anim. Genet. 2024, 55, 621–643. [Google Scholar] [CrossRef] [PubMed]
- Oliveira, G.F.; Silva, M.R.L.; Hirata, D.B. Production of New Lipase from Preussia africana and Partial Characterization. Prep. Biochem. Biotechnol. 2022, 52, 942–949. [Google Scholar] [CrossRef]
- Seddouk, L.; Jamai, L.; Tazi, K.; Ettayebi, M.; Alaoui-Mhamdi, M.; Aleya, L.; Janati-Idrissi, A. Isolation and Characterization of a Mesophilic Cellulolytic Endophyte Preussia africana from Juniperus oxycedrus. Environ. Sci. Pollut. Res. 2022, 29, 45589–45600. [Google Scholar] [CrossRef]
- Zaferanloo, B.; Bhattacharjee, S.; Ghorbani, M.M.; Mahon, P.J.; Palombo, E.A. Amylase Production by Preussia Minima, a Fungus of Endophytic Origin: Optimization of Fermentation Conditions and Analysis of Fungal Secretome by LC-MS. BMC Microbiol. 2014, 14, 55. [Google Scholar] [CrossRef]
- Leong, S.L.; Pettersson, O.V.; Rice, T.; Hocking, A.D.; Schnürer, J. The Extreme Xerophilic Mould Xeromyces Bisporus—Growth and Competition at Various Water Activities. Int. J. Food Microbiol. 2011, 145, 57–63. [Google Scholar] [CrossRef]
- Li, J.; Luo, Y.; Chen, D.; Yu, B.; He, J.; Huang, Z.; Mao, X.; Zheng, P.; Yu, J.; Luo, J.; et al. The Fungal Community and Its Interaction with the Concentration of Short-chain Fatty Acids in the Caecum and Colon of Weaned Piglets. J. Anim. Physiol. Anim. Nutr. 2020, 104, 616–628. [Google Scholar] [CrossRef]
- Chen, Y.; Meng, L.; Yuan, W.; Gao, Z.; Zhang, X.; Xie, B.; Song, J.; Li, J.; Zhong, J.; Liu, X. Gut Fungal Microbiota Alterations in Pulmonary Arterial Hypertensive Rats. Biomedicines 2024, 12, 298. [Google Scholar] [CrossRef]
- Jiang, H.; Pan, L.; Zhang, X.; Zhang, Z.; Zhou, Y.; Ruan, B. Altered Gut Bacterial-Fungal Interkingdom Networks in Patients with Current Depressive Episode. Brain Behav. 2020, 10, e01677. [Google Scholar] [CrossRef]
- Meng, P.; Zhang, G.; Ma, X.; Ding, X.; Song, X.; Dang, S.; Yang, R.; Xu, L. Characterization of Intestinal Fungal Community Diversity in People Living with HIV/AIDS (PLWHA). AIDS Res. Ther. 2024, 21, 10. [Google Scholar] [CrossRef] [PubMed]
- Desjardins, A.E. Gibberella from A (venaceae) to Z (eae). Annu. Rev. Phytopathol. 2003, 41, 177–198. [Google Scholar] [CrossRef] [PubMed]
- Scherm, B.; Balmas, V.; Spanu, F.; Pani, G.; Delogu, G.; Pasquali, M.; Migheli, Q. Fusarium culmorum: Causal Agent of Foot and Root Rot and Head Blight on Wheat. Mol. Plant Pathol. 2013, 14, 323–341. [Google Scholar] [CrossRef] [PubMed]
- Gajęcka, M.; Majewski, M.S.; Zielonka, Ł.; Grzegorzewski, W.; Onyszek, E.; Lisieska-Żołnierczyk, S.; Juśkiewicz, J.; Babuchowski, A.; Gajęcki, M.T. Concentration of Zearalenone, Alpha-Zearalenol and Beta-Zearalenol in the Myocardium and the Results of Isometric Analyses of the Coronary Artery in Prepubertal Gilts. Toxins 2021, 13, 396. [Google Scholar] [CrossRef]
- Teunissen, M.J.; Op Den Camp, H.J.M. Anaerobic Fungi and Their Cellulolytic and Xylanolytic Enzymes. Antonie Leeuwenhoek 1993, 63, 63–76. [Google Scholar] [CrossRef] [PubMed]
- Stincone, A.; Prigione, A.; Cramer, T.; Wamelink, M.M.C.; Campbell, K.; Cheung, E.; Olin-Sandoval, V.; Grüning, N.; Krüger, A.; Tauqeer Alam, M.; et al. The Return of Metabolism: Biochemistry and Physiology of the Pentose Phosphate Pathway. Biol. Rev. 2015, 90, 927–963. [Google Scholar] [CrossRef]
- Adams, E.; Frank, L. Metabolism of Proline and the Hydroxyprolines. Annu. Rev. Biochem. 1980, 49, 1005–1061. [Google Scholar] [CrossRef] [PubMed]
- Geisen, S.; Mitchell, E.A.D.; Adl, S.; Bonkowski, M.; Dunthorn, M.; Ekelund, F.; Fernández, L.D.; Jousset, A.; Krashevska, V.; Singer, D.; et al. Soil Protists: A Fertile Frontier in Soil Biology Research. FEMS Microbiol. Rev. 2018, 42, 293–323. [Google Scholar] [CrossRef]
- Gile, G.H. Protist Symbionts of Termites: Diversity, Distribution, and Coevolution. Biol. Rev. 2024, 99, 622–652. [Google Scholar] [CrossRef]
- Henriquez, F.L.; Mooney, R.; Bandel, T.; Giammarini, E.; Zeroual, M.; Fiori, P.L.; Margarita, V.; Rappelli, P.; Dessì, D. Paradigms of Protist/Bacteria Symbioses Affecting Human Health: Acanthamoeba Species and Trichomonas Vaginalis. Front. Microbiol. 2021, 11, 616213. [Google Scholar] [CrossRef]
- Mattison, R.G.; Harayama, S. The Predatory Soil Flagellate Heteromita globosa Stimulates Toluene Biodegradation by a Pseudomonas sp. FEMS Microbiol. Lett. 2001, 194, 39–45. [Google Scholar] [CrossRef]
- Quispe-Rodríguez, G.H.; Wankewicz, A.A.; Luis Málaga Granda, J.; Lewis, B.; Stockert, K.; Clinton White, A. ‘Entamoeba Histolytica’ Identified by Stool Microscopy from Children with Acute Diarrhoea in Peru Is Not E. histolytica. Trop. Doct. 2020, 50, 19–22. [Google Scholar] [CrossRef]
- Burrell, A.; Tomley, F.M.; Vaughan, S.; Marugan-Hernandez, V. Life Cycle Stages, Specific Organelles and Invasion Mechanisms of Eimeria Species. Parasitology 2020, 147, 263–278. [Google Scholar] [CrossRef]
- Hardoim, P.R.; Van Overbeek, L.S.; Berg, G.; Pirttilä, A.M.; Compant, S.; Campisano, A.; Döring, M.; Sessitsch, A. The Hidden World within Plants: Ecological and Evolutionary Considerations for Defining Functioning of Microbial Endophytes. Microbiol. Mol. Biol. Rev. 2015, 79, 293–320. [Google Scholar] [CrossRef]
- Ley, R.E.; Hamady, M.; Lozupone, C.; Turnbaugh, P.J.; Ramey, R.R.; Bircher, J.S.; Schlegel, M.L.; Tucker, T.A.; Schrenzel, M.D.; Knight, R.; et al. Evolution of Mammals and Their Gut Microbes. Science 2008, 320, 1647–1651. [Google Scholar] [CrossRef]
- Azad, E.; Fehr, K.B.; Derakhshani, H.; Forster, R.; Acharya, S.; Khafipour, E.; McGeough, E.; McAllister, T.A. Interrelationships of Fiber-Associated Anaerobic Fungi and Bacterial Communities in the Rumen of Bloated Cattle Grazing Alfalfa. Microorganisms 2020, 8, 1543. [Google Scholar] [CrossRef]
- Tasnim, N.; Abulizi, N.; Pither, J.; Hart, M.M.; Gibson, D.L. Linking the Gut Microbial Ecosystem with the Environment: Does Gut Health Depend on Where We Live? Front. Microbiol. 2017, 8, 1935. [Google Scholar] [CrossRef]
- David, L.A.; Maurice, C.F.; Carmody, R.N.; Gootenberg, D.B.; Button, J.E.; Wolfe, B.E.; Ling, A.V.; Devlin, A.S.; Varma, Y.; Fischbach, M.A.; et al. Diet Rapidly and Reproducibly Alters the Human Gut Microbiome. Nature 2014, 505, 559–563. [Google Scholar] [CrossRef]
- Mishra, P.; Tulsani, N.J.; Jakhesara, S.J.; Dafale, N.A.; Patil, N.V.; Purohit, H.J.; Koringa, P.G.; Joshi, C.G. Exploring the Eukaryotic Diversity in Rumen of Indian Camel (Camelus dromedarius) Using 18S rRNA Amplicon Sequencing. Arch. Microbiol. 2020, 202, 1861–1872. [Google Scholar] [CrossRef] [PubMed]
- Zhang, M.; Zhang, Y.; Zhao, Z.; Deng, F.; Jiang, H.; Liu, C.; Li, Y.; Chai, J. Bacterial-Fungal Interactions: Mutualism, Antagonism, and Competition. Life 2025, 15, 1242. [Google Scholar] [CrossRef] [PubMed]
- Bhandari, R.; Wong, A.C.-N.; Lee, J.C.; Boyd, A.; Shelby, K.; Ringbauer, J.; Kang, D.S. Microbiome Composition and Co-Occurrence Dynamics in Wild Drosophila suzukii Are Influenced by Host Crop, Fly Sex, and Sampling Location. Microbiol. Spectr. 2025, 13, e02608-24. [Google Scholar] [CrossRef] [PubMed]
- Moraïs, S.; Winkler, S.; Zorea, A.; Levin, L.; Nagies, F.S.P.; Kapust, N.; Lamed, E.; Artan-Furman, A.; Bolam, D.N.; Yadav, M.P.; et al. Cryptic Diversity of Cellulose-Degrading Gut Bacteria in Industrialized Humans. Science 2024, 383, eadj9223. [Google Scholar] [CrossRef]
- Martínez-Romero, E.; Aguirre-Noyola, J.L.; Bustamante-Brito, R.; González-Román, P.; Hernández-Oaxaca, D.; Higareda-Alvear, V.; Montes-Carreto, L.M.; Martínez-Romero, J.C.; Rosenblueth, M.; Servín-Garcidueñas, L.E. We and Herbivores Eat Endophytes. Microb. Biotechnol. 2021, 14, 1282–1299. [Google Scholar] [CrossRef] [PubMed]
- Zhao, X.H.; Chen, Z.D.; Zhou, S.; Song, X.Z.; Ouyang, K.H.; Pan, K.; Xu, L.J.; Liu, C.J.; Qu, M.R. Effects of Daidzein on Performance, Serum Metabolites, Nutrient Digestibility, and Fecal Bacterial Community in Bull Calves. Anim. Feed Sci. Technol. 2017, 225, 87–96. [Google Scholar] [CrossRef]
- Pitta, D.W.; Kumar, S.; Veiccharelli, B.; Parmar, N.; Reddy, B.; Joshi, C.G. Bacterial Diversity Associated with Feeding Dry Forage at Different Dietary Concentrations in the Rumen Contents of Mehshana Buffalo (Bubalus bubalis) Using 16S Pyrotags. Anaerobe 2014, 25, 31–41. [Google Scholar] [CrossRef] [PubMed]
- Barko, P.C.; McMichael, M.A.; Swanson, K.S.; Williams, D.A. The Gastrointestinal Microbiome: A Review. J. Vet. Intern. Med. 2018, 32, 9–25. [Google Scholar] [CrossRef]
Disclaimer/Publisher’s Note: The statements, opinions and data contained in all publications are solely those of the individual author(s) and contributor(s) and not of MDPI and/or the editor(s). MDPI and/or the editor(s) disclaim responsibility for any injury to people or property resulting from any ideas, methods, instructions or products referred to in the content. |
© 2025 by the authors. Licensee MDPI, Basel, Switzerland. This article is an open access article distributed under the terms and conditions of the Creative Commons Attribution (CC BY) license.