
In Situ Degradation Kinetics of 25 Feedstuffs and the Selection of Time Points in Mathematical Statistics

Abstract
Simple Summary
Abstract
1. Introduction
2. Materials and Methods
2.1. Animals and Diets
2.2. Samples Preparation and Nutrient Analysis
2.3. In Situ Nylon Bag Experiment
2.4. Calculations of Degradation Kinetics Parameters
2.5. Reasonable Criteria for Selection
2.6. Statistical Analyses
3. Results
3.1. The Parameters a, b, c and ED of DM, CP and OM of the Feedstuff
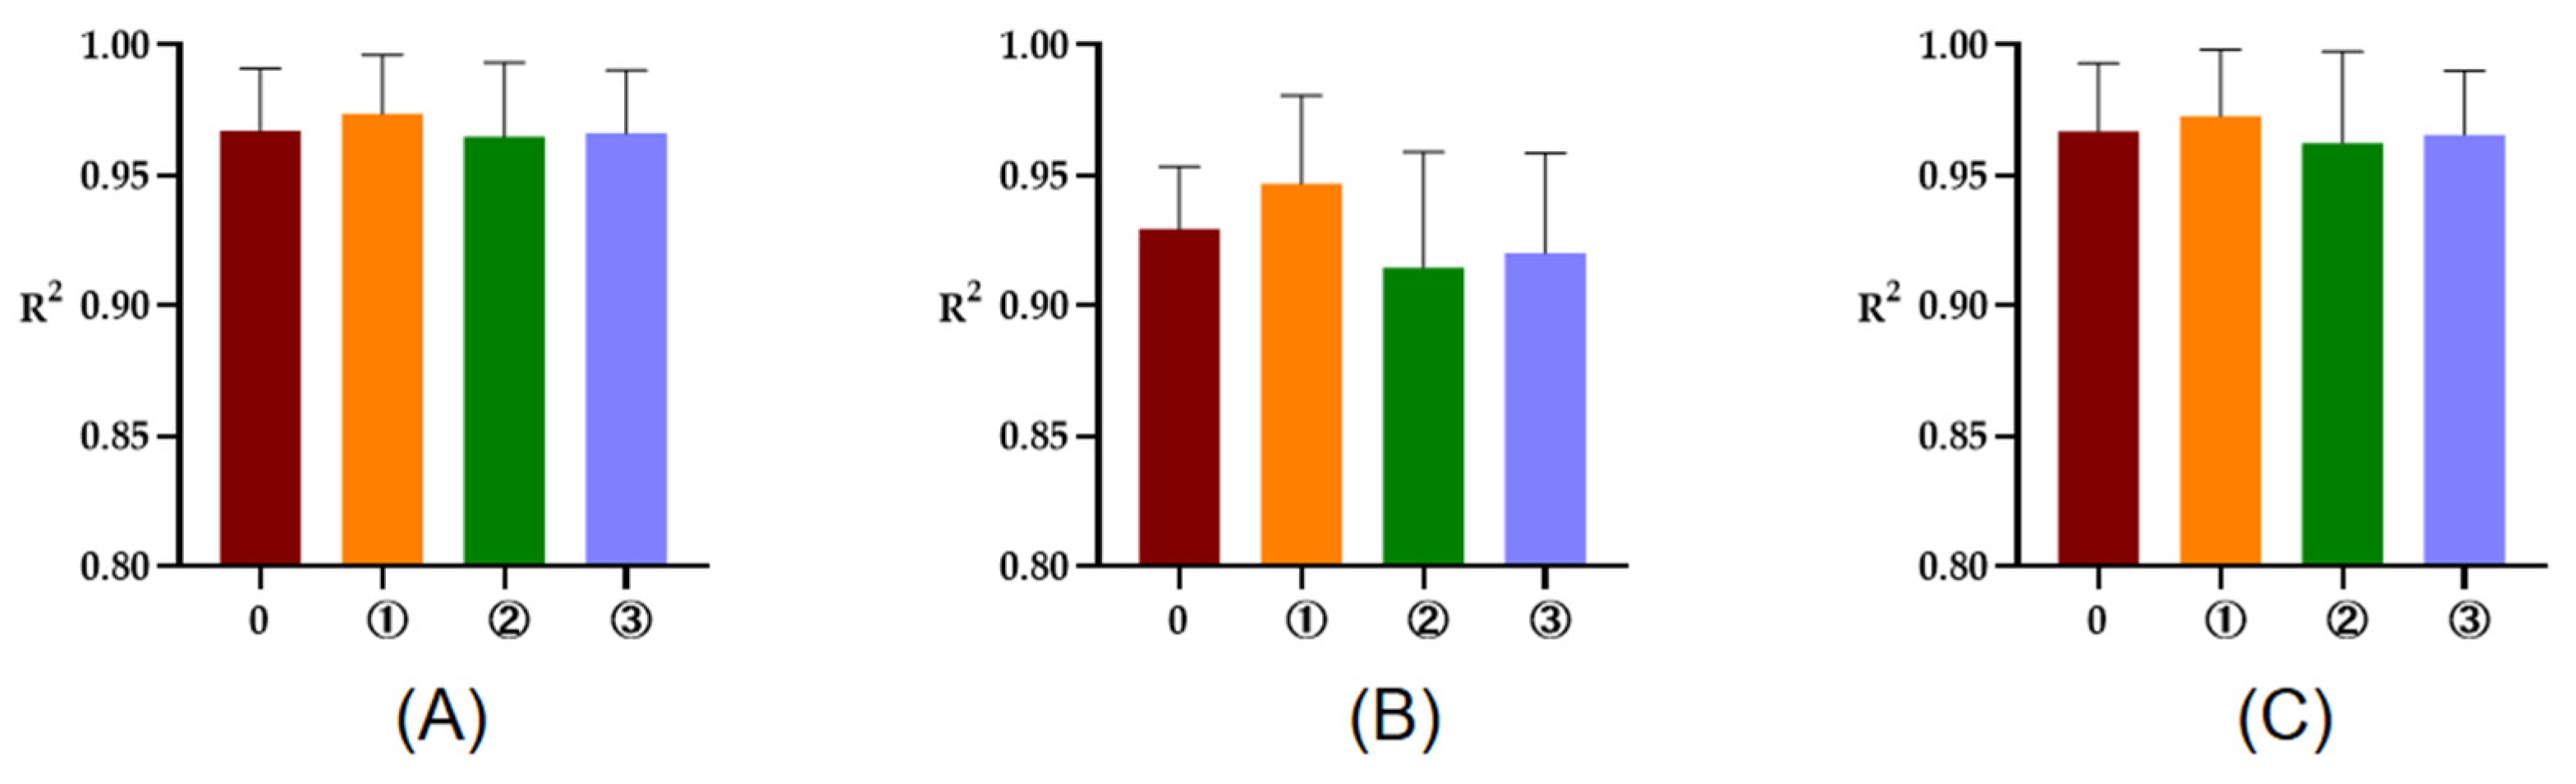
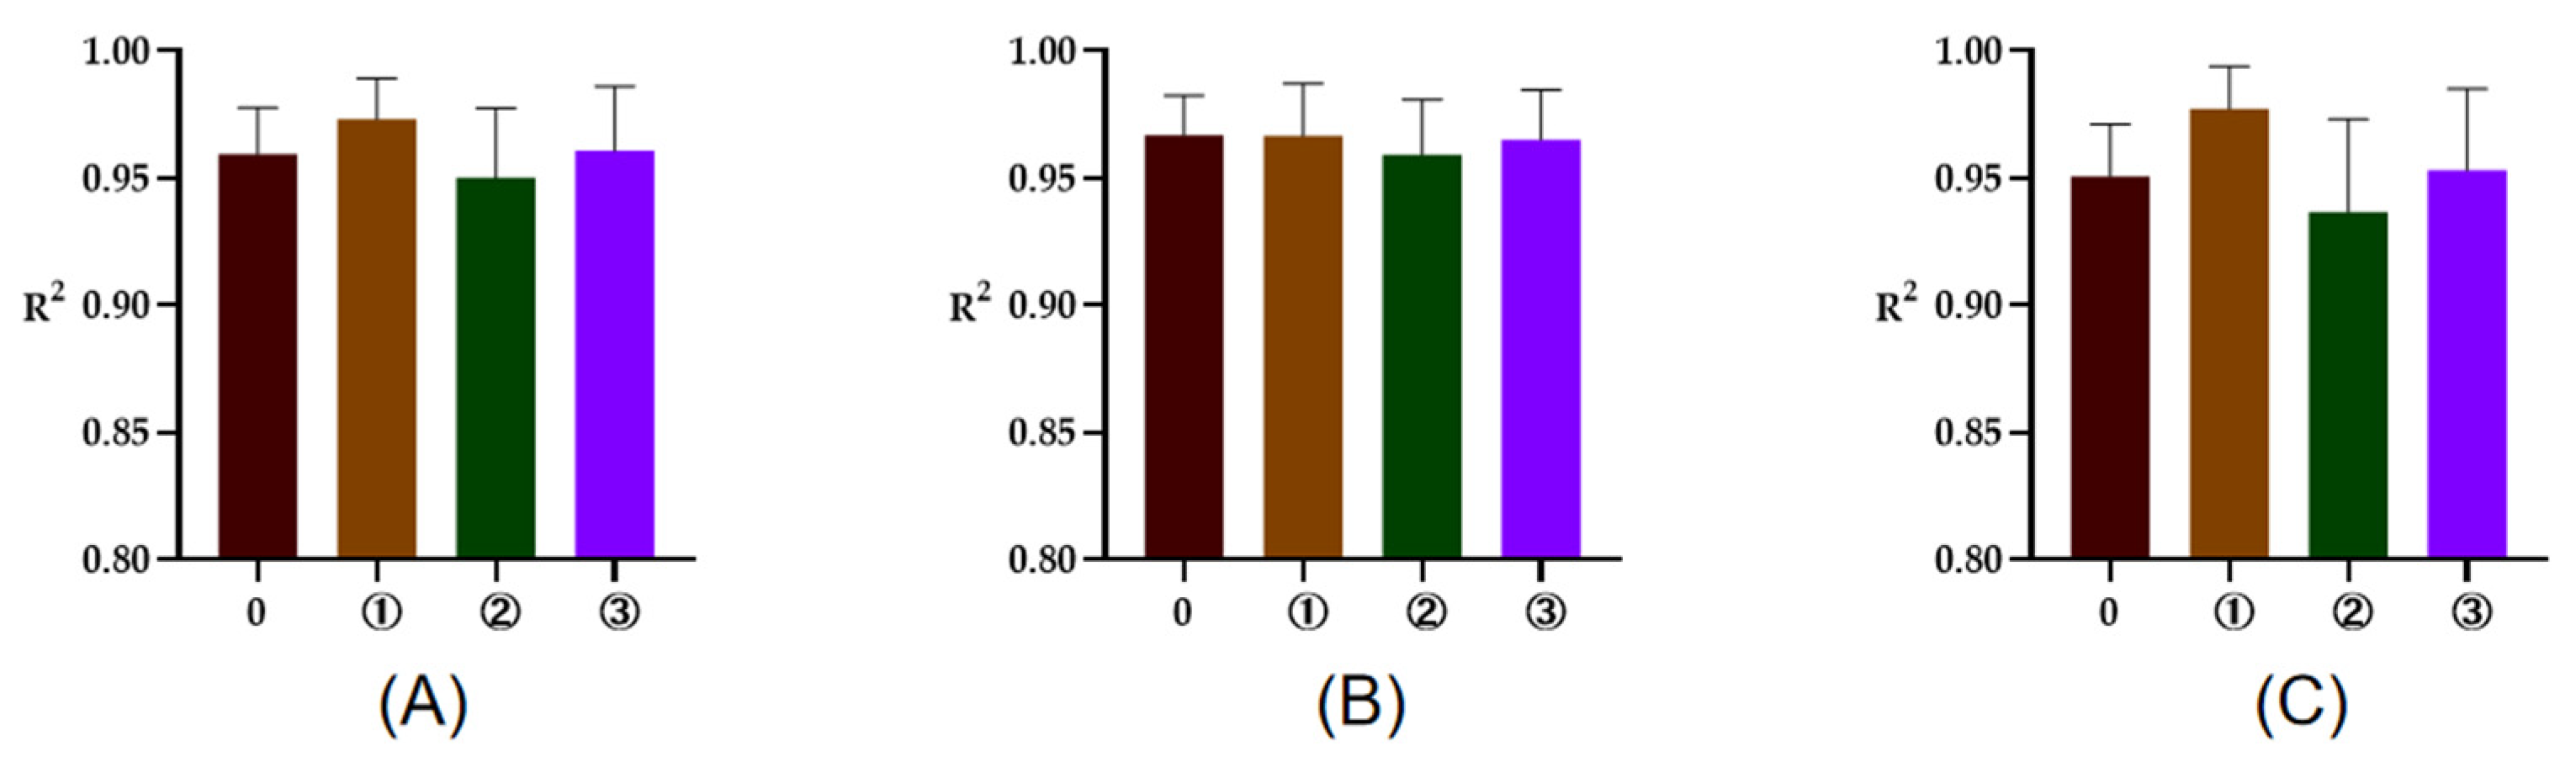
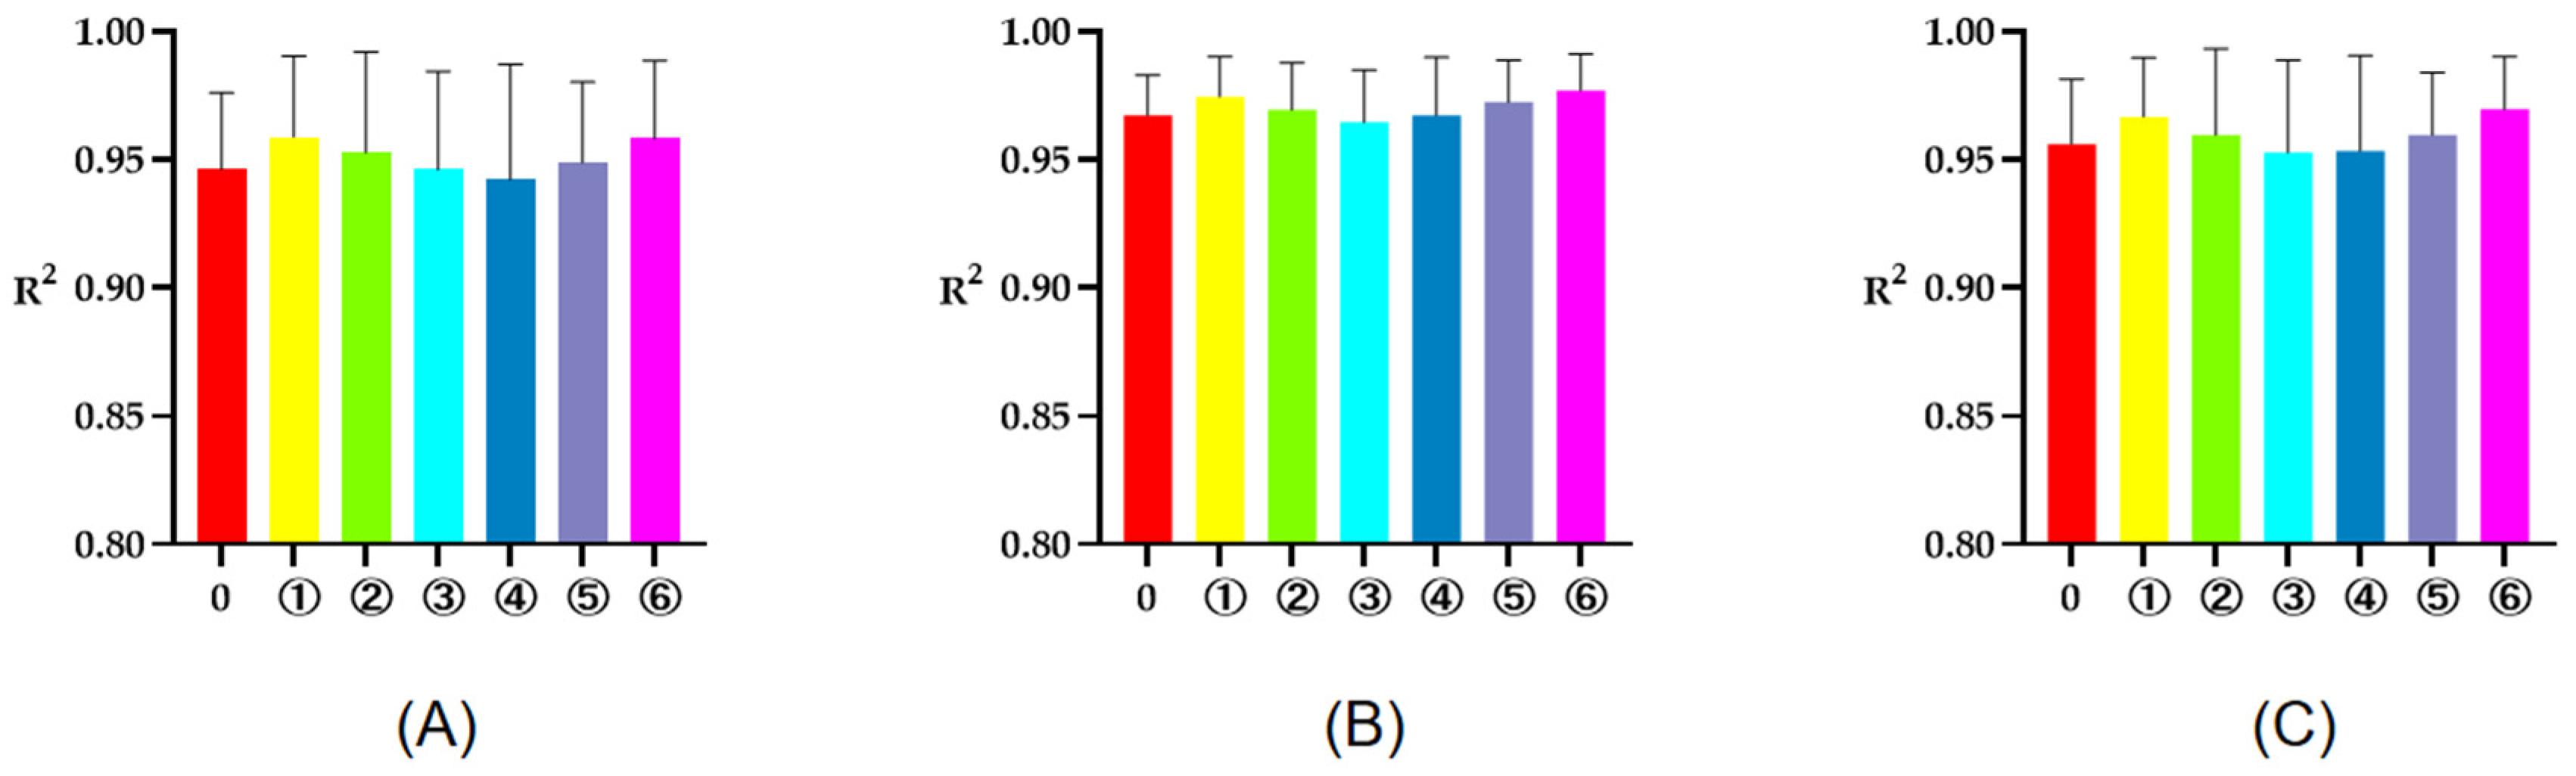
3.2. The R2 of Fitted Curves of DM, CP, and OM Obtained at Different Time Points
4. Discussion
5. Conclusions
Author Contributions
Funding
Institutional Review Board Statement
Informed Consent Statement
Data Availability Statement
Conflicts of Interest
Abbreviations
References
- AFRC. Nutritive requirements of ruminant animals: Protein. Nutr. Abstr. Rev. 1992, 62, 787–835. [Google Scholar]
- Madsen, J.; Hvelplund, T. Prediction of in-situ protein degradability in the rumen-results of a European ringtest. Livest. Prod. Sci. 1994, 39, 201–212. [Google Scholar] [CrossRef]
- Ørskov, E.R. Protein Nutrition in Ruminants; Academic Press Inc.: San Diego, CA, USA, 1982. [Google Scholar]
- Lindberg, J.E. Estimation of rumen degradability of feed proteins with the in sacco technique and various in vitro methods. A review. Acta Agric. Scand. Sect. A-Anim. Sci. Suppl. 1985, 25, 64–97. [Google Scholar]
- Michalet-Doreau, B.; Cerneau, P. Influence of foodstuff partice-size on in situ degradation of nitrogen in the rumen. Anim. Feed Sci. Technol. 1991, 35, 69–81. [Google Scholar] [CrossRef]
- Vanzant, E.S.; Cochran, R.C.; Titgemeyer, E.C. Standardization of in situ techniques for ruminant feedstuff evaluation. J. Anim. Sci. 1998, 76, 2717–2729. [Google Scholar] [CrossRef]
- Seradj, A.R.; Morazán Nuñez, H.J.; Fondevila, M.; Liang, J.B.; de la Fuente Oliver, G.; Balcells Terés, J. In Vitro and In Situ Degradation Characteristics and Rumen Fermentation Products of Moringa oleifera Harvested at Three Different Ages. Trop. Anim. Sci. J. 2019, 42, 39–45. [Google Scholar] [CrossRef]
- Tao, L.; Zhang, L.-X.; -Tu, Y.; Zhang, N.-F.; Si, B.-W.; Ma, T.; Diao, Q.-Y. Improving the in situ ruminal degradability of maize stalk using fungal inoculants in dorper × thin-tailed han crossbred ewes. Small Ruminant Res. 2016, 144, 119–125. [Google Scholar] [CrossRef]
- Ghorbani, B.; Teimouri, Y.A.; Jafari, S.A. Effects of sesame meal on intake, digestibility, rumen characteristics, chewing activity and growth of lambs. S. Afr. J. Anim. Sci. 2018, 48, 151. [Google Scholar] [CrossRef]
- Diao, X.; Dang, S.; Liu, S.; Jing, L.; Wang, Y.; Zhang, W. Determination of the appropriate ratio of sample size to nylon bag area for in situ nylon bag technique evaluation of rumen digestibility of feedstuffs in sheep. Livest. Sci. 2020, 241, 104254. [Google Scholar] [CrossRef]
- Rjiba-Ktita, S.; Chermiti, A.; Bodas, R.; France, J.; López, S. Aquatic plants and macroalgae as potential feed ingredients in ruminant diets. J. Appl. Phycol. 2017, 29, 449–458. [Google Scholar] [CrossRef]
- Harahap, M.A.; Nuswantara, L.K.; Pangestu, E.; Wahyono, F.; Achmadi, J. Nitrogen degradation of the limestone-urea mixtures in the rumen of goats. J. Indones. Trop. Anim. Agric. 2018, 43, 282–288. [Google Scholar] [CrossRef]
- Palangi, V.; Macit, M. In situ crude protein and dry matter ruminal degradability of heat-treated barley. Rev. Med. Vét. 2019, 170, 123–128. [Google Scholar]
- Vahidi, M.F.; Gharechahi, J.; Behmanesh, M.; Ding, X.Z.; Han, J.L.; Salekdeh, G.H. Diversity of microbes colonizing forages of varying lignocellulose properties in the sheep rumen. PeerJ 2021, 8, e10463. [Google Scholar] [CrossRef]
- Jiang, B.; Zhou, Y.; Wang, T.; Li, F. Nutritive value and ruminal degradation of seven Chinese herbs as forage for Tan sheep. Bioengineered 2020, 11, 1159–1169. [Google Scholar] [CrossRef]
- Passetti, R.A.; Passetti, L.C.; Gruninger, R.J.; Ribeiro, G.O.; Milani, M.R.M.; Prado, I.N.; McAllister, T.A. Effect of ammonia fibre expansion (AFEX) treatment of rice straw on in situ digestibility, microbial colonization, acetamide levels and growth performance of lambs. Anim. Feed Sci. Technol. 2020, 261, 114411. [Google Scholar] [CrossRef]
- Association of Official Analytical Chemists (AOAC). Official Methods of Analysis, 16th ed.; AOAC International: Washington, DC, USA, 1997. [Google Scholar]
- Van Soest, P.V.; Robertson, J.B.; Lewis, B.A. Methods for dietary fiber, neutral detergent fiber, and nonstarch polysaccharides in relation to animal nutrition. J. Dairy Sci. 1991, 74, 3583–3597. [Google Scholar] [CrossRef]
- Mehrez, A.Z.; Ørskov, E.R.; McDonald, I. Rates of rumen fermentation in relation to ammonia concentration. Br. J. Nutr. 1977, 38, 437–443. [Google Scholar] [CrossRef] [PubMed]
- Lopez, S.; Khalil, M.S. In situ degradability of soyabean meal treated with Acacia saligna and Atriplex halimus extracts in sheep. J. Anim. Feed Sci. 2012, 21, 447–457. [Google Scholar]
- Ørskov, E.R.; Mcdonald, I. The estimation of protein degradability in the rumen from incubation measurements weighted according to rate of passage. J. Agric. Sci. 1979, 92, 499–503. [Google Scholar] [CrossRef]
- Promkot, C.; Wanapat, M.; Rowlinson, P. Estimation of ruminal degradation and intestinal digestion of tropical protein resources using the nylon bag technique and the three-step in vitro procedure in dairy cattle on rice straw diets. Asian Australas. J. Anim. Sci. 2007, 20, 1849–1857. [Google Scholar] [CrossRef]
- Messman, M.A.; Weiss, W.P.; Koch, M.E. Changes in total and individual proteins during drying, ensiling, and ruminal fermentation of forages. J. Dairy Sci. 1994, 77, 492–500. [Google Scholar] [CrossRef] [PubMed]


| Items | Bag | Repliacation | Incubation Conditions | |||||||
|---|---|---|---|---|---|---|---|---|---|---|
| Diet | Feeding Level | Material | Pore Size | Sample Grind Size | Animal | Number of Animals | Number of Bags | Number of Times | Times | |
| A.R.Seradj [7] | — | ad libitum | Dacron bags | 45 μm | — | Rasa Aragonesa ewes | 4 | 1 | 5 | 4, 8, 12, 24, 48 h (Moringa oleifera) |
| L.Tao [8] | — | — | — | — | — | Hancrossbred ewes | 6 | — | 5 | 6, 12, 24, 48, 72 h (roughages) |
| B.Ghorbani [9] | — | maintenance level | polyamide | 40 ± 10 μm | — | Zel ewes | 3 | 4 | — | 1, 3, 6, 12, 24, 36, 48, 72, 96 h (sesame meal, soybean meal) |
| Xiaogao Diao [10] | 70:30 | maintenance | nylon cloth | 48 μm | 2.5 mm (roughages) | Yunnan semi-fine wool sheep | 4 | 2 | 7 | 2, 4, 8, 16, 24, 36, 48 h (72 for roughages) |
| S.Rjiba-Ktita [11] | — | ad libitum | — | 50 μm | 3 mm | Barbarine rams | 4 | 2 | 6 | 3, 6, 24, 48, 72, 96 (seagrass, macroalgae, barley grain and barley grass) |
| M.A.Harahap [12] | — | maintenance level | — | 46 μm | — | local Ettawah cross bred goats | 2 | 3 | 7 | 0.75, 1.5, 3, 6, 12, 24, 48 |
| V.Palangi [13] | 60:40 | — | polyester mesh bag | 47 μm | 2 mm | Ghezel sheep | 3 | 2 | 7 | 0, 4, 8, 16, 24, 36, 48 h (barley) |
| Mohammad Farhad Vahidi [14] | 70:30 | ad libitum | heat-sealed nylon bag | 50 μm | 2 mm | Shal sheep | 3 | 2 | 5 | 0, 24, 48, 72, 96 h (lignocellulosic forages) |
| Biwei Jiang [15] | — | ad libitum | — | — | 40 mesh (roughages) | tan sheep | 3 | 2 | 7 | 3, 6, 12, 24, 36, 48, 72 h (roughages) |
| Rodrigo A.C. Passetti [16] | — | — | R1020 | 50 μm | 4 mm (roughages) | ewe lambs | 3 | — | 9 | 1, 3, 6, 12, 24, 36, 48, 72, 120 h (roughages) |
| Items | OM (%) | CP (%) | Fat (%) | ADF (%) | NDF (%) | |
|---|---|---|---|---|---|---|
| RSM | 92.44 | 38.01 | 11.56 | 44.85 | 58.88 | |
| CSM | 93.04 | 50.01 | 0.70 | 12.08 | 22.32 | |
| protein feeds | CGM | 98.88 | 65.05 | 0.59 | 10.33 | 40.21 |
| ES | 94.66 | 39.62 | 23.51 | 11.88 | 24.63 | |
| DDGS | 95.02 | 28.70 | 10.85 | 18.00 | 41.83 | |
| SOM | 93.18 | 49.77 | 1.60 | 10.38 | 18.68 | |
| BR | 99.12 | 12.42 | 1.12 | 2.19 | 4.69 | |
| BY | 98.62 | 13.84 | 0.71 | 3.70 | 27.55 | |
| WT | 98.02 | 13.45 | 1.52 | 3.65 | 12.73 | |
| HS | 98.39 | 10.92 | 2.91 | 6.40 | 14.56 | |
| energy feeds | HY9 | 98.78 | 8.17 | 3.05 | 4.65 | 12.14 |
| GWC | 98.24 | 10.44 | 4.93 | 1.22 | 7.72 | |
| YC | 98.60 | 9.31 | 3.16 | 3.41 | 9.69 | |
| YWB | 94.03 | 17.95 | 3.71 | 13.92 | 44.61 | |
| CBS | 96.43 | 18.68 | 1.98 | 17.32 | 59.80 | |
| WS | 91.75 | 9.31 | 2.13 | 40.07 | 70.26 | |
| RG | 88.12 | 9.90 | 1.73 | 33.48 | 56.80 | |
| RSW | 86.62 | 12.44 | 1.43 | 33.47 | 45.84 | |
| BS | 91.24 | 14.33 | 2.36 | 32.61 | 52.69 | |
| roughages | SS | 89.88 | 12.87 | 1.44 | 35.21 | 48.35 |
| CWR | 93.08 | 10.15 | 0.70 | 44.66 | 72.33 | |
| RS | 94.91 | 15.99 | 2.57 | 38.99 | 66.39 | |
| OG | 88.93 | 16.92 | 1.85 | 34.82 | 63.96 | |
| CS | 95.46 | 10.33 | 3.42 | 27.35 | 47.13 | |
| TP | 92.32 | 17.23 | 0.91 | 19.08 | 26.93 | |
| DM | CP | OM | |||||||||||
|---|---|---|---|---|---|---|---|---|---|---|---|---|---|
| a | b | c | ED | a | b | c | ED | a | b | c | ED | ||
| 0 | 24.31 | 29.34 | 0.055 | 39.39 | 9.75 | 40.12 ab | 0.089 a | 35.11 | 22.44 | 31.48 | 0.054 b | 39.93 | |
| RSM | ① | 22.70 | 31.51 | 0.050 | 38.52 | 11.83 | 41.31 a | 0.057 b | 33.89 | 20.44 | 30.24 | 0.089 a | 39.81 |
| ② | 23.24 | 30.38 | 0.056 | 39.22 | 12.13 | 37.48 b | 0.087 a | 35.92 | 20.68 | 31.59 | 0.080 a | 40.07 | |
| ③ | 23.48 | 29.62 | 0.055 | 39.00 | 10.59 | 38.65 ab | 0.100 a | 36.31 | 20.10 | 30.83 | 0.090 a | 39.91 | |
| 0 | 15.44 | 54.74 | 0.064 | 46.12 | 10.94 c | 66.86 | 0.056 a | 46.02 | 13.21 b | 54.03 | 0.072 | 45.10 | |
| CSM | ① | 16.60 | 54.33 | 0.060 | 46.23 | 16.32 a | 66.82 | 0.042 b | 46.75 | 16.95 a | 53.30 | 0.058 | 45.62 |
| ② | 16.50 | 53.73 | 0.060 | 45.81 | 16.59 a | 64.53 | 0.042 b | 45.93 | 16.94 a | 52.53 | 0.059 | 45.31 | |
| ③ | 15.94 | 55.10 | 0.061 | 46.29 | 14.47 b | 66.28 | 0.049 ab | 47.34 | 16.37 a | 53.79 | 0.060 | 45.78 | |
| 0 | 16.72 a | 39.79 | 0.076 | 42.67 | 8.58 a | 67.30 a | 0.023 | 42.67 a | 16.82 a | 40.98 | 0.072 | 42.98 | |
| CGM | ① | 14.07 ab | 41.59 | 0.084 | 42.23 | 8.84 ab | 63.78 b | 0.024 | 32.79 b | 14.35 b | 42.49 | 0.078 | 42.51 |
| ② | 13.99 ab | 41.12 | 0.091 | 42.60 | 7.91 b | 66.22 ab | 0.024 | 32.72 b | 14.42 b | 42.08 | 0.084 | 42.98 | |
| ③ | 13.67 b | 41.53 | 0.093 | 42.76 | 10.15 a | 52.16 c | 0.033 | 33.64 b | 14.19 b | 42.00 | 0.087 | 42.95 | |
| 0 | 25.71 | 68.69 | 0.043 | 60.62 | 16.81 | 67.72 a | 0.034 | 60.62 a | 24.23 | 67.95 a | 0.047 | 57.46 | |
| ES | ① | 23.81 | 68.53 | 0.046 | 56.68 | 16.37 | 68.29 a | 0.032 | 43.17 b | 23.79 | 67.12 ab | 0.049 | 56.94 |
| ② | 24.13 | 66.27 | 0.047 | 56.17 | 17.72 | 63.71 b | 0.033 | 42.86 b | 23.80 | 65.63 b | 0.049 | 56.22 | |
| ③ | 23.58 | 68.48 | 0.047 | 56.76 | 16.35 | 64.64 b | 0.037 | 43.84 b | 23.49 | 67.98 a | 0.048 | 56.68 | |
| 0 | 26.44 b | 50.96 a | 0.039 | 50.90 | 12.35 | 38.83 b | 0.036 | 30.79 | 24.74 bc | 57.60 a | 0.037 | 50.73 ab | |
| DDGS | ① | 29.45 a | 50.19 ab | 0.031 | 51.55 | 13.07 | 36.07 c | 0.040 | 31.17 | 29.45 a | 50.19 bc | 0.031 | 51.55 a |
| ② | 29.56 a | 49.70 ab | 0.030 | 50.77 | 12.34 | 37.30 bc | 0.037 | 30.34 | 26.46 b | 49.03 c | 0.035 | 49.44 b | |
| ③ | 27.80 ab | 47.88 c | 0.040 | 51.83 | 12.93 | 41.88 a | 0.028 | 30.31 | 23.72 c | 51.28 b | 0.047 | 51.54 a | |
| 0 | 30.45 | 63.41 a | 0.037 | 57.23 | 14.23 ab | 76.13 b | 0.032 | 43.63 | 29.48 | 64.83 | 0.033 | 55.28 | |
| SOM | ① | 30.60 | 62.65 ab | 0.037 | 57.33 | 16.08 a | 70.67 c | 0.034 | 44.68 | 28.97 | 65.33 | 0.029 | 55.09 |
| ② | 30.79 | 61.38 b | 0.037 | 56.81 | 13.88 b | 77.35 b | 0.032 | 43.95 | 29.29 | 64.19 | 0.033 | 55.00 | |
| ③ | 29.85 | 62.08 ab | 0.040 | 57.44 | 15.30 ab | 82.39 a | 0.026 | 43.20 | 28.70 | 63.55 | 0.036 | 55.35 | |
| DM | CP | OM | |||||||||||
|---|---|---|---|---|---|---|---|---|---|---|---|---|---|
| a | b | c | ED | a | b | c | ED | a | b | c | ED | ||
| 0 | 13.13 a | 78.86 ab | 0.046 | 50.97 | 9.86 a | 81.21 b | 0.045 | 48.46 | 13.34 a | 79.31 | 0.045 | 50.69 | |
| BR | ① | 11.77 ab | 78.02 b | 0.050 | 50.94 | 8.07 ab | 81.98 ab | 0.048 | 48.01 | 11.65 ab | 79.18 | 0.048 | 50.43 |
| ② | 11.00 b | 80.29 a | 0.048 | 50.37 | 7.93 b | 81.97 ab | 0.047 | 47.73 | 11.22 b | 79.77 | 0.047 | 49.79 | |
| ③ | 10.17 b | 80.00 a | 0.051 | 50.72 | 8.78 ab | 83.35 a | 0.043 | 47.41 | 10.62 b | 80.59 | 0.048 | 50.22 | |
| 0 | 33.95 a | 62.97 c | 0.086 | 73.62 a | 18.2 a | 74.88 c | 0.061 | 58.84 | 33.86 a | 63.12 c | 0.088 | 73.83 a | |
| BY | ① | 27.90 c | 67.06 b | 0.109 | 73.91 a | 14.87 b | 78.89 a | 0.058 | 57.30 | 27.68 b | 67.34 b | 0.111 | 74.13 a |
| ② | 28.76 c | 68.66 ab | 0.085 | 72.05 ab | 15.47 b | 76.71 b | 0.062 | 57.90 | 28.67 b | 68.81 ab | 0.086 | 72.24 ab | |
| ③ | 28.10 c | 69.45a | 0.088 | 72.35 a | 14.8 b | 77.38 ab | 0.064 | 58.27 | 28.00 b | 69.64 a | 0.089 | 72.55 a | |
| 0 | 37.43 a | 55.96 c | 0.089 | 73.23 | 20.81 a | 73.66 d | 0.078 ab | 65.48 a | 40.14 a | 51.76 d | 0.102 a | 74.75 a | |
| WT | ① | 34.18 b | 60.60 a | 0.079 | 71.36 | 14.90 b | 82.51 a | 0.068 b | 62.30 b | 34.32 b | 60.42 a | 0.079 c | 71.27 c |
| ② | 34.36 b | 60.10 a | 0.087 | 72.46 | 15.61 b | 79.91 b | 0.077 ab | 64.03 ab | 34.18 b | 58.86 bc | 0.095 ab | 72.70 bc | |
| ③ | 35.08 b | 58.22 b | 0.086 | 71.82 | 15.69 b | 79.05b c | 0.078 ab | 63.79 ab | 34.43 b | 58.20 c | 0.094 ab | 72.48 bc | |
| 0 | 9.73 b | 83.32 b | 0.040 | 46.48 b | 11.67 a | 78.98 b | 0.041 | 46.43 ab | 14.98 b | 80.31 a | 0.037 | 49.12 | |
| HS | ① | 10.22 a | 77.75 c | 0.049 | 48.50 a | 8.00 c | 83.41 a | 0.039 | 44.71 b | 17.92 a | 73.07 b | 0.041 | 50.84 |
| ② | 7.48 b | 86.21 a | 0.043 | 47.14 ab | 9.97 ab | 77.21 b | 0.043 | 45.53 ab | 15.28 b | 80.87 a | 0.037 | 49.40 | |
| ③ | 8.75 ab | 86.00 a | 0.039 | 46.33 b | 9.84 ab | 78.62 b | 0.042 | 45.82 ab | 15.53 b | 80.38 a | 0.036 | 49.23 | |
| 0 | 16.39 a | 79.85 a | 0.036 ab | 49.77 a | 23.28 a | 72.2 ab | 0.026 | 47.76 | 12.80 b | 71.24 ab | 0.055 ab | 50.14 bc | |
| HY9 | ① | 14.36 bc | 72.30 c | 0.043 ab | 47.71 bc | 21.11 b | 73.8 a | 0.026 | 46.48 | 15.47 a | 63.45 d | 0.072 a | 52.96 a |
| ② | 13.55 cd | 74.14 b | 0.041 ab | 47.04 bc | 21.74 ab | 71.59 b | 0.027 | 47.02 | 12.96 b | 72.66 a | 0.054 ab | 50.69 b | |
| ③ | 15.61 ab | 80.55 a | 0.030 b | 46.07 c | 21.33 b | 67.9 c | 0.031 | 47.11 | 13.35 b | 70.72 c | 0.054 ab | 50.20 bc | |
| 0 | 36.72 a | 57.9 a | 0.038 | 61.80 a | 31.42 | 51.57 c | 0.040 | 54.15 | 27.28 ab | 65.48 b | 0.044 a | 57.54 ab | |
| GWC | ① | 29.67 b | 53.37 b | 0.051 | 56.67 b | 29.78 | 55.06 a | 0.037 | 53.23 | 26.13 b | 66.57 b | 0.043 a | 57.06 ab |
| ② | 30.29 b | 50.97 c | 0.055 | 56.97 b | 30.07 | 54.48 ab | 0.038 | 53.67 | 26.41 b | 66.03 b | 0.044 a | 57.35 ab | |
| ③ | 29.73 b | 51.88 bc | 0.057 | 57.37 b | 29.71 | 52.87 bc | 0.042 | 53.72 | 28.46 a | 69.73 a | 0.033 b | 56.39 b | |
| 0 | 29.07 a | 57.05 b | 0.033 | 51.62 | 27.70 | 30.84 | 0.057 a | 44.03 | 26.51 | 71.58 a | 0.033 | 54.57 | |
| YC | ① | 25.79 b | 60.54 a | 0.034 | 50.21 | 27.52 | 31.07 | 0.056 a | 43.91 | 24.77 | 71.77 a | 0.034 | 53.92 |
| ② | 27.12 b | 56.58 b | 0.036 | 50.96 | 27.59 | 31.08 | 0.056 a | 44.05 | 25.00 | 71.22 ab | 0.035 | 54.23 | |
| ③ | 26.91 b | 56.34 b | 0.038 | 51.09 | 28.57 | 30.90 | 0.047 b | 43.54 | 24.71 | 69.61 b | 0.037 | 54.27 | |
| 0 | 32.86 | 43.82 b | 0.053 ab | 77.20 a | 29.42 a | 58.34 b | 0.151 | 75.70 | 25.85 | 44.2 ab | 0.077 ab | 54.54 | |
| ① | 32.30 | 46.91 a | 0.038 b | 55.03 b | 24.8 b | 62.34 a | 0.185 | 76.09 | 26.64 | 45.27 a | 0.059 b | 53.59 | |
| YWB | ② | 34.45 | 39.63 c | 0.047 ab | 55.86 b | 29.44 a | 59.52 b | 0.138 | 75.62 | 27.27 | 41.83 c | 0.073 ab | 54.36 |
| ③ | 32.47 | 40.33 c | 0.060 a | 56.76 b | 28.98 a | 58.42 b | 0.147 | 74.90 | 25.98 | 43.51 abc | 0.080 a | 55.06 | |
| 0 | 18.54 a | 49.17 a | 0.038 ab | 39.40 b | 31.89 | 50.31 a | 0.026 | 48.56 b | 18.07 a | 50.02 a | 0.036 ab | 38.82 b | |
| CBS | ① | 18.13 a | 47.81 ab | 0.040 ab | 42.06 a | 29.91 | 49.68 a | 0.031 | 51.51 a | 17.60 ab | 49.02 ab | 0.038 ab | 41.48 a |
| ② | 17.90 ab | 48.31 ab | 0.039 ab | 41.78 a | 30.82 | 46.97 b | 0.033 | 51.98 a | 17.49 ab | 49.23 ab | 0.037 ab | 41.28 a | |
| ③ | 16.10 b | 47.16 b | 0.051 a | 42.56 a | 30.91 | 47.06 b | 0.032 | 51.93 a | 15.80 b | 47.63 b | 0.049 a | 41.96 a | |
| DM | CP | OM | |||||||||||
|---|---|---|---|---|---|---|---|---|---|---|---|---|---|
| a | b | c | ED | a | b | c | ED | a | b | c | ED | ||
| WS | 0 | 7.30 a | 39.02 | 0.035 | 27.28 | 11.35 ab | 42.33 | 0.020 | 27.77 | 6.19 a | 40.02 a | 0.034 | 26.55 |
| ① | 6.13 ab | 37.37 | 0.042 | 27.43 | 9.56 b | 42.19 | 0.023 | 27.26 | 5.42 ab | 37.86 b | 0.041 | 26.86 | |
| ② | 6.71 a | 38.12 | 0.037 | 27.23 | 9.63 ab | 42.89 | 0.022 | 27.21 | 6.13 a | 38.71 ab | 0.035 | 26.62 | |
| ③ | 6.64 a | 39.24 | 0.036 | 27.46 | 9.88 ab | 42.72 | 0.021 | 27.10 | 5.98 a | 39.78 ab | 0.035 | 26.83 | |
| ④ | 6.13 ab | 37.37 | 0.042 | 27.43 | 9.56 b | 42.19 | 0.023 | 27.26 | 5.42 ab | 37.86 b | 0.041 | 26.86 | |
| ⑤ | 5.60 ab | 38.71 | 0.043 | 27.93 | 11.55 a | 41.15 | 0.020 | 27.76 | 4.54 ab | 39.61 ab | 0.042 | 27.21 | |
| ⑥ | 4.60 b | 38.09 | 0.049 | 27.85 | 11.03 ab | 40.02 | 0.023 | 27.95 | 3.75 b | 38.87 ab | 0.047 | 27.11 | |
| RG | 0 | 18.48 | 56.82 | 0.040 | 50.18 | 26.11 a | 40.04 b | 0.044 | 49.34 | 14.88 ab | 59.57 a | 0.039 | 47.63 |
| ① | 19.50 | 55.45 | 0.040 | 50.39 | 20.35 b | 44.50 a | 0.054 | 48.53 | 16.38 a | 58.15 ab | 0.037 | 47.84 | |
| ② | 18.82 | 55.78 | 0.042 | 50.64 | 19.89 b | 45.29 a | 0.055 | 48.72 | 15.1 ab | 58.46 ab | 0.041 | 48.31 | |
| ③ | 19.48 | 55.03 | 0.040 | 50.34 | 20.59 b | 45.19 a | 0.052 | 48.66 | 16.24 a | 57.22 b | 0.039 | 47.79 | |
| ④ | 18.00 | 56.66 | 0.042 | 50.36 | 20.02 b | 46.25 a | 0.054 | 49.30 | 14.01 b | 59.59 a | 0.041 | 47.90 | |
| ⑤ | 18.95 | 55.97 | 0.039 | 49.99 | 20.47 b | 44.94 a | 0.054 | 48.96 | 15.79 ab | 58.61 ab | 0.036 | 47.22 | |
| ⑥ | 17.90 | 56.73 | 0.042 | 50.39 | 18.82 b | 45.88 a | 0.061 | 49.16 | 14.05 b | 59.72 a | 0.041 | 47.91 | |
| RSW | 0 | 18.69 e | 80.71 a | 0.072 a | 66.14 a | 22.54 b | 55.64 a | 0.056 | 57.88 | 25.77 a | 54.86 d | 0.090 a | 66.79 a |
| ① | 22.16 d | 59.13 b | 0.056 ab | 59.97 b | 22.95 ab | 55.66 a | 0.051 | 57.48 | 21.51 de | 61.29 a | 0.052 b | 59.72 b | |
| ② | 25.13 bc | 56.54 c | 0.046 b | 58.61 b | 22.90 b | 55.14 abc | 0.053 | 57.48 | 22.16 cde | 59.72 ab | 0.052 b | 59.40 b | |
| ③ | 23.47 cd | 57.98 bc | 0.051 b | 59.25 b | 22.42 b | 55.41 ab | 0.055 | 57.58 | 20.90 e | 61.20 a | 0.055 b | 59.91 b | |
| ④ | 27.70 a | 52.19 e | 0.046 b | 58.63 b | 23.7 ab | 53.46 c | 0.053 | 57.36 | 23.83 bc | 56.68 c | 0.053 b | 59.42 b | |
| ⑤ | 23.32 cd | 57.36 bc | 0.057 ab | 60.35 b | 23.71 ab | 54.22 abc | 0.052 | 57.52 | 22.89 cd | 59.12 b | 0.053 b | 60.07 b | |
| ⑥ | 25.72 b | 55.03 d | 0.050 b | 59.60 b | 24.83 a | 53.66 bc | 0.048 | 57.30 | 25.5 ab | 57.07 c | 0.046 b | 59.27 b | |
| BS | 0 | 13.88 c | 31.52 ab | 0.084 ab | 36.81 | 11.20 b | 29.66 | 0.044 | 28.47 | 12.42 | 35.83 ab | 0.070 | 37.11 |
| ① | 16.62 a | 28.40 e | 0.079 ab | 36.96 | 12.02 ab | 30.73 | 0.034 | 27.88 | 13.93 | 34.16 b | 0.068 | 37.27 | |
| ② | 14.51 bc | 30.62 bc | 0.095 a | 37.50 | 11.10 b | 29.74 | 0.045 | 28.42 | 13.05 | 35.04 ab | 0.073 | 37.54 | |
| ③ | 14.93 abc | 30.53 bc | 0.090 a | 37.57 | 10.99 b | 30.09 | 0.044 | 28.50 | 13.28 | 34.87 ab | 0.072 | 37.51 | |
| ④ | 13.90 c | 32.50 a | 0.080 ab | 37.24 | 11.11 b | 29.96 | 0.044 | 28.56 | 12.32 | 36.41 a | 0.069 | 37.35 | |
| ⑤ | 16.10 ab | 29.74 bc | 0.069 b | 36.55 | 12.53 ab | 30.08 | 0.033 | 27.99 | 13.44 | 35.05 ab | 0.064 | 36.98 | |
| ⑥ | 16.30 ab | 29.05 cd | 0.070 b | 36.32 | 13.32 a | 30.77 | 0.028 | 27.74 | 13.37 | 35.00 ab | 0.065 | 36.96 | |
| SS | 0 | 15.75 ab | 47.92 ab | 0.087 bc | 50.90 | 20.56 | 55.38 ab | 0.075 | 59.54 | 12.87 a | 48.93 bcd | 0.085 b | 48.51 |
| ① | 13.83 b | 48.81 ab | 0.116 a | 52.26 | 22.45 | 53.01 c | 0.077 | 60.03 | 10.02 b | 50.75 ab | 0.114 a | 49.82 | |
| ② | 15.83 a | 47.32 ab | 0.105 ab | 52.26 | 21.66 | 53.91 bc | 0.079 | 60.29 | 12.77 a | 48.62 cd | 0.100 ab | 49.73 | |
| ③ | 15.60 ab | 46.89 b | 0.108 a | 51.95 | 21.93 | 53.74 bc | 0.078 | 60.27 | 12.87 a | 47.93 d | 0.101 ab | 49.42 | |
| ④ | 15.69 ab | 48.97 a | 0.084 c | 51.38 | 20.49 | 56.11 a | 0.074 | 59.84 | 12.63 a | 50.38 abc | 0.082 b | 49.11 | |
| ⑤ | 15.95 a | 47.85 ab | 0.086 c | 50.97 | 21.78 | 54.47 abc | 0.070 | 59.43 | 12.27 a | 49.77 abcd | 0.086 b | 48.75 | |
| ⑥ | 15.26 ab | 48.82 ab | 0.088 bc | 51.19 | 21.74 | 54.27 abc | 0.071 | 59.34 | 11.31 ab | 51.02 a | 0.089 b | 49.00 | |
| CWR | 0 | 14.63 | 43.28 cd | 0.024 | 33.24 | 31.16 | 30.34 a | 0.034 | 46.09 | 11.98 | 37.26 bc | 0.014 | 23.18 |
| ① | 14.99 | 44.75 bc | 0.021 | 33.13 | 30.77 | 26.66 b | 0.045 | 46.47 | 12.11 | 32.68 d | 0.017 | 23.41 | |
| ② | 15.46 | 44.56 bc | 0.021 | 33.11 | 31.50 | 27.09 b | 0.037 | 46.19 | 12.53 | 43.01 a | 0.010 | 23.15 | |
| ③ | 15.06 | 42.71 d | 0.023 | 33.21 | 31.62 | 26.79 b | 0.037 | 46.09 | 12.32 | 37.71 b | 0.013 | 23.18 | |
| ④ | 15.91 | 45.60 b | 0.018 | 32.70 | 31.38 | 27.05 b | 0.037 | 45.99 | 12.48 | 43.12 a | 0.010 | 22.90 | |
| ⑤ | 15.22 | 45.16 bc | 0.020 | 32.85 | 30.40 | 27.12 b | 0.045 | 46.30 | 11.83 | 32.83 d | 0.017 | 23.27 | |
| ⑥ | 15.93 | 52.10 a | 0.015 | 32.62 | 29.76 | 27.62 b | 0.048 | 46.51 | 12.10 | 35.70 c | 0.014 | 23.22 | |
| RS | 0 | 34.49 | 34.98 abc | 0.021 | 48.12 | 32.70 a | 34.97 ab | 0.043 | 52.78 | 32.39 | 35.15 abc | 0.022 | 46.38 |
| ① | 34.24 | 33.30 cd | 0.022 | 48.03 | 30.39 b | 36.06 a | 0.051 | 52.76 | 32.31 | 33.87 c | 0.022 | 46.35 | |
| ② | 34.67 | 35.12 ab | 0.019 | 47.87 | 31.48 ab | 36.00 a | 0.043 | 52.35 | 32.73 | 35.84 ab | 0.019 | 46.20 | |
| ③ | 34.36 | 33.51 bcd | 0.022 | 47.98 | 31.65 ab | 35.07 ab | 0.044 | 52.10 | 32.40 | 34.38 bc | 0.021 | 46.33 | |
| ④ | 35.39 | 36.43 a | 0.016 | 47.79 | 33.27 a | 33.23 b | 0.043 | 52.42 | 33.12 | 36.61 a | 0.017 | 46.16 | |
| ⑤ | 34.58 | 33.17 d | 0.022 | 48.06 | 31.39 ab | 34.25 ab | 0.053 | 52.94 | 32.37 | 33.85 c | 0.022 | 46.39 | |
| ⑥ | 35.04 | 36.07 a | 0.017 | 47.90 | 30.42 b | 35.74 a | 0.057 | 53.39 | 32.86 | 36.20 ab | 0.018 | 46.24 | |
| OG | 0 | 11.86 b | 67.42 a | 0.057 | 55.28 | 12.77 bc | 74.14 ab | 0.058 | 60.90 | 14.86 ab | 62.18 a | 0.054 | 54.16 |
| ① | 13.19 ab | 65.35 bc | 0.060 | 56.19 | 12.07 cd | 73.46 b | 0.068 | 62.39 | 13.71 b | 62.80 a | 0.058 | 54.43 | |
| ② | 14.34 a | 64.30 c | 0.057 | 55.75 | 15.94 a | 69.97 d | 0.057 | 61.08 | 15.61 ab | 61.19 ab | 0.052 | 53.71 | |
| ③ | 13.89 a | 64.68 c | 0.058 | 55.88 | 14.87 a | 72.31 bc | 0.059 | 62.15 | 14.76 ab | 62.19 a | 0.054 | 54.03 | |
| ④ | 12.57 ab | 65.93 abc | 0.056 | 54.87 | 14.34 ab | 71.15 cd | 0.057 | 60.13 | 16.11 a | 60.08 b | 0.052 | 53.62 | |
| ⑤ | 11.61 b | 67.38 a | 0.058 | 55.30 | 10.51 d | 75.86 a | 0.064 | 61.51 | 13.73 b | 62.86 a | 0.058 | 54.49 | |
| ⑥ | 12.43 ab | 66.58 ab | 0.056 | 55.06 | 11.78 cd | 74.07 ab | 0.062 | 61.00 | 14.86 ab | 61.52 ab | 0.055 | 54.10 | |
| CS | 0 | 35.33 b | 36.29 a | 0.053 | 59.63 ab | 36.53 | 37.58 | 0.080 | 64.86 | 34.35 a | 37.24 b | 0.049 c | 59.56 ab |
| ① | 37.52 a | 33.61 b | 0.051 | 60.04 a | 36.23 | 37.93 | 0.079 | 65.00 | 35.87 a | 35.25 c | 0.054 ab | 59.92 a | |
| ② | 37.61 a | 33.25 b | 0.052 | 59.96 a | 37.25 | 36.87 | 0.074 | 64.71 | 26.09 b | 43.95 a | 0.071 a | 58.48 abc | |
| ③ | 37.18 ab | 34.35 b | 0.052 | 60.35 a | 37.02 | 36.99 | 0.075 | 64.71 | 35.75 a | 35.79 bc | 0.055 ab | 60.11 a | |
| ④ | 35.56 b | 36.13 a | 0.051 | 57.87 bc | 37.38 | 36.19 | 0.077 | 63.06 | 34.87 a | 36.54 bc | 0.052 ab | 57.59 c | |
| ⑤ | 35.70 ab | 36.39 a | 0.049 | 57.88 bc | 36.23 | 37.71 | 0.081 | 63.42 | 34.49 a | 37.43 b | 0.052 ab | 57.83 bc | |
| ⑥ | 36.97 ab | 34.90 b | 0.044 | 57.32 c | 36.37 | 37.69 | 0.080 | 63.46 | 35.95 a | 35.68 bc | 0.046 c | 57.21 c | |
| TP | 0 | 11.83 b | 82.86 abc | 0.043 | 50.11 d | 18.61 a | 78.66 d | 0.064 a | 62.55 b | 21.71 a | 76.52 d | 0.074 a | 67.14 b |
| ① | 15.55 a | 84.38 a | 0.046 | 69.82 a | 15.71 b | 83.35 bc | 0.036 b | 64.60 a | 10.47 d | 89.13 a | 0.049 b | 69.37 a | |
| ② | 17.06 a | 82.27 bc | 0.045 | 69.81 a | 14.41 b | 85.34 a | 0.039 b | 66.38 a | 16.34 c | 83.32 b | 0.046 b | 69.93 a | |
| ③ | 15.96 a | 84.01 ab | 0.046 | 69.99 a | 15.08 b | 82.10 c | 0.040 b | 65.47 a | 18.73 b | 80.20 c | 0.045 b | 70.23 a | |
| ④ | 16.14 a | 81.86 c | 0.041 | 62.40 b | 15.42 b | 81.75 c | 0.038 b | 60.39 c | 18.37 b | 80.30 c | 0.044 b | 64.96 c | |
| ⑤ | 15.44 a | 82.35 bc | 0.041 | 61.83 bc | 15.64 b | 83.17 bc | 0.037 b | 60.35 c | 17.82 bc | 81.94 bc | 0.043 b | 65.27 c | |
| ⑥ | 15.23 a | 84.57 a | 0.036 | 60.17 c | 14.97 b | 84.42 ab | 0.036 b | 60.06 c | 18.52 b | 81.24 c | 0.041 b | 64.28 c | |
Disclaimer/Publisher’s Note: The statements, opinions and data contained in all publications are solely those of the individual author(s) and contributor(s) and not of MDPI and/or the editor(s). MDPI and/or the editor(s) disclaim responsibility for any injury to people or property resulting from any ideas, methods, instructions or products referred to in the content. |
© 2023 by the authors. Licensee MDPI, Basel, Switzerland. This article is an open access article distributed under the terms and conditions of the Creative Commons Attribution (CC BY) license (https://creativecommons.org/licenses/by/4.0/).
Share and Cite
Li, S.; He, L.; Mo, F.; Zhang, W. In Situ Degradation Kinetics of 25 Feedstuffs and the Selection of Time Points in Mathematical Statistics. Animals 2023, 13, 947. https://doi.org/10.3390/ani13050947
Li S, He L, Mo F, Zhang W. In Situ Degradation Kinetics of 25 Feedstuffs and the Selection of Time Points in Mathematical Statistics. Animals. 2023; 13(5):947. https://doi.org/10.3390/ani13050947
Chicago/Turabian StyleLi, Sen, Liwen He, Fang Mo, and Wei Zhang. 2023. "In Situ Degradation Kinetics of 25 Feedstuffs and the Selection of Time Points in Mathematical Statistics" Animals 13, no. 5: 947. https://doi.org/10.3390/ani13050947
APA StyleLi, S., He, L., Mo, F., & Zhang, W. (2023). In Situ Degradation Kinetics of 25 Feedstuffs and the Selection of Time Points in Mathematical Statistics. Animals, 13(5), 947. https://doi.org/10.3390/ani13050947