Correction: Jansen, S., et al. Relationship between Bone Stability and Egg Production in Genetically Divergent Chicken Layer Lines. Animals 2020, 10, 850

 ,
,  ,
, 
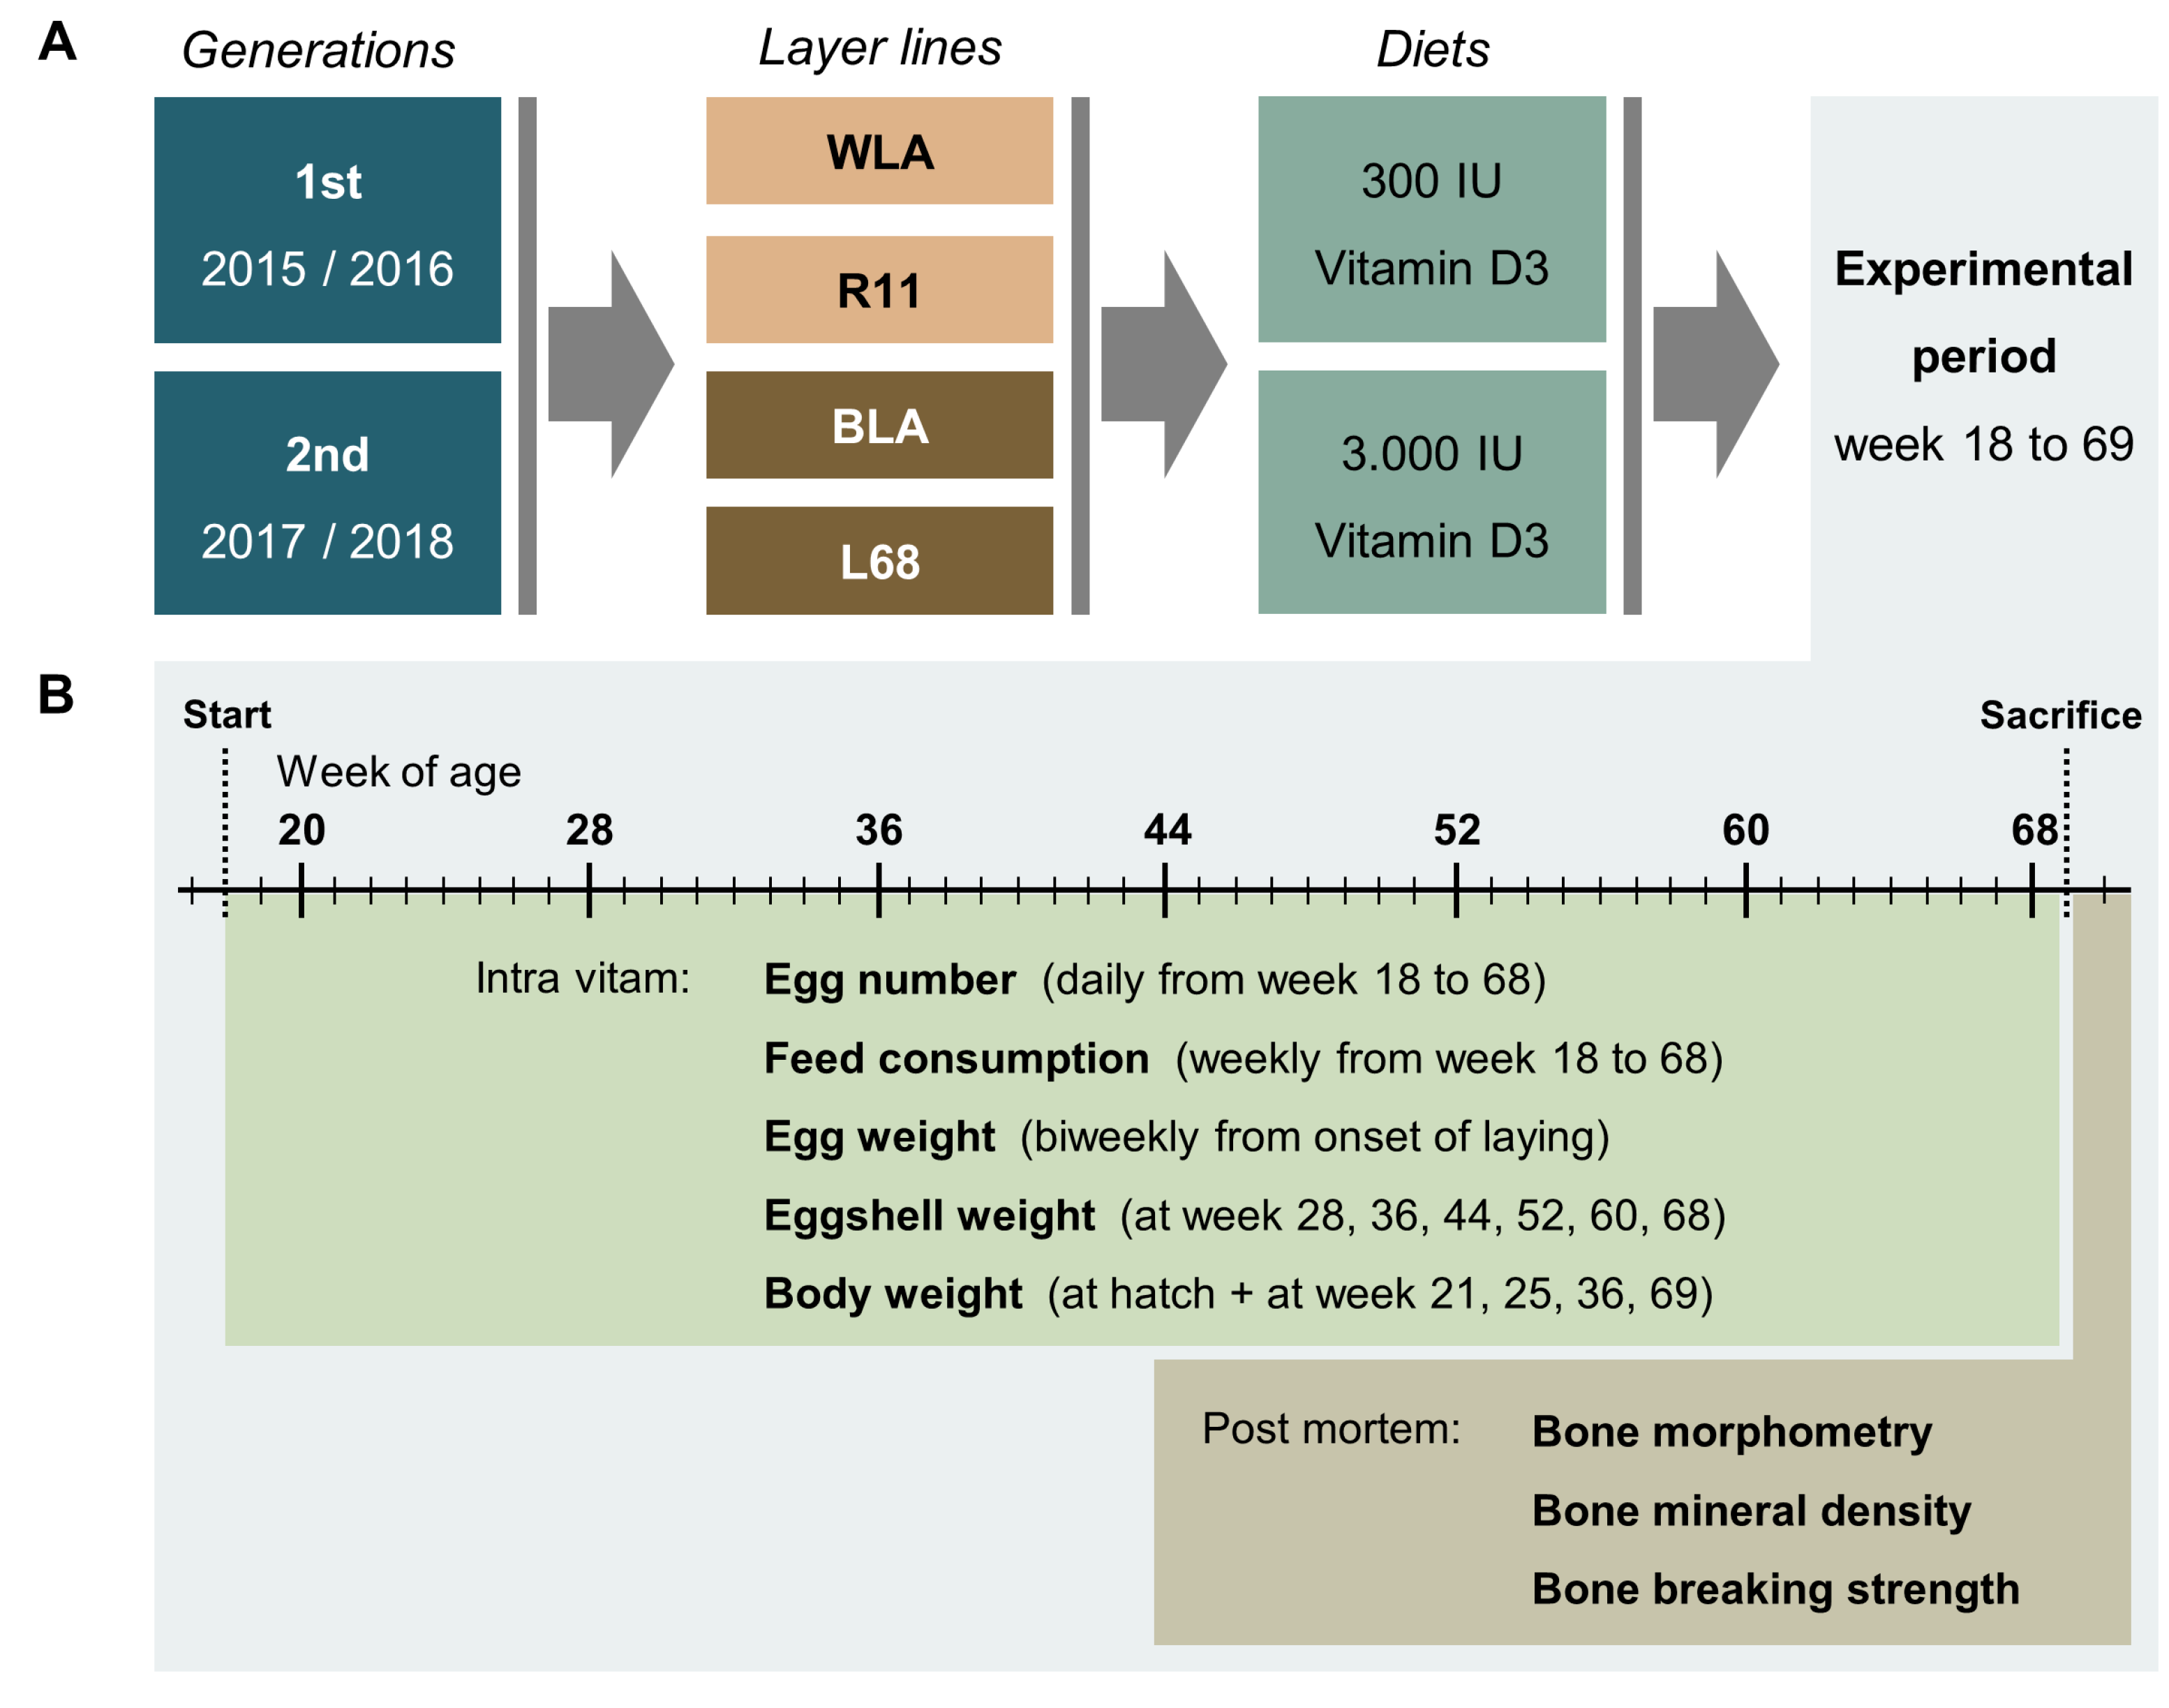
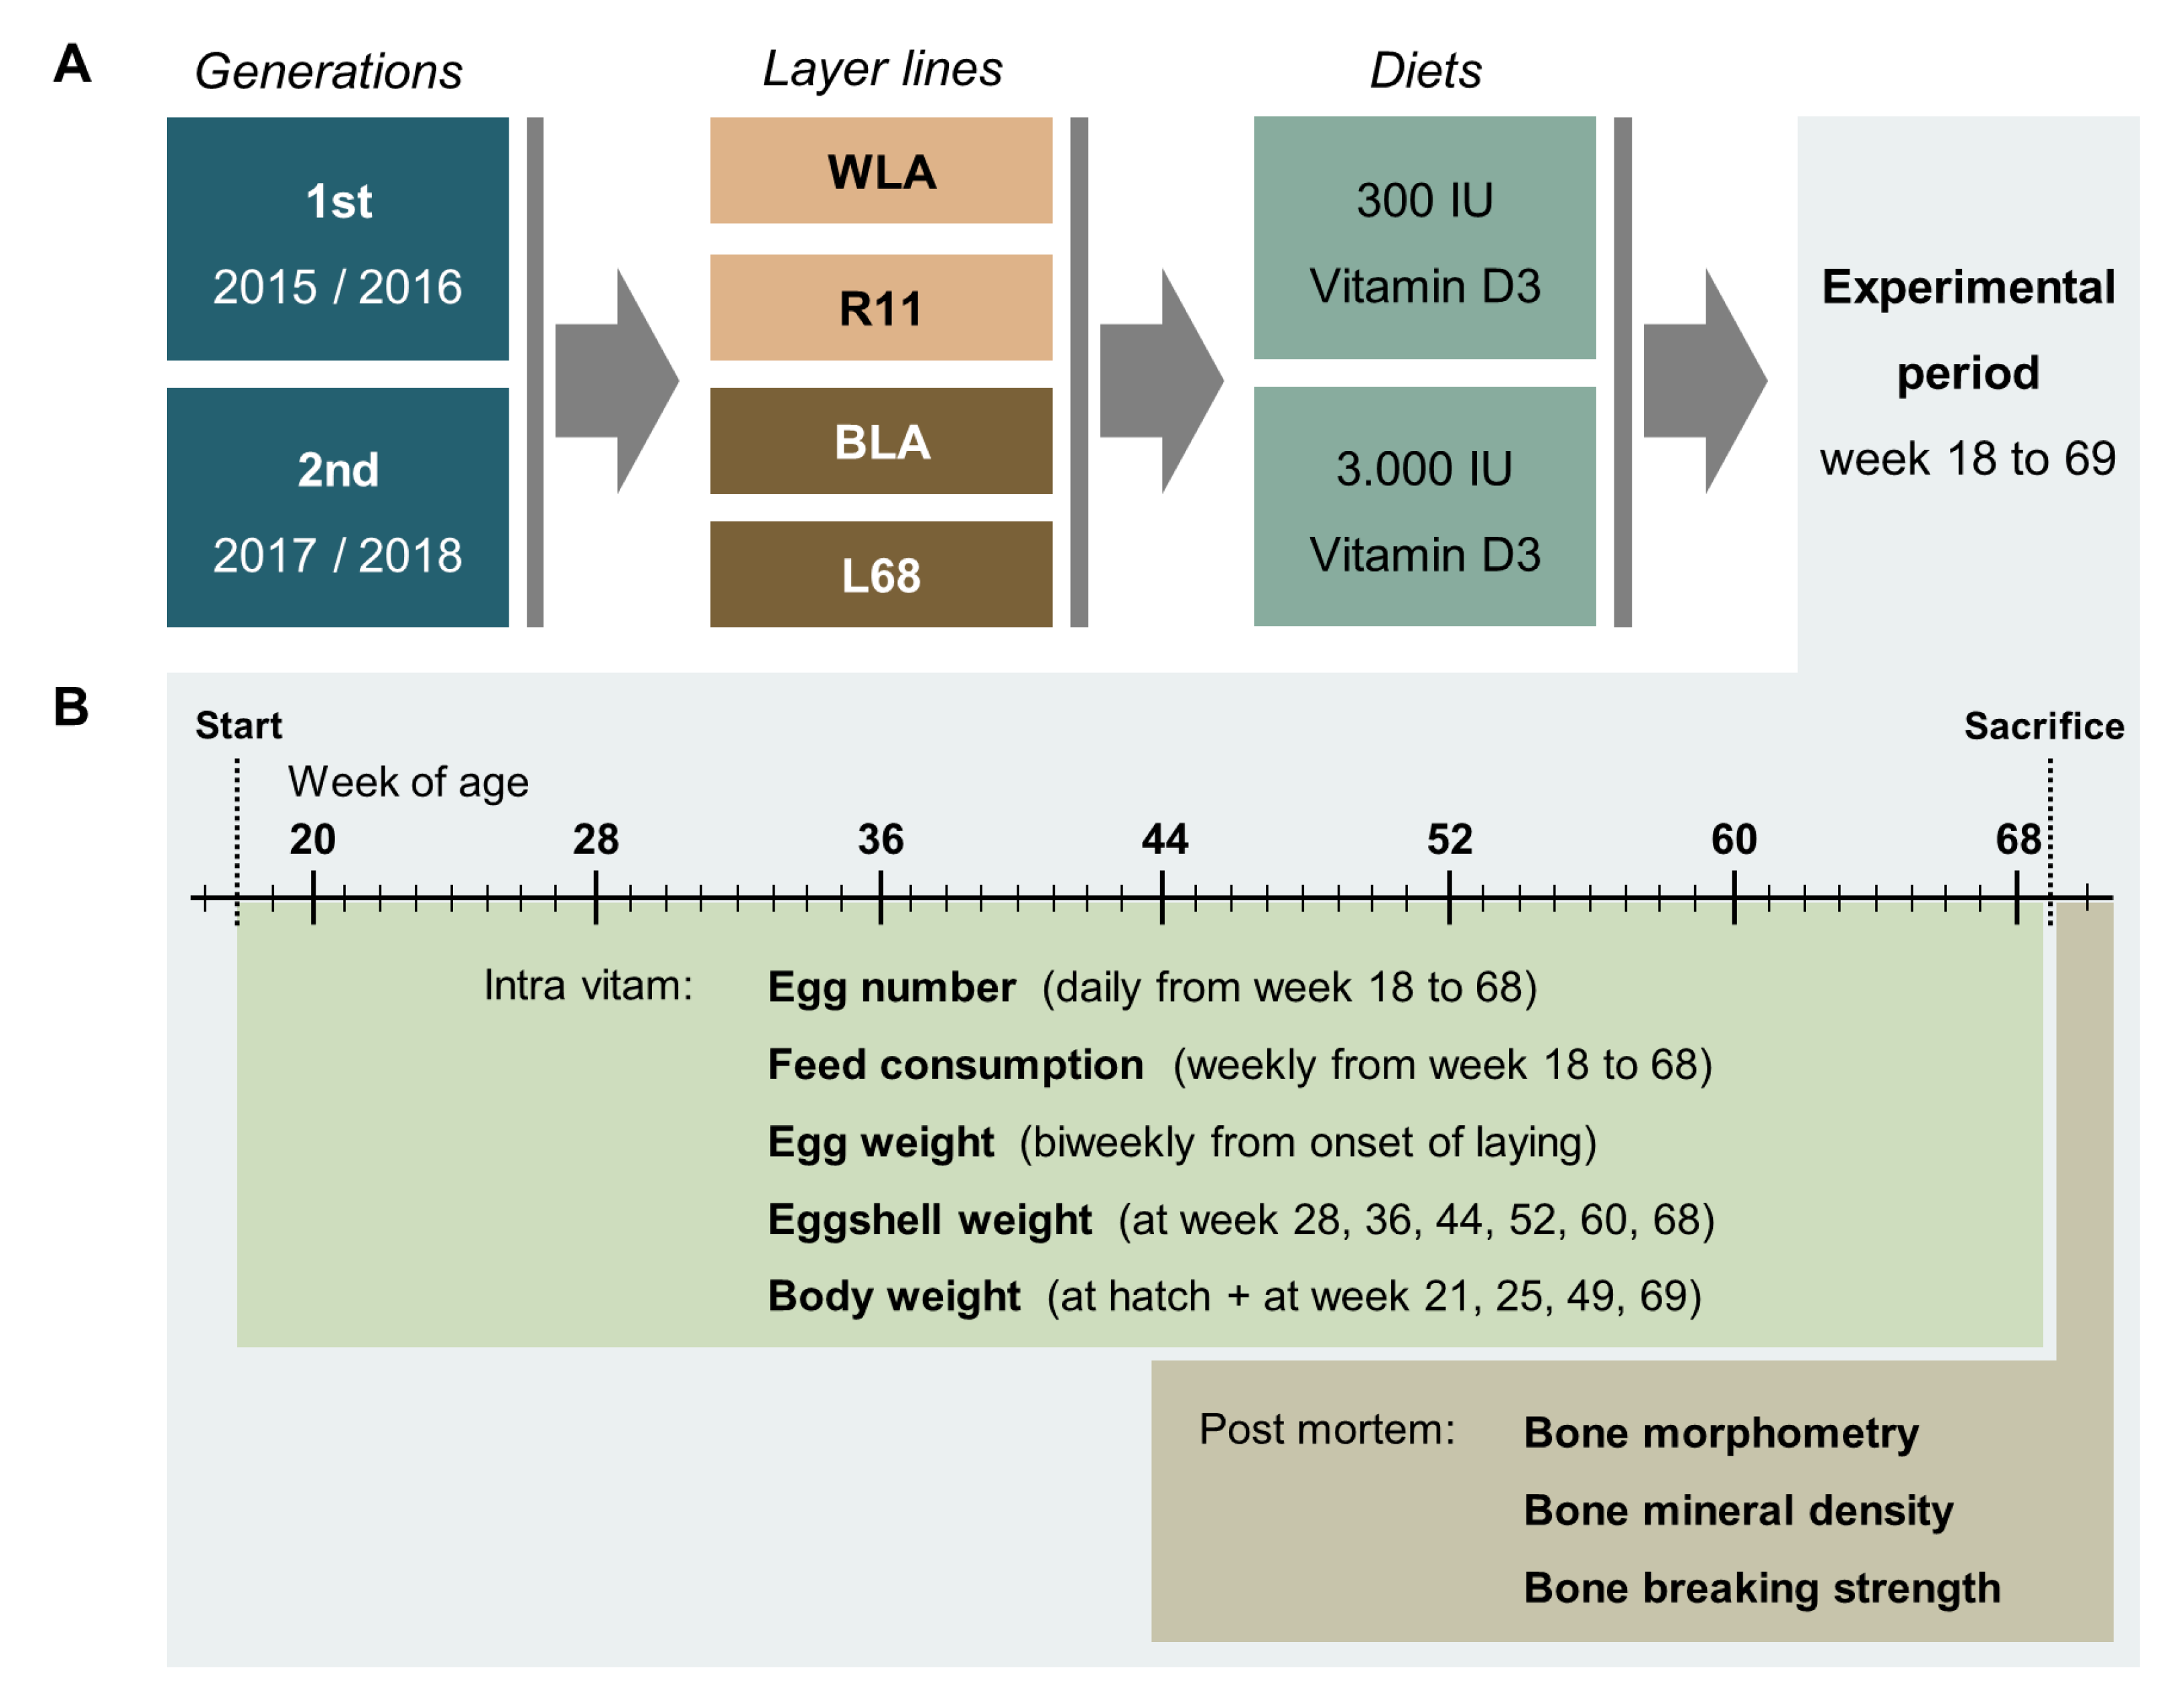
Main Body Paragraphs Correction
Figures/Tables Correction


Change in Supplementary File

| Variable | Total | Layer Line | |||
|---|---|---|---|---|---|
| WLA | R11 | BLA | L68 | ||
| Laying maturity | 524 | 129 | 134 | 133 | 128 |
| Total number of eggs | 524 | 129 | 134 | 133 | 128 |
| Egg weight | 524 | 129 | 134 | 133 | 128 |
| Eggshell weight | 524 | 129 | 134 | 133 | 128 |
| Eggshell proportion | 524 | 129 | 134 | 133 | 128 |
| Total eggshell production | 524 | 129 | 134 | 133 | 128 |
| Daily feed consumption | 513 | 128 | 131 | 129 | 125 |
| Feed-to-egg-conversion rate | 513 | 128 | 131 | 129 | 125 |
| Feed-to-eggshell conversion rate | 513 | 128 | 131 | 129 | 125 |
| Bone breaking strength Tibiotarsus | 518 | 126 | 134 | 131 | 127 |
| Bone mineral density Tibiotarsus | 524 | 129 | 134 | 133 | 128 |
| Weight Tibiotarsus | 524 | 129 | 134 | 133 | 128 |
| Length Tibiotarsus | 524 | 129 | 134 | 133 | 128 |
| Thickness Tibiotarsus | 524 | 129 | 134 | 133 | 128 |
| Bone breaking strength Humerus | 516 | 128 | 131 | 132 | 125 |
| Bone mineral density Humerus | 519 | 129 | 134 | 128 | 128 |
| Weight Humerus | 521 | 127 | 134 | 132 | 128 |
| Length Humerus | 523 | 129 | 134 | 132 | 128 |
| Thickness Humerus | 523 | 129 | 134 | 132 | 128 |
| Body weight at hatch | 523 | 129 | 133 | 133 | 128 |
| Body weight at week 21 | 524 | 129 | 134 | 133 | 128 |
| Body weight at week 25 | 524 | 129 | 134 | 133 | 128 |
| Body weight at week 35 | 524 | 129 | 134 | 133 | 128 |
| Body weight at week 69 | 524 | 129 | 134 | 133 | 128 |
| Variable | Total | Layer Line | |||
|---|---|---|---|---|---|
| WLA | R11 | BLA | L68 | ||
| Laying maturity | 524 | 129 | 134 | 133 | 128 |
| Total number of eggs | 524 | 129 | 134 | 133 | 128 |
| Egg weight | 524 | 129 | 134 | 133 | 128 |
| Eggshell weight | 524 | 129 | 134 | 133 | 128 |
| Eggshell proportion | 524 | 129 | 134 | 133 | 128 |
| Total eggshell production | 524 | 129 | 134 | 133 | 128 |
| Daily feed consumption | 513 | 128 | 131 | 129 | 125 |
| Feed-to-egg-conversion rate | 513 | 128 | 131 | 129 | 125 |
| Feed-to-eggshell conversion rate | 513 | 128 | 131 | 129 | 125 |
| Bone breaking strength Tibiotarsus | 518 | 126 | 134 | 131 | 127 |
| Bone mineral density Tibiotarsus | 524 | 129 | 134 | 133 | 128 |
| Weight Tibiotarsus | 524 | 129 | 134 | 133 | 128 |
| Length Tibiotarsus | 524 | 129 | 134 | 133 | 128 |
| Thickness Tibiotarsus | 524 | 129 | 134 | 133 | 128 |
| Bone breaking strength Humerus | 516 | 128 | 131 | 132 | 125 |
| Bone mineral density Humerus | 519 | 129 | 134 | 128 | 128 |
| Weight Humerus | 521 | 127 | 134 | 132 | 128 |
| Length Humerus | 523 | 129 | 134 | 132 | 128 |
| Thickness Humerus | 523 | 129 | 134 | 132 | 128 |
| Body weight at hatch | 523 | 129 | 133 | 133 | 128 |
| Body weight at week 21 | 524 | 129 | 134 | 133 | 128 |
| Body weight at week 25 | 524 | 129 | 134 | 133 | 128 |
| Body weight at week 49 | 524 | 129 | 134 | 133 | 128 |
| Body weight at week 69 | 524 | 129 | 134 | 133 | 128 |
| Effect | Body Weight (g) | ||||||
|---|---|---|---|---|---|---|---|
| Hatch | Week 21 | Week 25 | Week 35 | Week 69 | |||
| Layer line (LL) | |||||||
| WLA | 38.35 ± 0.37 a | 1420.02 ± 15.79 b | 1468.38 ± 16.19 b | 1497.54 ± 20.46 b | 1504.23 ± 22.26 c | ||
| R11 | 33.17 ± 0.36 c | 1040.84 ± 15.60 c | 1236.40 ± 15.99 c | 1309.28 ± 20.21 c | 1362.79 ± 21.99 d | ||
| BLA | 39.35 ± 0.37 a | 1584.15 ± 15.71 a | 1663.55 ± 16.11 a | 1821.81 ± 20.34 a | 1838.10 ± 22.13 b | ||
| L68 | 34.84 ± 0.37 b | 1568.91 ± 15.81 a | 1714.92 ± 16.21 a | 1837.91 ± 20.48 a | 1923.44 ± 22.29 a | ||
| Generation (Gen) | |||||||
| Gen 1 | 35.86 ± 0.26 | 1379.01 ± 11.17 | 1485.67 ± 11.45 | 1567.49 ± 14.47 | 1616.21 ± 15.76 | ||
| Gen 2 | 37.00 ± 0.26 | 1427.95 ± 11.07 | 1555.96 ± 11.36 | 1665.79 ± 14.34 | 1698.07 ± 15.59 | ||
| LL × Gen | |||||||
| WLA × Gen1 | 37.77 ± 0.52 | 1376.72 ± 22.36 | 1415.84 ± 22.91 | 1460.33 ± 28.96 | 1443.48 ± 31.51 | ||
| WLA × Gen2 | 38.93 ± 0.52 | 1463.31 ± 22.32 | 1520.93 ± 22.88 | 1534.75 ± 28.91 | 1564.98 ± 31.45 | ||
| R11 × Gen1 | 32.64 ± 0.51 | 1027.33 ± 21.99 | 1222.77 ± 22.53 | 1284.20 ± 28.49 | 1338.12 ± 31.02 | ||
| R11 × Gen2 | 33.69 ± 0.52 | 1054.36 ± 22.14 | 1250.04 ± 22.71 | 1334.37 ± 28.66 | 1387.45 ± 31.17 | ||
| BLA × Gen1 | 38.84 ± 0.52 | 1549.66 ± 22.41 | 1627.91 ± 22.97 | 1767.90 ± 29.03 | 1804.33 ± 31.60 | ||
| BLA × Gen2 | 39.87 ± 0.51 | 1618.63 ± 22.02 | 1699.19 ± 22.59 | 1875.73 ± 28.50 | 1871.86 ± 30.98 | ||
| L68 × Gen1 | 34.18 ± 0.52 | 1562.32 ± 22.61 | 1676.16 ± 23.16 | 1757.53 ± 29.31 | 1878.89 ± 31.92 | ||
| L68 × Gen2 | 35.51 ± 0.51 | 1575.50 ± 22.11 | 1753.67 ± 22.68 | 1918.30 ± 28.62 | 1968.00 ± 31.12 | ||
| ANOVA significance level (p value) | |||||||
| Layer line | Generation | LL × Gen | |||||
| Hatch | <0.0001 | 0.0019 | 0.9908 | ||||
| Week 21 | <0.0001 | 0.0020 | 0.3097 | ||||
| Week 25 | <0.0001 | <0.0001 | 0.3907 | ||||
| Week 35 | <0.0001 | <0.0001 | 0.2486 | ||||
| Week 69 | 0.0003 | <0.0001 | 0.6892 | ||||
| Effect | Body Weight (g) | ||||||
|---|---|---|---|---|---|---|---|
| Hatch | Week 21 | Week 25 | Week 49 | Week 69 | |||
| Layer line (LL) | |||||||
| WLA | 38.35 ± 0.37 a | 1420.02 ± 15.79 b | 1468.38 ± 16.19 b | 1497.54 ± 20.46 b | 1504.23 ± 22.26 c | ||
| R11 | 33.17 ± 0.36 c | 1040.84 ± 15.60 c | 1236.40 ± 15.99 c | 1309.28 ± 20.21 c | 1362.79 ± 21.99 d | ||
| BLA | 39.35 ± 0.37 a | 1584.15 ± 15.71 a | 1663.55 ± 16.11 a | 1821.81 ± 20.34 a | 1838.10 ± 22.13 b | ||
| L68 | 34.84 ± 0.37 b | 1568.91 ± 15.81 a | 1714.92 ± 16.21 a | 1837.91 ± 20.48 a | 1923.44 ± 22.29 a | ||
| Generation (Gen) | |||||||
| Gen 1 | 35.86 ± 0.26 | 1379.01 ± 11.17 | 1485.67 ± 11.45 | 1567.49 ± 14.47 | 1616.21 ± 15.76 | ||
| Gen 2 | 37.00 ± 0.26 | 1427.95 ± 11.07 | 1555.96 ± 11.36 | 1665.79 ± 14.34 | 1698.07 ± 15.59 | ||
| LL × Gen | |||||||
| WLA × Gen1 | 37.77 ± 0.52 | 1376.72 ± 22.36 | 1415.84 ± 22.91 | 1460.33 ± 28.96 | 1443.48 ± 31.51 | ||
| WLA × Gen2 | 38.93 ± 0.52 | 1463.31 ± 22.32 | 1520.93 ± 22.88 | 1534.75 ± 28.91 | 1564.98 ± 31.45 | ||
| R11 × Gen1 | 32.64 ± 0.51 | 1027.33 ± 21.99 | 1222.77 ± 22.53 | 1284.20 ± 28.49 | 1338.12 ± 31.02 | ||
| R11 × Gen2 | 33.69 ± 0.52 | 1054.36 ± 22.14 | 1250.04 ± 22.71 | 1334.37 ± 28.66 | 1387.45 ± 31.17 | ||
| BLA × Gen1 | 38.84 ± 0.52 | 1549.66 ± 22.41 | 1627.91 ± 22.97 | 1767.90 ± 29.03 | 1804.33 ± 31.60 | ||
| BLA × Gen2 | 39.87 ± 0.51 | 1618.63 ± 22.02 | 1699.19 ± 22.59 | 1875.73 ± 28.50 | 1871.86 ± 30.98 | ||
| L68 × Gen1 | 34.18 ± 0.52 | 1562.32 ± 22.61 | 1676.16 ± 23.16 | 1757.53 ± 29.31 | 1878.89 ± 31.92 | ||
| L68 × Gen2 | 35.51 ± 0.51 | 1575.50 ± 22.11 | 1753.67 ± 22.68 | 1918.30 ± 28.62 | 1968.00 ± 31.12 | ||
| ANOVA significance level (p value) | |||||||
| Layer line | Generation | LL × Gen | |||||
| Hatch | <0.0001 | 0.0019 | 0.9908 | ||||
| Week 21 | <0.0001 | 0.0020 | 0.3097 | ||||
| Week 25 | <0.0001 | <0.0001 | 0.3907 | ||||
| Week 49 | <0.0001 | <0.0001 | 0.2486 | ||||
| Week 69 | 0.0003 | <0.0001 | 0.6892 | ||||
Reference
- Jansen, S.; Baulain, U.; Habig, C.; Weigend, A.; Halle, I.; Scholz, A.M.; Simianer, H.; Sharifi, A.R.; Weigend, S. Relationship between Bone Stability and Egg Production in Genetically Divergent Chicken Layer Lines. Animals 2020, 10, 850. [Google Scholar] [CrossRef] [PubMed]
Publisher’s Note: MDPI stays neutral with regard to jurisdictional claims in published maps and institutional affiliations. |
© 2020 by the authors. Licensee MDPI, Basel, Switzerland. This article is an open access article distributed under the terms and conditions of the Creative Commons Attribution (CC BY) license (http://creativecommons.org/licenses/by/4.0/).
Share and Cite
Jansen, S.; Baulain, U.; Habig, C.; Weigend, A.; Halle, I.; Scholz, A.M.; Simianer, H.; Sharifi, A.R.; Weigend, S. Correction: Jansen, S., et al. Relationship between Bone Stability and Egg Production in Genetically Divergent Chicken Layer Lines. Animals 2020, 10, 850. Animals 2020, 10, 2355. https://doi.org/10.3390/ani10122355
Jansen S, Baulain U, Habig C, Weigend A, Halle I, Scholz AM, Simianer H, Sharifi AR, Weigend S. Correction: Jansen, S., et al. Relationship between Bone Stability and Egg Production in Genetically Divergent Chicken Layer Lines. Animals 2020, 10, 850. Animals. 2020; 10(12):2355. https://doi.org/10.3390/ani10122355
Chicago/Turabian StyleJansen, Simon, Ulrich Baulain, Christin Habig, Annett Weigend, Ingrid Halle, Armin Manfred Scholz, Henner Simianer, Ahmad Reza Sharifi, and Steffen Weigend. 2020. "Correction: Jansen, S., et al. Relationship between Bone Stability and Egg Production in Genetically Divergent Chicken Layer Lines. Animals 2020, 10, 850" Animals 10, no. 12: 2355. https://doi.org/10.3390/ani10122355
APA StyleJansen, S., Baulain, U., Habig, C., Weigend, A., Halle, I., Scholz, A. M., Simianer, H., Sharifi, A. R., & Weigend, S. (2020). Correction: Jansen, S., et al. Relationship between Bone Stability and Egg Production in Genetically Divergent Chicken Layer Lines. Animals 2020, 10, 850. Animals, 10(12), 2355. https://doi.org/10.3390/ani10122355