There was an error in the original publication [1]. The original data presented mean and standard deviation (Mean ± SD) and needs to be replaced with Linear Discriminant Analysis (LDA) scores and the corresponding statistical significance (p–values). The original figure captions a and b in Figure 6 were mismatched with corresponding images and need to be matched to images b and a, respectively.
The correction has been made to Results Section, 3.4 The Differential Taxa Analysis During Breast Tumor Growth, Paragraph 1 and the caption of Figure 6:
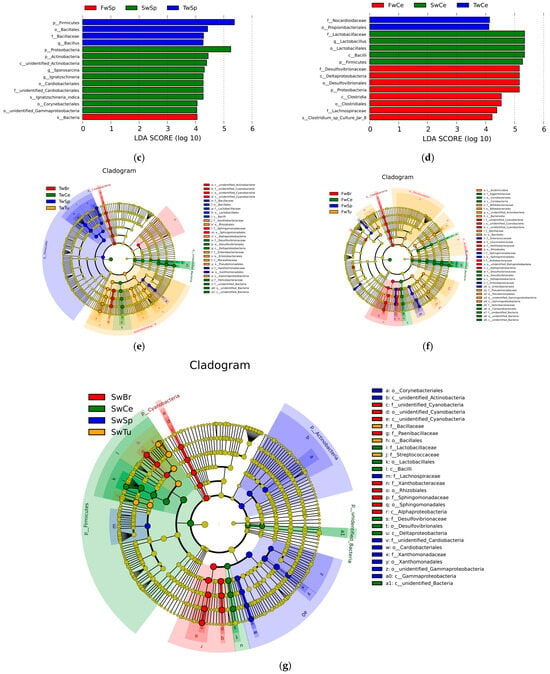
LEfSe analysis (LDA score > 4, p < 0.05) delineated temporally resolved microbial signatures across four tissue compartments during breast tumor progression. In breast tumors, hierarchical taxonomic enrichment progressed from Proteobacteria phylum (LDA = 5.41, p = 0.04), genus Sphingomonas (LDA = 5.40, p = 0.01), family Sphingomonadaceae (LDA = 5.40, p = 0.01), order Sphingomomadales (LDA = 5.40, p = 0.01), and class Alphaproteobacterial (LDA = 5.39, p = 0.03) dominance at week 3 to Actinobacteria phylum (LDA = 4.94, p = 0.03) prominence at week 5, ultimately shifting to Bacilli-class (LDA = 5.46, p = 0.01), species Bacillus halodurans (LDA = 5.09, p = 0.04), species Streptococcus azizii (LDA = 5.04, p = 0.005), species Bacillus litoralis (LDA = 4.68, p = 0.005), and species Paenibacillus humicus (LDA = 4.17, p = 0.01) dominance at week 7 (Figure 6a). Normal breast tissue mirrored tumor-associated patterns at weeks 3–5 but diverged at week 7, retaining only Streptococcus azizii (LDA = 4.01, p = 0.02) and Paenibacillus humicus (LDA = 4.44, p = 0.04) as significantly enriched species (Figure 6b). Spleen tissue exhibited distinct phasic dynamics with Firmicutes phylum enrichment (LDA = 5.37, p = 0.03) at week 3, followed by transitional equilibrium at week 5 (Firmicutes 45.51%, Proteobacteria 45.90%) (Table S1). By week 7, microbial reorganization emerged, featuring dual enrichment patterns—Proteobacteria (LDA = 5.24, p = 0.03), class Gamma-proteobacteria (LDA = 4.04, p = 0.01), order Cardiobacteriales (LDA = 4.27, p = 0.03), genus Ignatzschineria (LDA = 4.27, p = 0.03), Actinobacteria (LDA = 4.44, p = 0.04), and Corynebacteriales order (LDA = 4.05, p = 0.01)—coexisting with Sporosarcina genus (LDA = 4.30, p = 0.03) predominance (Figure 6c). Cecal content microbiota demonstrated progressive ecological succession (Figure 6d). Initial week 3 profiles demonstrated significant enrichment of Actinobacteria-derived lineages, specifically order Propionibacteriales (LDA = 4.11, p = 0.03) and family Nocardioidaceae (LDA = 4.13, p = 0.03). By week 5, microbial dominance shifted to Proteobacteria (LDA = 5.16, p = 0.02), class Delta-proteobacteria (LDA = 5.16, p = 0.02), and Clostridia (LDA = 4.53, p = 0.02) associated taxa, evidenced by enriched-order Desulfovibrionales (LDA = 5.16, p = 0.02), family Desulfovibrionaceae (LDA = 5.16, p = 0.02), and Clostridiales order (LDA = 4.54, p = 0.03), family Lachnospiraceae (LDA = 4.38, p = 0.01), genus Clostridium sp. (LDA = 4.22, p = 0.01). Week 7 marked Firmicutes (LDA = 5.27, p = 0.02) predominance through Lactobacillales order (LDA = 5.33, p = 0.02) expansion family Lactobacillaceae (LDA = 5.34, p = 0.02), and Lactobacillus genus (LDA = 5.34, p = 0.02). These temporal transitions establish distinct microbial ecologies across four tissues during breast oncogenesis.


Figure 6.
The differential microbial taxa in four tissues at different stages of breast tumor by LEfSe with the Tukey test (LDA score > 4, p < 0.05) and cladogram. (a) LDA value distribution in breast tumor at different stages. (b) LDA value distribution in normal breast tissue at different stages. (c) LDA value distribution in the spleen tissue at different stages. (d) LDA value distribution in cecal contents at different stages. (e) Cladogram in different tissues at 3 w. (f) Cladogram in different tissues at 5 w. (g) Cladogram in different tissues at 7 w.
The authors state that the scientific conclusions are unaffected. This correction was approved by the Academic Editor. The original publication has also been updated.
Reference
- Xu, Q.; Fu, A.; Wang, N.; Zhang, Z. Temporal and Spatial Dynamics of Tumor–Host Microbiota in Breast Cancer Progression. Microorganisms 2025, 13, 1632. [Google Scholar] [CrossRef] [PubMed]
Disclaimer/Publisher’s Note: The statements, opinions and data contained in all publications are solely those of the individual author(s) and contributor(s) and not of MDPI and/or the editor(s). MDPI and/or the editor(s) disclaim responsibility for any injury to people or property resulting from any ideas, methods, instructions or products referred to in the content. |
© 2025 by the authors. Licensee MDPI, Basel, Switzerland. This article is an open access article distributed under the terms and conditions of the Creative Commons Attribution (CC BY) license (https://creativecommons.org/licenses/by/4.0/).