Abstract
Urban environments are characterized by dense development and paved ground with reduced evapotranspiration rates. These areas store sensible and latent heat, providing the base for typical urban heat island effects. Green roof installations are one possible strategy to reintroduce evaporative surfaces into cities. If green roofs are irrigated, they can contribute to urban water management and evapotranspiration can be enhanced. As part of two research projects, lysimeter measurements were used to determine the real evapotranspiration rates on the research roof of the University of Applied Sciences in Neubrandenburg, Germany. In this paper, we address the results from 2017, a humid and cool summer, and 2018, a century summer with the highest temperatures and dryness over a long period of time, measured in Northeast Germany. The lysimeter measurements varied between the normal green roof layer (variation of extensive green roof constructions) and a special construction with an extra retention layer and damming. The results show that the average daily evapotranspiration rates can be enhanced from 3 to 5 L/m2/day under optimized conditions. A second test on a real green roof with irrigation was used to explain the cooling effects of the surface above a café building in Berlin.
1. Introduction
Water evaporation is the largest hydrological process on earth and involves energy transformation. Precipitation depends on the evaporation characteristics. The combination of evaporation and transpiration is evapotranspiration (ET). A reduction in the actual evapotranspiration (ETa) enhances the conversion of short-wave into long-wave global solar radiation and sensible heat. The decreasing global evaporation rates are directly related to the ongoing reduction of forest land and urbanization, resulting in higher surface temperatures and amplified urban heat island (UHI) effects [1]. Decentralized rainwater management is now focused on ET instead of draining rainwater or allowing it to seep away. The role of vegetation in the water cycle has been extensively studied [2,3,4].
The benefits of extensive green roofs (EGRs) have been described for nearly all regions in the world [5]. Studies on EGR efficiency have been conducted on nearly all types of buildings in all climates around the world [6,7]. The number of EGR-related surveys has increased in recent years and is now in the focus of urban planning, financial support (Government), and research projects. In this study, we focused on urban surface cooling by evapotranspiration. Many publications have modeled such effects. Only a few people, like the authors, have many years of experience with their own attempts at real-time measurements (precipitation, runoff, solar radiation, radiation balance, temperature, heat flux, wind speed, weight change) on EGRs.
In the leading green roof standard, the FLL-“Dachbegrünungsrichtlinie – Richtlinien für die Planung, Ausführung und Pflege von Dachbegrünungen”, 2018 [8], only laboratory tests with fresh soil, without a vegetation layer, were used to count the retention values of growing media. The quantification of the ET of EGR can be calculated by formulas, such as Penman–Monteith or similar, but some weaknesses regarding the typical environmental factors on the roof exist in these calculations. Most of the formulas are based on agriculture ecosystems. In a number of calculation programs, the data are based on the simulation and calculation of these effects on a city scale, which leads to adding failures.
Green and irrigated roofs were modeled by Heusinger et al. [9] for a variety of sites around the world. They improved the cooling effect of green roofs with low irrigation by about 15%–51% to achieve an effect of 48%–75% with intensive irrigation. Wong and Jim [10] investigated whether green roofs (higher soil depth, change in vegetation) could significantly improve retention and ETa compared to uniformly rendered roofs. Park cool island (PCI) areas or green space areas have been shown to reduce the PCI by about 1.5–3.5 °C [11]. A green building with possibly watered green roofs and greenery on the façades can have an effect of the same magnitude and encourage “climate neutrality”. Zhou et al. [12] calculated that if only 20% of a city’s potential roofs were green, 13 of the 20 inundated underpasses could remain without flooding. Francis and Jensen [13] summarized the urban planning and quantifiable advantages of EGR from various literature sources as follows: Green roofs have a cooling effect on the street level. In 17 studies, this effect was between 0.03 and 3 °K. Four studies focused on particulate matter binding (PM2.5 averaged between 0.4 and 9.1g/m2 per year). Fourteen studies focused on energy savings of at least 7% per annum. Azeñas et al. [14] provided a different view of the control variables on the thermal efficiency of EGRs. They emphasized that lush substrate structures achieve intensive irrigation compared with moderate watering (50%), justifying the further increase in cooling performance. They emphasized the importance of species selection as a significant variable influencing EGR effectiveness in the Mediterranean climate.
Weighing lysimeters are used in environmental research because they allow quantitative and qualitative conclusions about flow behavior and ETa to be drawn (Figure 1). Typically, the systems require up to one year to minimize measurement errors, such as a lack of vegetation and a lack of ground connection. Parts of the lysimeters are at the green roof level and the vegetation in trial fields is at the height of the surrounding vegetation of the EGR. The new lysimeters are built on the existing vegetation due to the increased the contact to the existing EGR. For thermal decoupling, a complete cover is built around the lysimeter (Figure 5; No. 2)
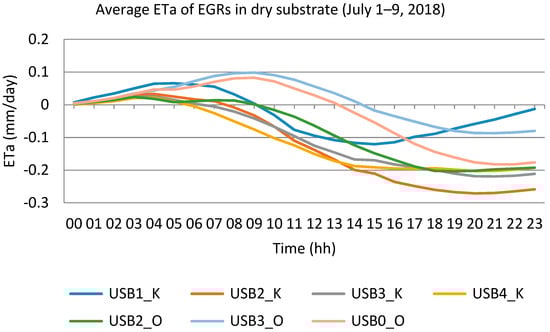
Figure 1.
Extremely low actual evapotranspiration (ETa) of extensive green roofs (EGRs) during a dry and hot period in 2018. The measurements were recorded with by weighting a small scale lysimeter on the experimental green roof of the University of Applied Sciences in Neubrandenburg, Germany. By measuring the high-density weight, we also measured the condensation on the leaves and substrate. (USB1_K = 10.00 cm gravel roof – USB2_K – USB4_K = 16.10 cm; USB0_O = 8.88 cm; USB2_O = 14.88 cm; USB2_O = 20.88 cm).
Xu et al. [15] used lysimeters to calculate the mean ET of maize (5 mm) in comparison with grass (3 mm) and forest (10 mm). A comparable study with lysimeters was conducted in Norway [16] and reported high retention values in summer in dry periods with low evaporation values.
Weighing lysimeters were developed at the Neubrandenburg University of Applied Sciences in Germany to measure the evapotranspiration of green roofs via scales installed in the roof. Within the framework of the Concepts for urban rainwater management, drainage, and sewage systems (KURAS), the effects of typical extensive roofs on water management were examined and extrapolated to districts, using computational methods. The KURAS project finished in mid-2016. This research project was based on a method developed to measure the effects of additional irrigation and the increase in the substrate structure by means of lysimeters. These effects were extrapolated for buildings to determine their cooling and energy saving potential.
Urban heat islands (UHIs) are created by the heating of building masses and the delayed release of stored heat during nighttime hours. Green roofs can counteract these effects. However, in extensive green roofs, especially in summer, active evaporative cooling is limited because the substrates are predominantly air-dried. Irrigated green roofs allow a greater variety of plants to be used. The use of taller plants, even shrubs, is possible, leading to the formation of “spaces” on roofs. The quality of stay and small climatic effects can be significantly increased by irrigated green roofs, compared to conventional green roofs.
The literature reports a wide range of water retention values, depending on the season, planting, and precipitation intensity, with a normal runoff coefficient (C, a unitless coefficient) between 0.10 and 0.50 and a runoff coefficient of 1.00 in the worst case [17]. Green roofs can fulfill retention functions in all climatic regions of the world [18,19]. Drainage behavior can be measured with large volume tipping buckets. The drainage of green roofs is an important parameter because roofs that store large amounts of water with a delayed release to the sewer system or make it available to the natural water cycle provide many advantages. The recirculation of rainwater into the natural water cycle improves groundwater recharge. Healthy groundwater is created by the infiltration of the accumulating water, which, if it seeps through, can have an active ground level depth of at least 20 to 30 cm. One consequence of this is little water is allowed to drain through dense urban areas.
The adjustment for the regulation of the process, which offers an extensive green roof, are the substrate, the vegetation, and the drainage.
2. Material and Methods
2.1. Study Area And Measurement Stations—Runoff and Lysimeters
This part of the study was conducted on the experimental green roofs of the University of Applied Science Neubrandenburg, Germany (53.56° N, 13.27° E). The total EGR runoff was measured to compare with the lysimetric measurements. This city represents a typical city (population up to 65,000) in Northeast Germany. The city is in the northeastern lowland and has a continental and maritime climate. The annual average precipitation is 558 mm, with a mean temperature of 8.5 °C. In the summertime, the highest average temperature is in July (17.5 °C) and the lowest temperature is in January (−0.7 °C, on average). The growing season lasts for ca. 247 days [20].
2.2. Experimental Setup
The experiments began in the 1980s, with simple water balances and manual calculation. In the 1990s, the development of the first lysimeter for shallow roof layers enabled the quantification of ETa rates in real time. Basically, the extensive green roof media, with a 10 cm soil layer. and the construction underneath were integrated into the green roof surroundings of a real roof (Figure 2).
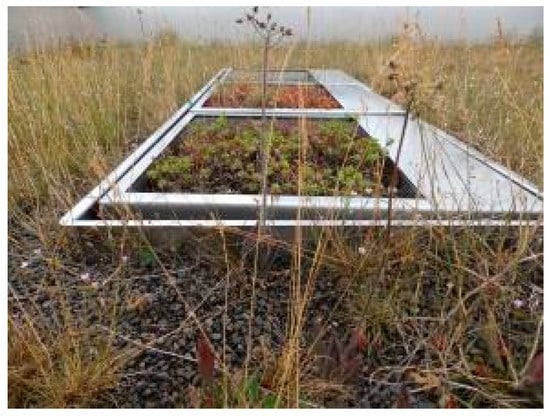
Figure 2.
Lysimeter built in an EGR at the University of Applied Sciences in Neubrandenburg, Germany.
The lysimeters had a measurement field size of about 0.25 m2, with robust balances, a sensitivity of about 1–2 g, and a maximum weight load of 60 kg. These lysimeters were suitable for measuring various types of green roofs and could be used to measure light rain events as well the dew on the vegetation in the morning hours.
2.2.1. Retention
After a rain event, the runoff rainwater flows directly into the tipping bucket (Figure 3). The bucket has a volume of one liter. When the bucket is full (or nearly full), it tilts and triggers a sensor that counts upwards (Figure 4). Thereafter, the other side of the bucket fills and triggers the counting mechanism again. In this way, the number of liters of rainwater running off the roof can be determined during a precipitation event.
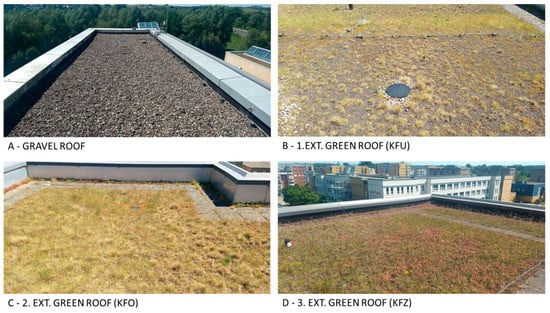
Figure 3.
Measurement fields with dipping buckets underneath the experimental extensive (ext.) green roofs and a reference gravel roof at the University of Applied Sciences in Neubrandenburg, Germany on buildings 2 and 3. The size of the experimental fields varied from 103.5 m2 (gravel roof) up to 206.16 m2. (A) gravel roof with 103.5 m2; (B) EGR with 150 m2 and 10 cm soil depth; (C) EGR with 206.16 m2 and 10 cm soil depth; and (D) EGR with 112.12 m2 field size and 10 cm soil depth. Photos: Kaiser (Table 1).
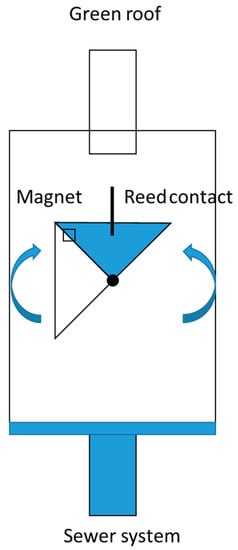
Figure 4.
Schematic diagram of the tipping bucket. The volume of the bucket is one liter. The system is fully integrated into buildings 2 and 3 at the University of Applied Sciences in Neubrandenburg, Germany. Four of the systems were installed (3× green roof, 1× gravel roof).
2.2.2. Measuring ETa with Small-Scale Lysimeters
Small-scale lysimeters work, as the name implies, by recording weight or acceptance. The process is usually conducted via a tilting balance. From the balance, the precipitation retention and evaporation can be calculated. The installed fine scales have an accuracy of 2 g, with a maximum capacity of 60 kg. In this research project, the weighing lysimeter was operated without the tilting scales (Figure 5). The aim of this measurement was to measure the daily evaporation over 24 h, without expiration. In the research project, no waiving tipping buckets were used because the pure evaporation days (no precipitation and no runoff over 24 h/day) were the focus. Technical extension of the measurement station from 4 to 8 lysimeters occurred in the spring of 2017.
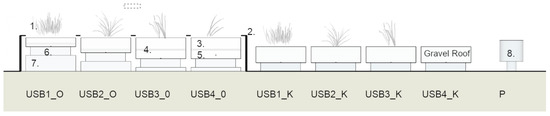
Figure 5.
The small-scale lysimeter station was located on a green roof in Neubrandenburg, Germany. The frame was used to minimize the effects of wind and radiation on the experimental plots. Legend: (1) Vegetation, (2) frame, (3) soil, (4) drainage layer, (5) retention box, (6) scale, (7) substructure, and (8) ombrometer (Table 2).
This setup was located on the roof (ca. 15 m high) of the University of Applied Sciences in Neubrandenburg, Germany. In this setup, different types of EGRs were tested. The slopes of the lysimeters were set to 0°. The dimensions for USB1_O, USB2_O, USB3_O, and USB4_O were 0.5 m2, and 0.25 m2 for USB1_K, USB2_K, USB3_K, and USB4_K (Table 2). For the calculation and comparability, the dimensions were scaled to 1 m2 for all lysimeters. The soil of this installation was the standard soil used for extensive green roofs. USB1-4_K was built in 2014 with a depth of 16 cm and without any drainage. USB1-4_K was built in 2016. The precipitation was measured with an ombrometer with 0.01 mm accuracy (Table 2).

Table 2.
Description and construction of the small scale lysimeters.
The lysimeters were each covered by 60%–95% vegetation with a mixture of Sedum sexangulare, Sedum album, Sedum floriferum, Festuca ovina, Petrorhagia saxifrage, Hieracium aurantiacum, Poa compressa, and some mosses. This is typical for most EGRs in Germany.
2.3. Study Area and Measurement Stations—Heat Reduction with Irrigated EGRs
This part of the study was conducted in Berlin (52.53° N, 13.39° E) at the ufaFabrik. The population of Berlin is ca. 3.57 million and it is also located in Northeast Germany. The annual average precipitation is 570 mm and the average temperature is 9.1 °C. The highest average temperature also occurs in July (18.6 °C) and the coldest month is January (−0.9 °C).
The advantage of this measurement station is the presence of a cistern and a decentralized rainwater system. For irrigation from June until September, part of a green roof (36 m2) was irrigated 8 times daily with 8 L/m2 collected rainwater.
These measurements were recorded in 2017 and 2018. Only the temperature between the soil and the protection mat and the temperature on the vegetation layer was measured in the first year. In the first year, the measurements were recorded with a Log32 TH USB-Datalogger (Airflow Lufttechnik GmbH, 53349, Rheinbach, Germany); temperature and humidity every 5 min, minimum, maximum, and mean. In the second year, the measurements were recorded using two dataloggers (RDXL6SD-USB, OMEGA Engineering, 75392, Deckenpfronn, Germany) Each datalogger used 4 wire thermocouples (tc, type k) and 2 pt100 resistance temperature detectors (type A).
The EGR on the ufaFabrik in Berlin-Templehof was installed in 1990. This irrigation equipment should validate the cooling effect for the café located in this building. Irrigation has a double effect, the vegetation layer grows significantly (twice) better (own calculation) than EGRs without irrigation and the cistern has larger capacities for future precipitation. This larger leaf area index (LAI) evaporates more water, which is caused by the shading of this larger layer, the transpiration effect of the plants (grasses and herbs), and direct evaporation by the wet growing media, than EGRs without irrigation.
The daily irrigation rate is regulated to reduce the runoff from the EGR. The source for the irrigation water is locally collected rainwater. With an annual precipitation of 500 mm and an area of ca. 8000 m2 (roof areas, paved paths, and squares) per year, approximately 4000 m3 of rainwater can be collected. In a sedimentation basin, stones, sand, and mud sink to the ground. Floating particles such as leaves, paper, and wood are caught when they overflow into the second basin.
The superficially purified water is pumped into the plant/soil filter. The substrate of fine expandable slate removes the remaining floating parts. Soil organisms at the roots of reeds, rushes, water lilies, and cattails convert the remaining contaminants into minerals that the plants use as fertilizer. A cistern under the ground filter stores the process water and a pressure booster distributes it to the house for the toilet and irrigation.
3. Results
3.1. Retention of Extensive Green Roofs
Continuous precipitation and runoff measurements were recorded for 47 months (Figure 4). The start of this measurement series was 1 January 2014 and the end was 11 November 2017. The entire data analysis is presented in Figure 6.
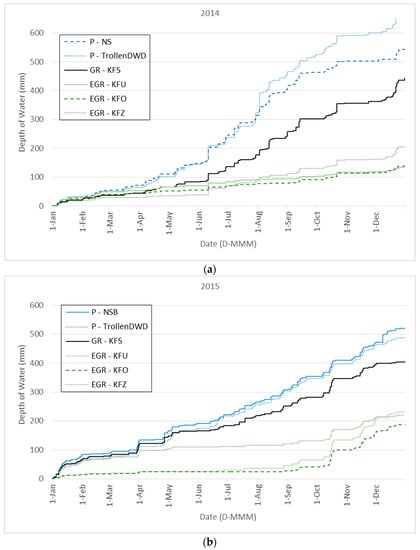
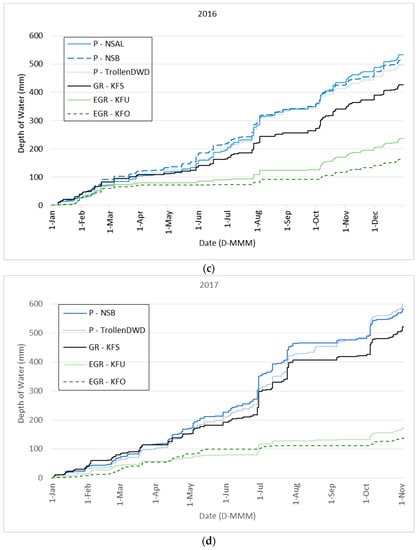
Figure 6.
(a–d). Yearly precipitation (P), runoff of extensive green roofs (EGR), and a reference gravel roof (GR) over a four-year timeline (2014–2017). P - NS, P - NSB, P - NSAL = ombrometers at the University of Applied Sciences in Neubrandenburg, Germany; P - TrollenDWD = official ombrometer at the Airport Neubrandenburg-Trollenhagen (5 km, ID 5109) for reference; GR = reference gravel roof (10 cm depth); EGR - KFU/ EGR - KFO = extensive green roofs on building No. 3 (10 cm depth); EGR - KFZ = extensive green roof on building No. 2 (recycling material, 10 cm depth); ( Blue = precipitation, green = extensive green roofs, black = gravel roof for reference).
The average rainfall for this campaign was 545.23 mm. The years 2015 and 2016 were dryer, with a reduced precipitation of ca. 50 mm. The intensity of the runoff influenced the volume of the tipping bucket. The tipping buckets were calibrated with different runoff intensities. The annual runoff coefficient (runoff/precipitation) for the EGR (Table 1) was lower than the coefficient reported in the literature. The measurements for the KFZ were interrupted in January 2016, so only data from 2014 and 2015 were used for this analysis. The runoff coefficient for the EGRs was between 0.29 and 0.4 (Table 3).
Table 1.
Table of the extensive (Ext.) green roofs and a reference gravel roof for the measurements of water runoff. Every field is equipped with a dipping bucket and is based at the campus of the university on two buildings (No. 2 and No. 3).
Table 3.
Runoff coefficient of the EGRs and the gravel roof. The measurements for No. 3 (KFZ) were not available for 2016 and 2017.
3.2. ETa in the Growing Season
During the vegetation period from 2014 to 2017, the three EGRs showed a runoff between 8% and 26% on the extensively vegetated experimental roof areas, with a precipitation of between 231 and 391 mm during the vegetation period. The bandwidth of the runoff of the gravel roof ranged from 65% to 81% during the growing season (Table 4).
Table 4.
Measurements of the runoff coefficients in the growing period (1 April to 31 September). Up to 90% of the precipitation was removed by evapotranspiration.
Figure 4 shows that very few drainage events occurred in the vegetation period on the extensive green roofs. For a large part of the vegetation period, the green roofs evaporated 100% of the precipitation. The potential evaporation capacity was much higher than the ETa through the leakage of available water.
3.3. Effect of Irrigation
In July 2018, an irrigation period occurred. This process was repeated three times. A decrease in daily evaporation was observed. The systems were saturated at 37.5 L/m2. The first irrigation was conducted on 24 July 2018. The roof greening systems were completely dried out and the daily evaporation capacity was at a maximum of 0.5 L/m2 per day. Over a period of seven days until the next irrigation, the evaporation performance significantly decreased. The second irrigation (Figure 7), on 7 August 2018, showed a significant decrease in daily evapotranspiration (ETa) over a period of 14 days. The daily evaporation line reduced from up to 5 L/m2 to almost 2 L/m2 day within 14 days. The third irrigation, on 22 August 2018, allowed consideration of the daily ETa over a period of 30 days with high late summer temperatures and very little rainfall. The runoff coefficients of the seven green roofs were between 0.00 and 0.55 and for the gravel roof, the runoff coefficient was 0.94.
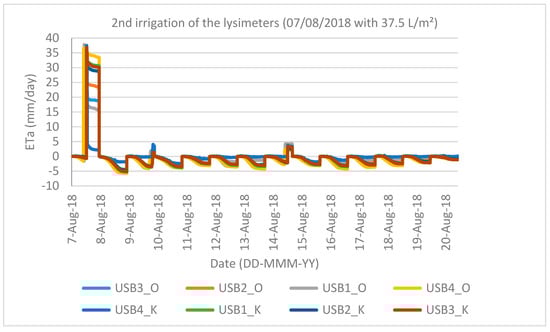
Figure 7.
Decrease in the ETa after the second irrigation on 7 August 2018. All systems except USB4_K were fully saturated.
3.4. ET After Defined Irrigation Experiments in 2018
Three repeated irrigations, with a maximum rate of 37.5 L/m2, were conducted on the dry summer green roof lysimeter in July/August 2018. The period between 24 July and 20 August had an average temperature of 22.4 °C, which was the peak summer temperature during the long-term measurements. The retention rates are documented in Table 3. The green roof and the reference gravel roof were saturated with water three times in July and August 2018. Each time, a total amount of 37.51 L/m2 water was used. The period between 24 July and 20 August, 2018 was an especially warm and dry period. During this time period, there was only 3.6 mm of precipitation. The daily average temperature was between 19.4 and 28.2 °C (Ø 22.4 °C). The water retention capacities of the different EGRs during this period are shown in Table 5.
Table 5.
Water retention after three irrigations with 37.5 L/m2 (period: 24 July–20 August 2018).
3.5. Correlation of ET with Water Content of Growing Media
The first irrigation was conducted on 24 July 2018. The green roof system was completely dried out and the daily evaporation capacity (ETa) was a maximum of 0.5 L/m2 per day. Over a period of seven days, until the next watering of the roof, a significant decrease in the evaporation capacity occurred. The second irrigation was conducted on 7 August 2018. A noticeable decrease in the daily ETa was observed over a 14 day timespan (Figure 5). During this time, the ETa decreased from 5 L/m2/day (e.g., USB4_O, 8 August 2018) to almost 2 L/m2/day. The third watering was conducted on 22 August, 2019. This allowed us to view of the daily ETa over a time span of 30 days with high late-summer temperatures and very little precipitation. The daily evaporation supported the necessity for an additional irrigation. If the goal is to maintain the ETa at an almost maximum level, daily irrigation should be provided for roof structures under 10 cm deep. For green roof systems with 16 cm of substrate or even those built in retention bodies with a capillary rise, it is possible to increase the irrigation interval. In seven days, a roof with a thin layer of substrate (8 cm) reduced the ETa from 4.3 to 1.7 L/m2. Systems with a thicker layer of substrate (16 cm) need intense and longer irrigation intervals. A 3.5 cm water retention level in a retention box with an integrated capillary rise to the substrate allowed a better ETa over a longer period of time (Figure 8).
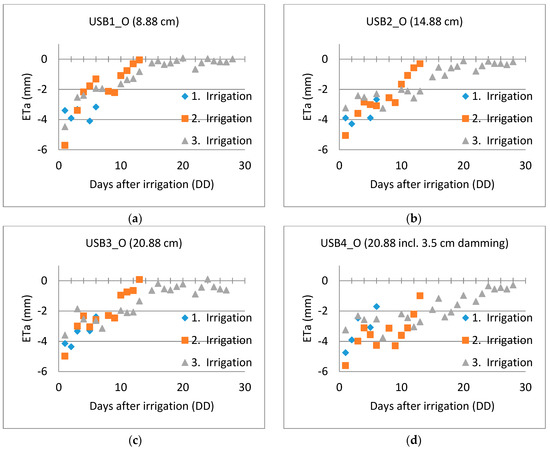
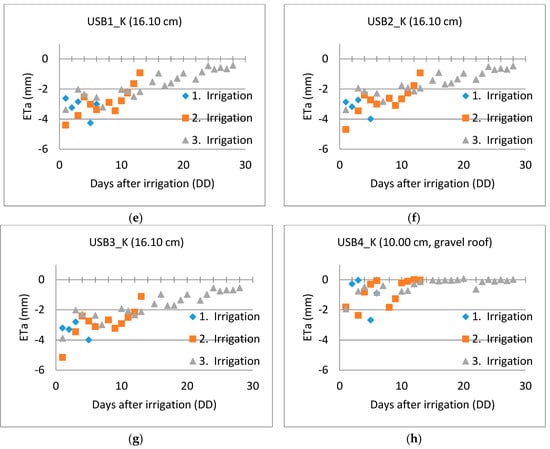
Figure 8.
(a–h). Decrease in the daily ETa after the three irrigation periods. Systems with higher substrate and/or insulation levels will have a longer ETa over time. (a) USB1_O = EGR with 8.88 cm soil depth; (b) USB2_O = EGR with 14.88 cm soil depth; (c) USB3_O = EGR with 20.88 cm soil depth; (d) USB4_O = EGR with 20.88 cm soil depth; (e–g) USB1_K, USB2_K, USB3_K = EGR with 16.10 cm soil depth; USB4_K = reference gravel roof with 10.00 cm depth.
3.6. Reduction of ETa After Active Irrigation
In this campaign, irrigation with 37.5 L/m2 was associated with a near-zero level of precipitation. The climate was warm and dry. The EGR with a shallow soil depth (USB1_O) was dry after one to two days. EGRs with a retention box and a damming width of 3.5 cm in the retention box, or systems with a soil depth of up to 16 cm, showed a high ETa over a long period. In these systems, daily irrigation was not required. To maximize the ETa for USB1_O, USB3_O, and USB3_O, it was necessary use short irrigation intervals (Figure 9).
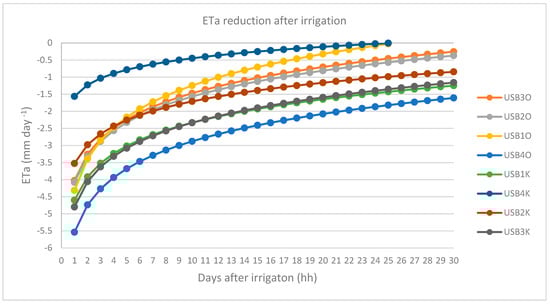
Figure 9.
Logarithmic representation of the daily evaporation performance of irrigated green roofs over a period of 30 days.
3.7. Reduction of Surface Temperature by Irrigation on a Real EGR
An additional temperature reduction at the waterproof membrane and at the surface on the substrate by irrigated green roofs, especially in summer, was obvious. In dry and warm periods, a green roof cannot fully provide its benefits, especially if it is completely dry. In the worst case, summer heat stress has a negative effect on green roofs. Night-time cooling is hampered by the increased thermal storage capacity of dry green roofs and the loss of adiabatic cooling. The summer temperature reduction was measured in 2017 and 2018 on the roof of the ufaFabrik (Berlin).
Additional irrigation with precipitation water from a cistern could reduce the temperature significantly, by up to 10 °C at the surface and up to 4 °C, on average, at the roof waterproofing. The result of irrigation is a lower heat load on the building (Figure 10).
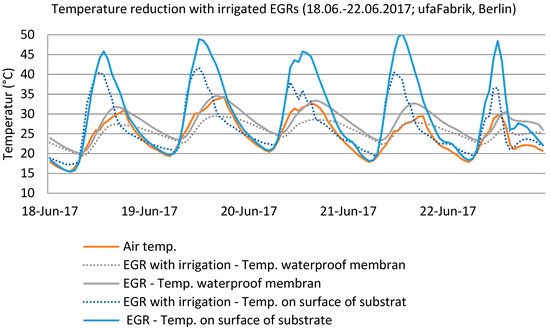
Figure 10.
Temperature measurements of 10 cm deep irrigated and conventional EGRs at the ufaFabrik in Berlin (red = air temperature, green dotted line = temperature at the waterproof membrane with irrigation, green = temperature at the waterproof membrane without irrigation, blue dotted line = temperature at the surface of the vegetation with irrigation, blue = temperature at the surface of the vegetation without irrigation).
Special attention should be paid to the vegetation in this context, because it plays an important role. Irrigation allows plants with a higher ETa to dominate.
After two years of additional irrigation, mainly vetches (Vicia sp.) and grasses (Poaceae) dominated the trial areas on the ufaFabrik (Table 6). The vegetation cover, which grew up to 50 cm high, also cooled higher air layers. In extreme heat periods, a decrease in the air temperature, measured at a height of 50 cm above the substrate, led to 18 °C cooler air. A temperature reduction at a height of 100 cm could not be measured in this experiment. The surface of the experimental setup (36 m2 green roof with irrigation) was too small and, at this altitude, the cool air caused by evaporation was blown away more quickly.
Table 6.
Comparison of plant height and vegetation mass on a conventional EGR and an irrigated EGR for 1 m2. The irrigated EGR got 5 L/m2/day in the vegetation period over 2 years. The green roof was located at the ufaFabrik, Berlin.
4. Discussion
The analysis shows that EGRs can retain much of the annual precipitation (Figure 4). Approximately 60%–70% of the total precipitation evaporated on site and had a cooling effect in places with continuing dry periods in Northern Germany, such as that in 2018. Further investigations of the run-off behavior of heavy rainfall events with additional irrigation need to be conducted through a combination of large-scale field tests (Figure 2) and small-scale lysimeters (Figure 3).
Our study also shows that irrigated green roofs increase the ETa. The thin-layered types require a shorter irrigation interval. Irrigation is particularly useful during warm and low-precipitation periods. When using collected rainwater, local decentralized rainwater management can be used to provide additional irrigation capacity.
The temperature measurements showed reductions at different heights. The vegetation of the irrigated roof grew significantly higher and formed an additional wind buffer on the roof. However, longer measuring campaigns are necessary to provide quantifiable statements. Regarding an environmental discussion, irrigated green roofs are one solution to mitigate UHIs. Thus, they have positive effects in contrast to all technical cooling systems.
With increased biomass on irrigated EGRs and the irrigation system itself, the mainenace costs for EGRs increase. Conventional EGR requires maintenance one to two times a year. EGRs with irrigation require a permanent security system. The system should also be automated. The irrigation system should stop up to three days before the next rainfall so the potential water capacity in the soil of the EGR is high. Such a biomass layer needs more maintenance than typical EGRs; otherwise, in autumn, a dry meadow will decompose on the roofs.
The other need is a source of local rainwater. This means such structures are suitable in Europe, with rain events captured in cisterns. EGRs of this type have become basic elements of rainwater concepts in cities.
EGRs do not have a high thermal insulation effect. Related to the importance of phase change and ETa on a shallow layer of about 10 cm of growing media, the thermal impact was calculated on a one-year database. As a reference temperature, the temperature of the inside of the building was also measured for one year. The effect of such an EGR were calculated to be energetic savings of about 4% of the winter temperature needs [21].
5. Conclusions
We focused on the ETa of existing extensive green roofs and the effect of irrigation systems installed in Neubrandenburg and Berlin (Germany). The main conclusions that can be drawn from the present results are as follows:
- (1)
- Older EGRs (more than 10 years old) with a substrate depth of 10 cm can reduce the average annual runoff by up to 70%.
- (2)
- In the vegetation period, EGRs can reduce the runoff by up to 90%. The potential ET (ETP) is higher than the ETa.
- (3)
- EGRs with a lower substrate depth need a shorter irrigation interval if the maximum ETa is required.
- (4)
- EGRs with retention modules, damming, and capillary rise can lead to a high ETa over a long period of time.
- (5)
- In dry summers, irrigated EGRs can reduce the temperature of the waterproof membrane between the building and the green roof by up to 5 °C and on the vegetation layer by up to 10 °C, in comparison with a non-irrigated EGR.
- (6)
- Measuring the runoff coefficient with a small-scale lysimeter is not recommended. The “flowerpot effect” [22] on these small experimental fields is too high.
- (7)
- Measuring the runoff of EGRs requires an experimental field larger than 50 m2 to be built.
Evapotranspiration can be increased using the measures discussed. From this, recommendations for urban politics can be derived. The investigations conducted in this study were conducted on a typical EGR. However, given the required improvements in blue-green infrastructure, the roof areas provide opportunities that have not yet been fully exploited, such as summer cooling and rainwater management in cities with space shortages. Further detailed measurements with the irrigated lysimeters are recommended to quantify the effect of the green roofs over a longer time period. In addition, temperature measurements with an irrigation system with longer measurement rows are needed.
Author Contributions
Conceptualization, D.K.; Data curation, D.K.; Investigation, D.K., M.S., and F.W.; Project administration, M.K.; Writing—original draft, D.K.; Writing—review & editing, D.K. and F.W.; English Editor, Emma O’Connor.
Funding
The research equipped was financed by the regular scientific finance of the UAS, Neubrandenburg. The personal resources by Bundesinstitut für Bau-,Stadt und Raumforschung, Bundesamt für Bauwesen und Raumordnung, Forschungsinitiative “Zukunft Bau”, Grant number SWD-10.08.18.7-16.41.
Acknowledgments
We thank Werner Wiartalla from the ufaFabrik in Berlin for letting us use the EGRs in this area for the temperature measurements, Kolja Klaue and Philipp Engel for building and maintaining the measurement station at the UAS, Neubrandenburg. The company Optigrün for supporting us with common products of EGRs. We express our appreciation for being able to use the experimental EGRs and the technical support by the University of Applied Sciences of Neubrandenburg.
Conflicts of Interest
The authors declare no conflict of interest.
References
- Kravčík, M.; Pokorný, J.; Kohutiar, J.; Kováč, M.; Tóth, E. Water for the Recovery of the Climate-A New Water Paradigm; Publisher Municipalia: 2007. Available online: http://www.waterparadigm.org/ (accessed on 1 June 2019).
- Horton, R.E. Rainfall interception. Mon. Weather Rev. 1919, 47, 603–623. [Google Scholar] [CrossRef]
- Penman, H.L. Vegetation and Hydrology, Technical Communications 53, Com-monwealth Bureau of Soils; Commonwealth Agricultural Bureaux: Harpenden, UK, 1963; p. 124. [Google Scholar]
- Bosch, J.M.; Hewlett, J.D. A review of catchment experiments to determinethe effect of vegetation changes on water yield and evapotranspiration. J. Hydrol. 1982, 55, 3–23. [Google Scholar] [CrossRef]
- Lund, J.W. Direct Heat Utilization of Geothermal Resources Worldwide. In Power Stations Using Locally Available Energy Sources; Bd., 9; Bronicki, L.Y., Ed.; Springer: New York, NY, USA, 2018; pp. 297–325. [Google Scholar]
- Oberndorfer, E.; Lundholm, J.; Brass, B.; Coffmann, R.; Doshi, H.; Dunnett, N.; Gaffin, S.; Köhler, M.; Liu, K.; Rowe, B. Green Roofs as Urban Ecosystems: Ecological Structures, Functions, and Services. Bioscience 2007, 57, 823–833. [Google Scholar] [CrossRef]
- Akther, M.; He, J.; Chu, A.; Huang, J.; Duin, B. A Review of Green Roof Applications for Managing Urban Stormwater in Different Climatic Zones. Sustainability 2018, 10, 2864. [Google Scholar] [CrossRef]
- Lösken, G.; Ansel, W.; Backhaus, T.; Bartel, Y.C.; Bornholdt, H.; Bott, P.; Henze, M.; Hokema, J.; Köhler, M.; Krupka, B.W.; et al. Dachbegrünungsrichtlinien—Richtlinien für Planung, Bau und Instandhaltung von Dachbegrünungen—Ausgabe 2018; FLL, Ed.; FLL: Bonn, Germany, 2018. [Google Scholar]
- Heusinger, J.; Sailor, D.; Weber, S. Modeling the reduction of urban excess heat by green roofs with respect to different irrigation scenarios. Build. Environ. 2018, 131, 174–183. [Google Scholar] [CrossRef]
- Wong Gwendolyn, K.L.; Jim, C.Y. Identifying keystone meteorological factors of green-roof stormwater retention to inform design and planning. Landsc. Urban Plan. 2015, 143, 173–182. [Google Scholar] [CrossRef]
- Saaroni, H.; Amorim, J.H.; Hiemstra, J.A.; Pearlmutter, D. Urban Green Infrastructure as a tool for urban heat mitigation: Survey of research methodologies and findings across different climatic regions. Urban Clim. 2018, 24, 94–110. [Google Scholar] [CrossRef]
- Zhou, D.M.; Liu, Y.X.; Hu, S.S.; Hu, D.Y.; Neto, S.; Zhang, Y. Assessing the hydrological behaviour of large-scale potential green roofs retrofitting scenarios in Beijing. Urban For. Urban Green. 2019, 40, 105–113. [Google Scholar] [CrossRef]
- Francis, L.F.M.; Jensen, M.B. Benefits of green roofs: A systematic review of the evidence for three ecosystem services. Urban For. Urban Green 2017, 28, 167–176. [Google Scholar] [CrossRef]
- Azeñas, V.; Cuxart, J.; Picos, R.; Medrano, H.; Simó, G.; López-Grifol, A.; Gulías, J. Thermal regulation capacity of a green roof system in the mediterranean region: The effects of vegetation and irrigation level. Energy Build. 2018, 164, 226–238. [Google Scholar] [CrossRef]
- Xu, G.P.; Xue, X.Z.; Wang, P.; Yang, Z.S.; Yuan, W.Y.; Liu, X.F.; Lou, C.J. A lysimeter study for the effects of different canopy sizes on evapotranspiration and crop coefficient of summer maize. Agric. Water Manag. 2018, 208, 1–6. [Google Scholar] [CrossRef]
- Johannessen, B.; Muthanna, T.; Braskerud, B. Detention and Retention Behavior of Four Extensive Green Roofs in Three Nordic Climate Zones. Water 2018, 10, 671. [Google Scholar] [CrossRef]
- Johannessen, B.G.; Hanslin, H.M.; Muthanna, T. Merete Green roof performance potential in cold and wet regions. Ecol. Eng. 2017, 106, 436–447. [Google Scholar] [CrossRef]
- Viola, F.; Hellies, M.; Deidda, R. Retention performance of green roofs in representative climates worldwide. J. Hydrol. 2017, 553, 763–772. [Google Scholar] [CrossRef]
- Cipolla, S.S.; Altobelli, M.; Maglionico, M. Decentralized Water Management: Rainwater Harvesting, Greywater Reuse and Green Roofs within the GST4Water Project. Proceedings 2018, 2, 673. [Google Scholar] [CrossRef]
- CLIMATE-DATA.ORG. Klima Neubrandenburg. Online Verfügbar Unter. Available online: https://de.climate-data.org/europa/deutschland/mecklenburg-vorpommern/neubrandenburg-9287/ (accessed on 13 May 2019).
- Köhler, M.; Malorny, W. Wärmeschutz durch extensive Gründächer. In Europäischer Sanierungskalender 2009; Venzmer, H., Ed.; Beuth: Berlin, Germany, 2009; pp. 195–212. ISBN 978-3-410-16871-3. [Google Scholar]
- Fisher, J.B.; Whittaker, R.J.; Malhi, Y. ET come home: Potential evapotranspiration in geographical ecology. Glob. Ecol. Biogeogr. 2011, 20, 1–18. [Google Scholar] [CrossRef]


© 2019 by the authors. Licensee MDPI, Basel, Switzerland. This article is an open access article distributed under the terms and conditions of the Creative Commons Attribution (CC BY) license (http://creativecommons.org/licenses/by/4.0/).