Article

A Blockchain-Integrated IoT–BIM Platform for Real-Time Carbon Monitoring in Modular Integrated Construction

1
The Hong Kong Polytechnic University Shenzhen Research Institute, Shenzhen 518000, China
2
Department of Building and Real Estate, The Hong Kong Polytechnic University, Hong Kong, China
3
CI3 Lab, Department of Civil Engineering, The University of Hong Kong, Hong Kong SAR, China
4
The Hong Kong Polytechnic University, Hong Kong, China
*
Author to whom correspondence should be addressed.
Buildings 2026, 16(8), 1587; https://doi.org/10.3390/buildings16081587
Submission received: 1 March 2026 / Revised: 28 March 2026 / Accepted: 13 April 2026 / Published: 17 April 2026

Abstract

Modular integrated construction (MiC) is an innovative construction method that shifts on-site activities to a controlled factory environment, thereby offering sustainability benefits. However, current carbon management relies on labor-intensive manual data collection, causing delayed and inaccurate carbon accounting that increases greenwashing risks. Existing approaches lack real-time, automated, and trustworthy carbon tracking capabilities across fragmented supply chains. This study develops and validates the Blockchain-enabled IoT-BIM Platform (BIBP), which combines Internet of Things (IoT), Building Information Modeling (BIM), and blockchain for real-time carbon monitoring. IoT sensors automate data capture from construction equipment and BIM provides spatial visualization of carbon at the module and building levels. A Hyperledger Fabric blockchain ensures the authenticity, immutability, and traceability of carbon records. Validated on a 15-story MiC project in Hong Kong, BIBP established a cradle-to-end-of-construction baseline of 949.84 kgCO2e/m2, identifying steel and concrete as the primary hotspots (80% of material emissions). Real-time analytics demonstrated that combining high-volume ground granulated blast furnace slag (GGBS) concrete substitution, new energy sea–land multimodal transport, and 10% steel waste reduction achieves over 20% carbon savings. Furthermore, the BIBP automated data acquisition and calculation, improving assessment efficiency by 92.4%. The platform demonstrates the potential to transform carbon management from a static, retrospective evaluation into a proactive, data-driven monitoring process, equipping stakeholders with a tool to dynamically track emissions and make timely interventions toward carbon reduction targets.

1. Introduction

The construction sector serves as a cornerstone of the global economy. However, it simultaneously imposes significant environmental burdens, contributing approximately 39% of energy-related carbon dioxide emissions worldwide [1]. MiC (the lowercase “i” follows the naming convention established by the Hong Kong Construction Industry Council and the Development Bureau) is an approach that emphasizes off-site prefabrication and on-site assembly and has emerged as a promising paradigm to reduce carbon emissions. By shifting most construction activities to controlled factory environments, MiC offers advantages including enhanced production efficiency, superior quality control, and reduced material waste [2,3].
While sustainability in construction covers environmental, economic, and social dimensions, carbon emissions have become a primary regulatory and industry focus. Regulatory frameworks such as Hong Kong’s Climate Action Plan 2050, China’s dual-carbon policy targeting carbon peaking by 2030 and carbon neutrality by 2060, and the EU Corporate Sustainability Reporting Directive have established carbon emissions as a mandatory reporting metric for construction projects [4,5]. In practice, construction stakeholders currently lack automated tools for lifecycle carbon tracking across fragmented supply chains, relying instead on manual estimation methods that are error-prone and difficult to audit. This study addresses this gap by focusing on carbon management as a critical and immediate entry point. The proposed platform architecture is designed with extensibility to accommodate additional sustainability indicators. The IoT sensing infrastructure can capture water consumption and waste generation data, the BIM integration layer can map these indicators to building components, and the blockchain verification mechanism can ensure data integrity for any quantifiable metric. This extensibility enables the platform to evolve toward integrated sustainability assessment as regulatory requirements expand.
Effective carbon management in MiC requires accurate estimation and continuous monitoring throughout project delivery. As buildings become increasingly energy-efficient in their operational phase, the relative significance of embodied carbon (EC) generated during manufacturing and construction continues to grow [6,7]. This trend is particularly pronounced in modular buildings, where double-wall and double-floor systems further elevate the EC baseline [8]. Despite this imperative, current carbon assessment methods rely on static data and retrospective calculations [9]. These conventional approaches estimate emissions based on material quantities after project completion, thereby ignoring the dynamic energy consumption of construction equipment, transportation fleets, and assembly machinery. Furthermore, data collection heavily depends on manual recording and paper-based documentation. This process is inherently prone to severe delays and inconsistencies [10]. MiC involves a highly fragmented supply chain with multiple stakeholders across different regions. This fragmentation prevents transparent data sharing. The lack of reliable and traceable data recording mechanisms undermines the trustworthiness of carbon auditing. It exposes the industry to greenwashing risks, where practitioners manipulate emission records to meet regulatory standards. Consequently, the sector lacks an automated, secure, and transparent system to monitor dynamic carbon activities across the entire supply chain [11,12].
To address these critical gaps, this study develops an integrated platform combining IoT, BIM, and blockchain technologies to dynamically monitor carbon emissions in MiC projects. Specifically, few studies have simultaneously integrated IoT sensing, BIM-based spatial visualization, and blockchain-secured data provenance into a unified platform tailored for the cradle-to-end-of-construction boundary of MiC.
This research fulfills three specific objectives: (1) to design a blockchain-enabled platform to automatically capture, transmit, and secure real-time carbon data; (2) to quantify the effectiveness of targeted carbon reduction strategies based on monitoring results; (3) to validate the proposed system architecture and calculation models through a real-world high-rise modular building project.
This study makes three categories of contributions. Theoretically, it advances the cyber-physical system (CPS) paradigm by establishing a formal framework for real-time carbon monitoring in construction, bridging the gap between physical sensing infrastructure and computational sustainability models. Technically, it delivers a deployed, integrated platform (BIBP) that unifies IoT sensing, BIM-based spatial tracking, and blockchain-secured provenance. Empirically, it provides quantified EC data from a large-scale MiC implementation, generating replicable benchmarks for the sector.

2. Literature Review

2.1. Life Cycle Assessment in MiC

Life Cycle Assessment (LCA) in construction follows the EN 15978 standard [13], which defines the “cradle-to-end-of-construction” (corresponding to Modules A1–A5 in EN 15978) boundary as a critical phase for evaluating EC. This boundary covers raw material extraction, component manufacturing, logistics, and on-site assembly [14,15]. Within this framework, process-based LCA (PLCA) serves as the primary analytical strategy for project-level assessments due to its granular, bottom-up approach [15,16]. However, a critical examination of existing PLCA applications reveals three systemic limitations that collectively undermine its reliability for MiC projects. Table 1 summarizes a comparison of representative studies on LCA in modular construction.
The first limitation is the inconsistency of comparative findings due to narrow structural scope. Researchers commonly use PLCA to compare the carbon reduction potential of modular construction with conventional methods. Current findings show high variability. Several studies report significant EC reductions ranging from 34% to 73.1% in low-rise timber and steel modular buildings [17,18,19]. Conversely, modular concrete buildings show lower reduction efficiencies [20,21], while some modular projects even report increased EC [22]. This inconsistency largely stems from the concentration of research on low-rise structures. High-rise modular buildings require high-performance materials and involve transporting massive volumetric modules weighing up to 30 tons.
The second limitation is the inherent static bias of current estimation methods. PLCA quantifies environmental impacts by multiplying specific activity data by corresponding carbon emission factors. However, PLCA currently relies heavily on static, material-based estimation methods. Acquiring accurate activity data remains challenging, as early-stage paper documents, architectural drawings, and bills of quantities are often limited in scope [9]. Data provided by contractors in fragmented construction settings is frequently incomplete and inaccurate. This material-based approach treats construction as a static assembly of parts, fundamentally overlooking the dynamic, energy-intensive activities that define MiC processes, including factory manufacturing, heavy-duty logistics, and crane-assisted assembly.
The third limitation is the uncertainty introduced by inconsistent emission factor databases. The selection of carbon emission factors introduces significant uncertainty. Assessors rely on various databases, such as Ecoinvent and ICE (Inventory of Carbon and Energy), which differ substantially in granularity and regional representativeness. Using different databases or adopting foreign factors for local projects causes severe assessment errors due to regional variations in manufacturing processes and energy grid composition [23,24]. In China, the development of localized databases remains inadequate for comprehensive building assessment. While domestic tools like the Chinese Life Cycle Database (CLCD) and the national standard GB/T 51366-2019 [25] provide baseline data, they lack the flexibility to accommodate diverse engineering scenarios. For example, GB/T 51366-2019 provides factors for only C30 and C50 concrete, omitting the specific material proportions required for other concrete grades used in practice. This inflexibility directly compromises the reliability of EC calculations.
These three limitations converge to produce a fundamental methodological gap. Conventional methods depend on the manual collection of operational data [10]. This manual process is slow, fragmented, and prone to human error. In MiC, the manufacturing, transportation, and lifting of heavy volumetric modules involve complex machinery operations. Material-based estimations fail to capture these processes accurately. The energy consumed by a factory assembly line or the fuel burned by specialized heavy-duty transport vehicles cannot be derived from material weights alone. The static nature of these calculations prevents project managers from understanding the real-time carbon footprint of ongoing activities. Consequently, practitioners lack the data necessary to implement timely interventions or optimize operational parameters during the construction phase. This analysis shows that the field requires a clear shift from static estimations to dynamic, activity-based monitoring systems that capture the true operational realities of modern construction methods.
Table 1. Comparison of representative studies on LCA in modular construction.
StudiesResearch FocusLimitations
Quale and Talbot [18], Pervez et al. [19]Carbon reduction potential in low-rise timber and steel modular buildingsHigh-rise structures and the transportation impacts of massive volumetric modules.
Omar et al. [20], Wen et al. [21], Aye et al. [22]Embodied carbon assessment in modular concrete buildingsDynamic construction activities; relies on static, material-based estimations.
Yu et al. [9], Olawumi et al. [10]Project-level process-based LCA data acquisitionAutomated operational data capture; depends on slow, fragmented manual logging.
Chastas et al. [23], Takano et al. [24]Application of international emission factor databases (Ecoinvent, ICE)Localized data flexibility and precise material proportions for diverse regional scenarios.

2.2. Digital Technologies for Carbon Management

The construction industry increasingly adopts digital technologies to overcome the limitations identified above. Three primary technologies, BIM, IoT, and blockchain, offer complementary but individually insufficient capabilities for transitioning to dynamic, real-time carbon management. The analytical question is not whether each technology is useful in isolation, but whether their integration can address the systemic limitations of conventional PLCA.

2.2.1. Building Information Modeling

BIM serves as the foundational digital repository for building data. It transitions architectural design from two-dimensional drawings to three-dimensional, data-rich digital representations. In the context of carbon management, BIM enables researchers to integrate life-cycle carbon emissions data directly into the design phase. By attaching carbon emission factors to specific material volumes within the model, stakeholders can assess and compare the environmental impact of different design alternatives before construction begins [26]. Furthermore, BIM provides the spatial framework necessary to map physical construction activities to specific building components. For MiC, BIM is particularly valuable for planning complex logistics and assembly sequences, enabling precise forecasting of carbon emissions associated with module production, transportation, and installation [27]. Despite these strengths, BIM alone cannot resolve the static bias identified in Section 2.1. It excels at pre-construction forecasting and static data integration but cannot capture the dynamic, real-world operational data generated during the actual construction process [28]. To function as a real-time monitoring system, BIM requires integration with active data collection technologies.

2.2.2. Internet of Things

IoT addresses the static limitations of BIM by providing the hardware infrastructure for real-time data acquisition. IoT networks consist of interconnected physical devices, such as sensors, Radio Frequency Identification (RFID) tags, and smart meters, deployed directly on the construction site or within the manufacturing factory. These devices automatically capture granular operational data, replacing traditional manual logging methods. For example, RFID tags can track the real-time location and transportation status of individual building modules across the supply chain [29]. Sensors attached to heavy machinery, such as cranes and transport vehicles, can precisely record active engine operation times and fuel consumption rates. Smart meters can continuously monitor the electricity usage of factory assembly lines. By transmitting this raw telemetry data continuously, IoT enables the calculation of actual, activity-based carbon emissions rather than relying on theoretical material-based estimates. However, IoT resolves only the data acquisition challenge. It does not address the data integrity problem inherent in fragmented MiC supply chains, where multiple independent stakeholders have conflicting incentives regarding carbon reporting accuracy.

2.2.3. Blockchain Technology

Blockchain addresses the trust and integrity gaps that IoT and BIM cannot resolve independently. MiC involves a highly fragmented supply chain with multiple independent stakeholders, including off-site manufacturers, logistics providers, and on-site contractors. This fragmentation creates significant trust issues regarding the accuracy and reporting of carbon emissions, leading to risks of greenwashing or data manipulation to meet regulatory targets. Blockchain operates as a decentralized, distributed ledger. When IoT sensors transmit carbon data, the system records these transactions into time-stamped, cryptographically secured blocks [30]. Once recorded, the data becomes immutable; no single party can alter or delete the historical emission records. This self-validating architecture eliminates the need for central authorities or manual auditing, ensuring that all stakeholders share a single, verifiable version of the truth [31,32]. By securing the data provenance from the factory floor to the final assembly site, blockchain establishes the necessary trust framework for transparent carbon reporting and potential integration with carbon credit trading markets [33]. Nevertheless, blockchain alone provides no mechanism for data collection or spatial visualization, confirming that no single technology can independently deliver a complete carbon monitoring solution.
The analysis across Section 2.1 and Section 2.2 demonstrates that the limitations of conventional PLCA are methodological and systemic. No individual digital technology can resolve them in isolation. A holistic integration of BIM (spatial modeling), IoT (real-time data acquisition), and blockchain (data integrity assurance) can address the full spectrum of identified limitations. This conclusion directly motivates the research gaps formalized in Section 2.3.

2.3. Research Gaps

The preceding review identifies three research gaps.
The first gap is that current LCA approaches predominantly use static, material-based calculations and retrospective evaluations. These conventional methods estimate EC based on quantities defined in blueprints after project completion. They overlook the dynamic, energy-intensive activities inherent in MiC, including complex factory manufacturing, heavy-duty logistics, and on-site assembly. The field lacks dynamic, activity-based estimation models capable of accurately capturing real-time carbon emissions throughout the cradle-to-end-of-construction phase.
Second, existing data acquisition processes for carbon monitoring rely heavily on manual logging and fragmented documentation. This manual methodology introduces severe time delays, human errors, and data inconsistencies. Current research highlights a significant deficiency in automated mechanisms for continuous data capture. The industry requires intelligent sensing technologies to autonomously extract high-frequency operational data, such as exact machinery operation times and fuel consumption, directly from distributed construction sites and manufacturing facilities.
Third, MiC operates within a fragmented supply chain involving multiple independent stakeholders. Current digital solutions function as isolated silos, lacking secure mechanisms for transparent data sharing. This fragmentation exposes the industry to data manipulation and greenwashing risks. A critical research gap exists in the holistic integration of BIM, IoT, and blockchain technology into a unified platform. Few studies provide a comprehensive framework that simultaneously ensures automated data collection, spatial visualization, and immutable record-keeping tailored for MiC.
Beyond these technical gaps, a regulatory and practical perspective reveals additional barriers to adoption. Emerging carbon reporting mandates, including the Hong Kong Environmental Protection Department carbon audit guidelines, and China’s mandatory carbon trading scheme for the construction sector are creating increasing regulatory pressure for real-time carbon monitoring capabilities [5,34,35]. However, construction companies have been slow to adopt such systems due to several practical constraints: high upfront investment in sensing hardware and digital infrastructure, technical complexity requiring specialized IT expertise rarely available in construction firms, the absence of industry-wide interoperability standards for carbon data exchange across fragmented supply chains, and data privacy concerns among independent stakeholders who are reluctant to share operational information [36]. The proposed BIBP addresses these barriers through low-cost passive RFID and IoT sensors to reduce hardware investment, containerized cloud deployment to minimize the need for in-house IT infrastructure, industry foundation classes (IFC)-compliant data structures to ensure interoperability, and channel-based blockchain data isolation to protect stakeholder privacy while enabling shared verification.

3. System Architecture Design

3.1. Design of the Proposed Platform

This study proposes an integrated CPS designed for real-time estimation and continuous monitoring of EC for MiC projects. The methodological design is grounded in two theoretical foundations.
First, the system follows the CPS paradigm, in which physical processes are tightly coupled with computational algorithms through continuous feedback loops. This paradigm is formally expressed as follows:
S   =   P ,   C ,   Φ
where P represents the physical processes (manufacturing, transportation, installation), C denotes the computational models (BIM representations, emission algorithms), and Φ encapsulates the feedback mapping functions governing cyber-physical interactions.
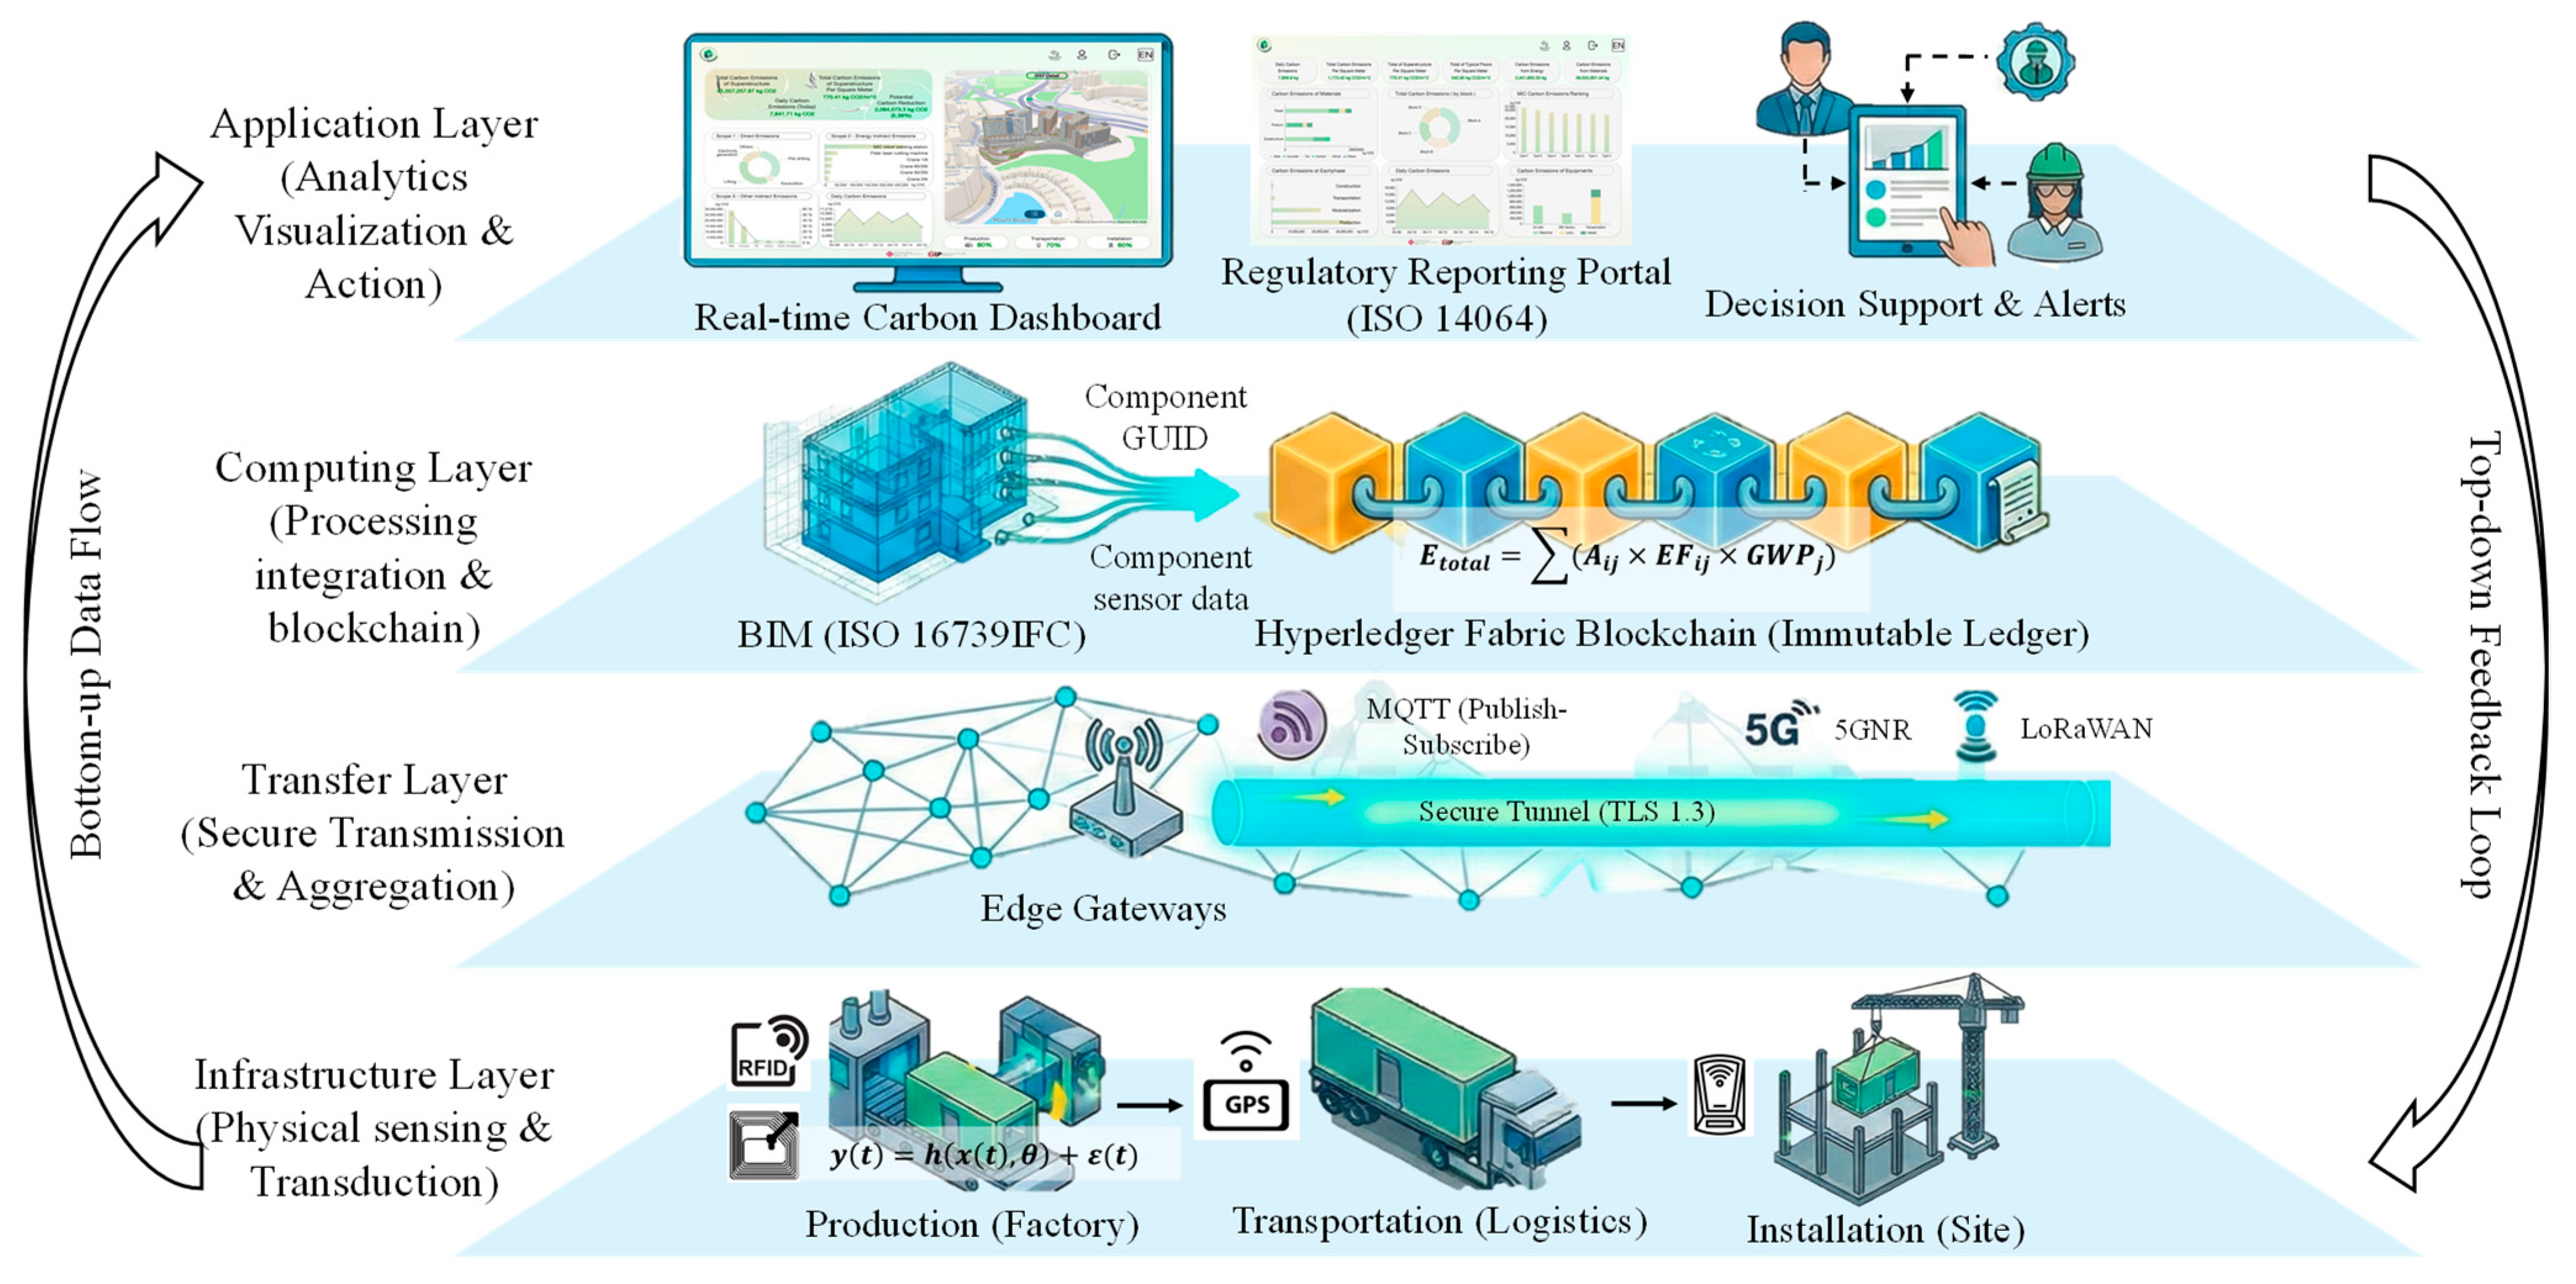
Second, the data processing logic follows the Data-Information-Knowledge-Wisdom (DIKW) hierarchy, a well-established framework in information science for structuring progressive data transformation. Within the DIKW hierarchy, raw sensor signals (Data) are transformed into structured operational metrics (Information) through the Transfer Layer, converted into validated carbon emission records (Knowledge) through BIM-IoT fusion and blockchain verification at the Computing Layer, and ultimately delivered as actionable decision support (Wisdom) at the Application Layer.
These two theoretical foundations collectively justify the four-tier hierarchical architecture shown in Figure 1, comprising the Infrastructure Layer, Transfer Layer, Computing Layer, and Application Layer. To clarify the data flow logic, each layer operates with explicitly defined inputs, processes, and outputs. The Infrastructure Layer receives physical construction activities as inputs, performs sensor transduction and edge-level filtering, and outputs validated raw data packets tagged with unique hardware addresses. The Transfer Layer receives these data packets, performs protocol aggregation, MQTT-based routing, and temporal synchronization, and outputs parsed, time-aligned data streams to the Computing Layer. The Computing Layer receives synchronized data streams together with the static BIM model, performs BIM-IoT semantic fusion, phase-specific carbon emission calculation, and three-layer blockchain validation, and outputs verified carbon emission records committed to the Hyperledger Fabric immutable ledger. The Application Layer receives these verified records and delivers real-time carbon monitoring dashboards, ISO 14064-1 [37]-compliant regulatory reports, and threshold-triggered decision support alerts to end users.
The system boundary is formally defined as cradle-to-end-of-construction, explicitly including production, transportation, and installation phases. This boundary selection follows the lifecycle assessment framework established by ISO 14040 [38], enabling systematic quantification of EC with traceability to source activities. The architecture incorporates distributed ledger technology to ensure that all carbon data transactions maintain immutability and transparency across stakeholder networks, addressing the fundamental verification challenge identified in Section 2.1. The modular architecture supports horizontal scalability, enabling integration of additional sensing modalities or construction sites without disrupting core system logic through well-defined application programming interfaces.

3.2. Infrastructure Layer

The Infrastructure Layer performs three sequential functions: (1) physical sensing, in which heterogeneous sensors convert construction activities into digital signals; (2) edge processing, in which embedded microcontrollers filter and compress raw data to reduce bandwidth consumption; and (3) transmission preparation, in which each data packet is tagged with a unique hardware address and validated against predefined quality thresholds before forwarding to the Transfer Layer.
The sensing function is realized through the strategic deployment of heterogeneous sensor networks across the construction supply chain. This layer performs the fundamental transduction function, converting physical phenomena into quantifiable digital signals suitable for downstream processing. The transduction process follows the general measurement model:
y t = h x t , θ + ϵ t
where y(t) represents the observed digital signal, x(t) denotes the true physical quantity, h(·) is the sensor transfer function, θ encompasses calibration parameters, and ϵ t accounts for measurement noise.
Fixed RFID tags are affixed to each modular unit, providing unique identification throughout the lifecycle. These tags operate in the ultra-high frequency (UHF) band, spanning 860 to 960 MHz, to ensure reliable read rates in metal-rich environments characteristic of steel MiC. The RFID system employs backscatter modulation for reader communication, enabling passive tag operation without internal power sources. Simultaneously, smart meters are integrated with manufacturing equipment to record real-time energy consumption, providing primary inputs for carbon calculation. For logistics tracking, GPS modules monitor the geographical position and traveled distance of transport vehicles. The GPS receivers update position data at 10-s intervals, providing granular route information through trilateration methods based on satellite signal time-of-arrival. The layer additionally incorporates accelerometer sensors to monitor machinery operational states and environmental conditions. These devices function as transaction-monitoring nodes, observing physical states including vibrations, loads, and anomalous conditions. Data generated at this layer undergoes initial edge processing to reduce bandwidth consumption through embedded microcontrollers.
This comprehensive sensing network ensures that all carbon-generating activities are captured at source with quantifiable uncertainty. Infrastructure layer reliability is critical because acquisition errors propagate through subsequent processing stages. Therefore, redundant sensors are deployed for critical equipment using N + 1 redundancy configurations with automatic failover mechanisms. The physical deployment strategy accounts for environmental factors, including particulate contamination, humidity variations, and electromagnetic interference, to maintain sensor integrity throughout the construction period. Each sensor is assigned a unique hardware address, serving as the primary key for data identification in downstream processing layers.
To address the environmental challenges inherent in construction sites, all field-deployed sensors are housed in IP67-rated protective enclosures resistant to dust ingress, water splashing, and mechanical impact from construction activities. RFID tags are encapsulated in industrial-grade thermoplastic housings designed to withstand concrete splatter, paint contamination, and surface abrasion. Smart meters are installed within sealed electrical distribution cabinets that provide a sheltered operating environment. GPS and telematics units on transport vehicles are factory-sealed to automotive-grade standards. Sensor maintenance, including cleaning, inspection, and recalibration, is integrated into the routine site management schedule at monthly intervals. The site contractor’s supervision team is designated as the responsible party for sensor upkeep, with automated maintenance reminders generated by the platform.
The system incorporates a multi-level alert mechanism for sensor health monitoring. Each sensor transmits periodic heartbeat signals to the edge gateway. If a sensor fails to respond within a predefined timeout window, a fault alert is automatically generated and sent to the site management team via the platform’s push notification service. The computing layer implements anomaly detection algorithms that identify data patterns indicative of sensor drift, malfunction, or tampering, such as readings that deviate beyond three standard deviations from the rolling mean. All sensor status changes are logged on the blockchain, creating an immutable audit trail. In the event of confirmed sensor failure, the N + 1 redundant backup sensors are automatically activated through the failover mechanism to maintain data continuity without manual intervention.

3.3. Transfer Layer

The Transfer Layer executes a three-stage data pipeline: (1) protocol aggregation, in which gateways collect data from heterogeneous sensors using LoRaWAN for low-power devices and 5G NR for high-bandwidth streams; (2) standardized transmission, in which the MQTT publish-subscribe protocol routes data to centralized brokers with guaranteed delivery; and (3) backend processing, in which incoming data streams are parsed, validated, and temporally synchronized before forwarding to the Computing Layer.
This layer serves as the communication bridge between physical edge devices and centralized computing resources, operating according to Open Systems Interconnection (OSI) model layers 1 through 4. Gateways supporting multiple communication protocols are strategically deployed to ensure connectivity across diverse operational environments spanning manufacturing facilities and remote construction sites.
For low-power sensors with small data payloads, LoRaWAN is used with chirp spread spectrum modulation. For high-bandwidth applications such as video streaming from site cameras, 5G NR is used with orthogonal frequency-division multiplexing. The system implements the message queuing telemetry transport (MQTT) protocol for data transmission management. This protocol employs a publish-subscribe pattern, ensuring low-latency, energy-efficient communication essential for real-time monitoring in complex construction environments. The MQTT broker manages topic hierarchies for logical data organization using tree-structured naming:
T   =   i = 1 n site i / Phase i / Device i / Metric i
where T represents the complete set of MQTT topic strings, site i identifies the project site or factory location, Phase i denotes the construction lifecycle phase (production, transportation, or installation), Device i specifies the individual sensor or equipment identifier, and Metric i indicates the data type being transmitted (e.g., energy consumption, position, or vibration). The hierarchical slash-delimited structure enables efficient content-based routing and selective data subscription by downstream consumers. Quality of service level 1 is configured to ensure at-least-once delivery through acknowledgment mechanisms, guaranteeing that no carbon data packets are lost during transmission.
Upon data reception, the operating system backend performs parsing and decoding raw data streams to extract operational metrics. This process validates data format against predefined schemas, rejecting malformed packets through syntax analysis based on context-free grammar. The backend additionally performs temporal synchronization across all data streams using network time protocol, ensuring temporal consistency essential for correlative analysis. The complete derivation of the temporal synchronization protocol, including the network time protocol offset computation and quality-of-service configurations, is provided in Appendix A.
Security mechanisms implement transport layer security (TLS) 1.3 for data-in-transit encryption, preventing unauthorized access or modification during transfer through asymmetric cryptography. The transfer layer additionally implements load balancing to distribute network traffic across servers using weighted round-robin scheduling, ensuring system stability during peak transmission periods.

3.4. Computing Layer

The Computing Layer is responsible for transforming raw sensor data into verified carbon emission records. It integrates three sequential processes: (1) data ingestion and BIM-IoT fusion, (2) carbon emission calculation, and (3) blockchain validation and ledger commitment. The core equations governing BIM-IoT fusion and blockchain verification are presented below, with detailed formulations of the containerization strategy and autoscaling logic provided in Appendix A.1.

3.4.1. Stage 1: Data Ingestion and BIM-IoT Fusion

Upon receiving parsed data streams from the Transfer Layer, the Computing Layer performs semantic mapping between dynamic sensor data and static BIM component identifiers. This mapping creates a digital twin representation of physical construction processes, enabling spatial visualization of carbon emissions that transcends traditional design-stage assessments. The mapping process adheres to the IFC standard (ISO 16739 [39]), ensuring cross-platform interoperability. Each sensor data point is assigned to a globally unique identifier (GUID) to ensure data traceability. The digital twin (DT) is formally defined as a triplet:
DT   =   M BIM ,   D sensor ,   F sync
where M BIM represents the static BIM model containing component geometry, material properties, and spatial relationships; D sensor denotes dynamic sensor data streams including energy consumption readings, GPS coordinates, and machinery operation records; and F sync encompasses synchronization functions maintaining temporal and spatial alignment between physical activities and their digital representations.
The fusion process operates through composite key structures. Each incoming sensor record is matched to a specific BIM component using a composite key K defined as follows:
K = I D component ,   I D phase ,   I D device ,   t
where I D component is the IFC GUID of the building element, I D phase identifies the construction phase (production, transportation, or installation), I D device specifies the source sensor, and t is the synchronized timestamp. This composite key ensures that every data record is unambiguously linked to a specific building component at a specific time within a specific construction phase.

3.4.2. Stage 2: Carbon Emission Calculation

Following BIM-IoT fusion, the system computes carbon emissions using activity-based formulas derived from the single-issue method ISO 14067 (GWP 100a) [40]. The calculation is performed separately for each construction phase. The production emission E P is calculated based on real-time energy consumption data recorded by smart meters installed on factory assembly lines:
E P   =   i = 1 n Q elec , i   ×   E F elec   +   Q fuel , i   ×   E F fuel
where Q elec , i is the electricity consumption (kWh) recorded by the smart meter for the i -th manufacturing process, E F elec is the regional electricity grid emission factor (kgCO2e/kWh), Q fuel , i is the fuel consumption (L or m3) for auxiliary manufacturing equipment, E F fuel is the fuel-specific emission factor (kgCO2e/L or kgCO2e/m3), and n is the total number of monitored manufacturing processes.
The transportation emission E T is calculated using GPS-tracked distance and vehicle fuel consumption data:
E T   =   j = 1 m D j   ×   F C j   ×   E F diesel
where D j is the GPS-recorded travel distance (km) for the j -th transport trip, F C j is the fuel consumption rate (L/km) recorded by the vehicle telematics unit, E F diesel is the diesel emission factor (kgCO2e/L), and m is the total number of transport trips. For transport trips where onboard fuel sensors are unavailable, the system applies a default fuel consumption rate derived from the vehicle specification database, flagged as an estimated value in the emission record.
The installation emission E I is calculated based on crane operation time and auxiliary equipment energy use:
E I   =   k = 1 p T op , k   ×   P k   ×   E F elec   +   l = 1 q Q fuel , l   ×   E F fuel
where T op , k is the active operation time (hours) of the k -th electric equipment recorded by accelerometer-based operation detection, P k is the rated power (kW) of the k -th equipment, Q fuel , l is the fuel consumption (L) of the l -th fuel-powered equipment, and p and q are the numbers of electric and fuel-powered equipment, respectively.
The total cradle-to-end-of-construction embodied carbon E C total is aggregated as follows:
E C total   =   E material   +   E P   +   E T   +   E I
where E material represents the material embodied carbon extracted from the BIM model using component volumes multiplied by material-specific emission factors stored in the system database.

3.4.3. Stage 3: Blockchain Validation and Ledger Commitment

To ensure data trustworthiness, the system employs Hyperledger Fabric to establish a tamper-proof distributed ledger. This permissioned blockchain framework implements defined access controls among supply chain participants through membership service providers based on X.509 certificate authorities.
Before any emission record is committed to the blockchain, it must pass through a sequential three-layer validation protocol. The first layer is sensor-level validation. At the point of data ingestion, the edge gateway performs automated range-checking against predefined physical thresholds. A sensor reading y ( t ) is accepted only if:
μ   -   3 σ y t μ   +   3
where μ is the rolling mean and σ is the rolling standard deviation computed from the preceding 24 h window for the same sensor. Readings that fall outside this range are flagged as anomalous and excluded from emission calculations pending manual review.
The second layer is blockchain-level validation. Smart contracts, implemented as Hyperledger Fabric chaincode, execute a second round of automated validation. The chaincode performs the following checks before committing a transaction: (a) cross-referencing the incoming emission value against the historical emission range for the same component and phase; (b) verifying that the composite key matches a valid entry in the BIM model registry; and (c) confirming that the submitting organization holds a valid X.509 certificate issued by the channel’s membership service provider. Transactions that fail any of these checks are rejected and logged with a rejection code for audit purposes.
The third layer is BIM-level validation. Static material data, including emission factors and material quantities, is entered by the project BIM manager. Each data entry is verified through a digital signature process recorded on the blockchain, ensuring accountability and traceability for all static inputs. Any modification to emission factors or material quantities requires a new signed transaction, creating a complete revision history.
Each validated transaction is packaged into blocks containing cryptographic hash links to previous block headers, creating an immutable chain structure. The consensus mechanism employs the Raft protocol for crash fault-tolerant transaction ordering. The consensus configuration C is formally defined as follows:
C   =   Leader ,   Followers ,   Log
where Leader manages log replication across Followers using AppendEntries remote procedure calls, and Log maintains ordered transaction sequences. This configuration achieves transaction finality without proof-of-work overhead, suitable for permissioned networks with known participants.
The computing layer additionally hosts the world state database, enabling efficient querying of current carbon metrics without full chain traversal. By combining BIM visualization with blockchain security, the computing layer establishes a single source of truth for carbon performance. The layer implements containerization through Docker for microservice isolation and Kubernetes orchestration for cloud deployment, enabling independent scaling of system components without affecting overall stability. The detailed formulations of the microservice architecture model and horizontal pod autoscaling logic are provided in Appendix A.
Data accuracy in the proposed system is ensured through a three-layer verification mechanism. At the sensor level, IoT devices undergo factory calibration and periodic on-site recalibration, with automated range-checking at the edge gateway to flag out-of-bound readings before transmission. At the blockchain level, Hyperledger Fabric smart contracts execute automated validation rules that cross-check incoming data against predefined thresholds and historical patterns before committing transactions to the ledger. Transactions that fail validation are rejected and flagged for manual review. At the BIM level, static material data, including emission factors and material quantities, is entered by the project BIM manager and verified through a digital signature process recorded on the blockchain, ensuring accountability and traceability for all data inputs.
The system adopts a hybrid on-chain and off-chain data storage architecture. On-chain data consists of carbon emission transaction records, validation hashes, and smart contract execution logs. These records are stored on the Hyperledger Fabric distributed ledger and maintained collectively by all participating organizations through their respective peer nodes. Off-chain data includes raw sensor streams, BIM model files, and high-volume monitoring data. This information is stored on the project owner’s cloud infrastructure and managed by the main contractor’s IT department. Each organization retains ownership of its generated data. Cryptographic hashes stored on the blockchain verify the integrity of off-chain data. Channel-based data isolation ensures that authorized parties only access sensitive operational information. Data retention periods comply with project contractual requirements and local regulations.
The operation logic of the blockchain system is as shown in Algorithm 1.
Algorithm 1 Carbon emission blockchain system
Data: Data from the Transfer Layer
Result: Continuously process sensor data with blockchain consensus
1Initialize organizations {GC, MF, LP, CL, RB}
2Generate cryptographic material for each org and register with CA
3Deploy a Raft ordered cluster (5 nodes, fault tolerance 2) and peer nodes
4Create channels: prod (GC, MF), log (GC, LP), inst (GC, CL), verif (all orgs)
5for each channel do
6 Add organizations to channel and join peers
7 if channel is prodded then
8 Add private collection “ProdDetails” with endorsement policy OR(‘MF’,‘GC’)
9 end
10end
11Deploy chaincode “carbon_cc” containing emission factors (electricity: 0.85, diesel: 2.68)
12while true do
13 Receive sensor data (value, phase, module, type)
14 Create proposal and sign
15 Collect endorsements from peers in the current phase
16 if number of endorsements ≤ half of total peers then
17 Skip this data
18 end
19 Package transaction with endorsements and send to orders for Raft consensus
20 Generate new block with hash linking to previous block
21 All peers commit block and update world state (CouchDB)
22 Compute current TPS
23 if TPS > 2000 then
24 Scale peers based on CPU utilization
25 end
26 if block number % 100 == 0 then
27 Backup world state snapshot
28 end
29end

3.5. Application Layer

The Application Layer addresses the heterogeneous demands of multiple stakeholders through specialized applications for carbon monitoring, regulatory reporting, and analytical decision support. This layer provides the human–computer interface through which users interact with underlying system complexity, implementing principles of cognitive engineering and information visualization. A comprehensive user interface dashboard enables real-time carbon emissions monitoring, visualizing data through interactive charts and geospatial representations linked to the BIM model via WebGL rendering engines. The three-dimensional BIM geometry, D carbon denotes carbon emission data, and F mapping include color mapping functions encoding emission intensity. Stakeholders interact with specific building components through event-driven programming models, retrieving associated carbon histories.
All carbon resources and processes are exposed as services within a service-oriented architecture, enabling integration with external systems through standardized interfaces. This architecture supports interoperability with enterprise resource planning platforms and government regulatory portals through RESTful APIs. Role-based access control ensures users access only permission-relevant data through authentication tokens following JSON web token standards. This separation of concerns enhances both usability and data security through the principle of least privilege enforcement. The application layer completes the data lifecycle by transforming verified information into actionable knowledge through decision support systems.
The system incorporates proactive alert mechanisms notifying users when carbon thresholds are exceeded through push notification services. This feature enables immediate corrective action during construction processes, supporting dynamic carbon management rather than retrospective reporting only. The interface implements responsive web design principles, enabling access from desktop and mobile devices through adaptive layouts, ensuring consistent user experience across heterogeneous access platforms.


4. Case Study and Implementation

4.1. Case Project

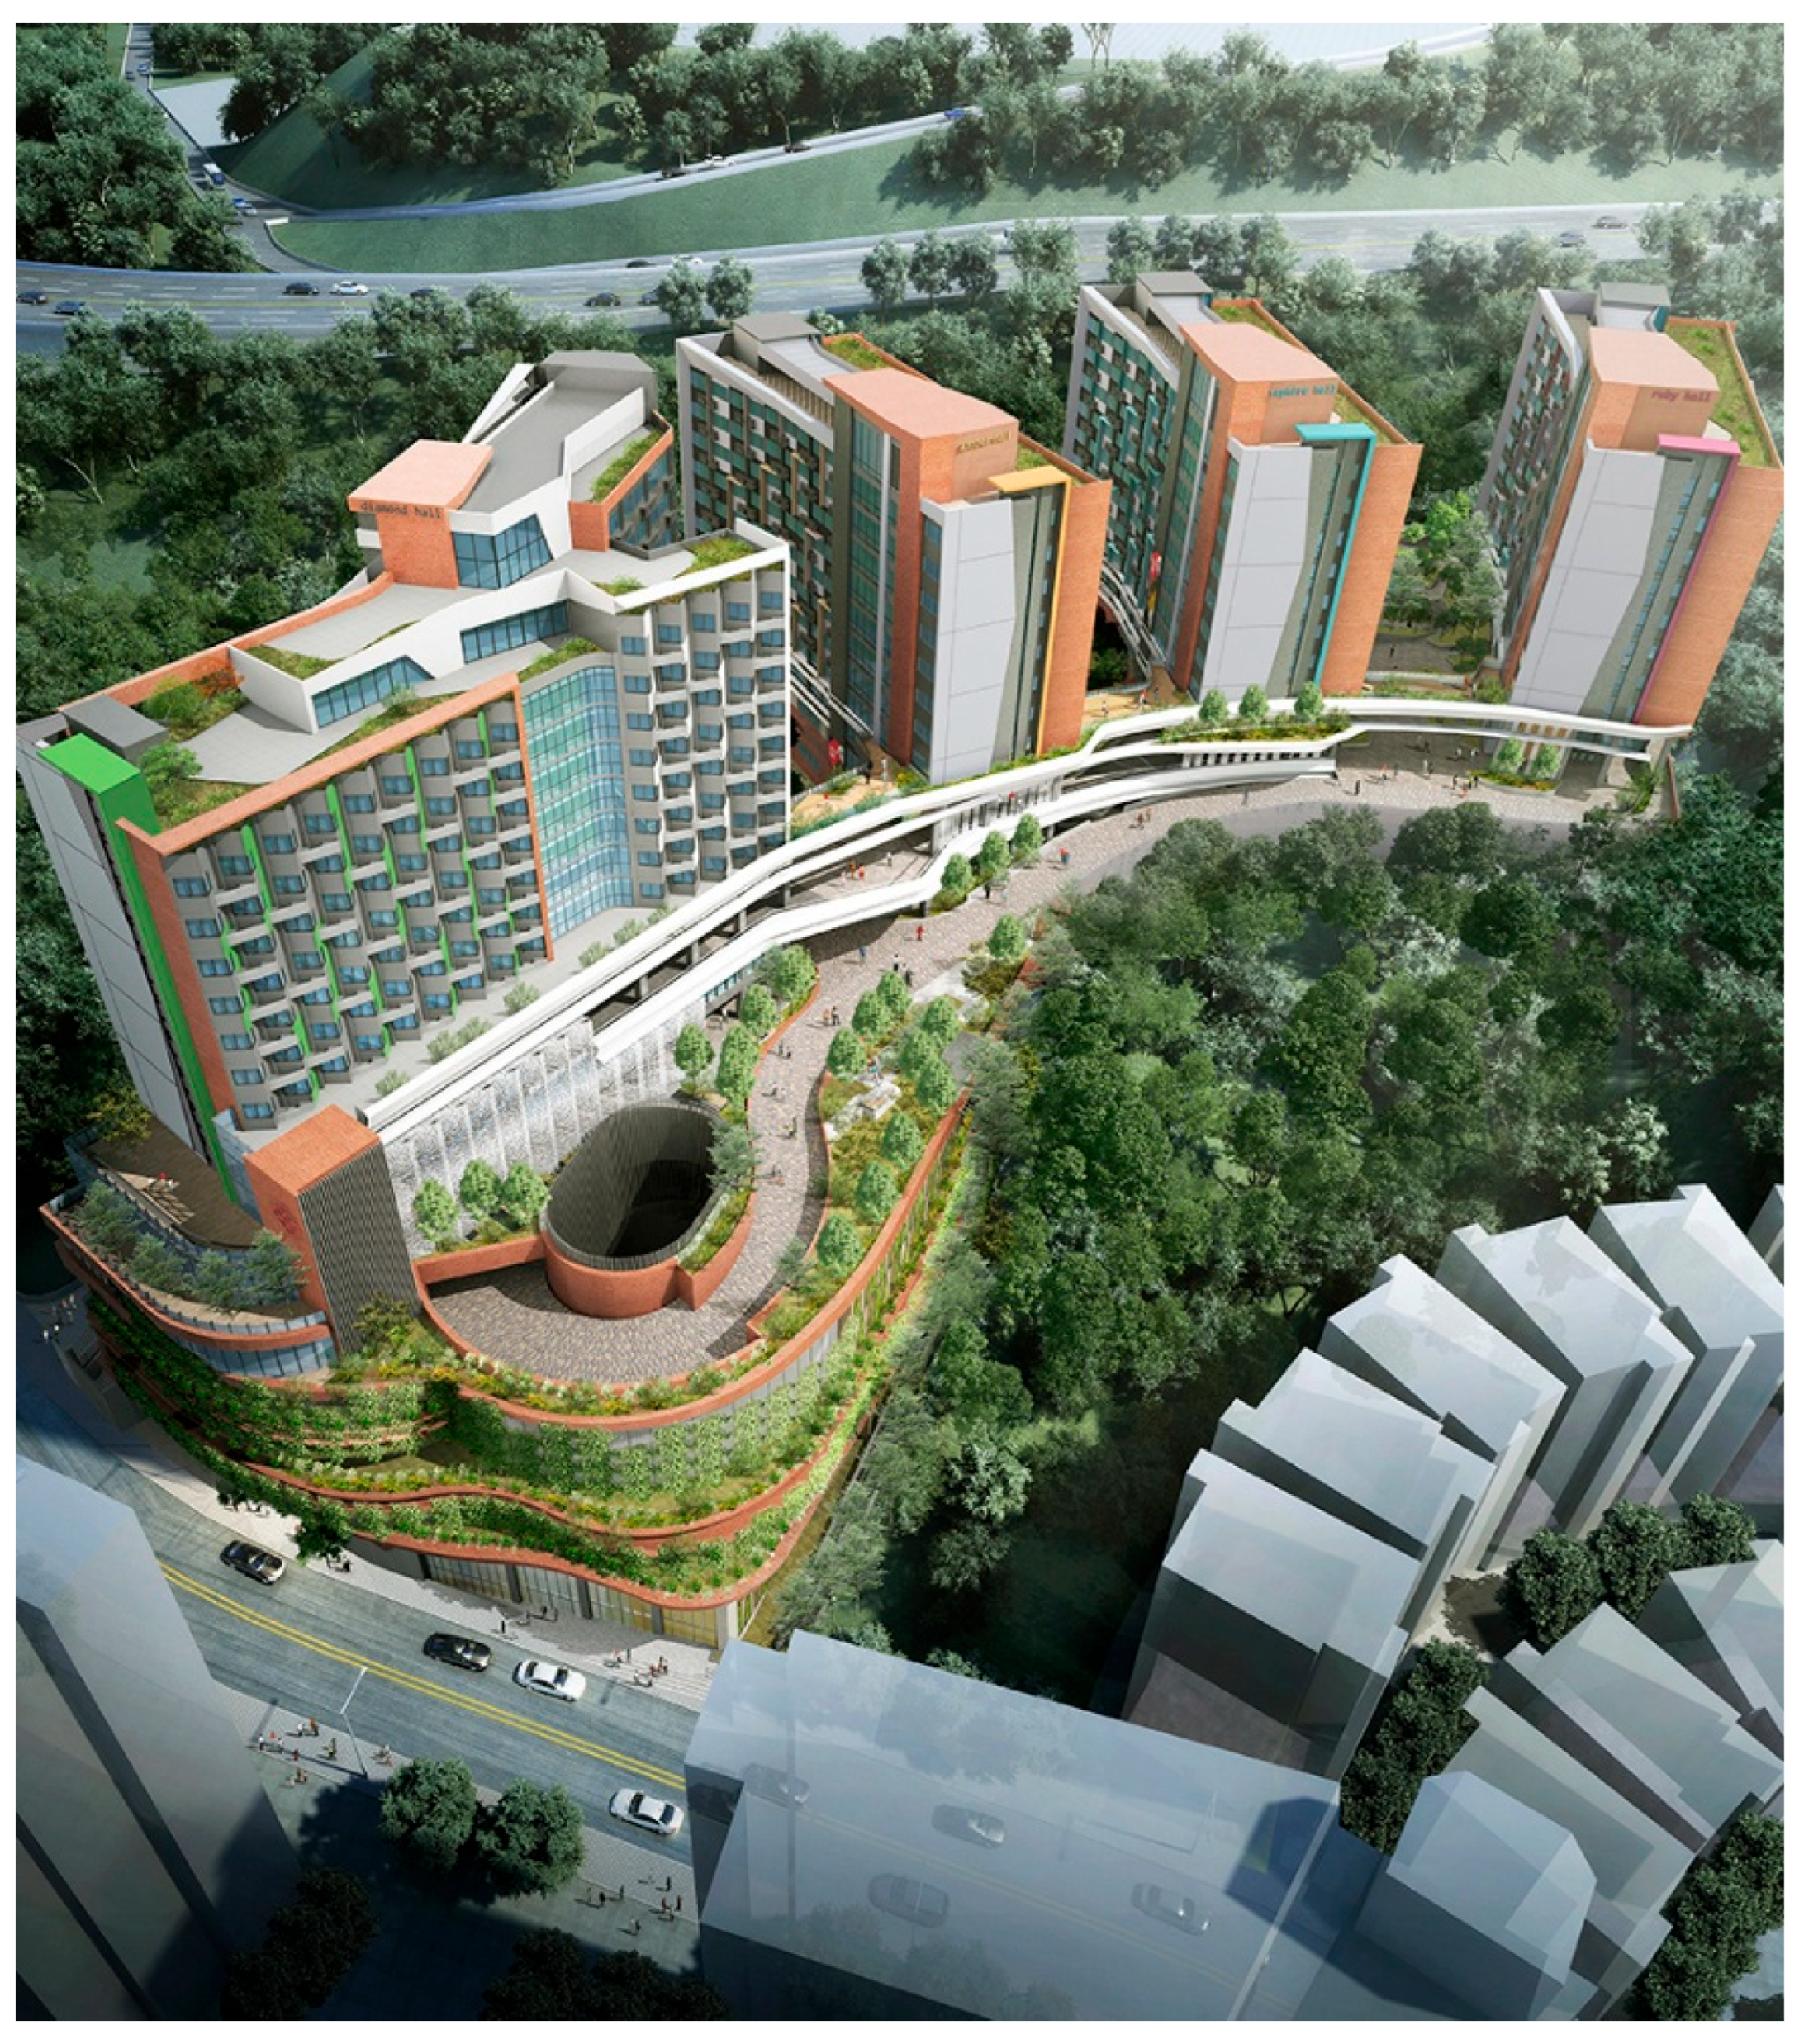
To empirically validate the proposed system architecture, a pilot implementation was conducted at the student hostel project (Figure 2). This case was selected for its scale and complexity, representing a typical high-rise MiC project in high-density cities. The building comprises 15 stories with 893 prefabricated modules constructed using a steel structural system. Gross floor area measures approximately 50,200 m2. The project timeline encompassed off-site production in Guangdong Province, Mainland China, and on-site installation in Kowloon Tong, Hong Kong SAR.
This case was selected based on following specific criteria. First, the project’s high-rise scale and structural complexity are representative of real-world MiC challenges. Second, the cross-border supply chain, spanning manufacturing in Mainland China and installation in Hong Kong SAR, provides a comprehensive testbed for the cradle-to-end-of-construction system boundary, enabling examination of carbon monitoring across distinct operational zones with varying regulatory frameworks and infrastructure capabilities. Third, the project involves multiple stakeholders, including the main contractor, module manufacturer, logistics provider, and client. This stakeholder diversity is essential for testing multi-party blockchain network capabilities with competing organizational interests. Fourth, the structural steel (S355 grade) used throughout the modules provides a consistent material baseline for carbon calculation, reducing emission factor uncertainty. Fifth, the project adhered to local building codes and sustainability standards (BEAM Plus), ensuring that collected data is relevant for regulatory compliance assessment.
This case study serves as a demonstrative evaluation experiment to illustrate and validate the functions and system architecture of the proposed platform. The MiC methodology enables precise tracking of individual units from factory fabrication through transportation to final installation position, supporting granular carbon accounting at module resolution.
Although this case project uses a steel modular structural system in a high-rise residential context, the platform’s modular architecture is designed for transferability to other MiC contexts. The standardized interfaces, containerized microservice deployment, and configurable emission factor database allow the system to be adapted to projects with different structural systems or building typologies without modifying the core system logic. Adaptation to non-MiC prefabricated construction would require reconfiguration of the phase-specific emission calculation modules and sensor placement strategies to reflect different supply chain structures.

4.2. System Deployment

The system was deployed across three distinct lifecycle phases to examine carbon reduction solutions and monitor emissions comprehensively. During the production phase at the Zhaoqing factory, UHF RFID tags (Impinj Monza R6) were installed on modules during assembly for persistent identification. Smart meters were connected to manufacturing equipment, including laser cutters, welding robots, and overhead cranes to capture energy consumption at source. Installation required coordination with factory operations through scheduled maintenance windows to minimize production disruption.
Data gateways were positioned strategically following site surveys to ensure production floor coverage with a received signal strength indicator (RSSI) above −70 dBm throughout. For the transportation phase, GPS/4G telematics units tracked cross-border logistics from Guangdong to Hong Kong. Coverage encompassed both road transport and sea transport, ensuring accurate logistics emissions recording. Tracking devices operated on internal lithium batteries during sea freight segments where external power was unavailable, employing low-power modes.
The site network infrastructure combined Wi-Fi and temporary 5G links to handle high data volume. Data from all three phases was aggregated to the central computing layer through MQTT brokers:
D total   =   p { P , T , I } s S p D s
where D total represents the complete aggregated dataset, p denotes the construction lifecycle phase with P for production, T for transportation, and I for installation, S p is the set of sensors deployed in phase p, and D s is the data stream generated by sensors.
Regular diagnostic checks were conducted to ensure sensor calibration and network stability using spectrum analyzers and protocol analyzers. This phased deployment strategy enabled iterative refinement of system configuration based on onsite feedback, following an agile development methodology with two-week sprint cycles. Successful data integration across phases confirmed the system’s capability to handle the fragmented nature of construction supply chains, with end-to-end data completeness exceeding 98.7% across all sensor types. The deployment included training sessions for site personnel, ensuring correct monitoring equipment usage and protocol compliance, measured through pre/post-training assessment.

4.3. Blockchain Engineering Setup

The Hyperledger Fabric network configuration was engineered to ensure data security and partitioning among stakeholders while maintaining transaction throughput sufficient for real-time sensor data ingestion. The blockchain network implemented channel-based data isolation to separate sensitive operational data from public verification data.
Each organization-maintained control over its peer nodes while participating in the shared ledger through independent cryptographic identities based on the Elliptic Curve Digital Signature Algorithm with the P-256 curve:
σ   =   Sign sk m , Verify pk σ , m { true , false }
where σ is the digital signature, sk is the private signing key of the organization, m is the transaction message, pk is the corresponding public verification key, Sign denotes the signature generation function, and Verify denotes the signature validation function that returns true if the signature is authentic.
The consensus mechanism employed the Raft protocol for crash fault-tolerant transaction ordering with leader-follower replication. The Raft protocol ensures consensus as long as f   <   N / 2 nodes fail, where N is the total number of ordering service nodes ( N = 5 in this deployment).
The blockchain infrastructure was monitored using Prometheus and Grafana dashboards tracking key metrics, including transaction throughput (TPS, transactions per second), block commit latency, and channel gossip activity:
TPS = committed   transactions time   window
where committed transactions is the number of successfully validated and ledger-committed transactions, and time window is the measurement interval in seconds. This robust engineering setup provides the cryptographic trust layer necessary for the carbon monitoring system acceptance by industry regulators and stakeholders. The implementation confirms blockchain technology’s practical applicability to construction supply chain management without compromising performance, achieving sustained throughput of 2500 TPS, sufficient for real-time sensor data influx:
TPS achieved   >   TPS required = sensors   ×   sampling   rate batch   size
where sensors   =   1247 , sampling   rate   =   0.1 Hz average, and batch   size   =   100 transactions per block, yielding required TPS of approximately 1.25.

4.4. Platform Implementation

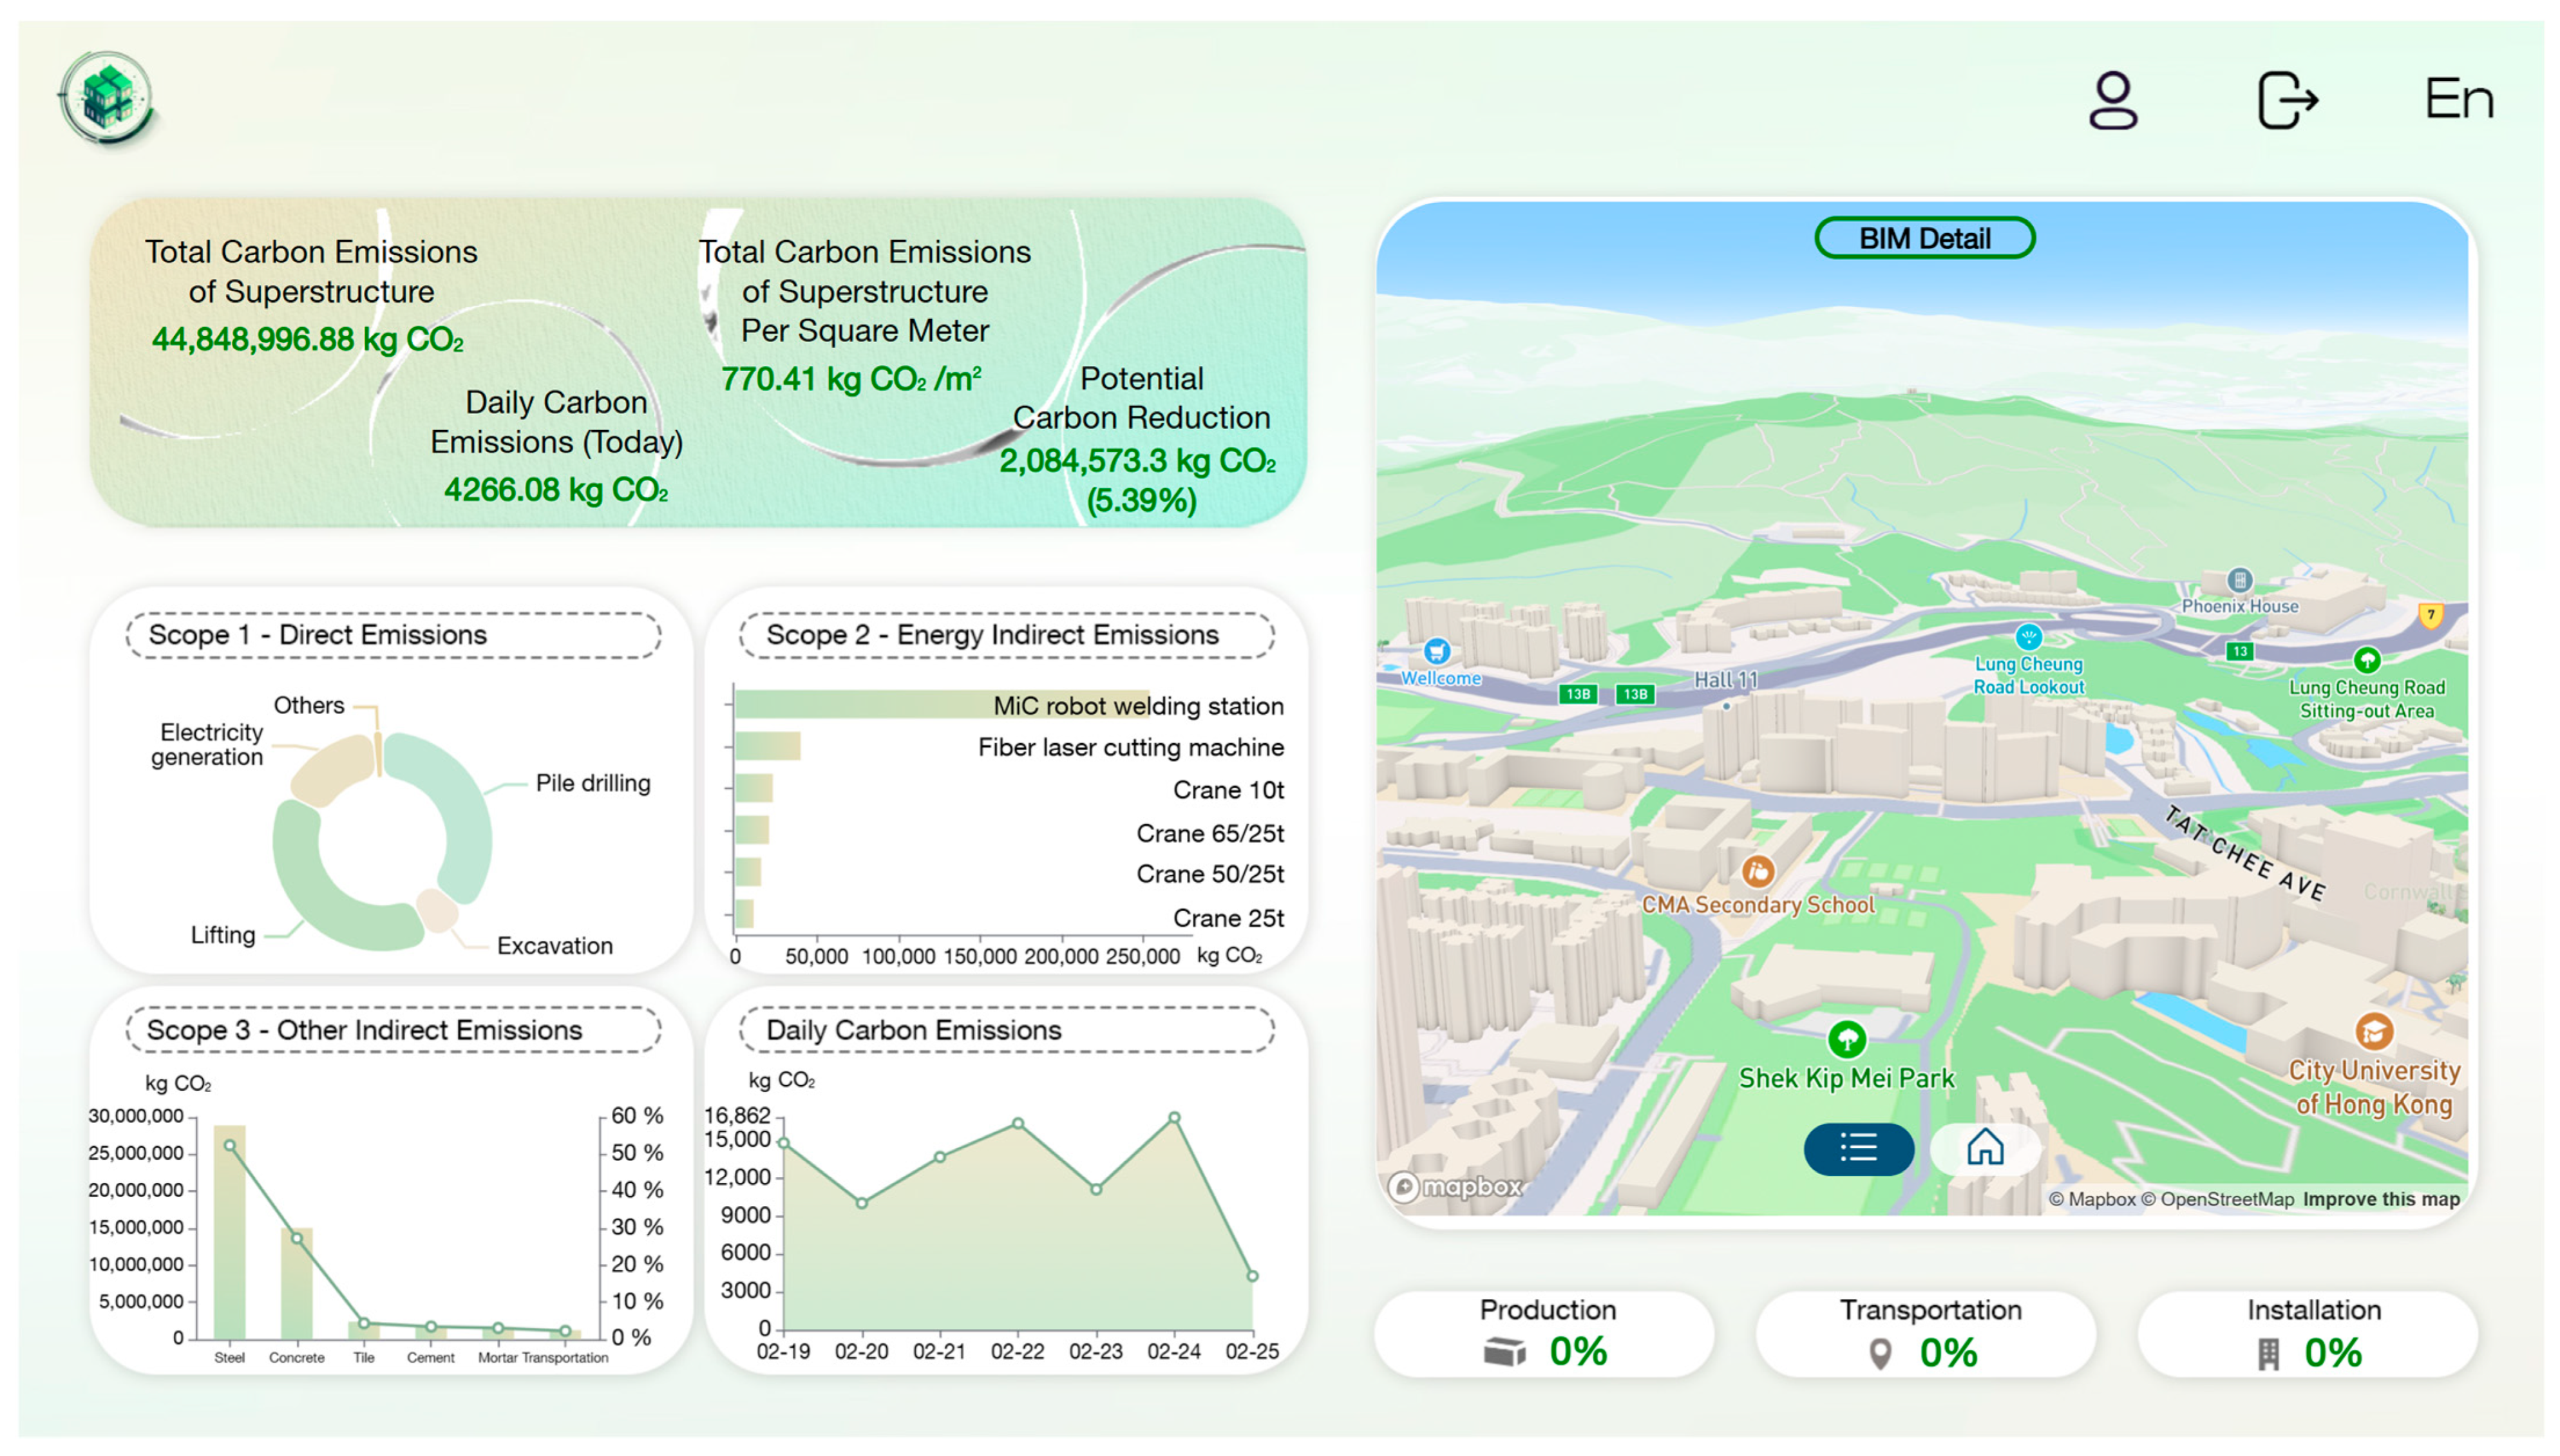
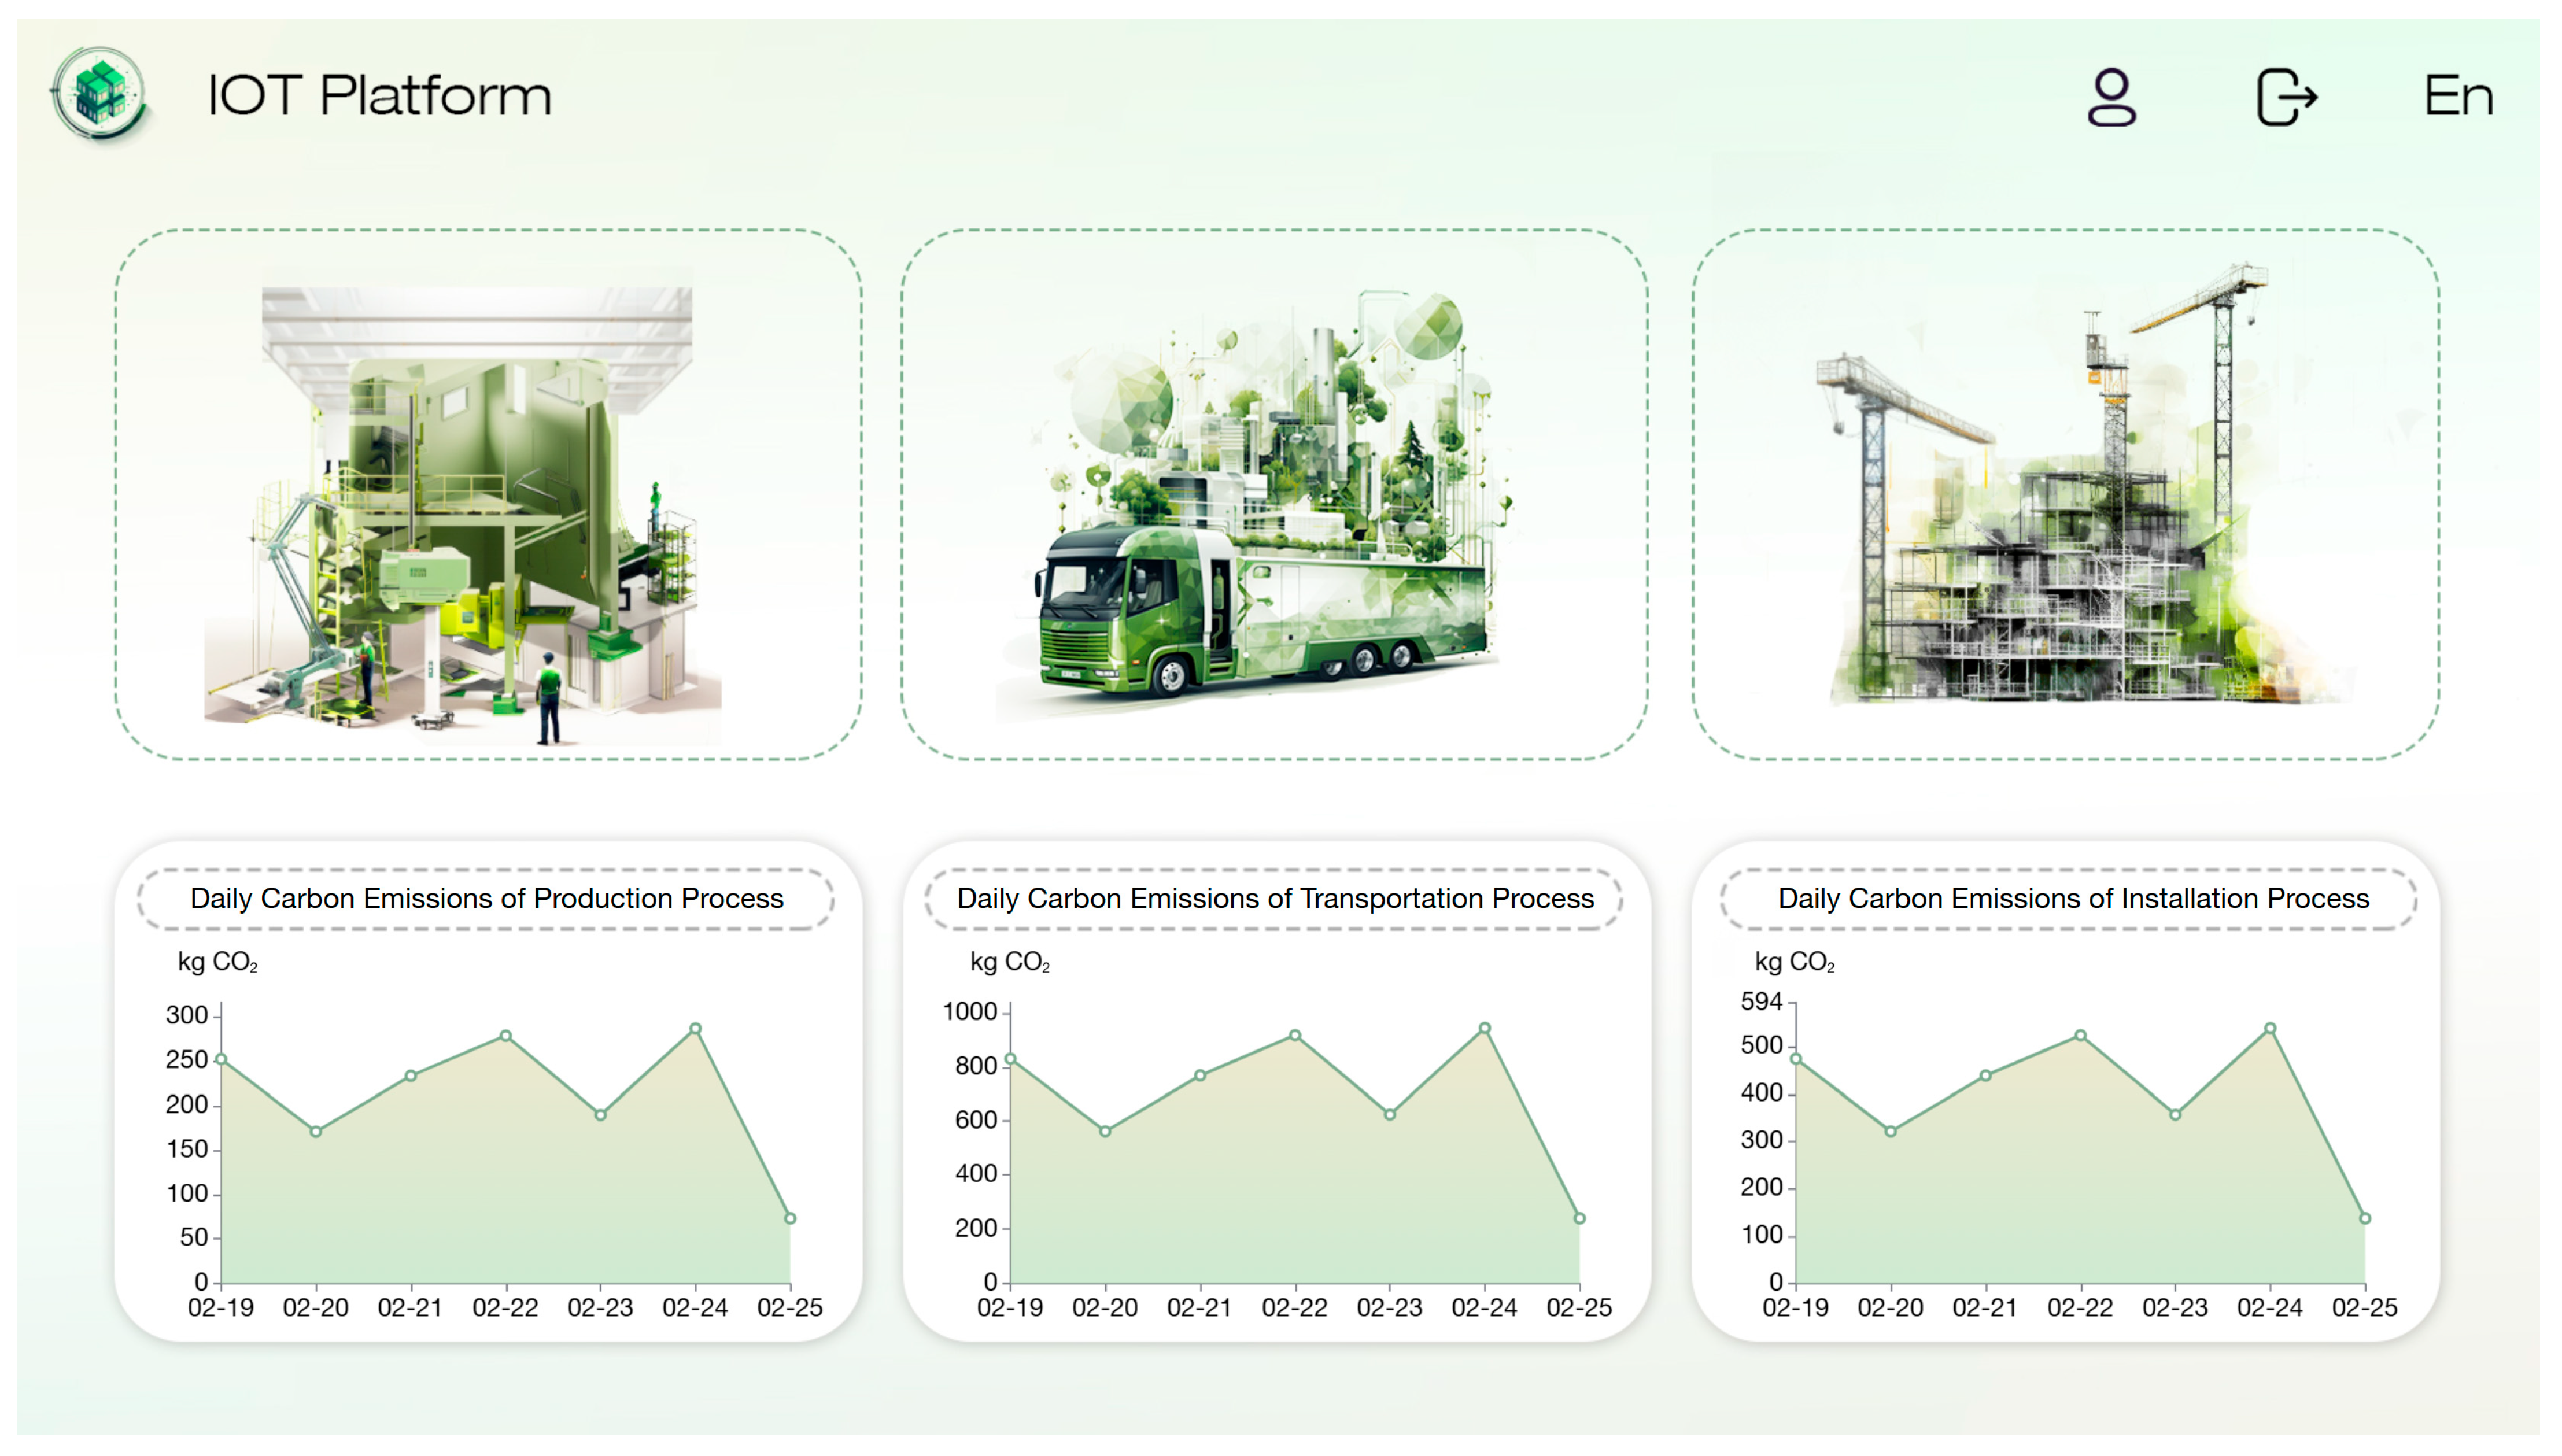
To implement the proposed framework in the case study, a carbon emission monitoring platform was deployed. As shown in Figure 3, the platform features an intuitive central dashboard designed to aggregate and display critical carbon metrics in real time. Users can easily monitor daily and cumulative emissions and future emission forecasts through dynamic visual tools such as line graphs and bar charts. These interactive interfaces allow project stakeholders to navigate data across different time intervals and historical benchmarks. By highlighting sudden emission spikes and long-term footprint trends, the system facilitates early intervention and supports informed decision-making for carbon reduction.
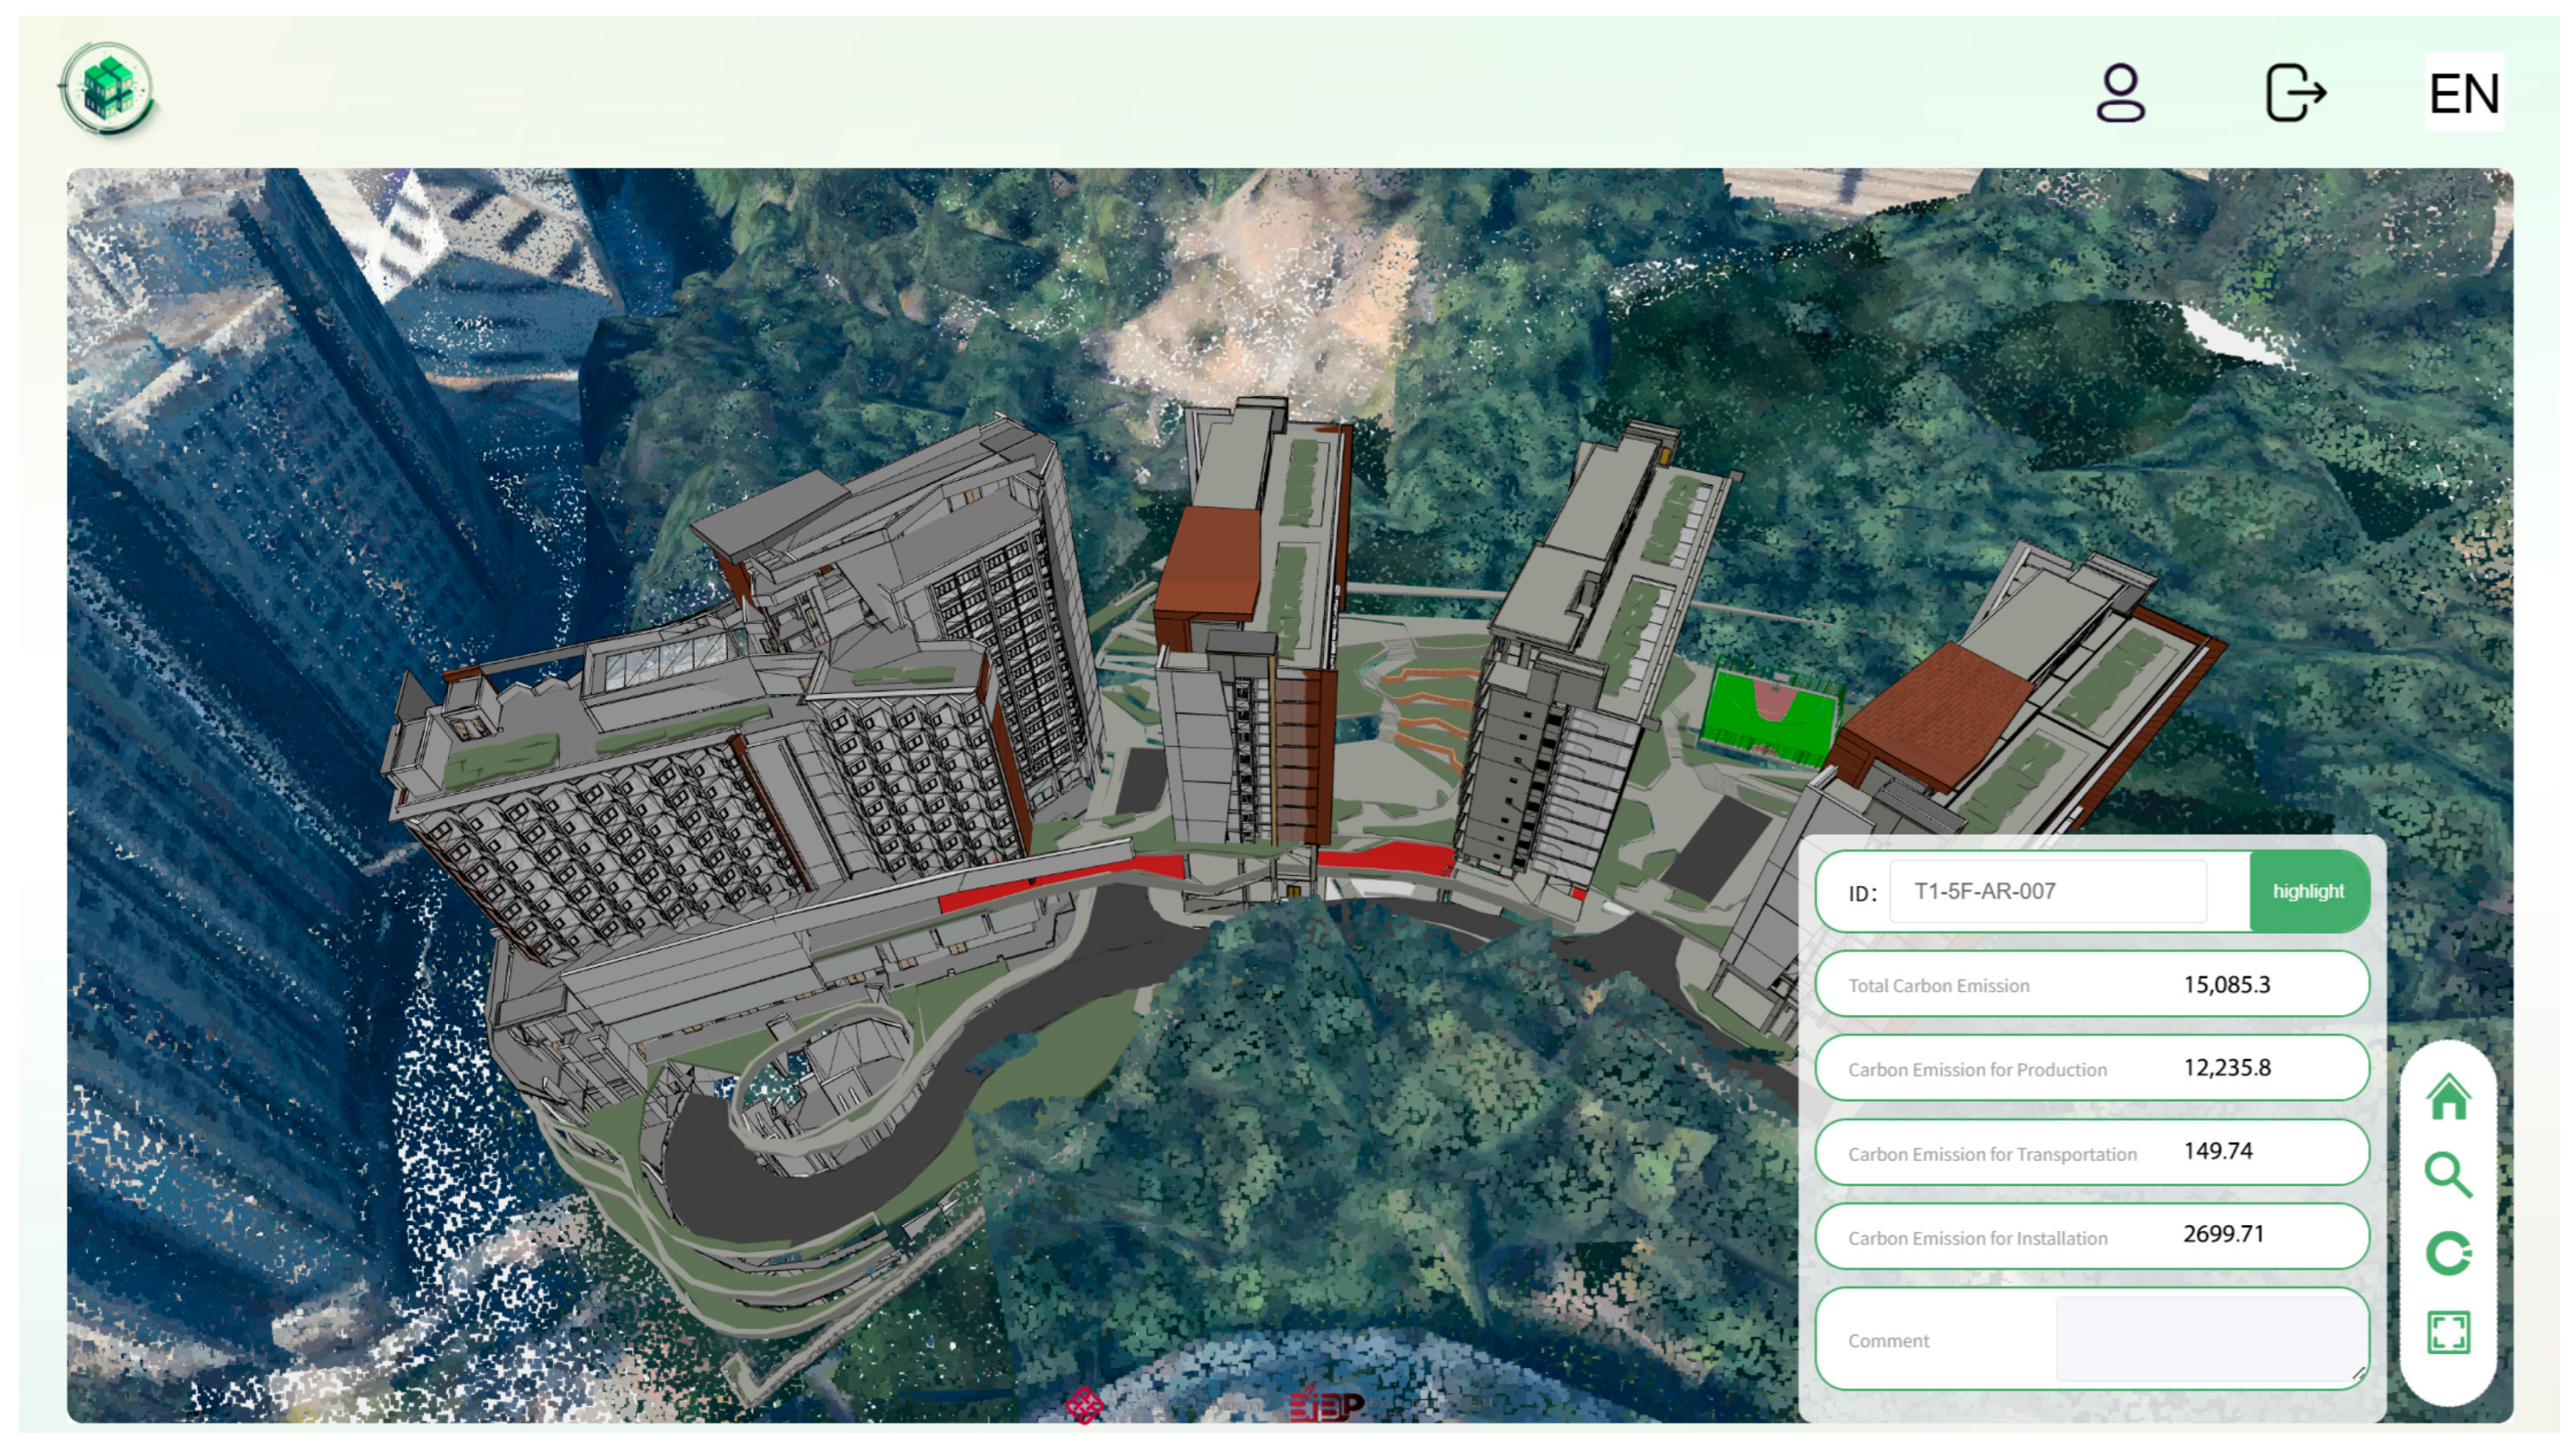
A core feature of the platform is its integration with BIM technology, which provides a detailed spatial context for carbon management (Figure 4). This integration links real-time sensor data, such as equipment energy consumption and operational records dimensional building model. Consequently, users can visualize emissions at both the macro-project level and the micro-room or component level. As construction progresses, the BIM interface updates dynamically, allowing stakeholders to easily identify specific areas or activities with elevated carbon footprints. This spatial representation makes complex emission data more accessible, eliminating the need for specialized technical expertise to interpret the project’s environmental impact.
As shown in Figure 5, the system systematically tracks carbon emissions across the three primary lifecycle phases of MiC. During the production phase, the platform employs RFID technology to monitor individual building modules. Unique identification tags are attached to each module, linking production progress directly to carbon emission parameters. Simultaneously, embedded sensors capture real-time energy consumption data from key manufacturing equipment, such as laser cutters and welding machines. The interface visualizes this data alongside plant layout maps and live video feeds, allowing managers to pinpoint major emission sources on the factory floor and evaluate the environmental impact of various production activities.
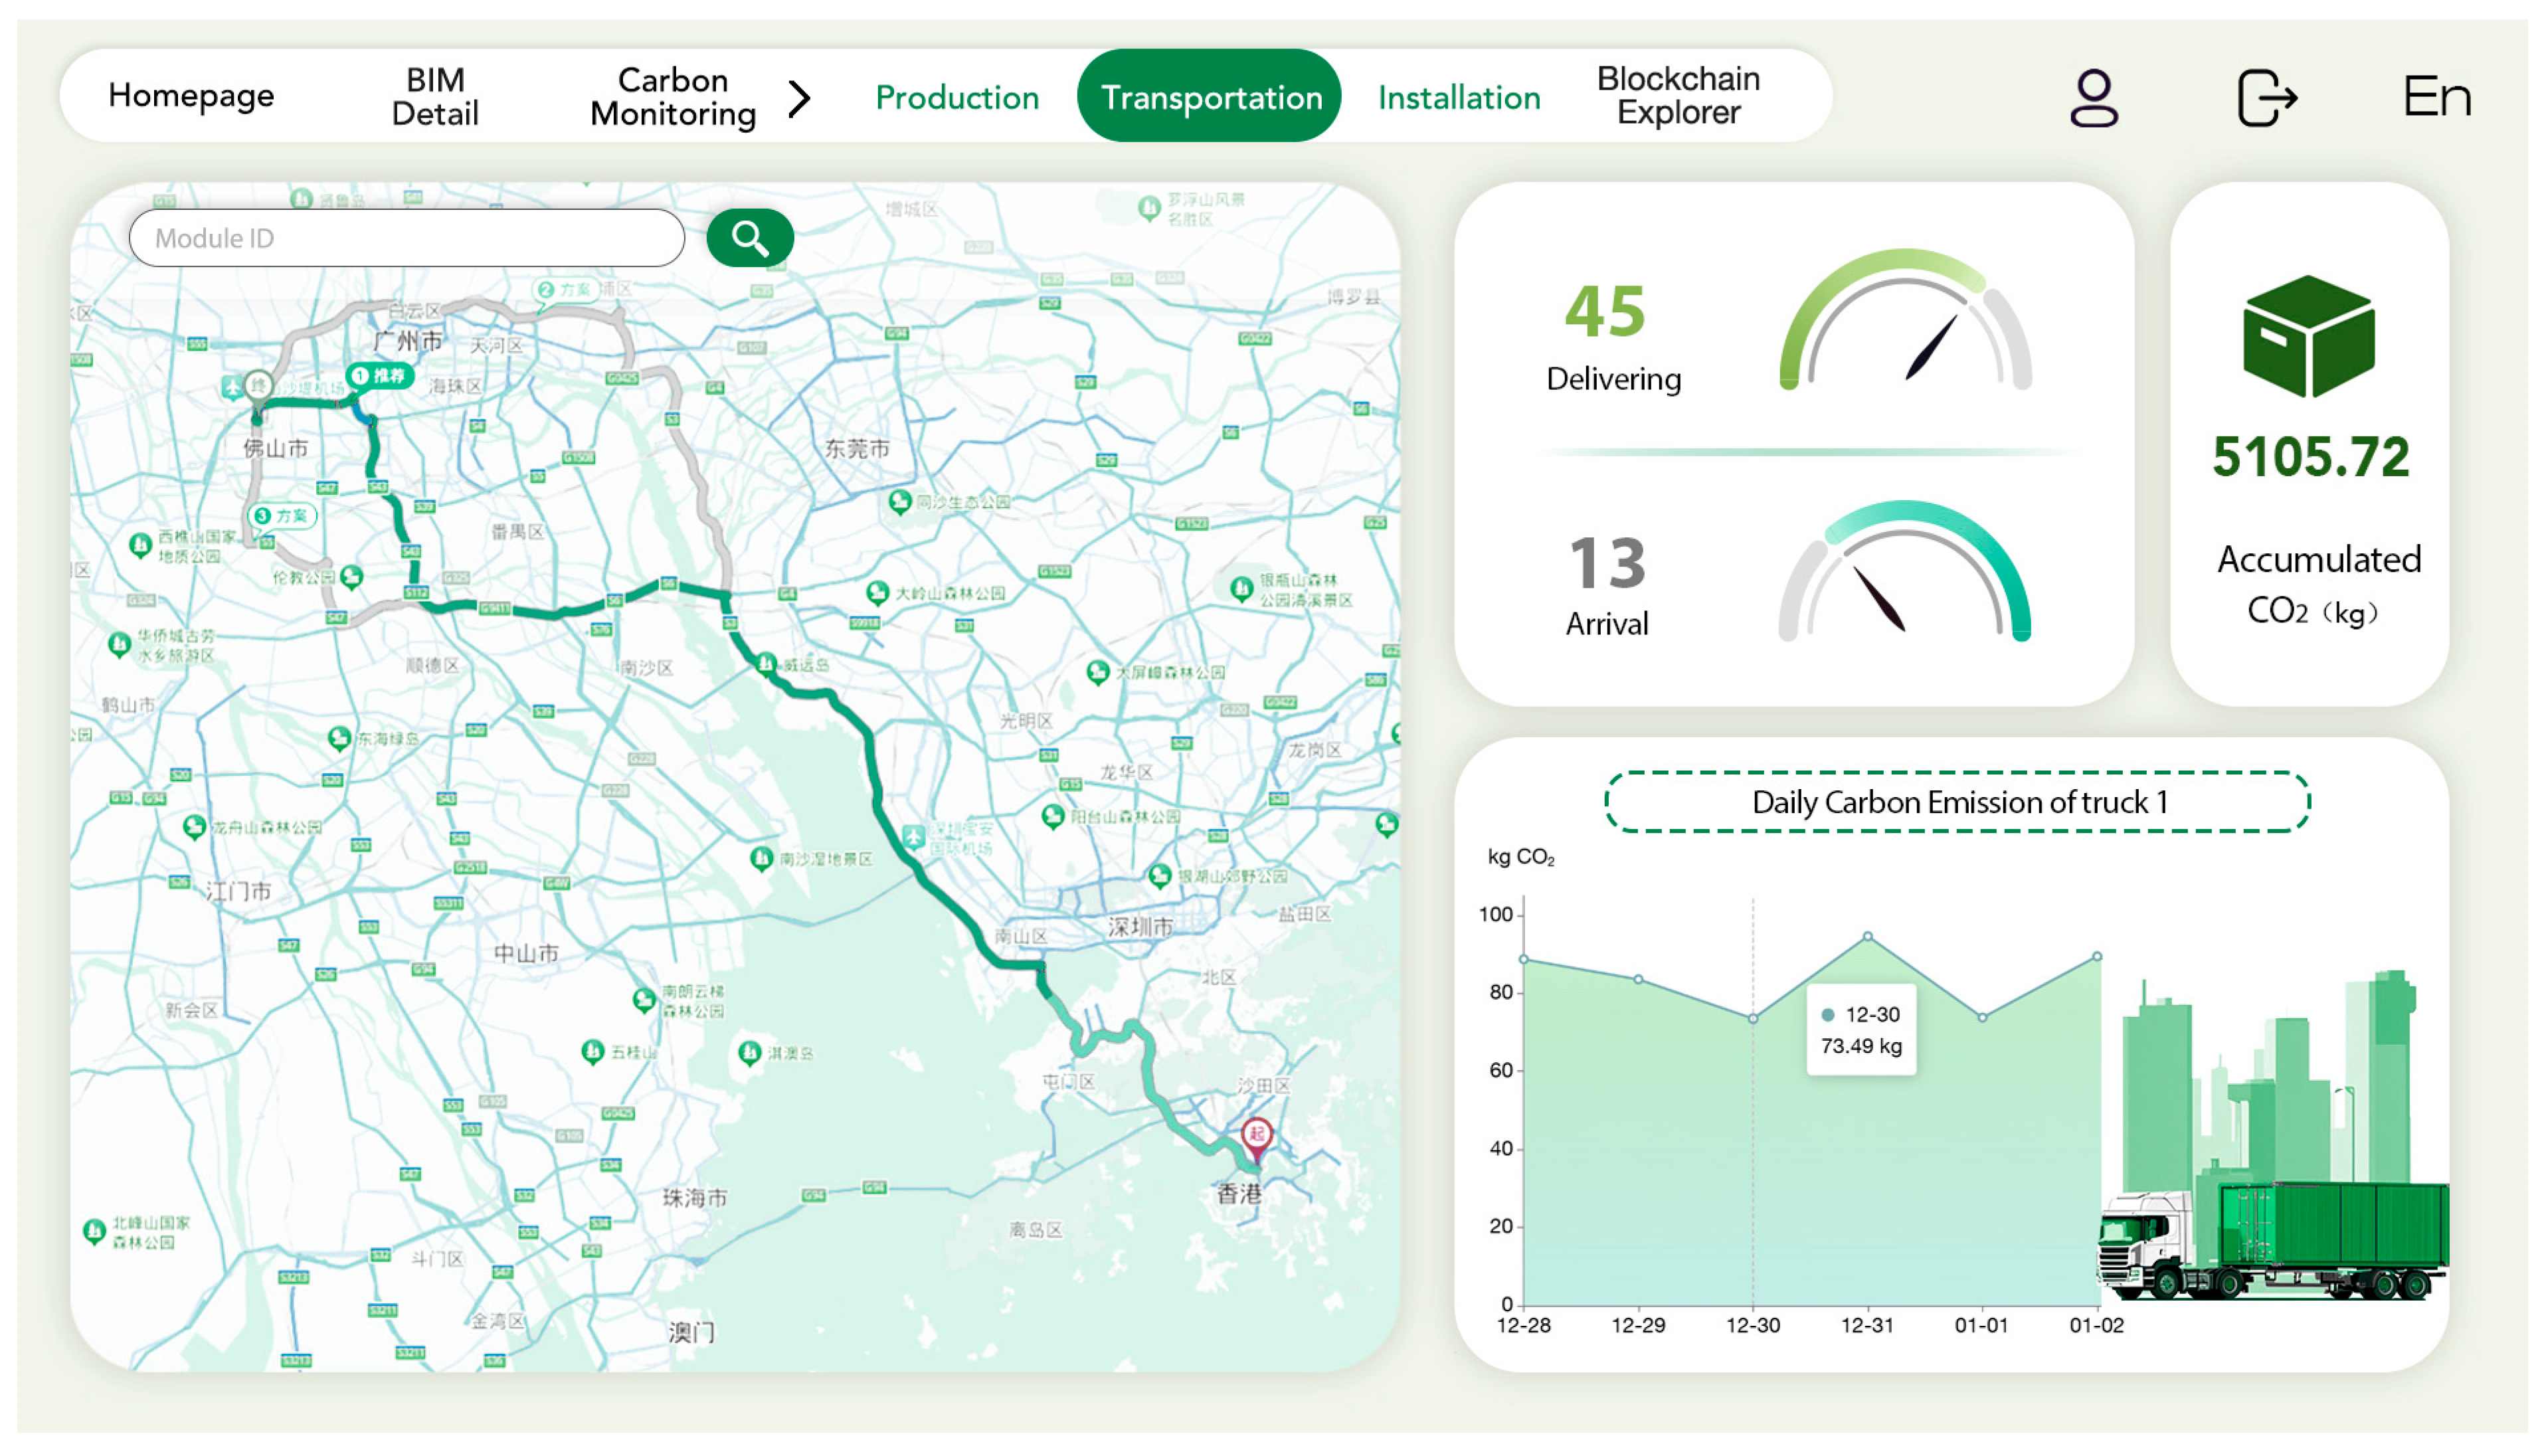
As modules transition to the transportation phase, the platform utilizes GPS technology and IoT sensors to track vehicle routes, travel distances, and fuel consumption (Figure 6). Interactive maps display the movement of trucks and vessels, while dynamic charts aggregate the resulting transport emissions, helping logistics teams optimize routes and reduce fuel usage. Upon reaching the site for the installation phase, high-definition camera surveillance is integrated with the emission monitoring system. This setup tracks the operational intensity and working hours of heavy machinery, such as cranes and excavators. The platform then generates real-time cumulative emission curves for each equipment type, enabling project managers to identify inefficient practices and reduce machine idle time.
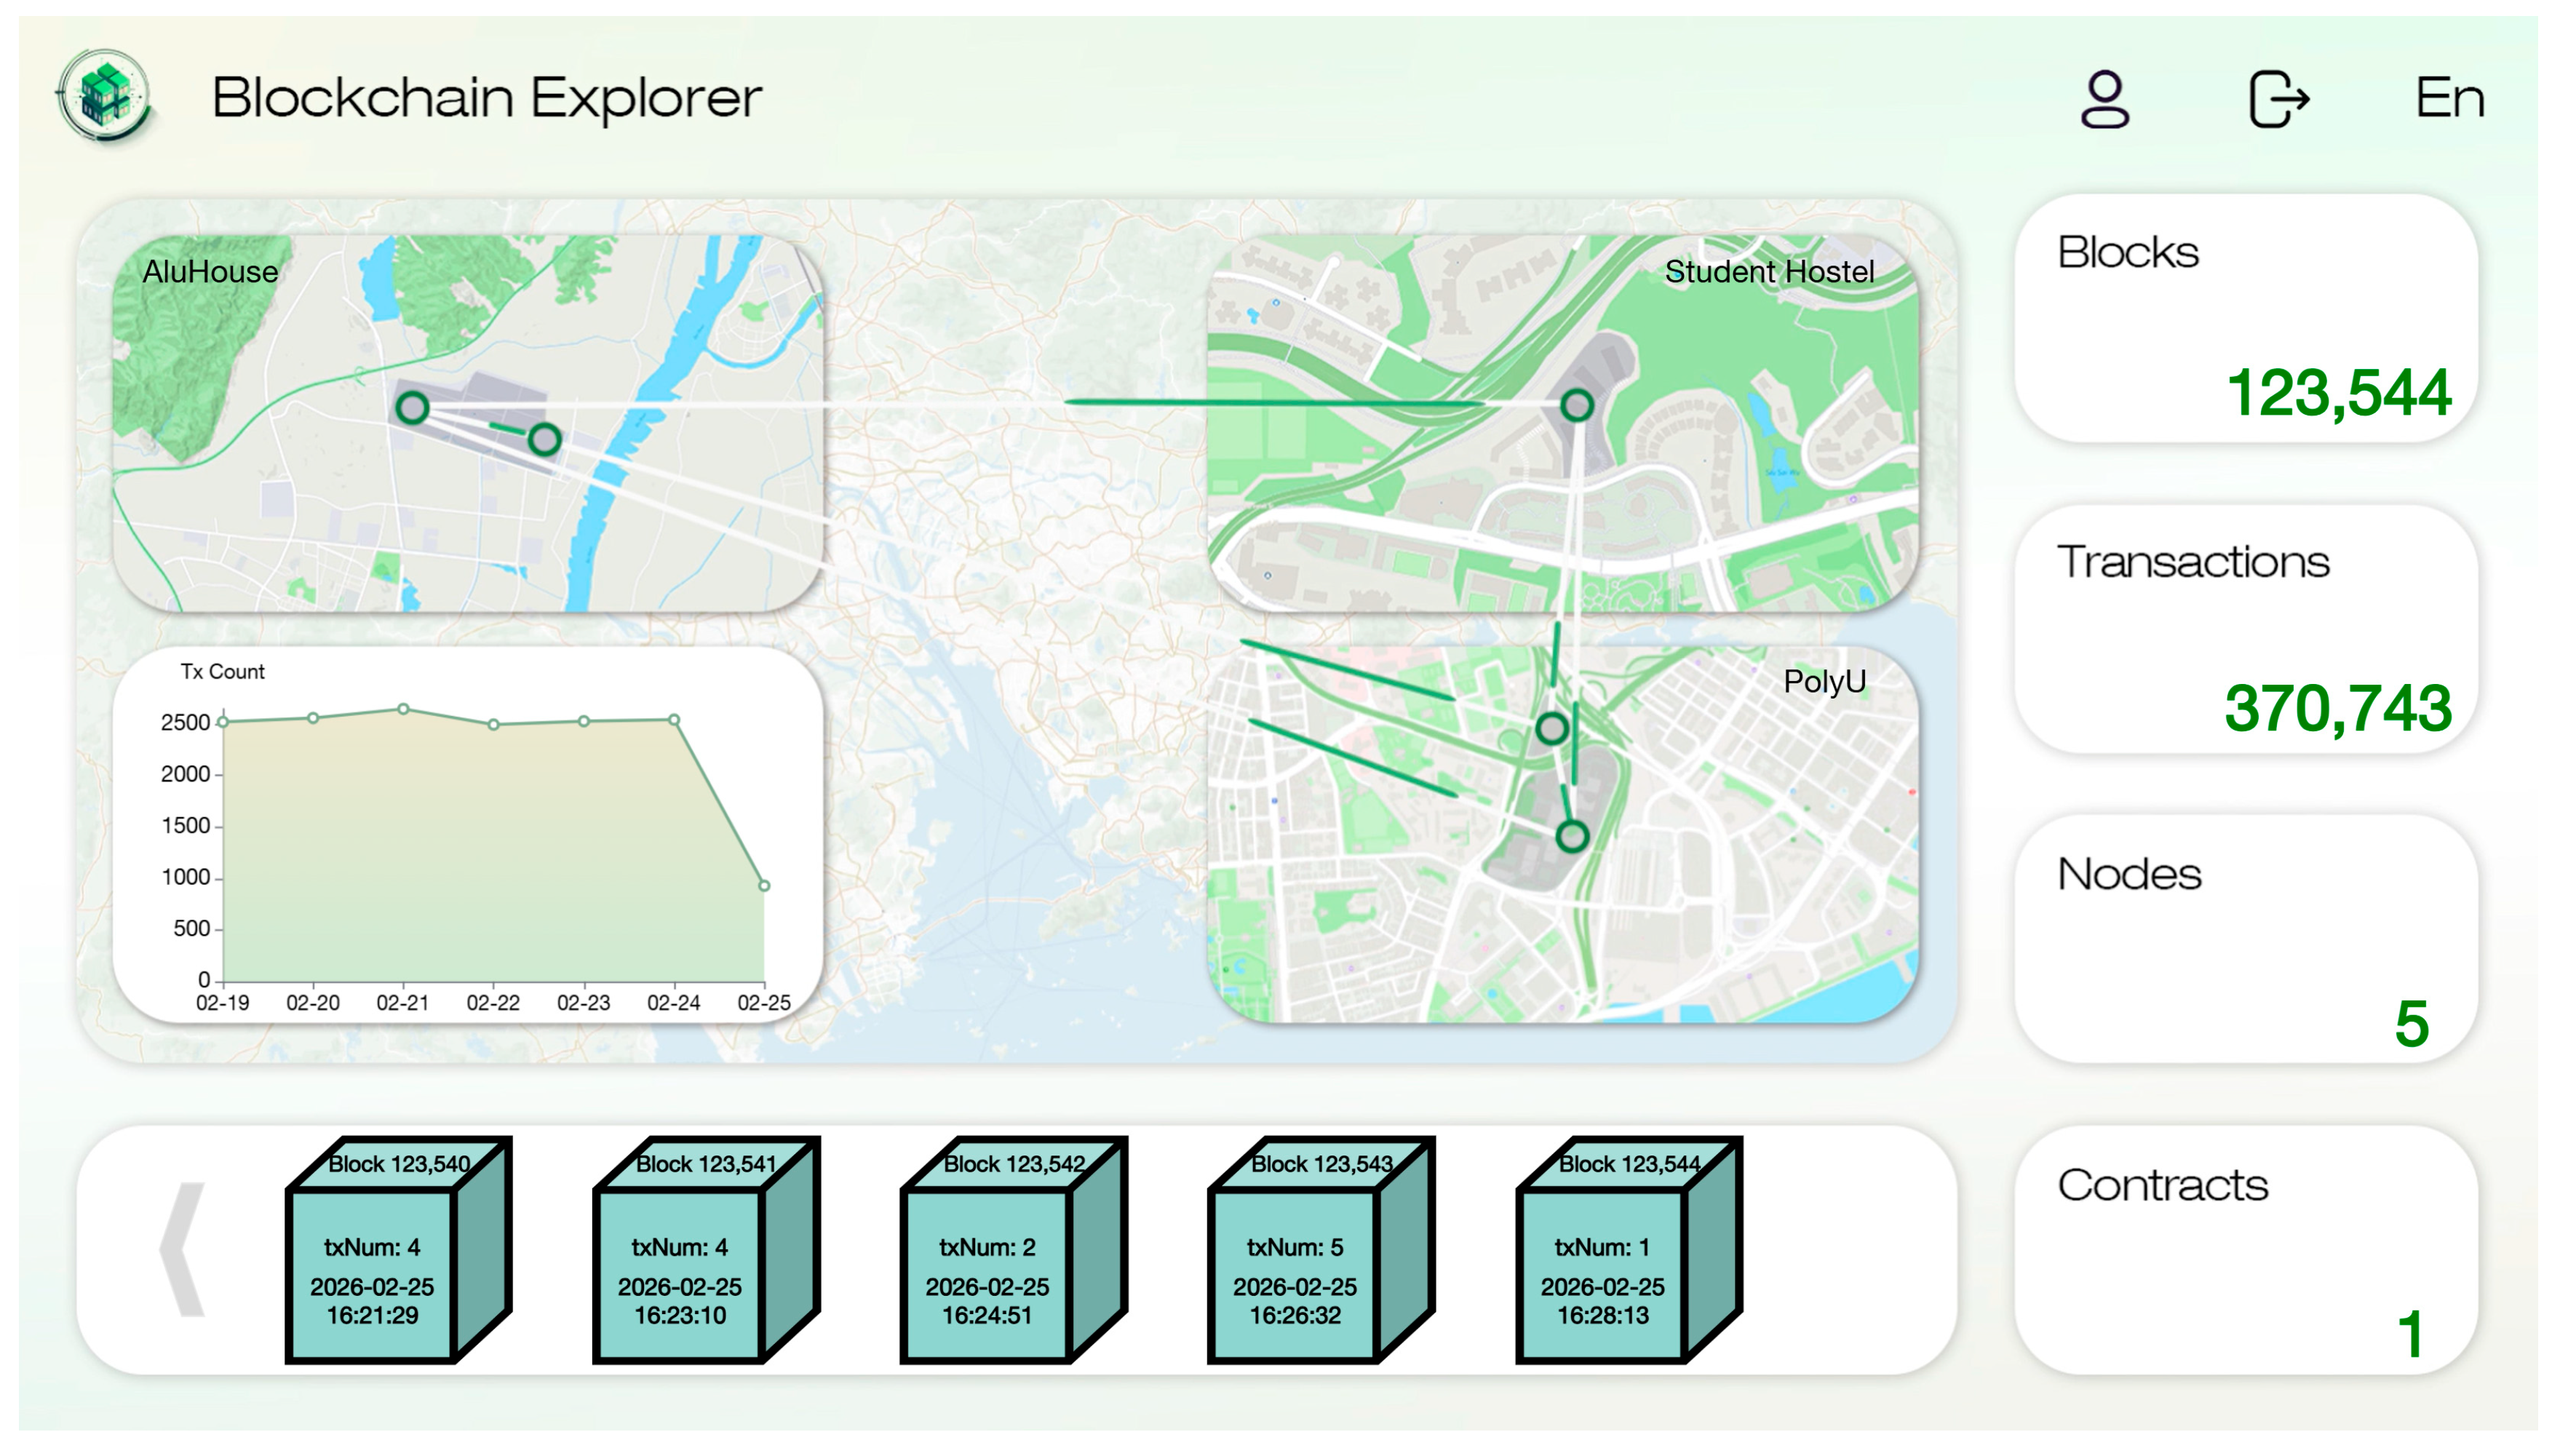
To ensure the security, transparency, and credibility of this lifecycle data, the platform incorporates a dedicated blockchain explorer, as shown in Figure 7. This component features a map-based interface that displays the geographical distribution and real-time synchronization status of all network nodes across the manufacturing plants and construction sites. Users can actively monitor transaction counts, block updates, and smart contract activities, ensuring that all collected carbon data remains immutable and fully traceable. By securely archiving data and providing transparent, continuous monitoring from initial manufacturing to final assembly, the integrated platform equips stakeholders with evidence-based tools necessary to advance low-carbon practices in MiC projects.

5. Carbon Quantification and Reduction Verification Results

5.1. Baseline Carbon Estimation Results

As shown in Table 2, the total cradle-to-end-of-construction EC emissions of the case building were estimated at 47,682.03 tCO2e, equivalent to 949.84 kgCO2e/m2. Specifically, material production emerged as the dominant contributor, generating a total of 33,042.82 tCO2e (69.30%), followed by modularization (9359.46 tCO2e, 19.63%) and transportation (4613.03 tCO2e, 9.67%). In contrast, construction constituted the smallest share, emitting 666.72 tCO2e and accounting for merely 1.40% of the total cradle-to-end-of-construction emissions.
At the material level, the material-related EC emissions of the case building were analyzed. As presented in Table 3, a total of 42,205.15 tCO2e material-related EC emissions were generated, among which the substructure contributed 41.90%, while the superstructure accounted for 58.10%. The superstructure of the case building contained tower and podium, and steel modules were stacked in the tower. Material-related emissions from these modules were estimated at 9162.33 tCO2e (21.71%), the cast-in situ components in the tower and podium generated 5515.82 tCO2e (13.07%) and 9843.76 tCO2e (23.32%), respectively. Regardless of location or construction method, steel and concrete remained the primary EC emitters, contributing nearly 80% of all material-related EC emissions.
At the module level (Table 4), EC emissions of steel modules were quantified across modular material production, module production, transportation, and on-site installation. The case building included 7 types of steel modules, which served as student dormitory units. Table 3 illustrates the EC composition for each module type. Specifically, individual module emissions ranged from 11.18 to 12.14 tCO2e, equivalent to an intensity of 499.52–578.23 kgCO2e/m2. Despite these variations in absolute values, the EC distribution remained consistent across all module types: approximately 93% of emissions originated from modular materials. The remaining 7% stemmed from energy consumption by equipment or vehicles during module production, transportation, and installation. This disparity confirms material consumption as the predominant EC source, highlighting significant potential for EC reduction. Notably, structural steel, which formed the module frame, contributed over 60% of the total EC emissions for each module unit.
At the building level, the average EC intensity for the superstructure was estimated at 553.81 kgCO2e/m2, while this figure rose to 949.84 kgCO2e/m2 when the substructure was included. This substantial increase could be largely attributed to the extensive use of steel, a highly EC-intensive material, in substructure elements such as walling, strutting, H-piles, and lagging plate.

5.2. Quantified Carbon Reduction Strategies

Based on the identified carbon emission hotspots mentioned above, this study further evaluated the carbon reduction performance of four key mitigation strategies and their combined solutions through scenario simulations. The results indicate that implementing integrated mitigation measures can achieve substantial reductions in carbon emissions for the case project. When all optimal mitigation strategies are implemented synergistically, the EC of the case building decreases from the baseline value of 47,569.03 tCO2e to 38,020.67 tCO2e, representing a reduction of 9548.36 tCO2e, equivalent to a 20.07% reduction rate.
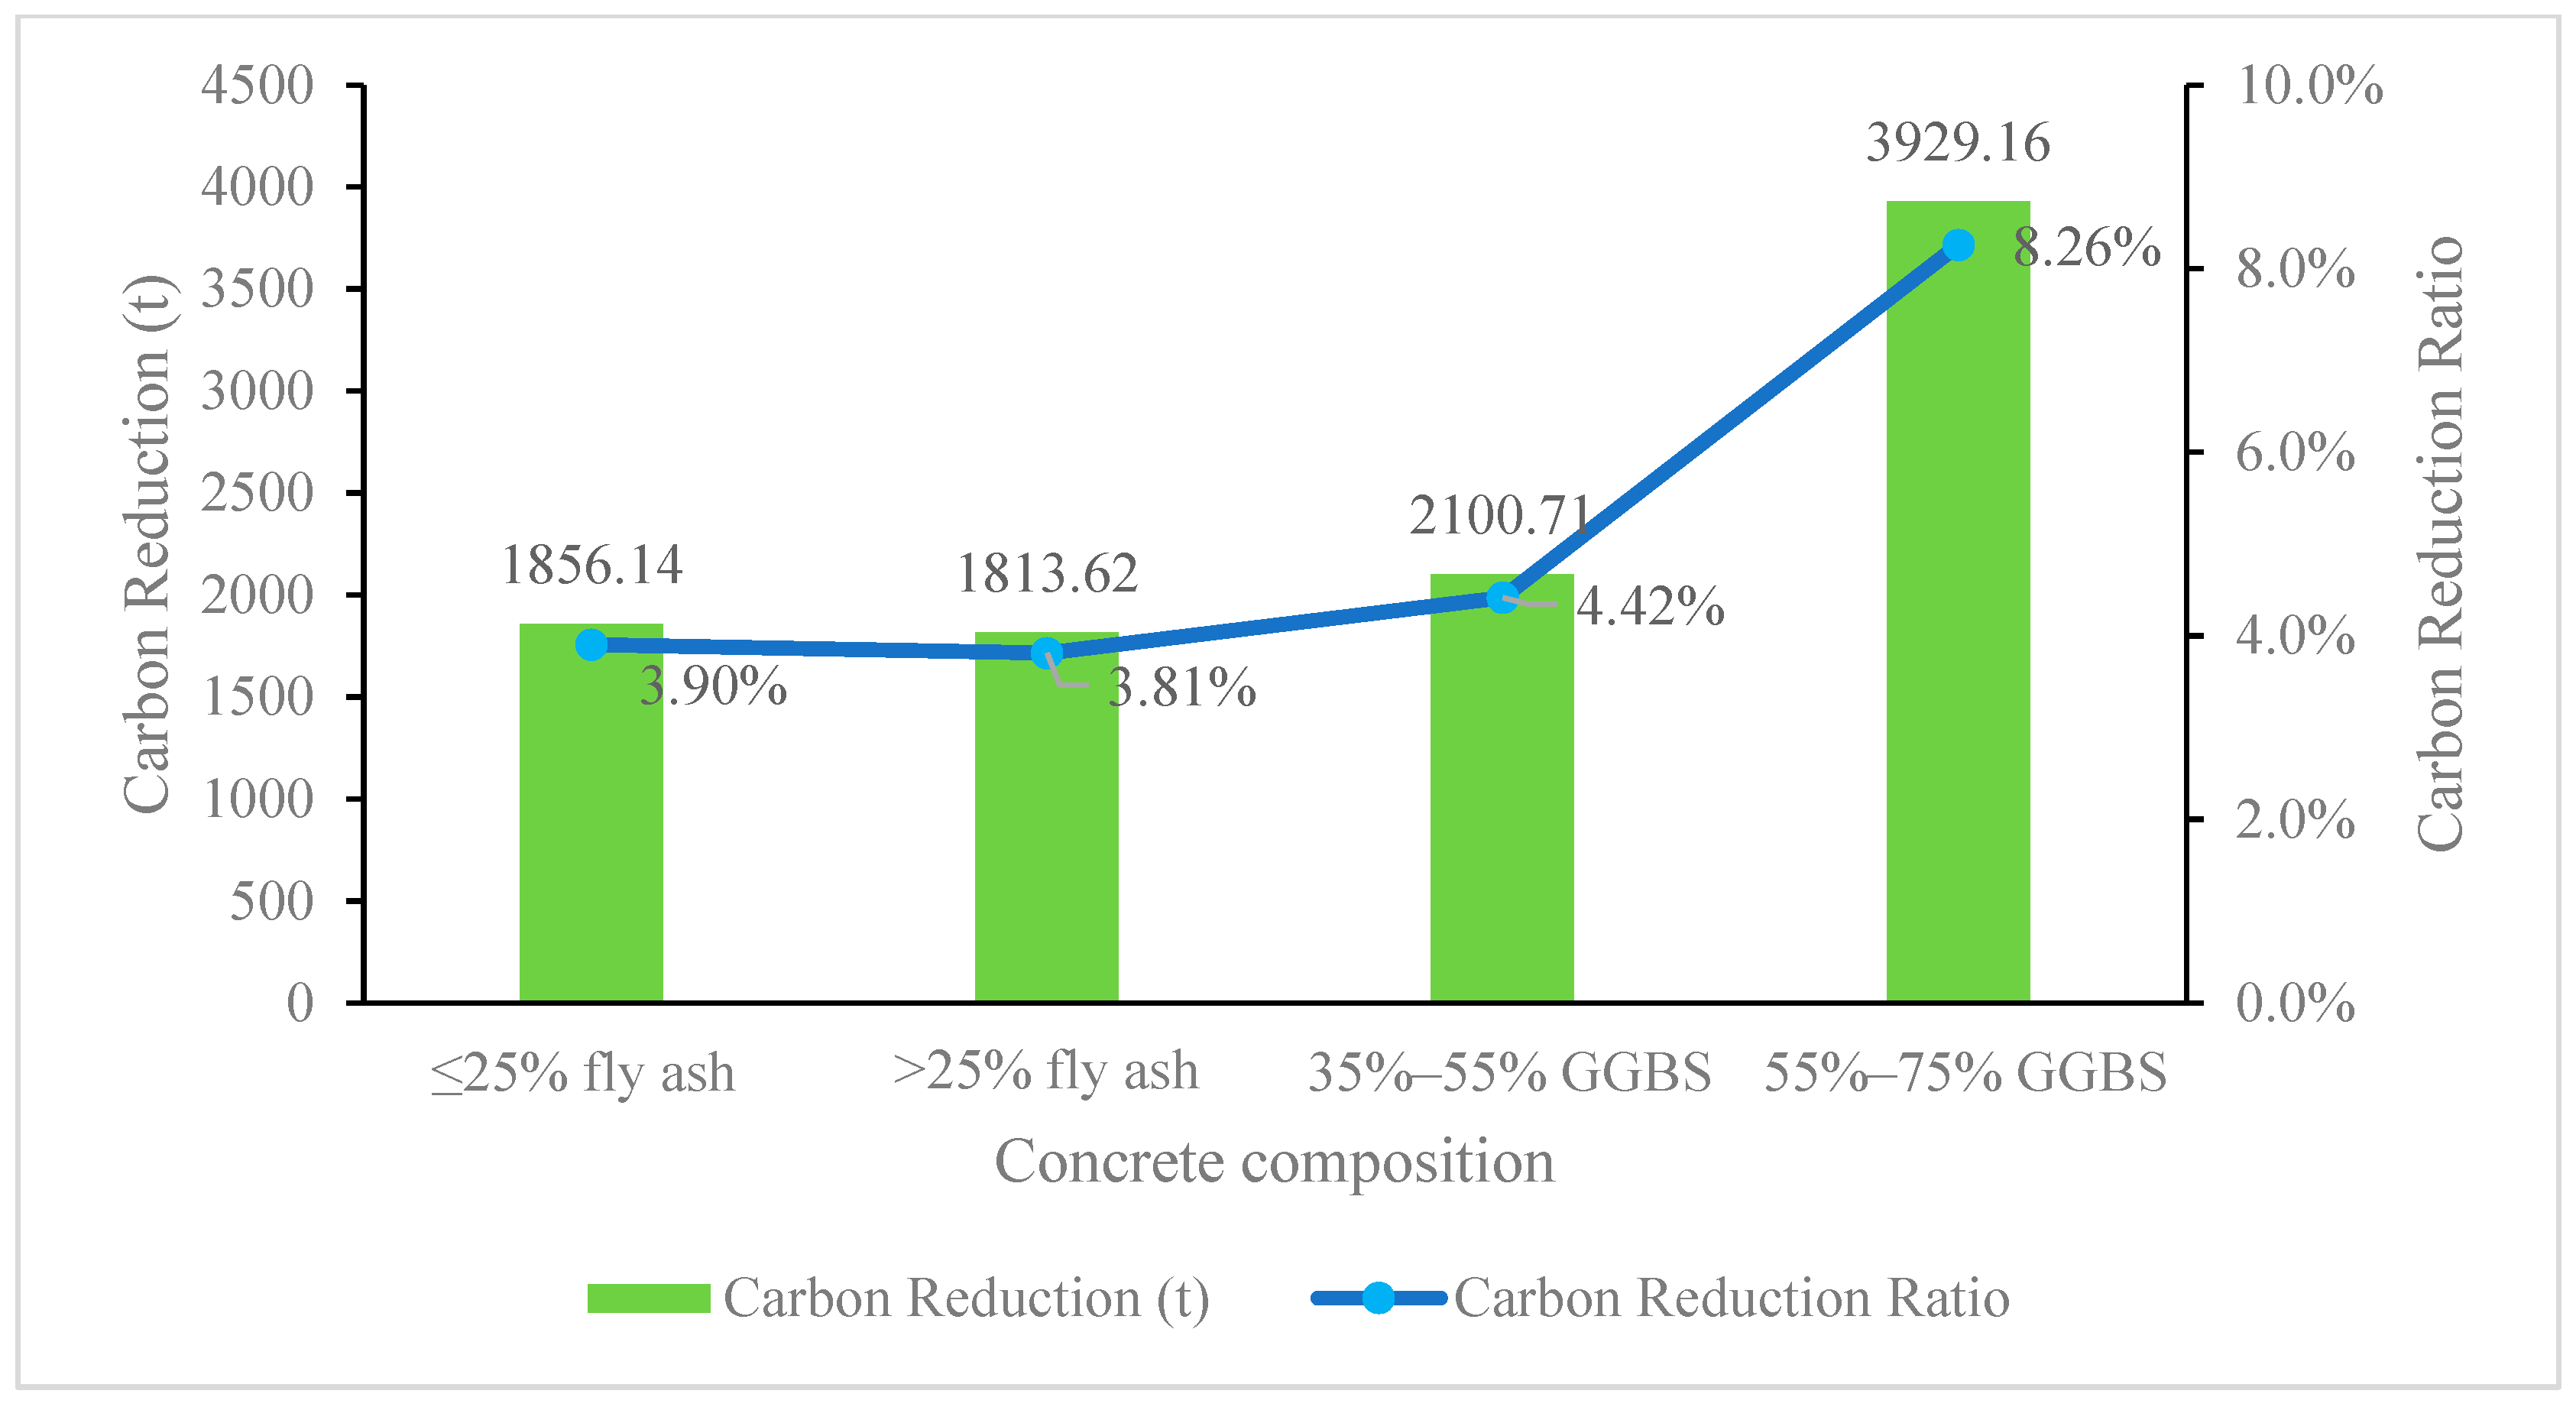
In the assessment of individual strategies, low-carbon material replacement (Strategy C) showed significant emission reduction benefits. Specifically, by increasing the replacement ratio of GGBS in concrete to 55–75% (Scenario C5), the EC from the project could be directly reduced by 3929.16 tCO2e, achieving an 8.26% reduction rate shown in Table 5. Figure 8 shows the comparison of carbon reduction across concrete compositions. This outcome aligns with the observation that the material production stage is the largest source of emissions, with steel and concrete being the primary contributors to material related emissions. Optimizing the concrete substitution ratio to reduce emissions at the source within the supply chain has been demonstrated as a key measure for lowering the emissions of MiC.
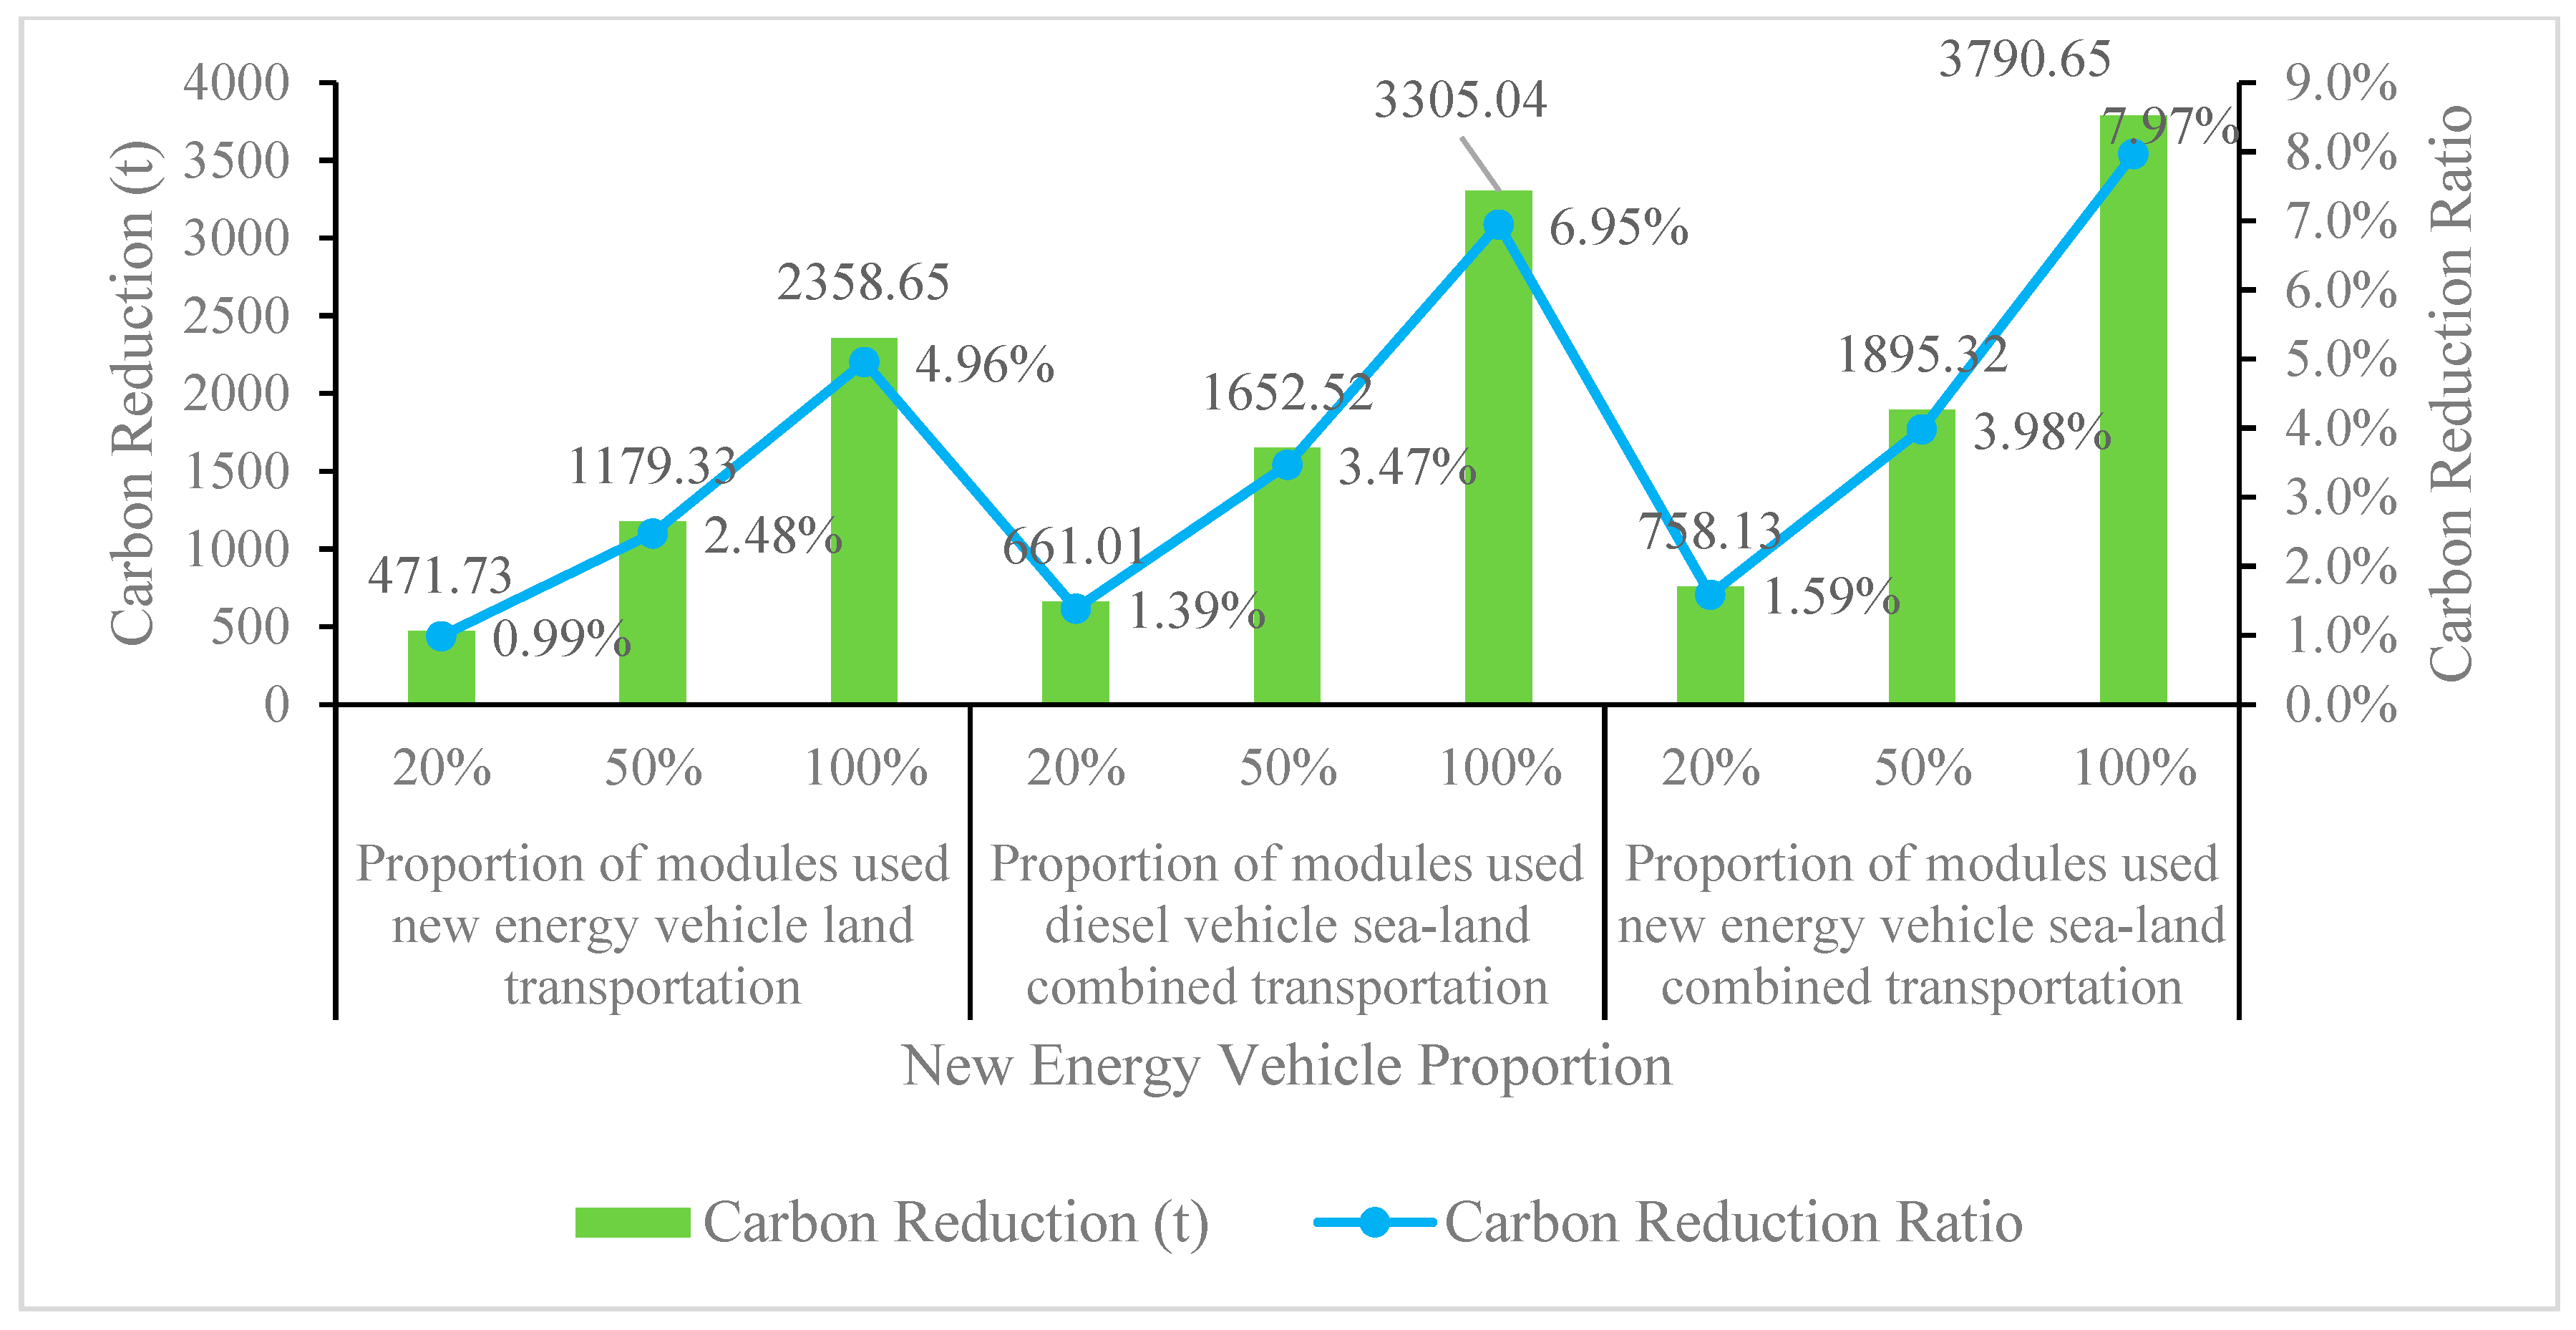
Meanwhile, optimizing transport modes (Strategy B) contributed to nearly the same share of emission reductions. By comprehensively implementing a transport solution combining new energy vehicles with combined sea–land transport (Scenario B10) shown in Table 6, emissions are reduced by 3790.65 tCO2e (7.97%). Conversely, the emission reduction results from using all new energy vehicles for land transport (Scenario B4, reduction of 2358.65 tCO2e) or relying entirely on traditional diesel vehicles for combined sea–land transport (Scenario B7, reduction of 3305.04 tCO2e) yield smaller reductions, as shown in Figure 9. This comparison shows that for long-distance MiC module transport, combining new energy vehicles with optimized route selection is critical for meaningful emission reductions.
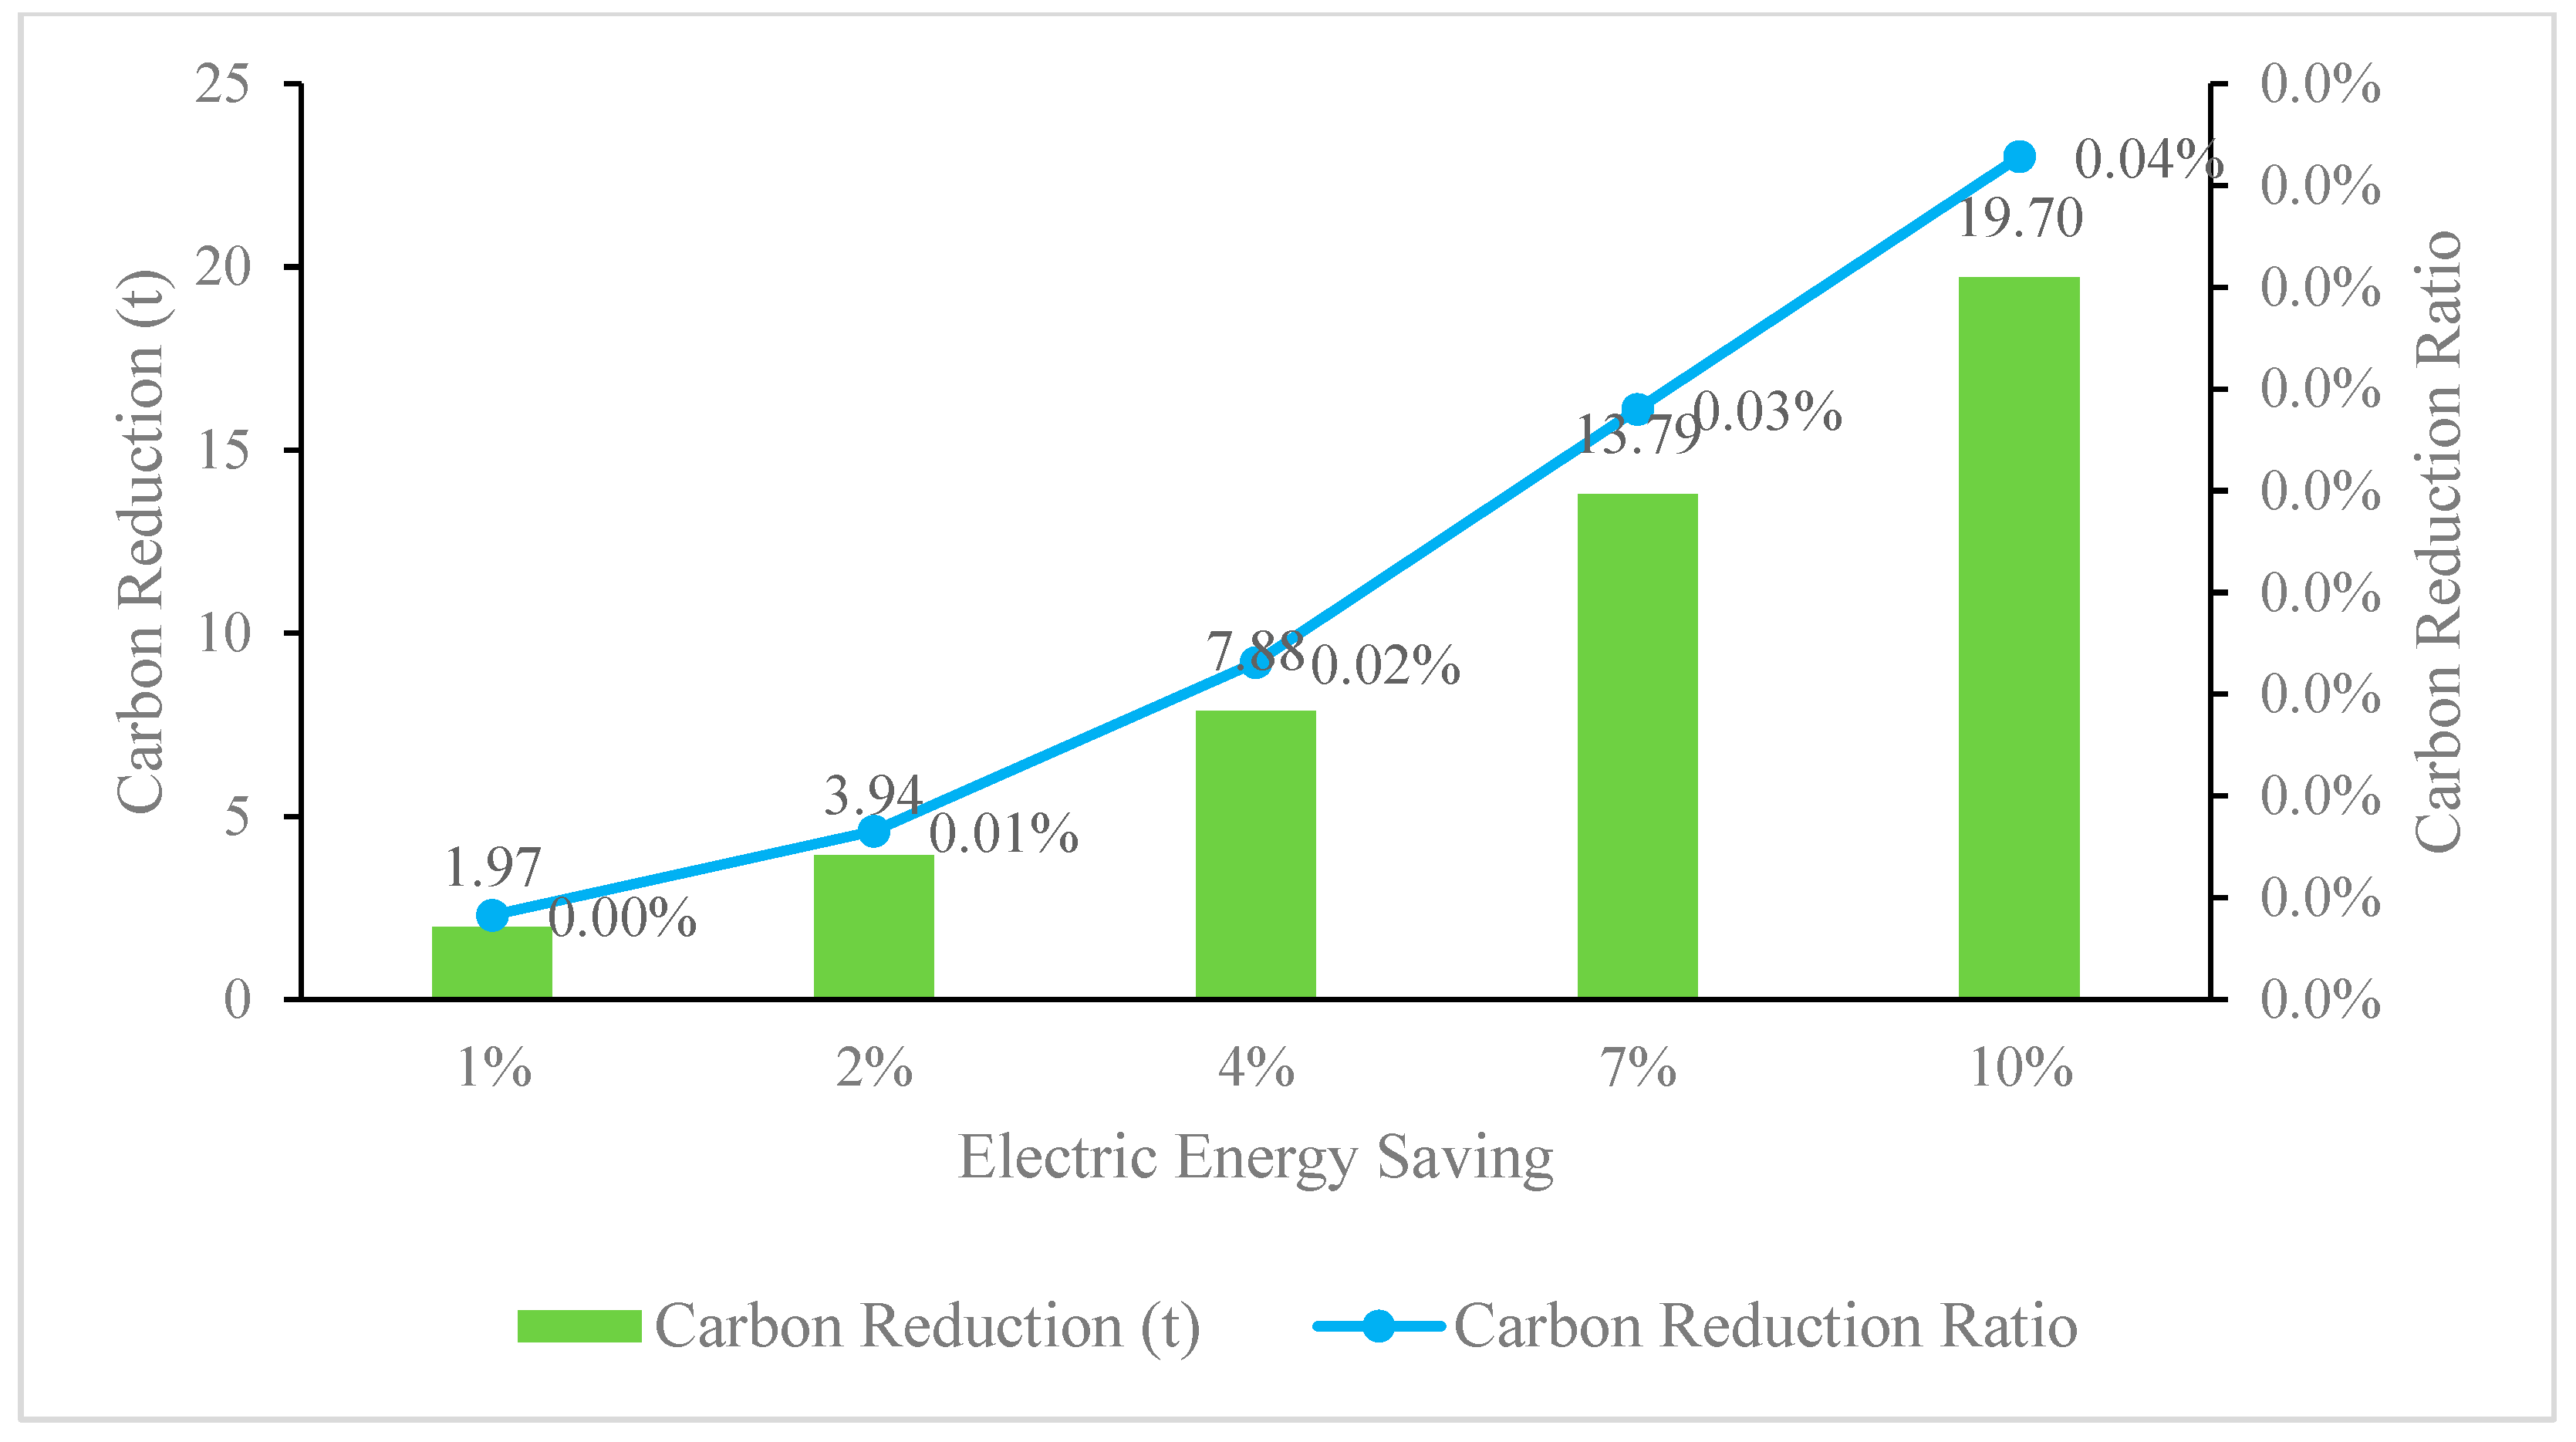
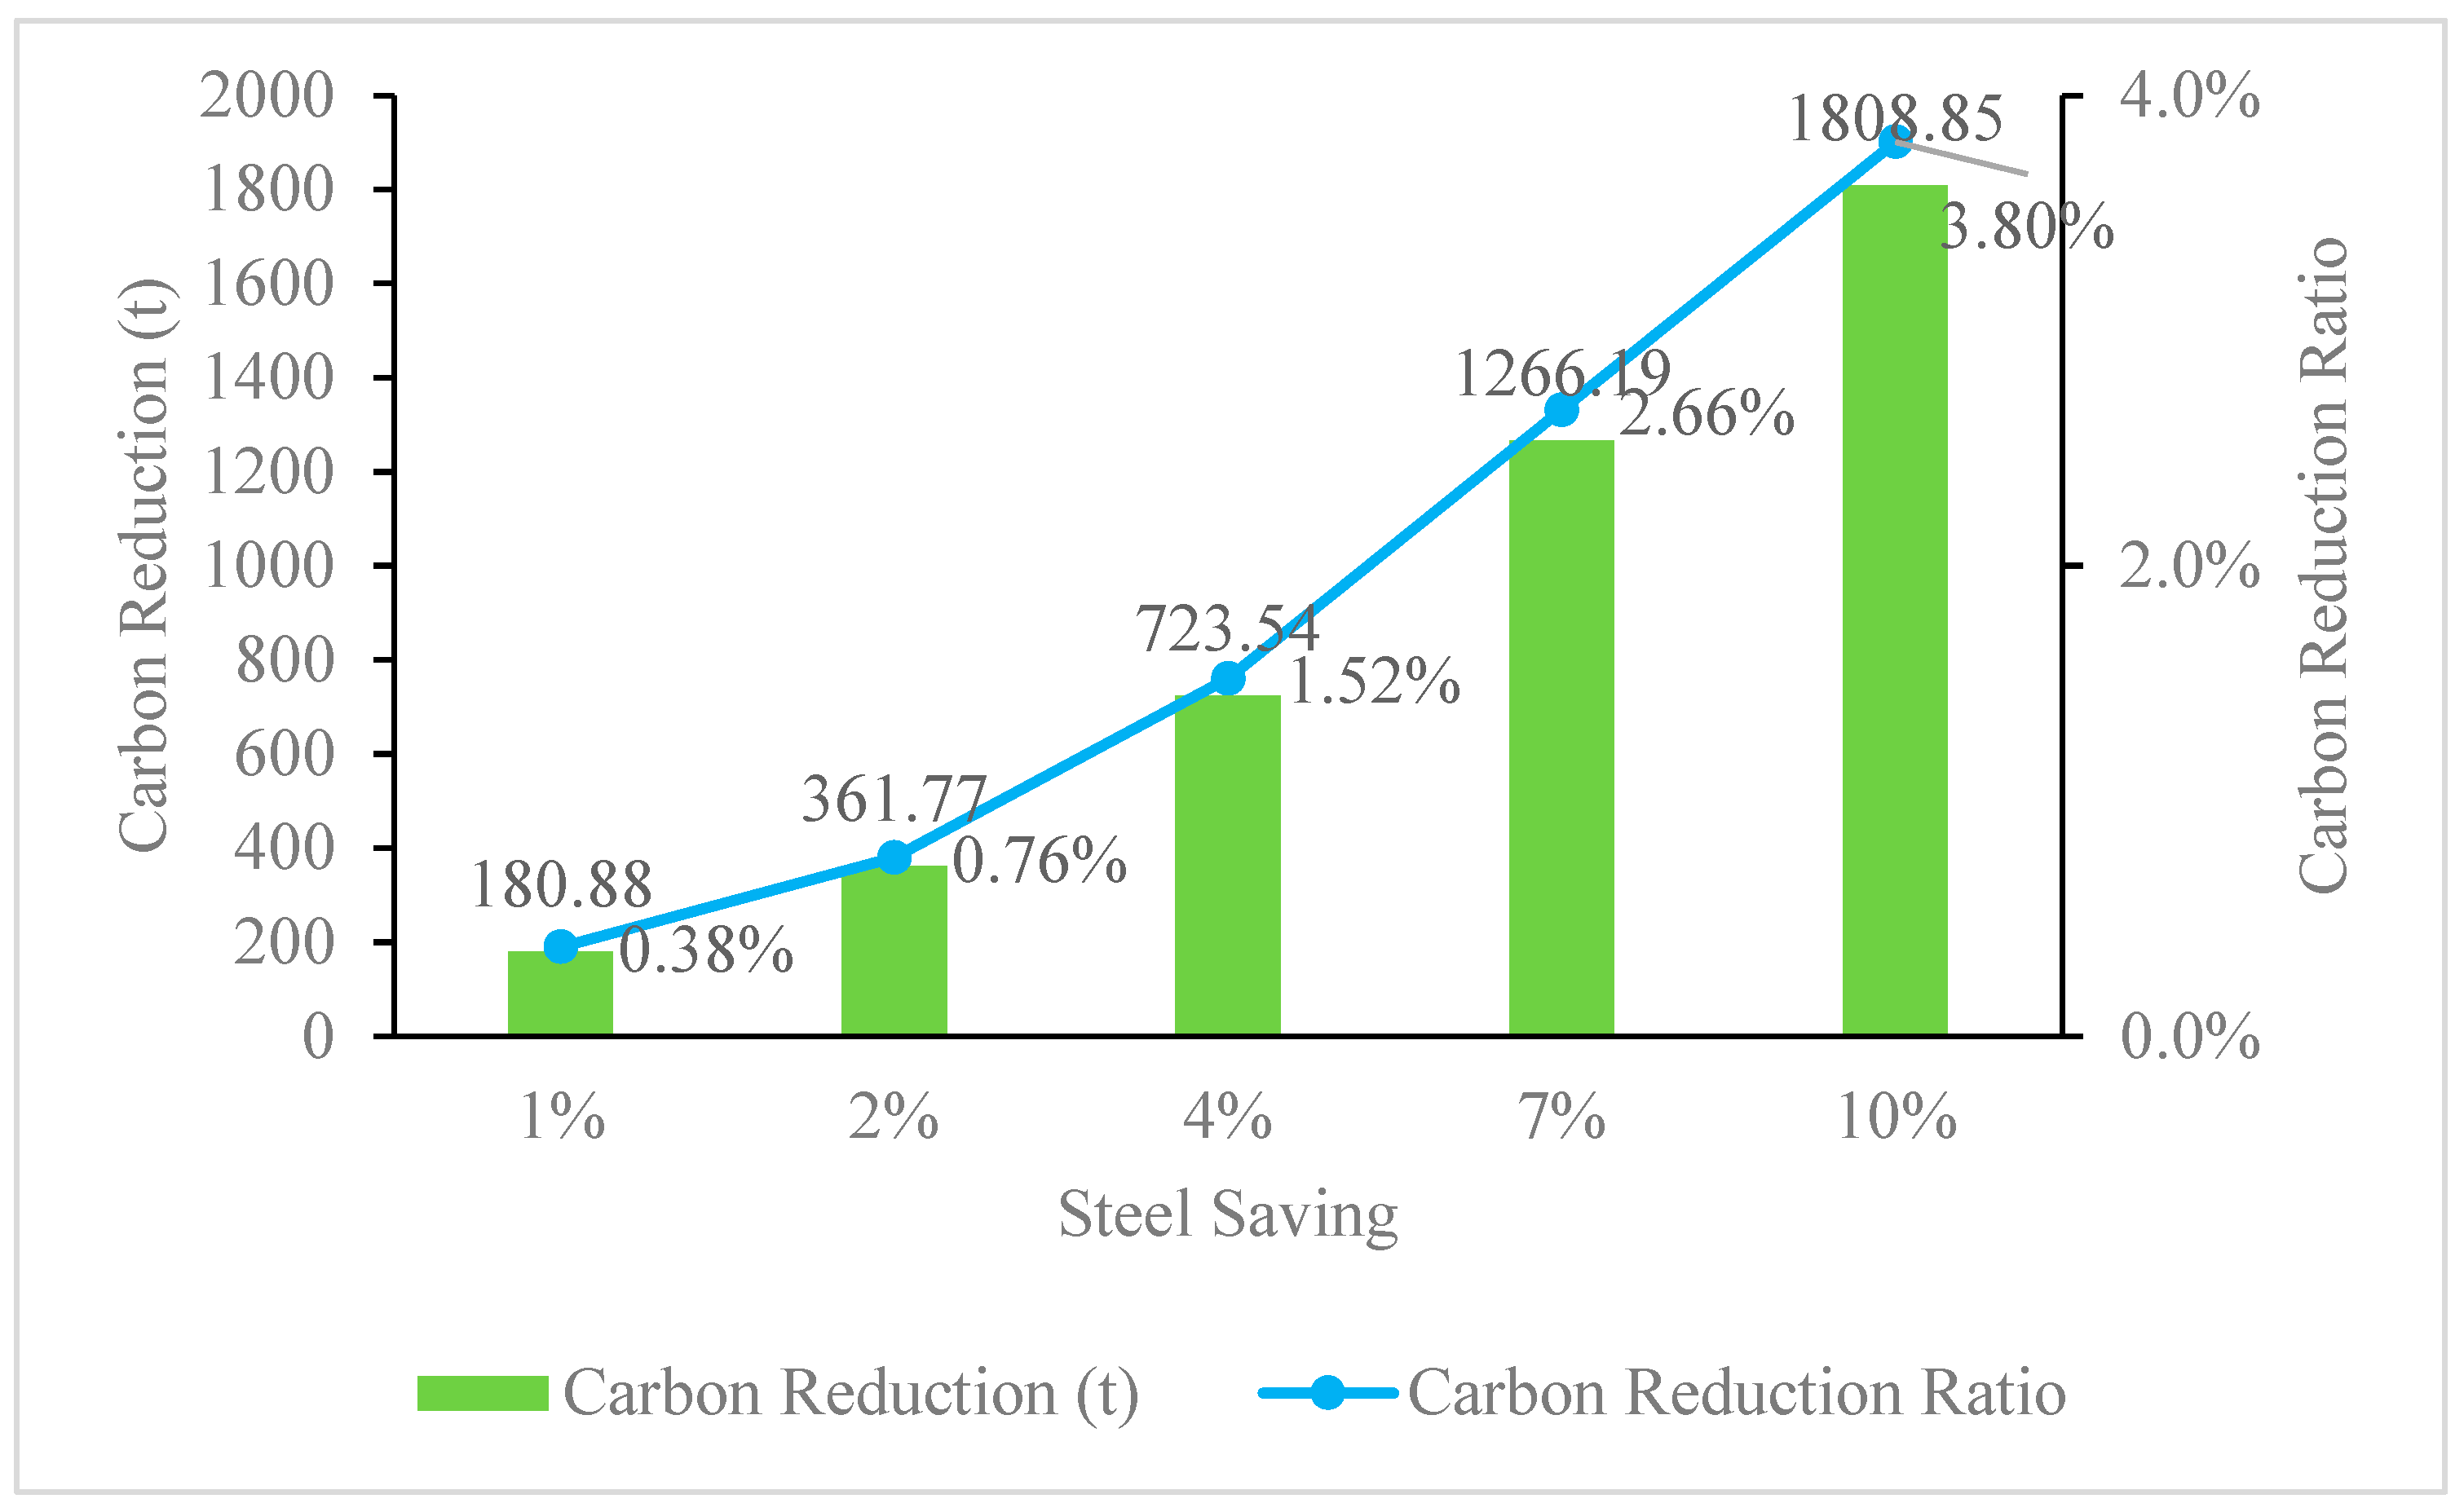
Electricity savings in the manufacturing factory (Strategy A) have a negligible impact on overall emissions, as shown in Figure 10. Even under the most favourable scenario (A11), achieving 10% electricity savings, the reduction amounts to only 19.7 tCO2e (approximately 0.04%), as shown in Table 7. Enhancing resource efficiency represents another opportunity to reduce emissions. Figure 11 shows the effects of different steel waste reduction methods on carbon reduction. Under the steel reduction strategy (Strategy D), achieving a 10% reduction in steel waste (Scenario D11) would deliver an additional 1808.85 tCO2e (3.8%) in emissions savings, as shown in Table 8. This reduction stems from the pivotal role of lean manufacturing and digital management in enhancing resource efficiency.

5.3. Efficiency Improvement in the Carbon Monitoring Process

Traditional manual carbon assessment is a time-consuming and labor-intensive process, as a large quantity of data must be collected from fragmented paper-based documentation and manually inputted to establish the carbon models. The proposed BIBP addresses this bottleneck by automating data collection, mapping, calculation, and verification processes.
To validate the extent to which the developed solution achieves time reduction, the total time required for the automated monitoring and modeling process was compared with that of traditional manual methods. The assessment breakdown is categorized into five hierarchical levels: material, component, assembly, flat, and building. Table 9 summarizes the comparative results of the time required for carbon assessment under both approaches. The traditional manual evaluation requires 816 min, while the proposed platform reduces this duration to 62 min, achieving a total efficiency improvement of 92.4%.
At the material level, both methods require 60 min to modify material parameters in databases for local context adaptation. At the higher structural levels (component, assembly, flat, and building), the proposed platform achieves an efficiency improvement exceeding 99%. In traditional evaluations, practitioners manually record equipment operation hours, track logistics, and establish relationships between dynamic activities and specific modules. This manual process is highly time-consuming (e.g., 290 min for components and 296 min for flats).
The proposed platform takes 0.5 min for each higher structural level. This time reduction results from three integrated technologies. IoT sensors autonomously capture high-frequency operational data which include RFID tracking and smart meter readings, replacing manual logging. BIM automatically maps these data streams to 3D spatial elements. Hyperledger Fabric then uses smart contracts to compute and validate carbon data transactions, eliminating manual auditing.
This efficiency improvement transforms building carbon management from a retrospective evaluation into a real-time monitoring process. By minimizing the labor required for data collection and validation, stakeholders can redirect their efforts toward implementing timely carbon reduction interventions during the cradle-to-end-of-construction phase.

5.4. Sensitivity Analysis

To quantify the relative influence of each mitigation strategy on overall embodied carbon outcomes, a one-at-a-time sensitivity analysis was conducted. Each strategy parameter was varied across its full feasible range while holding other strategies at baseline. The sensitivity coefficient (SC) was defined as the change in EC reduction per 1% change in the control parameter, enabling direct cross-strategy comparison.
The relationship between electricity saving rate and EC reduction is strictly linear, with SC = 1.97 tCO2e per 1% electricity saving. Even at the maximum feasible saving of 10%, the EC reduction amounts to only 19.70 tCO2e (0.04% of project baseline). Strategy A is therefore insensitive: a 10-fold increase in electricity saving effort yields no meaningful change in project-level embodied carbon.
Transport mode adoption exhibits a linear response across all sub-pathways. Adopting new energy vehicles for sea–land combined transport yields SC = 37.91 tCO2e per 1% module adoption, reaching a maximum of 3790.65 tCO2e (7.97%) at full adoption. By comparison, electrification of land-only routes yields SC = 23.59 tCO2e per 1%, 38% lower than the sea–land pathway. These results confirm that route selection is a more sensitive lever than vehicle electrification alone. Logistics network design at the pre-construction stage is therefore critical for meaningful transport-related emission reductions.
The sensitivity of EC reduction to the concrete replacement rate (i.e., the proportion of eligible structural elements adopting the alternative mix) was evaluated for all four substitution scenarios. All scenarios exhibit a strictly linear response, with SC of 18.56, 18.14, 21.01, and 39.29 tCO2e per 1% replacement rate for C2 (fly ash ≤ 25%), C3 (fly ash ≥ 25%), C4 (GGBS 35–55%), and C5 (GGBS 55–75%), respectively. This confirms that each additional percentage point of concrete substitution delivers a fixed, predictable increment in carbon reduction regardless of the current adoption level.
The most critical finding is the pronounced sensitivity advantage of high-ratio GGBS substitution. Strategy C5 delivers 39.29 tCO2e per 1% replacement rate—2.1× higher than fly ash scenarios (C2/C3). As a result, implementing C5 at only 50% replacement rate (1964.58 tCO2e) already exceeds the maximum achievable reduction under full replacement of fly ash scenario C2 (1856.14 tCO2e). This shows that high-ratio GGBS substitution generates disproportionately greater carbon benefits even at partial adoption. Table 10 presents EC reduction results across key replacement rate milestones for all four scenarios.
Steel waste reduction also exhibits a strictly linear response with SC = 180.89 tCO2e per 1% waste reduction, yielding a maximum of 1808.85 tCO2e (3.80%) at 10% waste reduction. The contrast with Strategy A is striking: despite both being manufacturing-stage interventions, Strategy D is 91.8× more sensitive per unit parameter change, reflecting the fundamentally higher carbon intensity of steel production relative to factory electricity consumption.
Table 11 summarises the sensitivity results across all four strategies. The ranking by maximum achievable reduction is: C (3929.16 tCO2e, 8.26%) > B (3790.65 tCO2e, 7.97%) > D (1808.85 tCO2e, 3.80%) >> A (19.70 tCO2e, 0.04%). Strategies B and C together account for approximately 80% of the total combined reduction potential, confirming that material specification and supply chain logistics decisions made at the pre-construction stage are the dominant determinants of embodied carbon outcomes for MiC projects. Strategy A contributes less than 0.3% of the combined potential and should not be prioritised in carbon management planning.

6. Discussion

This study systematically assessed the cradle-to-end-of-construction EC emissions and examined the reduction performance of potential strategies. Through a case study of a steel modular residential building in Hong Kong, several findings are summarized below.

6.1. Key Findings and Comparison with Literature

The total cradle-to-end-of-construction EC emissions of the steel case building were estimated at 949.84 kgCO2e/m2. Specifically, material production emerged as the dominant contributor, generating a total of 33,042.82 tCO2e (69.30%), followed by modularization (9359.46 tCO2e, 19.63%) and transportation (4613.03 tCO2e, 9.67%). The estimated result is significantly higher than the 609 kgCO2e/m2 reported by Zhang et al. [41]. This discrepancy can be largely attributed to variances in system boundaries. Although both studies aimed to assess the cradle to end of construction emissions of steel modular buildings, Zhang et al. [41] restricted their system boundary to the superstructure, excluding the material consumption and associated emissions of the substructure. In contrast, the present case study extended the system boundary to the entire building, including both superstructure and substructure. A total of 17,683.24 tCO2e EC generated in the substructure due to the extensive use of carbon-intensive materials required for load bearing and structural stability. More importantly, materials, encompassing both cast-in situ materials and modular materials, emerged as the predominant EC source, collectively accounting for 88.51% of the total cradle-to-end-of-construction EC emissions. Consistent with the previous studies [42,43], this important finding underscores the high EC intensity of material in the cradle-to-end-of-construction phase.

6.2. Carbon Reduction Strategy Analysis

The EC reduction potential of material-related optimization is significant. The EC performance of optimizing concrete substitution and reducing steel waste was examined, as these two materials together accounted for nearly 80% of all material-related EC. As evidenced in the comparisons of different reduction strategies, increasing the replacement ratio of GGBS in concrete to 55–75% resulted in an 8.26% reduction in total cradle-to-end-of-construction EC emissions. Meanwhile, a 10% reduction in steel waste led to an additional 3.8% in EC savings. These two strategies demonstrated their effectiveness by, respectively, lowering the emission factor of materials and reducing material consumption. These findings indicate that EC estimation results are highly sensitive to material composition and quantity and highlight the considerable potential for EC mitigation through optimizing material composition and improving material efficiency. These important findings broadly support evidence from previous studies [44,45]. Nonetheless, despite the EC reduction potential of optimized concrete substitution, the application of such low-carbon concrete in the construction industry remains constrained by their weakened structural performance and underdeveloped supply chain. Moreover, EC reduction potential can be substantially further enhanced if the assessment boundary is extended to its end-of-life phase. As highlighted by Wen et al. [21], some end-of-life strategies, such as reusing dismantled modules and recycling demolition waste materials, can achieve EC reductions of more than 60%, as these strategies significantly reduce the EC emitted from the same component using raw materials.
The EC reduction potential of optimizing transportation planning was significant, while saving electricity was limited during the cradle-to-end-of-construction phase. Specifically, replacing traditional diesel vehicles with new energy vehicles for land transport, coupled with the adoption of a hybrid sea–land transport mode, could yield an EC reduction of up to 7.97%. This encouraging finding further supports the work of Hussein et al. [46] and Wang et al. [44], who demonstrated the EC reduction performance of multimodal sea–land transport and green vehicles. This synergistic effect stems from the exceptional energy efficiency of maritime transport for long distance delivery of modular components, while new energy vehicles reduce carbon emissions from short distance land transport. The findings indicate that achieving deep decarbonization in MiC logistics depends on the structural integration of low-carbon transport modes, rather than the simple adoption of isolated measures. In contrast, a 10% reduction in electricity consumption resulted in a negligible decrease of merely 0.04% in total EC emissions. A possible explanation+n for this is that electricity-related EC emissions accounted for only a small proportion of the total cradle to end of construction emissions, making it difficult to achieve significant reductions even with efforts to save electricity. While electricity saving had a modest effect on mitigating overall cradle-to-end-of-construction EC emissions, it remains a critical lever for carbon reduction in the energy-intensive construction industry. This finding highlights the significant potential of transportation optimization in mitigating cradle-to-end-of-construction EC emissions for MC, offering contractors practical and effective solutions for EC reduction.

6.3. Platform Deployment and Cost-Effectiveness

While the 92.4% efficiency improvement in carbon assessment is significant, a comprehensive evaluation must also account for the time and cost associated with deploying the monitoring system itself. The system implementation for the case project required approximately 4 to 8 weeks from initial hardware procurement to full operational deployment across three lifecycle phases. The investment involved three categories: hardware procurement, including IoT sensors, RFID tags, GPS units, network gateways, and edge computing devices, totaling approximately HKD 150,000 to 250,000; software development and integration, including BIM platform customization, blockchain network configuration, smart contract development, and dashboard design, totaling approximately HKD 300,000 to 500,000; and personnel training for site staff on sensor maintenance and platform operation, requiring 10 to 15 person-days. The total implementation cost represented approximately 0.3% to 0.8% of the overall project value.
However, several factors contribute to favorable long-term cost-effectiveness. First, the hardware components, particularly passive RFID tags and GPS trackers, have become increasingly affordable due to mass production and standardization. Second, the platform architecture is designed for reuse across multiple projects; once developed, only site-specific sensor installation and calibration are required for subsequent deployments, substantially reducing marginal costs. Third, the continuous labor cost savings from automated data collection accumulate over the project lifecycle. The implementation costs and time should therefore be evaluated in the context of multi-project deployment rather than a single application. A formal cost–benefit analysis quantifying the return on investment across multiple project deployments is identified as an important direction for future research.
The carbon reduction strategies identified in Section 5.2, such as slag concrete substitution, new energy transport, and steel waste reduction, can in principle be identified through conventional project-level analysis without the proposed platform. The distinct value of BIBP lies not in discovering these strategies but in enabling their rapid evaluation and continuous monitoring during active construction. Traditional manual carbon assessment requires approximately 816 min per evaluation cycle, as demonstrated in Section 5.3, which severely limits assessment frequency and delays management decisions. The proposed platform reduces this duration to 62 min, allowing project managers to evaluate the effects of combined reduction strategies promptly and adjust interventions during ongoing construction. This real-time capability is particularly valuable for combined reduction scenarios, where interaction effects among multiple measures are difficult to predict through one-time static analysis. The platform enables managers to observe combined reduction outcomes in near real-time, supporting evidence-based decision-making throughout the construction process rather than relying on post hoc evaluation.

6.4. Theoretical Implications

This study makes three theoretical contributions to the fields of construction carbon management.
First, this study extends CPS theory to the domain of construction carbon monitoring. While the CPS paradigm has been widely applied in manufacturing and smart infrastructure, its application to construction-phase carbon quantification remains limited. The proposed BIBP platform operationalizes the CPS triplet by establishing continuous feedback loops between physical construction activities and computational emission models. This operationalization demonstrates that CPS theory can serve as a viable theoretical foundation for real-time environmental monitoring in project-based industries characterized by temporary organizations, fragmented supply chains, and geographically distributed operations.
Second, this study advances LCA methodology by demonstrating a feasible transition from static material-based estimation to dynamic activity-based monitoring within the cradle-to-end-of-construction boundary. Conventional PLCA treats construction as a deterministic assembly of materials with fixed emission factors. The proposed platform challenges this assumption by capturing real-time operational variables, including actual machinery operation time, fuel consumption, and electricity usage, that are absent from traditional bill-of-quantities-based calculations. The results from Section 5.1 show that carbon emissions from modularization, transportation, and installation collectively account for 30.70% of total embodied carbon, a share that static methods can only approximate through assumptions rather than measurement. This finding provides empirical support for the argument that activity-based monitoring yields more accurate and actionable emission profiles than material-based estimation alone.
Third, this study addresses the theoretical gap in trust mechanisms for multi-stakeholder carbon data governance. In fragmented MiC supply chains, the accuracy of reported carbon data depends on the voluntary compliance of independent organizations with competing interests. The integration of Hyperledger Fabric blockchain into the monitoring workflow transforms carbon data governance from a procedural trust model, relying on manual auditing and contractual obligations, to a cryptographic trust model, relying on immutable ledger records and smart contract validation. This shift has theoretical significance beyond MiC: it demonstrates a generalizable mechanism for establishing data integrity in any multi-organizational environmental reporting context where information asymmetry and greenwashing risks exist.

6.5. Policy Implications

The findings of this study carry several implications for policymakers and industry practitioners.
First, the demonstrated capability for real-time carbon monitoring supports the feasibility of transitioning from retrospective carbon auditing to continuous compliance monitoring in regulatory frameworks. Current carbon reporting mandates, including the Hong Kong Environmental Protection Department carbon audit guidelines and China’s mandatory carbon trading scheme for the construction sector [5,34,35], rely on post-construction assessments submitted by project teams. The BIBP platform demonstrates that continuous, blockchain-verified emission records can be generated throughout the construction process, providing regulators with a technical basis for requiring real-time carbon reporting rather than periodic post hoc submissions.
Second, the carbon reduction results in Section 5.2 provide quantitative evidence to inform green procurement policies. The finding that GGBS-blended concrete (55–75% replacement) achieves an 8.26% reduction in total embodied carbon, while combined sea–land transport with new energy vehicles achieves a 7.97% reduction, offers policymakers specific benchmarks for setting minimum requirements in public procurement standards for MiC projects. These quantified benchmarks can be incorporated into green building rating systems such as BEAM Plus to incentivize the adoption of verified low-carbon practices.
Third, the blockchain-secured carbon records generated by the platform provide the data infrastructure necessary for integrating construction-phase emissions into carbon trading markets. The immutability and traceability of on-chain emission records address a key barrier to market participation: the difficulty of verifying self-reported construction emissions. Policymakers designing carbon trading mechanisms for the construction sector can reference the BIBP architecture as a technical model for ensuring that traded carbon credits are backed by verifiable, tamper-proof emission data.

6.6. Limitations

This study has several limitations that should be acknowledged. First, the analysis focuses exclusively on the cradle-to-end-of-construction phase, excluding operational and end-of-life emissions. The high reusability of steel modules could offer significant carbon credits during demolition and recycling stages, which the current results do not capture. Future research should extend the boundaries to include all lifecycle stages.
Second, the platform was validated through a single case project with 893 modules. Scaling the sensing infrastructure to larger projects involving thousands of modules or multiple concurrent sites would increase hardware deployment complexity, network bandwidth requirements, and data management overhead. The Hyperledger Fabric blockchain, while suitable for the current case, may encounter throughput limitations under substantially higher transaction volumes. Future work should conduct multi-project validation across different structural systems, building typologies, and geographical contexts, and evaluate blockchain performance under scaled transaction loads.
Third, the practical adoption of blockchain-based carbon monitoring faces several barriers. Independent stakeholders in MiC supply chains may resist participation due to concerns over operational data transparency and competitive sensitivity, despite the channel-based data isolation mechanism. The computational and administrative overhead of maintaining a permissioned blockchain network adds cost and complexity that smaller contractors may find prohibitive. Future research should investigate governance frameworks and incentive mechanisms that encourage multi-stakeholder blockchain adoption, and engage with regulatory bodies to establish the legal standing of blockchain-verified carbon data.

7. Conclusions

Effective management of carbon emissions in MiC requires accurate tracking mechanisms to eliminate manual delays and prevent data manipulation. This study developed an integrated cyber-physical BIBP platform combining IoT, BIM, and blockchain. It established a secure and automated monitoring framework for the EC during the project delivery stages while evaluating the effectiveness of targeted mitigation strategies.
Implementation on a 15-story MiC project in Hong Kong provided specific quantitative results. The baseline assessment established the total carbon emissions at 47,682.03 tCO2e, identifying material production as the dominant source, contributing 69.30% of total emissions. Steel and concrete together constituted nearly 80% of all material-related emissions, confirming these materials as critical intervention points for steel-framed MiC projects. The digital platform substantially improved assessment time efficiency by 92.4% through automation of data acquisition and calculation processes. Furthermore, scenario simulations showed that integrating high-volume slag concrete substitution, new energy sea–land multimodal transport, and steel waste reduction lowers total project emissions by over 20%.
This research makes several key contributions to extant literature. Methodologically, this study operationalizes CPS theory for construction carbon monitoring by formalizing the feedback loops between physical sensing, computational modeling, and operational decision-making. It advances LCA practice from static material-based estimation to dynamic activity-based monitoring. It further introduces a cryptographic trust model for multi-stakeholder carbon data governance, replacing procedural auditing with blockchain-enforced immutability across fragmented supply chains. Empirically, this study provides the comprehensive carbon profile of a high-rise steel MiC building (15 stories, 893 modules) covering the full cradle-to-end-of-construction boundary including the substructure, addressing the concentration of existing studies on low-rise structures. The quantified reduction scenarios establish specific benchmarks, namely 8.26% from GGBS concrete substitution, 7.97% from optimized multimodal transport, and 20.07% from combined strategies, that serve as reference values for future comparative studies. Practically, the platform equips contractors with a secure, automated tool to track cumulative emissions in real time and guarantee ledger immutability, reducing carbon assessment time by 92.4%. The validated reduction scenarios offer direct parameters for stakeholders to execute timely environmental interventions during the active construction phase, and the blockchain-verified emission records provide the data infrastructure necessary for integration with emerging carbon trading and regulatory reporting frameworks.

Author Contributions

Conceptualization, Y.T.; methodology, Y.Z. (Yaning Zhang); software, C.C.; formal analysis, X.W. (Xinping Wen) and X.W. (Xiaohan Wu); investigation, Y.Z. (Yiyu Zhao), X.W. (Xiaohan Wu); resources, M.P.B.L.; data curation, X.W. (Xinping Wen) and M.P.B.L.; writing—original draft preparation, Y.Z. (Yiyu Zhao); writing—review and editing, Y.Z. (Yiyu Zhao), Y.Z. (Yaning Zhang) and X.W. (Xiaohan Wu); supervision, Y.T.; project administration, Y.T.; funding acquisition, Y.T. All authors have read and agreed to the published version of the manuscript.

Funding

This study was supported by the Shenzhen Science and Technology Innovation Commission (Grant No. JCYJ20220818102211024), the Hong Kong Polytechnic University Carbon Neutrality Fund (No. P0043733) and the General Research Fund of the Hong Kong Research Grants Council (Project No.: 15220923).

Data Availability Statement

The data presented in this study is available on request from the corresponding author.

Acknowledgments

Acknowledged is support from the Campus Development Office of Hong Kong Polytechnic University and AluHouse Company Limited for access to the case building for this study.

Conflicts of Interest

The authors declare no conflicts of interest.

Abbreviations

The following abbreviations are used in this manuscript:
BIBPBlockchain-enabled IoT-BIM Platform
MiCModular Integrated Construction
IoTInternet of Things
BIMBuilding Information Modeling
CPSCyber-physical Systems
ECEmbodied Carbon
LCALife Cycle Assessment
PLCAProcess-based Life Cycle Assessment
CLCDChinese Life Cycle Database
RFIDRadio Frequency Identification
UHFUltra-High Frequency
GPSGlobal Positioning System
MQTTMessage Queuing Telemetry Transport
TLSTransport Layer Security
IFCIndustry Foundation Classes
GUIDGlobally Unique Identifier
GWPGlobal Warming Potential
CPUCentral Processing Unit
TPSTransactions Per Second
GGBSGround Granulated Blast Furnace Slag
SCSensitivity Coefficient

Appendix A. Detailed Mathematical Formulations

This appendix provides the detailed derivations and supplementary formulations referenced in Section 3.2, Section 3.3 and Section 3.4 of the main text.

Appendix A.1. Temporal Synchronization Protocol

The backend performs temporal synchronization across all data streams using the network time protocol. The clock offset between client and server is computed as follows:
Δ t sync   =   t 1   -   t 0 + t 2   -   t 3 2
where t 0 is client request timestamp, t 1 is server receive timestamp, t 2 is server transmit timestamp, and t 3 is client receive timestamp. This synchronization standardizes data formats before computing layer transmission, mitigating semantic heterogeneity inherent in multimodal construction data.

Appendix A.2. Microservice Containerization and Orchestration

The computing layer implements containerization through Docker for microservice isolation. Each microservice is defined as an independent deployment unit:
MS   =   i = 1 n image i , resources i , network i
where MS denotes the complete microservice system, image i is the Docker container image for the i-th service, resources i specifies the allocated computational resources including CPU and memory limits, and network i defines the virtual network configuration governing inter-service communication. This architecture ensures that updates to one component do not affect system stability.
Kubernetes orchestration manages container deployment across cloud infrastructure, optimizing resource utilization through horizontal pod autoscaling:
r desired   =   r current   ×   μ target μ current
where r desired is desired replica count, r current is current replica count, μ t a r g e t is target central processing unit (CPU) utilization, and μ current is current CPU utilization.

References

  1. IEA. Global CO2 Emissions from Buildings, Including Embodied Emissions from New Construction. Available online: https://www.iea.org/data-and-statistics/charts/global-co2-emissions-from-buildings-including-embodied-emissions-from-new-construction-2022 (accessed on 12 April 2026).
  2. Wuni, I.Y.; Shen, G.Q. Barriers to the adoption of modular integrated construction: Systematic review and meta-analysis, integrated conceptual framework, and strategies. J. Clean. Prod. 2020, 249, 119347. [Google Scholar] [CrossRef] [Scilit]
  3. Tumminia, G.; Guarino, F.; Longo, S.; Ferraro, M.; Cellura, M.; Antonucci, V. Life cycle energy performances and environmental impacts of a prefabricated building module. Renew. Sustain. Energy Rev. 2018, 92, 272–283. [Google Scholar] [CrossRef] [Scilit]
  4. Environment and Ecology Bureau of the Hong Kong Special Administrative Region Government. Hong Kong’s Climate Action Plan 2050; Environment and Ecology Bureau: Hong Kong, China, 2021. [Google Scholar]
  5. The European Parliament and of The Council. Directive (EU) 2022/2464 of the European Parliament and of the Council of 14 December 2022 Amending Regulation (EU) No 537/2014, Directive 2004/109/EC, Directive 2006/43/EC and Directive 2013/34/EU, as Regards Corporate Sustainability Reporting. Available online: https://eur-lex.europa.eu/eli/dir/2022/2464/oj/eng (accessed on 12 April 2026).
  6. Ibn-Mohammed, T.; Greenough, R.; Taylor, S.; Ozawa-Meida, L.; Acquaye, A. Operational vs. embodied emissions in buildings—A review of current trends. Energy Build. 2013, 66, 232–245. [Google Scholar] [CrossRef] [Scilit]
  7. Vitale, P.; Spagnuolo, A.; Lubritto, C.; Arena, U. Environmental performances of residential buildings with a structure in cold formed steel or reinforced concrete. J. Clean. Prod. 2018, 189, 839–852. [Google Scholar] [CrossRef] [Scilit]
  8. Liew, J.Y.R.; Chua, Y.S. Innovative modular systems for high-rise buildings. Eng. Struct. 2025, 323, 119270. [Google Scholar] [CrossRef] [Scilit]
  9. Yu, D.; Tan, H.; Ruan, Y. A future bamboo-structure residential building prototype in China: Life cycle assessment of energy use and carbon emission. Energy Build. 2011, 43, 2638–2646. [Google Scholar] [CrossRef] [Scilit]
  10. Olawumi, T.O.; Chan, D.W.M.; Ojo, S.; Yam, M.C.H. Automating the modular construction process: A review of digital technologies and future directions with blockchain technology. J. Build. Eng. 2022, 46, 103720. [Google Scholar] [CrossRef] [Scilit]
  11. Centobelli, P.; Cerchione, R.; Vecchio, P.D.; Oropallo, E.; Secundo, G. Blockchain technology for bridging trust, traceability and transparency in circular supply chain. Inf. Manag. 2022, 59, 103508. [Google Scholar] [CrossRef] [Scilit]
  12. Liu, Y.; Tao, X.; Das, M.; Gong, X.; Liu, H.; Xu, Y.; Xie, A.; Cheng, J.C.P. Blockchain-enabled platform-as-a-service for production management in off-site construction design using openBIM standards. Autom. Constr. 2024, 164, 105447. [Google Scholar] [CrossRef] [Scilit]
  13. EN 15978; Sustainability of Construction Works—Assessment of Environmental Performance of Buildings—Calculation Method. European Committee for Standardization: Brussels, Belgium, 2011.
  14. National Standards Authority of Ireland. Sustainability of Construction Works, Assessment of Environmental Performance of Buildings: Calculation Method; NSAI: Dublin, Ireland, 2011. [Google Scholar]
  15. Shadram, F.; Mukkavaara, J. Improving Life Cycle Sustainability and Profitability of Buildings through Optimization: A Case Study. Buildings 2022, 12, 497. [Google Scholar] [CrossRef] [Scilit]
  16. Fenner, A.E.; Kibert, C.J.; Woo, J.; Morque, S.; Razkenari, M.; Hakim, H.; Lu, X. The carbon footprint of buildings: A review of methodologies and applications. Renew. Sustain. Energy Rev. 2018, 94, 1142–1152. [Google Scholar] [CrossRef] [Scilit]
  17. Monahan, J.; Powell, J.C. An embodied carbon and energy analysis of modern methods of construction in housing: A case study using a lifecycle assessment framework. Energy Build. 2011, 43, 179–188. [Google Scholar] [CrossRef] [Scilit]
  18. Quale, S.L.; Talbot, J.B. Electrophoretic deposition of substrate-normal-oriented single-walled carbon nanotube structures. J. Electrochem. Soc. 2007, 154, K25–K28. [Google Scholar] [CrossRef] [Scilit]
  19. Pervez, H.; Ali, Y.; Petrillo, A. A quantitative assessment of greenhouse gas (GHG) emissions from conventional and modular construction: A case of developing country. J. Clean. Prod. 2021, 294, 126210. [Google Scholar] [CrossRef] [Scilit]
  20. Omar, W.M.S.W.; Doh, J.-H.; Panuwatwanich, K.; Miller, D. Assessment of the embodied carbon in precast concrete wall panels using a hybrid life cycle assessment approach in Malaysia. Sustain. Cities Soc. 2014, 10, 101–111. [Google Scholar] [CrossRef] [Scilit]
  21. Wen, X.; Teng, Y.; Shen, G.Q. Extended end-of-life carbon assessment and savings: A case study of steel-framed modular buildings in Hong Kong. Build. Environ. 2024, 266, 112056. [Google Scholar] [CrossRef] [Scilit]
  22. Aye, L.; Ngo, T.; Crawford, R.H.; Gammampila, R.; Mendis, P. Life cycle greenhouse gas emissions and energy analysis of prefabricated reusable building modules. Energy Build. 2012, 47, 159–168. [Google Scholar] [CrossRef] [Scilit]
  23. Chastas, P.; Theodosiou, T.; Kontoleon, K.J.; Bikas, D. Normalising and assessing carbon emissions in the building sector: A review on the embodied CO2 emissions of residential buildings. Build. Environ. 2018, 130, 212–226. [Google Scholar] [CrossRef] [Scilit]
  24. Takano, A.; Winter, S.; Hughes, M.; Linkosalmi, L. Comparison of life cycle assessment databases: A case study on building assessment. Build. Environ. 2014, 79, 20–30. [Google Scholar] [CrossRef] [Scilit]
  25. GB/T 51366-2019; Standard for Building Carbon Emission Calculation. Ministry of Housing and Urban-Rural Development of the People’s Republic of China: Beijing, China, 2019.
  26. Zhang, Y.; Jiang, X.; Cui, C.; Skitmore, M. BIM-based approach for the integrated assessment of life cycle carbon emission intensity and life cycle costs. Build. Environ. 2022, 226, 109691. [Google Scholar] [CrossRef] [Scilit]
  27. Ding, Z.; Liu, S.; Luo, L.; Liao, L. A building information modeling-based carbon emission measurement system for prefabricated residential buildings during the materialization phase. J. Clean. Prod. 2020, 264, 121728. [Google Scholar] [CrossRef] [Scilit]
  28. Gao, H.; Wang, D.; Du, X.; Zhao, Z. An LCA-BIM integrated model for carbon-emission calculation of prefabricated buildings. Renew. Sustain. Energy Rev. 2024, 203, 114775. [Google Scholar] [CrossRef] [Scilit]
  29. Zhong, R.Y.; Peng, Y.; Xue, F.; Fang, J.; Zou, W.; Luo, H.; Ng, S.T.; Lu, W.; Shen, G.Q.; Huang, G.Q. Prefabricated construction enabled by the Internet-of-Things. Autom. Constr. 2017, 76, 59–70. [Google Scholar] [CrossRef] [Scilit]
  30. Kolahan, A.; Maadi, S.R.; Teymouri, Z.; Schenone, C. Blockchain-based solution for energy demand-side management of residential buildings. Sustain. Cities Soc. 2021, 75, 103316. [Google Scholar] [CrossRef] [Scilit]
  31. Wang, M.; Wang, B.; Abareshi, A. Blockchain technology and its role in enhancing supply chain integration capability and reducing carbon emission: A conceptual framework. Sustainability 2020, 12, 10550. [Google Scholar] [CrossRef] [Scilit]
  32. Zhong, B.; Guo, J.; Zhang, L.; Wu, H.; Li, H.; Wang, Y. A blockchain-based framework for on-site construction environmental monitoring: Proof of concept. Build. Environ. 2022, 217, 109064. [Google Scholar] [CrossRef] [Scilit]
  33. Shu, Z.; Liu, W.; Fu, B.; Li, Z.; He, M. Blockchain-enhanced trading systems for construction industry to control carbon emissions. Clean Technol. Environ. Policy 2022, 24, 1851–1870. [Google Scholar] [CrossRef] [Scilit]
  34. Environmental Protection Department and Electrical; Mechanical Services Department. H.K.S.G. Guidelines to Account for and Report on Greenhouse Gas Emissions and Removals for Buildings (Commercial, Residential or Institutional Purposes) in Hong Kong; Environmental Protection Department: Hong Kong, China, 2010. [Google Scholar]
  35. State Council of the People’s Republic of China. Interim Regulations on the Management of Carbon Emissions Trading; State Council of the People’s Republic of China: Beijing, China, 2024. [Google Scholar]
  36. Sandaruwan, I.P.T.; Illankoon, C.; Yiu, T.W. Technology-Based Embodied Carbon Emissions Tracking and Monitoring Systems for Buildings: Review of Systems, Benefits, Limitations, Challenges and Future Directions. Buildings 2025, 15, 4421. [Google Scholar] [CrossRef] [Scilit]
  37. ISO 14064-1; Greenhouse Gases—Part 1: Specification with Guidance at the Organization Level for Quantification and Reporting of Greenhouse Gas Emissions and Removals. ISO: Geneva, Switzerland, 2018.
  38. ISO 14040; Environmental Management—Life Cycle Assessment—Principles and Framework. ISO: Geneva, Switzerland, 2006.
  39. ISO 16739; Industry Foundation Classes (IFC) for Data Sharing in the Construction and Facility Management Industries. ISO: Geneva, Switzerland, 2024.
  40. ISO 14067; Greenhouse Gases—Carbon Footprint of Products—Requirements and Guidelines for Quantification. ISO: Geneva, Switzerland, 2018.
  41. Zhang, Y.; Chen, S.; Shi, J.; Ping, T.; Pan, W. Multi-level spatiotemporal embodied carbon analysis of high-rise buildings adopting steel modular method compared with conventional concrete construction in Hong Kong. Build. Environ. 2026, 287, 113756. [Google Scholar] [CrossRef] [Scilit]
  42. Aghasizadeh, S.; Tabadkani, A.; Hajirasouli, A.; Banihashemi, S. Environmental and economic performance of prefabricated construction: A review. Environ. Impact Assess. Rev. 2022, 97, 106897. [Google Scholar] [CrossRef] [Scilit]
  43. Wang, Y.; Pan, W. Evaluating the carbon emissions of Hong Kong’s building sector from the life cycle perspective. Build. Environ. 2024, 265, 111975. [Google Scholar] [CrossRef] [Scilit]
  44. Wang, H.; Zhao, L.; Zhang, H.; Qian, Y.; Xiang, Y.; Luo, Z.; Wang, Z. Carbon emission analysis of precast concrete building Construction: A study on component transportation phase using Artificial Neural Network. Energy Build. 2023, 301, 113708. [Google Scholar] [CrossRef] [Scilit]
  45. Chen, S.; Teng, Y.; Zhang, Y.; Leung, C.K.Y.; Pan, W. Reducing embodied carbon in concrete materials: A state-of-the-art review. Resour. Conserv. Recycl. 2023, 188, 106653. [Google Scholar] [CrossRef] [Scilit]
  46. Hussein, M.; Karam, A.; Eltoukhy, A.E.E.; Darko, A.; Zayed, T. Optimized multimodal logistics planning of modular integrated construction using hybrid multi-agent and metamodeling. Autom. Constr. 2023, 145, 104637. [Google Scholar] [CrossRef] [Scilit]
Figure 1. Overview of the proposed framework.
Buildings 16 01587 g001
Figure 2. Overview of the case project.
Buildings 16 01587 g002
Figure 3. Homepage of carbon emissions monitoring system.
Buildings 16 01587 g003
Figure 4. BIM-based interactive visualization interface.
Buildings 16 01587 g004
Figure 5. EC emission statistical interface.
Buildings 16 01587 g005
Figure 6. Carbon emission of transportation vehicle. (Note: The base map labels are in Chinese, showing the transportation route from Foshan to Hong Kong in the Pearl River Delta region).
Buildings 16 01587 g006
Figure 7. Blockchain explorer interface.
Buildings 16 01587 g007
Figure 8. Comparison of carbon reduction across concrete compositions.
Buildings 16 01587 g008
Figure 9. Carbon reduction effects of different transportation modes.
Buildings 16 01587 g009
Figure 10. Carbon reduction effects of different levels of electric energy savings.
Buildings 16 01587 g010
Figure 11. Comparison of carbon reduction across steel waste reduction levels.
Buildings 16 01587 g011
Table 2. EC emissions from different phases during the cradle-to-end-of-construction.
PhaseEC Emissions (tCO2e)Share
Material production33,042.8269.30%
Modularization9359.4619.63%
Transportation4613.039.67%
Construction666.721.40%
Total47,682.03
Table 3. Material-related EC emissions in the cradle-to-end-of-construction phase of the case building.
MaterialCarbon Emission (tCO2e)
SubstructureSuperstructureTotal EC Emissions
PodiumTower
Cast In Situ AreaModular Area
Steel11,047.95714.926.956318.6818,088.50
Concrete4756.046229.163285.16842.3315,112.69
Brick/block 359.30318.76 678.06
Wood 18.6547.0759.81125.53
Glass 20.3420.2844.9785.59
Mortar 397.12473.88 871.00
Tile 1219.691173.39205.032598.11
Plastic 17.3719.15 36.52
Cement1866.1720.2611.13280.802178.36
Aluminum 698.8842.70435.911177.49
Paint 53.0542.63 95.68
PVC0.9810.64 411.72423.34
UPVC10.90 10.90
Textile 47.1821.97 69.15
Polythene 8.21 8.21
Vinyl 11.1831.96 43.14
Granite 0.02 0.02
Ceramic 0.971.84 2.81
Gypsum 5.741.80 7.53
Insulation 11.1017.14 28.24
Rock wool 140.46140.46
Coarse aggregate1.19 1.19
Calcium Silicate 422.634422.64
Total17,683.249843.765515.829162.3342,205.15
Table 4. Total EC emissions from different types of modules.
TypeModular MaterialsModule ProductionTransportationOn-Site InstallationTotal EC EmissionsEC Emissions per Floor Area (kg CO2e/m2)
A10,744.96230.04401.66164.3211,540.99544.99
B10,431.34224.73389.88156.3711,202.32555.90
C10,430.61220.51379.83150.0511,181.00578.23
D10,638.78228.89404.51162.6011,434.79545.69
E10,959.92237.47427.73175.4611,800.57521.89
F11,250.80246.20451.27188.5412,136.81499.52
G10,412.25224.73390.85156.3711,184.21555.00
Table 5. Carbon reduction effects of different concrete compositions.
Concrete CompositionCarbon Reduction RatioCarbon Reduction (t)
C1Normal concrete-0
C2≤25% fly ash 3.90%1856.14
C3>25% fly ash3.81%1813.62
C435–55% GGBS4.42%2100.71
C555–75% GGBS8.26%3929.16
Table 6. Carbon reduction effects of different vehicles and transport routes.
Proportion of Different Vehicles and Transport RoutesCarbon Reduction RatioCarbon Reduction (t)
B1All modules use diesel vehicles for transportation-0
B220% of the modules use new energy vehicles for land transportation, and 80% of the modules use diesel vehicles for land transportation.0.99%471.73
B350% of the modules use new energy vehicles for land transportation, and 50% of the modules use diesel vehicles for land transportation.2.48%1179.33
B4All modules use new energy vehicles for land transportation4.96%2358.65
B520% of the modules use diesel vehicles for sea–land combined transportation, and 80% use diesel for land transportation.1.39%661.01
B650% of the modules use diesel vehicles for sea–land combined transportation, and 50% of the modules use diesel vehicles for land transportation.3.47%1652.52
B7All modules use diesel vehicles for sea–land combined transportation6.95%3305.04
B820% of the modules use new energy vehicles sea–land combined transportation, and 80% of the modules use diesel vehicles land transportation.1.59%758.13
B950% of the modules use new energy vehicles for sea–land combined transportation, and 50% of the modules use diesel vehicles for land transportation.3.98%1895.32
B10All modules use new energy vehicles for sea–land combined transportation7.97%3790.65
Table 7. Carbon reduction effects of the electric energy saving measures.
Electric Energy Saving (%) Carbon Reduction RatioCarbon Reduction (t)
A10%-0
A21%0.00%1.97
A32%0.01%3.94
A43%0.01%5.91
A54%0.02%7.88
A65%0.02%9.85
A76%0.02%11.82
A87%0.03%13.79
A98%0.03%15.76
A109%0.04%17.73
A1110%0.04%19.70
Table 8. Carbon reduction effects of different steel waste reduction.
Reduce Steel Waste (%) Carbon Reduction RatioCarbon Reduction (t)
D10.00%-0
D21.00%0.38%180.88
D32.00%0.76%361.77
D43.00%1.14%542.65
D54.00%1.52%723.54
D65.00%1.90%904.42
D76.00%2.28%1085.31
D87.00%2.66%1266.19
D98.00%3.04%1447.08
D109.00%3.42%1627.96
D1110.00%3.80%1808.85
Table 9. Breakdown of time efficiency improvement in carbon assessment.
Assessment LevelTraditional Manual Method (min)Proposed Platform (min)Efficiency Improvement (%)
Material60600.00%
Component2900.599.8%
Assembly1100.599.5%
Flat2960.599.8%
Building600.599.2%
Total8166292.4%
Table 10. Sensitivity of Strategy C (C5 scenario) to substitutable concrete volume variation.
Replacement RateC2 (Fly Ash ≤ 25%)C3 (Fly Ash ≥ 25%)C4 (GGBS 35–55%)C5 (GGBS 55–75%)
25%464.04453.41525.18982.29
50%928.07906.811050.361964.58
75%1392.111360.221575.532946.87
100%1856.141813.622100.713929.16
SC (tCO2e/1%)18.5618.1421.0139.29
Table 11. Sensitivity analysis summary across four strategies.
StrategyControl Parameter (%)SC (tCO2e/1%)Max Reduction (tCO2e)Relative Reduction (%)Rank
A—Electricity savingElectricity saved1.9719.700.04%4
B—TransportModule adoption rate 37.913790.657.97%2
C—Concrete substitution (C5)Replacement rate39.293929.168.26%1
D—Steel waste reductionSteel waste reduced180.891808.853.80%3
Disclaimer/Publisher’s Note: The statements, opinions and data contained in all publications are solely those of the individual author(s) and contributor(s) and not of MDPI and/or the editor(s). MDPI and/or the editor(s) disclaim responsibility for any injury to people or property resulting from any ideas, methods, instructions or products referred to in the content.