Abstract
Inorganic soil stabilizer represents a promising option to tackle the issues that arise from the land-filling of engineering waste spoil (EWS) due to its economic and environmental benefits. This paper investigates the mechanical and microscopic properties of magnesium oxysulfate soil stabilizer (MOSS) pastes. In addition, the mechanical properties of a novel type of engineering waste spoil-based specimens (EWSS), fabricated using MOSS to solidify high-content EWS, were systematically investigated. The results show that a larger mean particle size and BJH adsorption average pore diameter of LBM were found to accelerate the heat flow rate of the hydration reaction. Specifically, the peak heat flow and total hydration heat attained 30.25 mW/g and 283.9 J/g, respectively, under the condition of an MgO-to-MgSO4 molar ratio of 9: 1 with LBM2 as the raw material. Furthermore, when the weight ratio of EWS rose from 5% to 80%, the compressive and flexural strengths of EWSS pastes at the 28-day curing age were reduced by 47.0% and 53.3% relative to the reference MOSS pastes.
1. Introduction
Like recycled aggregates [1,2], large volumes of engineering waste spoil (EWS) are generated during construction projects. In China, the total amount of EWS produced reached 1.62 billion tons in 2023 [3]. Currently, EWS is primarily managed through stockpiling and landfilling. For the resource-oriented utilization of EWS, the addition of stabilizers is generally necessary, with relevant research focusing predominantly on the development of soil stabilizers [4,5,6].
Soil stabilizers can enhance the engineering properties of inferior soils to meet the requirements for construction materials. Calcium-based materials, such as lime and ordinary Portland cement, are widely used as soil stabilizers. However, their stabilizing efficiency tends to decrease under sulfate attack, particularly when the sulfate content in the soil is high [4,5,6]. Moreover, the production of Portland Cement is responsible for about 8% of anthropogenic CO2 emissions because of the calcination of raw materials [7,8,9]. Compared with calcium-based stabilizers, the light burned magnesia (LBM), usually made from the calcination of magnesite (or dolomite at about 700 °C) or naturally synthesized in the sea or in waste desalination brine [10,11,12,13], exhibits the characteristic of reactivity, suggesting 50–60% less anthropogenic CO2 emissions than Portland Cement [14,15]. Consequently, research on magnesium-based stabilizers has gained increasing attention in recent years.
Existing studies on magnesium-based stabilizers have mainly focused on the composite application of reactive MgO and other calcium-based stabilizers [16,17,18], while research on magnesium oxysulfate as a dedicated soil stabilizer remains limited [19]. Notably, studies investigating the use of magnesium oxide and magnesium sulfate as stabilizers for EWS are even scarcer.
Magnesium oxysulfate soil stabilizer (MOSS) is a magnesia cementitious material, composed of LBM and magnesium sulfate, similar to magnesium oxysulfate cement (MOSC) [19,20]. Usually, the LBM in MOSC and magnesium oxychloride cement contains >60% reactive MgO [20,21,22,23,24,25]. Extensive experiments have been carried out to investigate the effects of various additives on the performance of MOSC, including ethylenediamine tetra-acetic acid and its disodium salt derivative [21], fly ash and ground granulated blast-furnace slag [22,23], coral aggregate [24], untreated desulfurization gypsum [25], rice husk silica [26], sodium silicate [27], sodium dihydrogen phosphate and potassium dihydrogen phosphate [28], nano-silica, silica fume and clinker [29,30], phosphoric acid and phosphates [31], as well as citric acid [32,33,34,35]. However, there is less research on how reactive MgO and the other unreactive composition in LBM affect the performances of MOSC [36,37,38]. Different kinds of reactive MgO are derived from the calcination of salt lake brine with magnesium-residue from the production of LiCO3. These are used instead of LBM to prepare low-cost MOSC [36]. Given LBM contains approximately 40% unreactive MgO along with impurities (e.g., Fe2O3, SiO2, and Al2O3), the effects of intrinsic unreactive MgO and impurity components on the hydration kinetics as well as macroscopic and microscopic properties of MOSC were systematically investigated [37].
Different kinds of LBM can be obtained using different reactive MgO contents (34.31–95.20%) and the specific surface areas LBM (1.87–142.28 m2/g) [36,37,38]. The high reactivity of reactive MgO is mainly due to its specific surface area [21,36,37,38]. Many studies of the pore structure have focused on MOSC [39,40,41]. The most important raw material of MOSS and MOSC is LBM powder, so the pore structure of LBM may change the properties of MOSS and MOSC [19,42,43,44].
In this research, to study the effects of reactive MgO and EWS on the properties of MOSS, three different reactive MgO and EWS were characterized by X-ray fluorescence spectrometry, the industry-preferred laser diffraction analysis and N2 adsorption/desorption tests. The setting time, compressive strength and flexural strength, and weight changes in the MOSS specimens were evaluated. The microstructure of MOSS was studied using different kinds of LBM. The chemical compositions of MOSS samples were evaluated using a TAM air thermostat and thermogravimetric and differential thermal analysis (TG-DTA). Moreover, engineering waste spoil-based specimens (EWSS) were prepared by solidifying EWS with MOSS, and the mechanical properties of the EWSS were investigated.
2. Experimental Procedures
2.1. Raw Materials and Proportions of the MOSS Paste and EWSS
Light burned magnesia (LBM), magnesium sulfate (MgSO4·7H2O, MS), and tap water were the raw materials used to prepare the magnesium oxysulfate soil stabilizer (MOSS). The other raw materials were EWS and sand in this study. Figure 1 shows the photographs of the powder raw materials. There were three kinds of LBM classified by the content of reactive MgO (LBM1, LBM2 and LBM3), which were obtained by calcining magnesite (Hebei, Xingtai City, China) at 780–850 °C. The chemical compositions of the three kinds of LBM and EWS are given in Table 1, which were determined by X-ray fluorescence (XRF) spectrometry (S4 EXPLORER, Bruker AXS GmbH, Karlsruhe, Germany). There are 3.56% K2O, 0.53% TiO2 and 0.48% Na2O in the other oxides of EWS sample. Those three kinds of LBM were industrial grade.
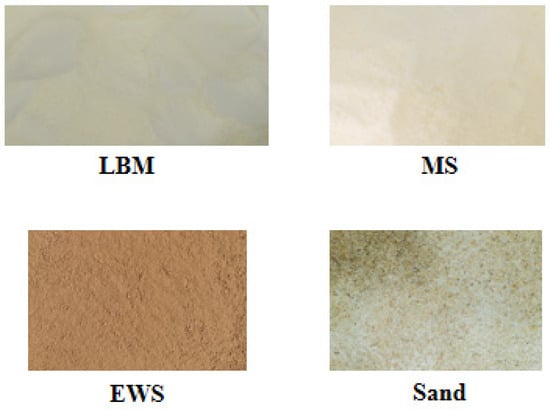
Figure 1.
Photographs of the powder raw materials.

Table 1.
Chemical compositions of LBM and EWS by XRF (wt%).
Referring to the standard WB/T 1019-2020 [45] and other articles [31,36,46,47,48], a standard hydration test was carried out to determine the kinds of LBM. A glass weighing bottle (ϕ25 mm × 40 mm, named W1) was weighed, then 2 g of each kind of LBM was soaked in the glass weighing bottle with 10 mL water for 24 h at 20 ± 2 °C and relative humidity of 70 ± 5%. The bottles were placed in an oven and cured at 100–110 °C for 24 h to facilitate hydration, followed by drying at 150 °C until a constant weight was achieved. Finally, they were weighed (W2) after cooling to room temperature. The weight ratio of reactive MgO was expressed as
For the standard hydration tests, three replicate samples were prepared for each type of LBM, and the weight ratio of reactive MgO (designated as W) was determined as the average of the three replicate measurements. The results of the weight ratio of reactive MgO for LBM1, LBM2, and LBM3 are 64.26%, 66.16%, and 74.66%, respectively.
The particle size distribution curves of LBM and EWS samples are presented in Figure 2; these measurements were performed using a laser diffraction analyzer (Micromeritics S3500, Norcross, GA, USA), which is widely used in the industry and has a measurement range of 0.02–2800 μm. The particle size ranges of LBM1, LBM2, LBM3, and EWS are 0.49–26.16 μm, 1.16–176.0 μm, 0.49–31.11 μm, and 0.98–127.0 μm, respectively. The mean particle size calculated by the volume of LBM1, LBM2, LBM3, and EWS were 5.86 μm, 18.16 μm, 4.09 μm, and 22.90 μm, respectively. The specific surface area and pore characteristics of various LBM and EWS samples were determined via N2 adsorption–desorption measurements using a Micromeritics ASAP 2460 analyzer (Micromeritics Instrument Corporation, Norcross, GA, USA), with the Brunauer–Emmett–Teller approach (BET) method applied for calculations. The results are shown in Table 2 and Figure 3. For LBM1 and LBM3, the smaller the Brunauer–Joyner–Halenda (BJH) adsorption average pore diameter, the larger the BET surface area. And the content of reactive MgO was fully consistent with the BET surface area—the larger the BET surface area, the higher the content of reactive MgO.
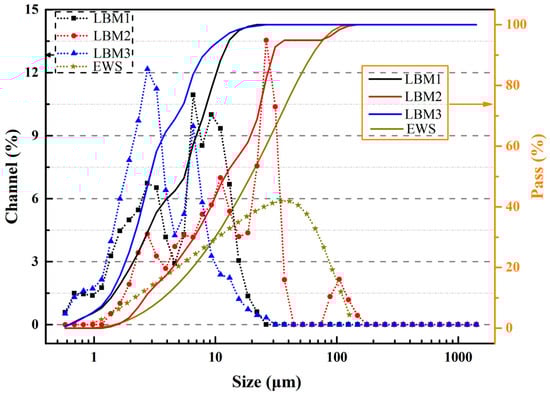
Figure 2.
Laser particle analysis size distribution curve of LBM and EWS.
Table 2.
Surface area and pore characteristics of various LBM and EWS samples.
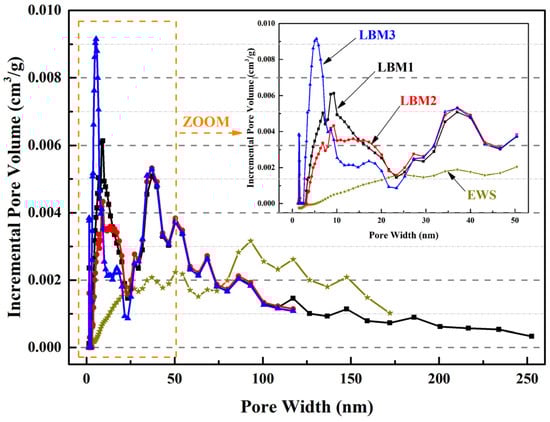
Figure 3.
BET results of pore width about incremental pore volume of LBM and EWS samples.
Different hysteresis curves occur due to different pore structures in particles according to the theory of adsorption and condensation [42,43,44]. During the calcination of magnesium compounds (magnesium carbonate, basic carbonate, and hydroxide), the loss of gases (water and CO2) from 300 °C to 500 °C leave high porous structures with a large internal surface area and reactivity between MgO cells (groups of cells) [12]. The physisorption isotherms of the three kinds of LBM samples were Type IV, according to the hysteresis loop characteristics [42]. Important information about the pore structure can be obtained from the shape of the hysteresis loop [43]. For the pore structure of LBM3, the shape of the hysteresis loop was Type H2 [42], the shape of the hysteresis loop indicates a mesoporous structure (pore widths from 2 nm to 50 nm; Figure 3) with narrow necks and wide bodies. The pore structure of LBM3 looked like an ink bottle (named an ink bottle pore, i.e., Pore-1 in Figure 4) [43,44]. The shapes of the hysteresis loops of LBM1 and LBM2 were Type H3 [42]. There were some plate-like particles with slit-shaped pores (named slit pores, i.e., Pore-2 in Figure 4) [43,44].
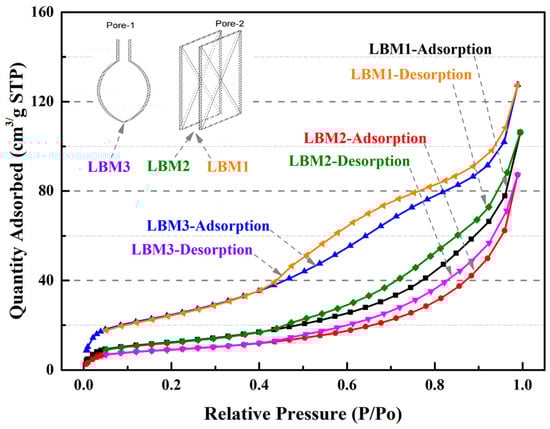
Figure 4.
N2 adsorption–desorption isotherms of LBM samples.
Proportions of the MOSS and EWSS Mixtures
For the setting time, heat hydration, and compressive strength tests of MOSS pastes, the mole ratio of MgO to MS was varied from 7 to 9 at intervals of 1, the water-to-MS mole ratio fixed at 20 and the weight ratio of EWS set at 5%; these mix proportions are summarized in Table 3. For compressive strength tests of MOSS mortar (using Chinese ISO standard sand), the MgO-to-MS and water-to-MS mole ratios were set to 8 and 20, respectively, while the weight ratios of the EWS and standard sand were 5% and 25%; the corresponding proportions are listed in Table 4. For EWSSs, the MgO-to-MS and water-to-MS mole ratios were fixed at 8 and 20, respectively, and the EWS weight ratio was adjusted to 70%, 75%, and 80%; detailed mix proportions are presented in Table 5. In the NO. of Table 3 and Table 5, “S” represents the engineering waste soil stabilized by MOSS. In the NO. of Table 4, “SS” represents the engineering waste soil and sand stabilized by MOSS. In the NO. of Table 3, Table 4 and Table 5, the first digit represents the MgO-to-MS molar ratio, the second digit denotes the weight ratio of engineering waste soil, and the third digit indicates the type of light burned magnesia (LBM). Figure 5 presents the composition and photographs of the specimens.
Table 3.
Material proportions of the MOSS paste mixtures.
Table 4.
Material proportions of the MOSS mortar mixtures.
Table 5.
Material proportions of the EWSS mixtures.
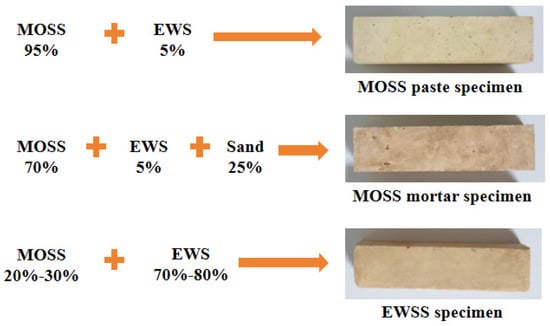
Figure 5.
Specimen photographs.
2.2. Testing Methods
2.2.1. Tests of the Setting Time
The initial setting time (IST) and final setting time (FST) of the samples were determined using a Vicat apparatus in accordance with the Chinese National standard GB 1346-2011 [49] and relevant references [20,36,46,49,50]. Measurements were taken at 1 min intervals throughout the test, which was conducted under controlled conditions of 20.2 °C and 60.5% relative humidity.
2.2.2. Compressive Strength and Flexural Strength Tests with Weight Change Ratio Test
The compressive strength and weight change ratio were determined using the same methodology as described in the Reference [20]. For each curing age, three cuboid specimens (40 mm × 40 mm × 160 mm) were prepared for both compressive and flexural strength tests using steel molds, followed by curing under laboratory conditions. The specimens were demolded after 1 day of curing and weighed (accuracy: 0.1 g) at curing ages of 1, 3, 7, 14, and 28 days. Flexural strength tests were conducted at a loading rate of 50 N/s, and subsequent compressive strength tests were performed at 2.4 kN/s for specimens cured for 3, 7, 14, and 28 days. The weight change ratio (βt) was defined as
where m1 is the weight of the cuboid blocks after curing for 1 d; mt is the weight of the cuboid blocks after curing for 3 d, 7 d, 14 d, or 28 d; two t in mt and βt were 3, 7, 14, or 28, respectively.
The reported flexural strengths and weight change ratios of the specimens were the averages of the results of three cuboid blocks, while the results of compressive strength were the average of the results of six blocks. All specimens were cured in the same laboratory under controlled conditions of 20 ± 2 °C and 60 ± 5% relative humidity.
2.2.3. Determination of the Heat of Hydration
The heats of hydration of the three kinds of LBM and different MOSS pastes were determined using a TAM air isothermal calorimeter equipped with 8 channels (New Castle, DE, USA). The glass mixing ampoules used had a volume of 20 mL, excluding the volume occupied by the stirrer motor. For each MOSS paste, the total mass was 8.25 g, and the total mass was 2.0 g for each LBM sample. The test process and details were the same as those in Reference [20].
2.2.4. Chemical Composition Characterization
We conducted micro-structure analyses of the raw materials of three kinds of LBM and the samples after compressive strength tests. Thermogravimetric and differential thermal analysis (TG-DTA) was also performed using a STA 409 PC analyzer (NETZSCH, Selb, Bavaria, Germany), with the temperature ramped from 30 °C to 1000 °C at a heating rate of 10 °C/min.
3. Results and Discussion
3.1. Setting Time of the MOSS Paste
Only reactive MgO in LBM can react with magnesium sulfate in aqueous solutions [31,50]. The reactive MgO may be influenced by lattice dilation and imperfections produced during low-temperature calcination [12]. Different contents of reactive MgO lead to different setting times and compressive strengths of MOSS pastes; therefore, setting time tests were carried out using three different reactive MgO contents in LBM. The results are shown in Figure 6.
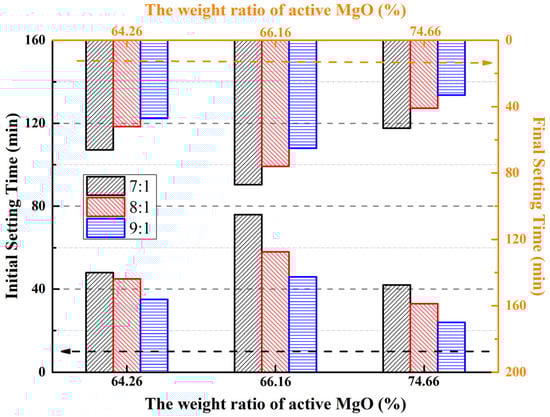
Figure 6.
Setting times of the MOSS samples with different kinds of LBM.
The setting time was longer for the MOSS pastes with LBM2 than with LBM1 and LBM3 (Figure 6). This is same as Reference [20]. For the MOSS paste, the maximum initial setting time (IST) of 76 min and maximum final setting time (FST) of 87 min were observed when the reactive MgO content was 66.16% (LBM2) and the MgO-to-MS molar ratio was 7:1 (Figure 6). In contrast, the minimum IST and FST were recorded at 24 min and 33 min, respectively, under the conditions of 74.66% reactive MgO (LBM3) and a MgO-to-MS molar ratio of 9:1 (Figure 6).
The results and trends of the setting time agreed with the results of other researchers. The higher the mole ratio of reactive MgO/MgSO4 and the higher the reactive MgO content, the shorter the setting time [20,25,27,31,36,37,38,46,47]. Selected setting times of MOSC pastes are listed in Table 6.
Table 6.
Factors affecting the setting time of MOSC pastes.
The larger the BET surface area of LBM and the smaller the average particle size, the shorter the setting time of the MOSC pastes (Table 6) [20,25,36,37]. This tendency is in agreement with the results shown in Figure 6 (the BET surface area of LBM2 was 31.65 m2/g and the BET surface area of LBM3 was 91.64 m2/g). In addition, some researchers produced different contents of reactive MgO and LBM with different BET surface areas by controlling the calcination temperature of the magnesium-rich byproducts of the production of LiCO3 from salt brine and basic magnesium carbonate (4MgCO3·Mg(OH)2·5H2O). These studies showed that the reactive MgO content increased and the BET surface area decreased upon increasing the calcination temperature, and the setting time of the MOSC became longer [37,45]. The reactive MgO content of LBM2 was 1.9% higher than that of LBM1, but the BET surface area of LBM2 was 28.7% smaller than that of LBM1, so the setting time of the MOSS pastes with LBM2 has a longer than that of MOSS pastes with LBM1 (Figure 6).
Furthermore, the early hydration rate and phase crystallization processes had a close relationship with the setting time [25,27,31,46,47]. Because reactions, non-reactive MgO, and impurities (such as Fe2O3, SiO2, Al2O3) in MOSS pates absorbed heat [12,20,37].
3.2. Mechanical Performance and Weight Changes in the MOSS Pastes and Mortar
To investigate the correlation between light burned magnesia (LBM) type and the mechanical properties of magnesium oxysulfate cement (MOSS), the flexural and compressive strengths of specimens were tested at curing ages of 3, 7, 14, and 28 days. Additionally, the weight change patterns of MOSS paste and mortar specimens prepared with the three LBM types were examined, with the corresponding results presented in Figure 7 and Figure 8.
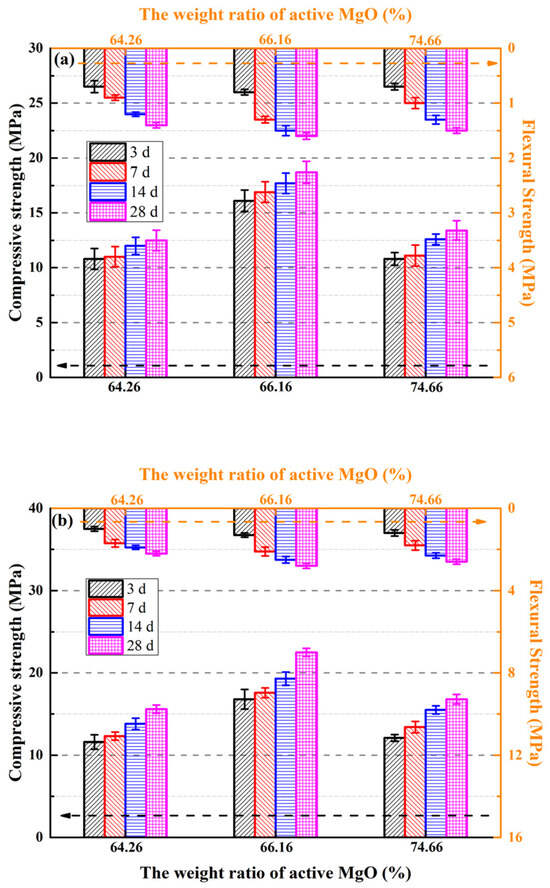
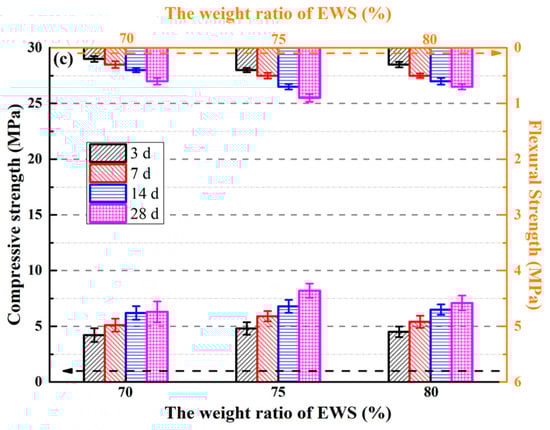
Figure 7.
Compressive and flexural strength of the MOSS with different kinds of LBM. (a) The paste of compressive and flexural strength; (b) The mortar compressive and flexural strength; (c) The compressive and flexural strength with different weight ratio of EWSS.
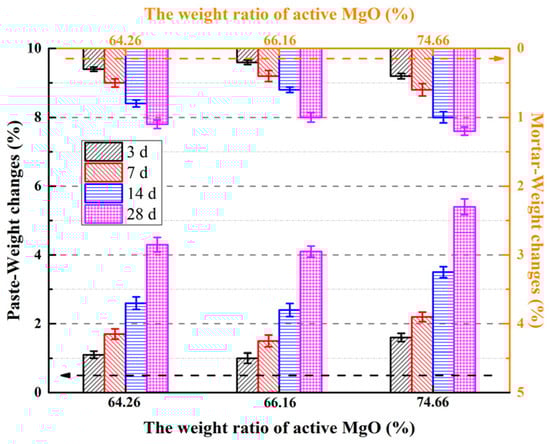
Figure 8.
Weight changes in the MOSS with different kinds of LBM.
For the MOSS pastes, the compressive and flexural strengths were highest when the MOSS paste was made using LBM2 (Figure 7a), which is almost identical to the results of Reference [20]. Moreover, the highest compressive and flexural strength was obtained using the MOSS mortar with LBM2 (Figure 7b). The compressive strength of the paste and mortar of the MOSS were all higher than 10.8 MPa and 11.6 MPa, respectively, in Figure 7. For MOSS mortar, the compressive and flexural strengths were all higher than that of the MOSS paste. The 28 d compressive and flexural strengths of the MOSS mortar were 20.3–25.4% and 57.1–73.3% higher than that of the MOSS paste when MOSS mortars were mixed with 5% EWS and 25% sand. Nevertheless, with the weight ratio of EWS increasing from 5% to 80%, the compressive and flexural strengths of EWSS pastes at the curing age of 28 days were reduced by 47.0% and 53.3% relative to the reference MOSS paste.
For using different raw materials for LBM and mole ratio of MgO/MgSO4/H2O, the mechanical properties were also different (Table 7). The mole ratio of MgO/MgSO4/H2O had relation to the mechanical properties of the MOSC [20,25,27,31,46]. This tendency was different from the compressive and flexural strengths of the MOSS paste and mortar (Figure 7)—when the content of reactive MgO in LBM increased from 64.26% to 74.66% and the BET surface area of LBM increased from 31.65 m2/g to 91.64 m2/g (Table 2). Nevertheless, the best mechanical properties of the MOSS paste were obtained by mixing LBM2. LBM2 had the largest average particle size and BJH average pore diameter. These results show that the larger the average particle size and BJH average pore diameter, the higher the compressive and flexural strength of the MOSS paste.
Table 7.
Mechanical properties and related characteristics of the MOSC at 28 d.
The main hydration products of the MOSC without additives are Mg(OH)2 and MgCO3 (Table 7) [20,27,31,46]. In our previous study [20], only Mg(OH)2, MgSO4·7H2O, and MgSO4·6H2O were produced by the reactions occurring in the MOSS paste. Since there was no 3Mg(OH)2·MgSO4·8H2O (318 phase), 5Mg(OH)2·MgSO4·7H2O (517 phase), or other phases, the mechanical performances of the MOSS paste and mortar were all worse than those in other studies [27,31,46]. In addition, some residual reactive MgO in the MOSS paste and mortar can react and produce Mg(OH)2, which increases the compactness and improves the strength; however, more Mg(OH)2 may produce microcracks in the MOSC, causing a decline in the compressive and flexural strength at early curing times (3 d, 7 d, or 14 d) [20,31,36]. After adding EWS in the MOSS and EWSS, there is no decline in the compressive and flexural strength at early curing times (3 d, 7 d, or 14 d). EWS can decrease the porosity of MOSS and enhance the compactness of the solidified soil [51]. For this reason, the mechanical properties of the MOSS paste and mortar became better upon increasing the curing time before 28 d.
For most of the MOSS paste or mortar samples, the weight loss ratio increased with the curing time (Figure 8). Free water in the pores of LBM and MOSC paste and mortar evaporated upon prolonging the curing time [20]. The weight changes in the MOSS paste and mortar with LBM3 were the largest during different curing times. The highest weight loss ratio of the MOSS paste and mortar was 5.4% and 1.2%, respectively, when MOSS was mixed with LBM3 and then cured for 28 d. This may be because LBM3 had ink bottle pores and could absorb much more free water from the fresh MOSS paste and mortar. Upon increasing the curing time, more free water could escape from these pores, causing the weight loss to increase. The BJH average pore diameters of LBM2 were larger than those of LBM1 and LBM3, which allowed LBM to more easily release free water from the fresh MOSS paste and mortar. Therefore, the weight change in the MOSS paste mixed with LBM2 was the smallest among the different kinds of MOSS paste and mortar.
3.3. Heat of Hydration of the MOSS Pastes
For the MOSC pastes, only reactive MgO in LBM can react with MS in solution [20,31,50]. Therefore, the type of LBM may affect the heat of hydration of MOSS. The heat flow and hydration heat of LBM and MOSS pastes with varying MgO-to-MS molar ratios were measured, with the corresponding results summarized in Figure 9, Figure 10 and Figure 11 and Table 8 and Table 9. Within the first 12 h of hydration after water addition, the heat flow values of the three LBM types and MOSS pastes with different MgO-to-MS molar ratios were all close to zero (Figure 9a and Figure 10(1)). Hence, the heat of hydration of LBM and MOSS with three kinds of LBM were tested for 12 h.
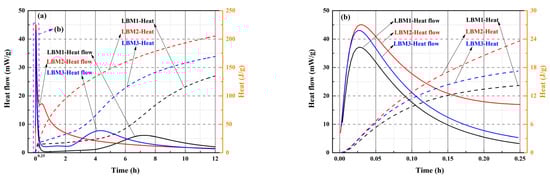
Figure 9.
Heat flow and heat of hydration of LBM. (a) three kinds of LBM at 0–12 h; (b) three kinds of LBM at 0–0.25 h.
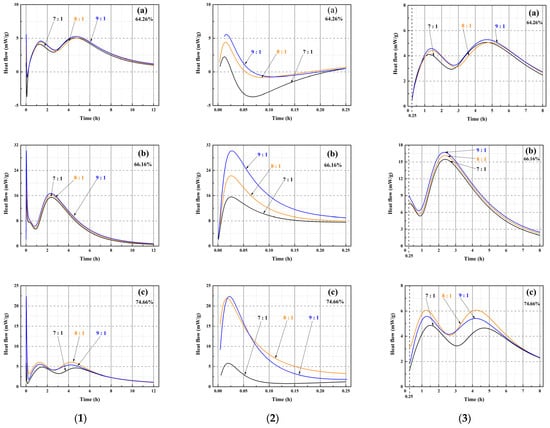
Figure 10.
Heat flow characteristics of MOSS pastes with varied MgO-to-MS molar ratios. (1) (a) Heat flow of the MOSS paste with LBM1 from 0 to 12 h, (b) Heat flow of the MOSS paste with LBM2 from 0 to 12 h, (c) Heat flow of the MOSS paste with LBM3 from 0 to 12 h; (2) (a) Heat flow of the MOSS paste with LBM1 from 0 to 0.25 h, (b) Heat flow of the MOSS paste with LBM2 from 0 to 0.25 h, (c) Heat flow of the MOSS paste with LBM3 from 0 to 0.25 h; (3) (a) Heat flow of the MOSS paste with LBM1 from 0.25 to 8 h, (b) Heat flow of the MOSS paste with LBM2 from 0.25 to 8 h, (c) Heat flow of the MOSS paste with LBM3 from 0.25 to 8 h.
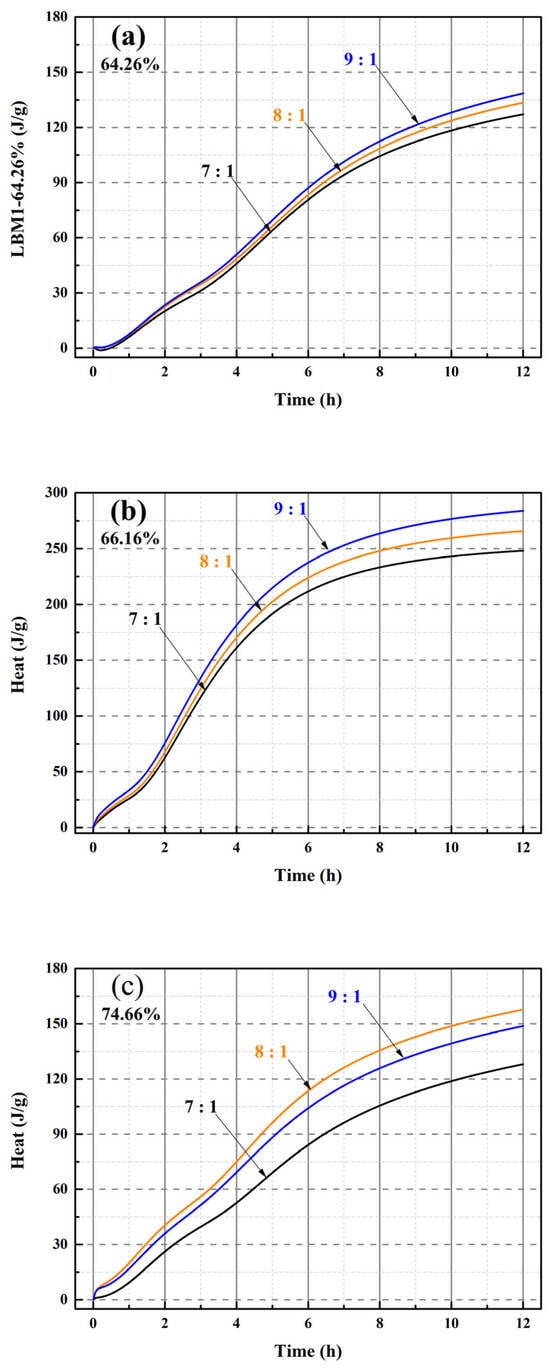
Figure 11.
Heat of hydration of the MOSS pastes with different MgO-to-MS mole ratios from 0 to 12 h. (a) heat of hydration of the MOSS paste with LBM1; (b) heat of hydration of the MOSS paste with LBM2; (c) heat of hydration of the MOSS paste with LBM3.
Table 8.
Maximum and minimum of heat flow peaks of the MOSS.
Table 9.
Maximum and minimum heats of hydration for 16 h.
The heat flow of LBM2 was fastest 3 h after adding water compared with the other two kinds of LBM, which is in accordance with Reference [20]. The heat flow of LBM1 was slowest after adding water for 3 h (Figure 9a). The BJH average pore diameter of LBM2 was larger than that of LBM1 and LBM3 (Table 2); thus, larger average pores easily absorbed free water and more easily reacted with H2O by releasing more heat than that of LBM1 and LBM3. This may be why the heat flow of LBM2 was fastest, and the heat flow of LBM1 was slowest 3 h after adding water (Figure 9a). From 3 h to 7 h, the heat flow of LBM2 was higher than that of LBM1 and LBM3. In addition, the first heat flow peak appeared in the first 5 min after adding water (Figure 9b), and the second heat flow peak appeared from 3 h to 8 h (Figure 9a). Five minutes after adding water into LBM, the pores on the surface of the LBM particles absorbed free water to produce Mg(OH)2, accompanied by the release of heat. Then, the first heat flow peak appeared (Figure 9b). As this reaction proceeded, the surface of the particles of reactive MgO in LBM reacted with free water and formed Mg(OH)2, and then a second heat flow peak appeared from 3 h to 8 h (Figure 9a).
The heat of LBM2 was very around 200 J/g and about 60 J/g and 30 J/g higher than those of LBM1 and LBM3, respectively (Figure 9a). In general, the higher the reactive MgO content and BET surface area of LBM, the higher the heat. However, some larger average pore diameters may have reacted with H2O more fully and released more heat. Consequently, the heat of LBM2 was higher than those of LBM1 and LBM3.
There are three heat flow peaks at 0–0.25 h (the first heat flow peak) and 0.25–8 h (the second and third heat flow peaks) after adding water in Figure 10(1). The maximum, median and minimum of these heat flow peaks and their times are shown in Table 8.
There are three hydration stages (dissolution, acceleration, and hardening) in the MOSC paste [20,31,39]. The dissolution and acceleration stages appeared at 0–0.25 h and 0.25–8 h, respectively, and the hardening stage occurred after 8 h [20]. Two reactions occurred during the dissolution stage (the reaction of reactive MgO with H2O and the decomposition of MgSO4·7H2O into MgSO4 and H2O). These represented the first heat flow peak [20,46]. The heat flow peaks were exothermic, when the MgO-to-MS mole ratio was more than 7:1 for the MOSS with LBM1, LBM2, and LBM3 in Figure 10(2). Moreover, the larger average pore diameter of LBM2 could absorb more water and produced more heat than the other kinds of LBM (Figure 9b). For this reason, the MOSS paste with LBM2 can reach higher heat flow than those of MOSS pastes with LBM1 and LBM3. In addition, the first heat flow peaks appeared within 5 min after water was added (the mixing time before the samples were poured into the TAM air thermostat), as shown in Table 8. Two reactions occurred during the acceleration stage. Some MgSO4 reacted with 6H2O or 7H2O to produce MgSO4·6H2O or MgSO4·7H2O. These two reactions produced the second and third heat flow peaks [20]. For MOSS pastes with an reactive MgO weight ratio of 64.26% (LBM1) and 74.66% (LBM3), the second and third heat flow peaks at the same MgO-to-MS molar ratio were highly similar, with the differences less than 0.95 mW/g (Figure 10(3) and Table 8). In contrast, for the paste prepared with LBM2 (reactive MgO weight ratio: 66.16%), the differences between the minimum and maximum values of the first and second heat flow peaks reached 0.1 mW/g (at a MgO-to-MS molar ratio of 7:1) and 13.5 mW/g (at a molar ratio of 9:1), respectively (Figure 10(3) and Table 8). During the hardening stage, certain reactions that typically occur in the dissolution and acceleration stages might proceed continuously, leading to the densification of the MOSS paste matrix [20].
The higher the MgO-to-MS mole ratio, the higher the heat of hydration of the MOSS pastes with LBM1 and LBM2 in Figure 11. The same trends of the heats of hydration were observed between LBM1 and LBM2 in Figure 9. The higher the heat of LBM, the higher the heat of MOSS with LBM. However, the heat of hydration of the MOSS paste with an 8:1 MgO-to-MS mole ratio was higher than that of the MOSS pates with a 9:1 ratio for LBM3 (Figure 11c). Because the weight of the sample used for the heat of hydration test was only 8.25 g (the weight of LBM was just 2.0 g), there may have been more reactive MgO in LBM3 when using an 8:1 ratio than 9:1. The minimum, median, and maximum heats of hydration at 12 h are shown in Table 9. When the MgO-to-MS mole ratio was 7:1, the lowest heat was 127.2 J/g for LBM1. The highest heat was 283.9 J/g when using LBM2 when the MgO-to-MS mole ratio was 9:1 (Table 9). LBM2, which featured the largest particle size and a relatively large average pore diameter, could more readily absorb free water and thus facilitate the hydration reactions within the MOSS paste. Thus, the hydration degree in the MOSS pastes have been the largest and the heat was the largest, when the MgO-to-MS mole ratio was 9:1.
For different reactive MgO contents in LBM, the heat flow and heats of hydration of the MOSC pastes were different than those reported in other studies [36,38,39,46]. When the content of the reactive MgO increased from 34.31% to 68.50%, there were two heat flow peaks within 72 h and the heat flow peaks appeared within 48 h [36]. When the content of MgO increased from 81.45% to 100%, two heat flow peaks appeared within 20 h [38]. There were also two heat flow peaks within 30 h when the content of reactive MgO was 60.10% [46]. However, there was only one heat flow peak within 30 min, and the maximum heat flow was about 0.035 W/g when the heat of hydration test time was 1440 min (24 h) [39]. In summary, there were many differences between the different kinds of reactive MgO.
For different MgO-to-MS mole ratios in the MOSS paste with the same kinds of LBM, the larger the MgO-to-MS mole ratio, the faster the heat flow, and the shorter the setting time. However, some non-reactive MgO and impurities (such as Fe2O3, SiO2, Al2O3) can produce different setting times that the heat flow and heat of hydration of the MOSC pastes with different contents of reactive MgO [12,20,37]. Some impurities strongly inhibited the dissolution of reactive MgO by hindering the hydration process in the MOSC paste [12,37]. Usually, the faster the heat flow, the shorter the setting time. Hence, the setting time increased due to faster heat flow when different forms of reactive MgO were used.
The heats of hydration for different kinds of the MOSS pastes with different kinds of LBM followed similar trends to that of the LBM. For different contents of reactive MgO and the BET surface area of LBM, the pore structure characteristics with pore shapes (Pore-1 and Pore-2) and average pore diameter influenced the heat flow of LBM. This was also confirmed from the heat of hydration of MOSS pastes (Figure 10 and Figure 11, Table 8 and Table 9). The large slit pores (Pore-2) in larger particles absorbed free water, and the more free water among the particles is, the faster the heat flow of LBM and MOSS paste is. Hence, the heat flow of MOSS pastes with LBM2 (Figure 10(3b)) was faster than that of the other two kinds of MOSS (Figure 10(3a,c)). Furthermore, the higher the content of reactive MgO in the LBM of the MOSS pastes, the faster the heat flow. Accordingly, the heat flow rate was the highest at a MgO-to-MS molar ratio of 9:1, whereas it was the lowest at a molar ratio of 7:1. Similar to the heat flow peak profiles of LBM, the MOSS paste also exhibited two distinct heat flow peaks following water addition. However, the third heat flow peak occurred due to the transformation of MgSO4·7H2O into MgSO4·6H2O (due to the heat of reaction during the production of Mg(OH)2) [20].
3.4. Chemical Compostion of the Hydrated MOSS Pastes
To elucidate the mechanisms underlying the compressive strength variations in MOSS with different reactive MgO contents in LBM, as well as the phase composition changes in MOSS pastes, thermogravimetric and differential thermal analysis (TG-DTA) was performed on selected samples, with the results presented in Figure 12 and Table 10. When the MgO-to-MS molar ratio exceeded 8:1 (Figure 12), the reaction of MS raw materials yielded trace amounts of MgSO4·6H2O and MgSO4·7H2O [20]. Some Mg(OH)2 may have come from LBM, and the others originated the reaction of reactive MgO with H2O. In addition, SiO2 were mainly produced by impurities in LBM, MS, and EWS (Table 1). However, the carbonization of Mg(OH)2 can produce some MgCO3 [31,36,46,47,50]. Calcium sulfate dihydrate (CaSO4·2H2O) can be generated from the MS raw materials as well as the hydration reactions of impurities present in both LBM and MS [12,37,47]. Furthermore, the 3Mg(OH)2·MgSO4·8H2O phase (designated as the318 phase) and other crystalline phases were barely detectable in any of the MOSC pastes [20,39]. Similarly, none of the MOSS paste samples in this study contained 318 phase or other phases (Figure 12). According to the TG-DTA results in Figure 12, the decomposition products are listed in Table 10.
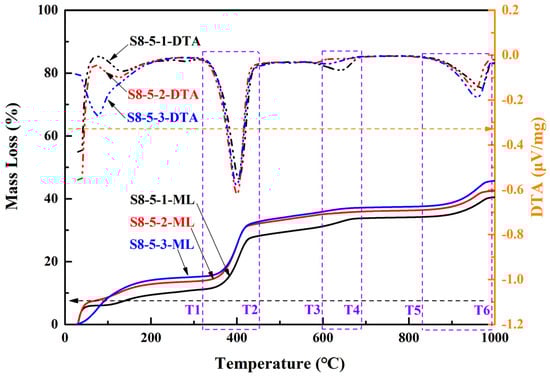
Figure 12.
Thermogravimetric and differential thermal analysis (TG-DTA) curves of MOSS pastes.
Table 10.
Mass loss of MOSS pates with different MgO-to-MS mole ratios (%).
When the temperature was below 98 °C, one H2O from the MOSS paste was lost via the reaction shown in Equation (3) [37]. Some MgSO4·7H2O began to lose H2O at about 200 °C according to Equation (4) [20,22]. According to Reference [25], some CaSO4·2H2O lost 1.5H2O in the range of 110–180 °C and then lost another 0.5H2O from 150 to 200 °C, corresponding to Equation (5). With the temperature increased from 200 °C to 380 °C, some MgSO4·6H2O began to lose H2O via Equation (6) [20]. When the temperature was 300–480 °C, some Mg(OH)2 was transformed into MgO and H2O via Equation (7) [13,20,21,23,25,28,52,53]. Some MgCO3 decomposed into MgO and CO2, at about 450–850 °C via Equation (8) [8,13,14,21,22,23,25,27,39,53,54]. The decomposition temperature of dolomite (CaMg(CO3)2) was about 1000 °C, corresponding to Equation (9) [11]. The decomposition temperature of CaCO3 is 600–700 °C according to References [22,52], but it is about 900 °C in this study, corresponding to Equation (10) [55,56]. In the range of 900–1000 °C, some MgSO4 decomposed into MgO and SO3, and some CaSO4 (produced from the decomposition reaction of CaSO4·2H2O according to Equation (5)) decomposed into CaO and SO3 via Equations (11) and (12) [25,28,37,52]. Some reactions occurred in the MOSS upon increasing the temperature according to Figure 12.
There was 34–39% MS in the raw materials (MS and LBM) of the MOSS, some of which transformed into MgSO4·6H2O and H2O at around 60 °C (Equation (3)). The MS content decreased by about 2.66–11.81%, when the temperature increased from 25 °C to 100 °C in Figure 12 and Table 10. In addition, some free water was also lost at around 100 °C in Figure 12 and Table 10. When the temperature increased to around 200 °C, some MS turned into MgSO4 and H2O (Equation (4)), and some CaSO4·2H2O in the MS transformed into CaSO4·0.5H2O at around 150 °C and then into CaSO4 at around 170 °C (Equation (5)). MgSO4·6H2O transformed into MgSO4 and H2O at around 400 °C (Equation (6)). At about 440 °C (i.e., the range between temperature T1 and T2 in Figure 12), Mg(OH)2 transformed into MgO and H2O (Equation (7)) with a larger peak in Figure 12. Some Mg(OH)2 have transformed into MgCO3 during curing. Therefore, some MgCO3 was transformed into MgO and H2O at around 650 °C (i.e., the range between temperature T3 and T4 in Figure 12) (Equation (8)) with a small peak in Figure 12. Some CaMg(CO3)2 transformed into CaCO3, MgO, and CO2 at 800–900 °C (i.e., the range between temperature T5 and T6 in Figure 12) (Equation (9)), thus the weight loss increases in Figure 12. Furthermore, some amorphous in the MOSS pastes have been lost in the range of 200–800 °C. When the temperature increased to 900 °C, some CaCO3 (from the decomposition of CaMg(CO3)2) transformed into CaO and CO2 (Equation (10)) with a small peak in Figure 12. Finally, MgSO4 transformed into MgO. And SO3 and CaSO4 transformed into CaO and SO3 (Equations (11) and (12)).
The larger BJH average pore diameter of LBM indicates the presence of more MgSO4·7H2O and MgSO4·6H2O in the pores of LBM in MOSS pastes. The BJH average pore diameters of LBM2 was much larger than those of LBM1 and LBM3 in Table 2. For the same reason, the DTA peaks were different between these three kinds of MOSS pastes at around 200 °C (Figure 12). In addition, the structure of LBM contained slit-like pores, and the particle size range was much larger than that of the other kinds of LBM. Some reactions occurred among these slit-like pores and then the compressive and flexural strengths of the MOSS specimens increased. Therefore, the compressive and flexural strengths of MOSS and EWSSs with LBM2 were higher than those of the other two MOSS specimens in Figure 7. Since only LBM2 contained slit-like pores with a larger average pore diameter, the flexural strength of the MOSS mortar with LBM2 was the highest in Figure 7b. In addition, because the pore structure of LBM3 included some ink bottle pores with the largest BET surface area, there was more free water in the ink bottle pores, and more water was lost during curing. So, there were larger weight changes in the MOSS paste and mortar with LBM3 in Figure 8.
4. Conclusions
Magnesium oxysulfate soil stabilizer (MOSS) paste, MOSS mortar and engineering waste spoil-based specimen (EWSS) paste were prepared using three types of light burned magnesia (LBM), magnesium sulfate (MS, MgSO4·7H2O), sand, engineering waste spoil (EWS), and water. The workability (including initial setting times (IST), final setting times (FST), and heat of hydration), mechanical properties, and chemical compostion of MOSS pastes were determined. Additionally, the compressive strength, flexural strength, and weight changes in the MOSS mortar were tested.
- (1)
- For MOSS pastes, the longest IST and FST were 76 min and 87 min, respectively, when mixed with LBM2 (reactive MgO content: 66.16%) at an MgO-to-MS mole ratio of 7:1. In contrast, the shortest IST(24 min) and FST (33 min)were achieved with LBM3 (reactive MgO content: 74.66%) at a mole ratio of 9:1. LBM with larger the mean particle size and the BJH adsorption average pore diameter accelerated heat flow. The maximum heat flow (30.25 mW/g) and total hydration heat (283.9 J/g) were obtained with LBM2 at an MgO-to-MS molar ratio of 9:1.
- (2)
- MOSS mortars incorporated with 5% EWS and 25% sand exhibited 20.3–25.4% higher 28 d compressive strength and 57.1–73.3% higher 28 d flexural strength than MOSS pastes. Furthermore, when the EWS weight ratio increased from 5% to 80%, the 28 d compressive and flexural strengths of EWSS pastes only decreased by 47.0% and 53.3% compared MOSS pastes.
- (3)
- The chemical components of MOSS pastes (with three LBM types) included MgSO4·6H2O, Mg(OH)2, MgO, MgSO4·7H2O, MgCO3, CaMg(CO3)2, CaSO4·2H2O, CaCO3, and SiO2 as characterized by TG-DTA. The BJH adsorption average pore diameter and pore structures of LBM were the key factors influencing the mechanical properties and microstructure of MOSS pastes. The slit-like pores with larger average pore diameter in LBM2 contributed to the enhanced compressive and flexural strength of MOSS specimens.
Author Contributions
Conceptualization, S.-C.K.; Methodology, W.T.; Software, F.-M.L.; Validation, F.-M.L.; Formal analysis, P.C.; Investigation, P.C.; Resources, M.-X.T.; Data curation, P.C.; Writing—original draft, P.C.; Writing—review and editing, S.-C.K.; Visualization, C.-R.W. and M.-X.T.; Supervision, W.T.; Project administration, C.-R.W.; Funding acquisition, S.-C.K. All authors have read and agreed to the published version of the manuscript.
Funding
This research was funded by the National Natural Science Foundation of China, grant number 52341801, the Sustainable Development Special Project of Shenzhen Science and Technology Innovation Committee, grant number KCXST20221021111205012 and Science and Technology Project of Guangzhou Construction Group Co., Ltd., grant number [2024]-KJ0001.
Data Availability Statement
The original contributions presented in this study are included in the article. Further inquiries can be directed to the corresponding author.
Conflicts of Interest
Author Meng-Xiong Tang was employed by the company Guangzhou Municipal Construction Group Co., Ltd. The remaining authors declare that the research was conducted in the absence of any commercial or financial relationships that could be construed as a potential conflict of interest. The authors declare that they have no known competing financial interests or personal relationships that could have appeared to influence the work reported in this paper. Meng-Xiong Tang is employee of Guangzhou Municipal Construction Group Co., Ltd., who provided funding and technical support for the work. The funder had no role in the design of the study; in the collection, analysis, or interpretation of data, in the writing of the manuscript, or in the decision to publish the results.
References
- Ma, Z.M.; Wu, Y.H.; Fang, K.; Zhang, Y.C.; Wang, C.Q. Developing fully recycled alkali-activated mortar made with waste concrete fines as a substitute for both binder and sand: Multi-properties evaluation. Construct. Build. Mater. 2025, 477, 141323. [Google Scholar] [CrossRef]
- Wang, C.Q.; Lu, Y.L.; Dai, Y.Y.; Wu, H.X.; Ma, Z.M. In-situ 4D CT analysis of microcrack evolution in carbonated fiber-reinforced recycled aggregate concrete. Cem. Concr. Compos. 2025, 163, 106161. [Google Scholar] [CrossRef]
- Solid Waste and Chemicals Management Technology Center, Ministry of Ecology and Environment of the People’s Republic of China. Research Report on the Release of National Solid Waste Pollution Prevention and Control Information (2024) [R/OL]; Solid Waste and Chemicals Management Technology Center, Ministry of Ecology and Environment of the People’s Republic of China: Beijing, China, 2024; pp. 24–28. (In Chinese)
- Rahmat, N.M.; Kinuthia, M.J. Compaction of fills involving stabilization of expansive soils. Proc. Inst. Civ. Eng. Geotech. Eng. 2011, 164, 113–126. [Google Scholar] [CrossRef]
- Wang, D.; Wang, H.; Wang, X. Compressibility and strength behavior of marine soils solidified with MgO—A green and low carbon binder. Mar. Georesour. Geotec. 2017, 35, 878–886. [Google Scholar] [CrossRef]
- Chegenizadeh, A.; Keramatikerman, M.; Panizza, S.; Nikraz, H. Effect of Powdered Recycled Tire on Sulfate Resistance of Cemented Clay. J. Mater. Civ. Eng. 2017, 29, 04017160. [Google Scholar] [CrossRef]
- Chen, T.; Gao, X. Use of Carbonation Curing to Improve Mechanical Strength and Durability of Pervious Concrete. ACS Sustain. Chem. Eng. 2020, 8, 3872–3884. [Google Scholar] [CrossRef]
- Ruan, S.; Unluer, C. Comparative life cycle assessment of reactive MgO and Portland cement production. J. Clean. Prod. 2017, 137, 258–273. [Google Scholar] [CrossRef]
- Abbaspour, A.; Tanyu, B.F. CO2 Sequestration by Carbonation Processes of Rubblized Concrete at Standard Conditions and the Related Mineral Stability Diagrams. ACS Sustain. Chem. Eng. 2020, 8, 6647–6656. [Google Scholar] [CrossRef]
- Ohadian, A.; Khayat, N.; Mokhberi, M. Microstructural analysis of marl stabilized with municipal solid waste and nano-MgO. J. Rock Mech. Geotech. Eng. 2024, 16, 3258–3269. [Google Scholar] [CrossRef]
- Cao, B.; Xu, J.; Wang, F.; Al-Tabbaa, A. Self-healing soil mix cut-off wall materials incorporating reactive magnesium oxide pellets. Geotechnique 2024, 74, 1317–1328. [Google Scholar] [CrossRef]
- Qi, X.L.; Wu, C.Y. Properties of solidified loess with basic magnesium sulfate cement. Ceram.-Silik. 2025, 69, 240–253. [Google Scholar] [CrossRef]
- Chen, L.; Jiang, L.H.; Chu, H.Q.; Xu, P.; Jin, W.Z.; Chen, C.; Zhi, F.F.; Ben, X.Q. Effect of retarder on hydration properties of light-burned magnesia. Construct. Build. Mater. 2020, 263, 119762. [Google Scholar] [CrossRef]
- Zhou, X.M.; Li, Z.J. Light-weight wood-magnesium oxychloride cement composite building products made by extrusion. Constr. Build. Mater. 2012, 27, 382–389. [Google Scholar] [CrossRef]
- Dang, L.; Nai, X.Y.; Dong, Y.P.; Li, W. Functional group effect on flame retardancy, thermal, and mechanical properties of organophosphorus-based magnesium oxysulfate whiskers as a flame retardant in polypropylene. RSC Adv. 2017, 7, 21655–21665. [Google Scholar] [CrossRef]
- Li, W.; Yang, K.; Cheng, Y.; Huang, K.; Hu, Y.; Liu, L.; Li, X. Dynamic Mechanical Performance of Sulfate-Bearing Soils Stabilized byMagnesia-Ground Granulated Blast Furnace Slag. Sustainability 2024, 16, 4313. [Google Scholar] [CrossRef]
- Fei, J.; Al-Tabbaa, A. Evaluation of novel reactive MgO activated slag binder for the immobilisation of lead and zinc. Chemosphere 2014, 117, 285–294. [Google Scholar] [CrossRef]
- Eubank, W.R. Calcination Studies of Magnesium Oxides. J. Am. Ceram. Soc. 1951, 34, 225–229. [Google Scholar] [CrossRef]
- Dung, N.T.; Unluer, C. Carbonated MgO concrete with improved performance: The influence of temperature and hydration agent on hydration, carbonation and strength gain. Cem. Concr. Compos. 2017, 82, 152–164. [Google Scholar] [CrossRef]
- Cui, P.; Wu, C.R.; Chen, J.; Luo, F.M.; Kou, S.C. Preparation of magnesium oxysulfate cement as a 3D printing material. Construct. Build. Mater. 2021, 282, 122677. [Google Scholar] [CrossRef]
- Gu, K.; Maierdan, Y.F.; Chen, B. Effects of ethylenediamine tetra-acetic acid (EDTA) and its disodium salt derivative (EDTA-Na) on the characteristics of magnesium oxysulfate (MOS) cement. Compos. Part B-Eng. 2022, 232, 109654. [Google Scholar] [CrossRef]
- Li, Q.Y.; Su, A.S.; Gao, X.J. Preparation of durable magnesium oxysulfate cement with the incorporation of mineral admixtures and sequestration of carbon dioxide. Sci. Total. Environ. 2022, 809, 152127. [Google Scholar] [CrossRef]
- Hu, Z.; Guan, Y.; Chang, J.; Bi, W.L.; Zhang, T.T. Effect of Carbonation on the Water Resistance of Steel Slag—Magnesium Oxysulfate (MOS) Cement Blends. Materials 2020, 13, 5006. [Google Scholar] [CrossRef] [PubMed]
- Chu, Y.J.; Wang, A.G.; Zhu, Y.C.; Wang, H.; Liu, K.W.; Ma, R.; Guo, L.P.; Sun, D.S. Enhancing the performance of basic magnesium sulfate cement-based coral aggregate concrete through gradient composite design technology. Compos. Part B-Eng. 2021, 227, 109382. [Google Scholar] [CrossRef]
- Gu, K.; Chen, B.; Yu, H.F.; Zhang, N.; Bi, W.L.; Guan, Y. Characterization of magnesium-calcium oxysulfate cement prepared by replacing MgSO4 in magnesium oxysulfate cement with untreated desulfurization gypsum. Cem. Concr. Compos. 2021, 121, 104091. [Google Scholar] [CrossRef]
- Gomes, C.M.; Cheung, N.; Gomes, G.M.; Sousa, A.K.; Antonio, A.P. Improvement of water resistance in magnesia cements with renewable source silica. Constr. Build. Mater. 2021, 272, 121650. [Google Scholar] [CrossRef]
- Ma, M.F.; Gao, Q.; Ma, Y.L.; Zhu, J.Z.; Du, Y.G. Improved hydration and properties of magnesium oxysulfate (MOS) cement using sodium silicate as an additive. Constr. Build. Mater. 2021, 267, 120988. [Google Scholar] [CrossRef]
- Wang, N.; Yu, H.F.; Bi, W.L.; Guan, Y.; Gong, W.; Zhang, N.; Wu, C.Y. The Improvement Effects of NaH2PO4 and KH2PO4 on the Properties of Magnesium Oxysulfate Cement. J. WuHan Univ. Technol. 2021, 36, 50–57. [Google Scholar] [CrossRef]
- Zhu, J.F.; Xu, R.Q.; Zhao, H.Y.; Luo, Z.Y.; Pan, B.J.; Rao, C.Y. Fundamental mechanical behavior of CMMOSC-S-C composite stabilized marine soft clay. Appl. Clay. Sci. 2020, 192, 105635. [Google Scholar] [CrossRef]
- Zhou, J.Q.; Wu, C.Y. Effects of nano-silica and silica fume on properties of magnesium oxysulfate cement. J. Ceram. Soc. Jpn. 2020, 128, 164–173. [Google Scholar] [CrossRef]
- Wu, C.Y.; Yu, H.F.; Zhang, H.F.; Dong, J.M.; Wen, J.; Tan, Y.S. Effects of phosphoric acid and phosphates on magnesium oxysulfate cement. Mater. Struct. 2015, 48, 907–917. [Google Scholar] [CrossRef]
- Zheng, Z.; Zhan, B.G. Research on modification effects of citric acid on magnesium oxysulfate cement. J. Hefei Univ. Technol. (Nat. Sci.) 2013, 36, 461–464. (In Chinese) [Google Scholar]
- Runevski, T.; Wu, C.Y.; Yu, H.F.; Bo, Y.; Dinnebier, R.E.; Jennings, H. Structural Characterization of a New Magnesium Oxysulfate Hydrate Cement Phase and Its Surface Reactions with Atmospheric Carbon Dioxide. J. Am. Ceram. Soc. 2013, 96, 3609–3616. [Google Scholar] [CrossRef]
- Wu, C.Y.; Yu, H.F.; Dong, J.M.; Li, Y.; Wen, J.; Zheng, L.N.; Tan, Y.S. Modified Magnesium Oxysulfate Cement. Chinese Patent No. 201210511700.8, 6 August 2014. (In Chinese) [Google Scholar]
- Wang, Z.J. Magnesium Oxysulfate Materials with Citric Acid and Its Application. Chinese Patent No. 200510048574.7, 16 January 2008. (In Chinese) [Google Scholar]
- Wu, C.Y.; Chen, C.; Zhang, H.F.; Tan, Y.S.; Yu, H.F. Preparation of magnesium oxysulfate cement using magnesium-rich byproducts from the production of lithium carbonate from salt lakes. Construct. Build. Mater. 2018, 172, 597–607. [Google Scholar] [CrossRef]
- Li, X.; Qiu, R.F.; Xue, F.B.; Fang, L.; Cheng, F.Q. Effects of unreactive MgO and impurities in light burned MgO on the hydration process and performance of base magnesium sulfate cement. Construct. Build. Mater. 2020, 240, 117854. [Google Scholar] [CrossRef]
- Miao, M.; Wu, C.Y.; Tan, Y.S.; Yu, H.F. Mechanistic Study of the Effects of Magnesia Reactivity on Setting and Hardening of Basic Magnesium Sulfate Cement. J. Adv. Concr. Technol. 2020, 18, 678–688. [Google Scholar] [CrossRef]
- Tang, S.W.; Yuan, J.H.; Cai, R.G.; Wei, C.G.; Chen, J.T.; Chen, E. In situ monitoring of hydration of magnesium oxysulfate cement paste: Effect of MgO/MgSO4 ratio. Construct. Build. Mater. 2020, 251, 119003. [Google Scholar] [CrossRef]
- Park, S.; Ma, J.; Yun, T.S.; Jeon, S.; Byeun, Y.; Kang, D.S.; Jang, J. Pore-scale swelling mechanism of magnesium oxide granules during hydration. Construct. Build. Mater. 2020, 251, 119101. [Google Scholar] [CrossRef]
- Huang, J.S.; Li, W.W.; Huang, D.S.; Wang, L.; Chen, E.; Wu, C.Y.; Wang, B.S.; Deng, H.Y.; Tang, S.W.; Shi, Y.; et al. Fractal Analysis on Pore Structure and Hydration of Magnesium Oxysulfate Cements by First Principle, Thermodynamic and Microstructure-Based Methods. Fractal. Fract. 2021, 5, 164. [Google Scholar] [CrossRef]
- Sing, K.S.W. Reporting physisorption data for gas/solid systems with special reference to the determination of surface area and porosity. Pure Appl. Chem. 1982, 54, 2201–2218. [Google Scholar] [CrossRef]
- Li, Y.; Wang, Z.S.; Pan, Z.J.; Niu, X.L.; Yu, Y.; Meng, S.Z. Pore structure and its fractal dimensions of transitional shale: A crosssection from east margin of the Ordos Basin, China. Fuel 2019, 241, 417–431. [Google Scholar] [CrossRef]
- Li, T.J.; Huang, Z.L.; Zhao, J.; Xu, X.F.; Guo, X.B. Pore structure characteristics and their influencing factors: A case study from the middle jurassic mixed siliciclastic carbonate rocks, Turpan-Hami basin, Northwest China. J. Petrol. Sci. Eng. 2021, 203, 108611. [Google Scholar] [CrossRef]
- WB/T 1019-2020; Determination of Chemical Activity of Light Calcined Magnesia. Metallurgical Industry Press: Beijing, China, 2020. (In Chinese)
- Wu, C.Y.; Chen, W.H.; Zhang, H.F.; Yu, H.F.; Zhang, W.Y.; Jiang, N.S.; Liu, L.X. The hydration mechanism and performance of Modified magnesium oxysulfate cement by tartaric acid. Construct. Build. Mater. 2017, 144, 516–524. [Google Scholar] [CrossRef]
- Gu, K.; Chen, B. Research on the incorporation of untreated flue gas desulfurization gypsum into magnesium oxysulfate cement. J. Clean. Prod. 2020, 271, 122497. [Google Scholar] [CrossRef]
- Dong, J.M.; Yu, H.F.; Zhang, L.M. Study on experimental conditions of hydration methods of determining active magnesium oxide content. J. Salt. Lake. Res. 2010, 18, 38–41. (In Chinese) [Google Scholar]
- GB/T 1346-2024; Test Methods for Water Requirement of Standard Consistency, Setting Time, and Soundness of the Portland Cement. National Standards of the People’s Republic of China: Beijing, China, 2024. (In Chinese)
- Wu, C.Y.; Zhang, H.F.; Yu, H.F. Preparation and properties of modified magnesium oxysulfate cement derived from waste sulfuric acid. Adv. Cem. Res. 2016, 28, 178–188. [Google Scholar] [CrossRef]
- Chen, J.; Wu, C.R.; Kou, S.C. Study on Performance of Modified Magnesium-based Solidifying Agent for Engineering Waste Soil. J. Wuhan Univ. Technol. 2024, 46, 9–15. (In Chinese) [Google Scholar]
- Zhang, N.; Yu, H.F.; Gong, W.; Liu, T.; Wang, N.; Tan, Y.S.; Wu, C.Y. Effects of low- and high-calcium fly ash on the water resistance of magnesium oxysulfate cement. Construct. Build. Mater. 2020, 230, 116951. [Google Scholar] [CrossRef]
- Hay, R.; Dung, N.T.; Lesimple, A.; Unluer, C.; Celik, K. Mechanical and microstructural changes in reactive magnesium oxide cement-based concrete mixes subjected to high temperatures. Cem. Concr. Compos. 2021, 118, 103955. [Google Scholar] [CrossRef]
- Li, Q.Y.; Zhang, L.C.; Gao, X.J.; Zhang, J.Y. Effect of pulverized fuel ash, ground granulated blast-furnace slag and CO2 curing on performance of magnesium oxysulfate cement. Construct. Build. Mater. 2020, 230, 116990. [Google Scholar] [CrossRef]
- Scaltsoyiannes, A.; Lemonidou, A. CaCO3 decomposition for calcium-looping applications Kinetic modeling in a fixed-bed reactor. Chem. Eng. Sci. 2020, 8, 100071. [Google Scholar] [CrossRef]
- García-Labiano, F.; Abad, A.; Diego, L.F.D.; Gayán, P.; Adánez, J. Calcination of calcium-based sorbents at pressure in a broad range of CO2 concentrations. Chem. Eng. Sci. 2002, 57, 2381–2393. [Google Scholar] [CrossRef]


Disclaimer/Publisher’s Note: The statements, opinions and data contained in all publications are solely those of the individual author(s) and contributor(s) and not of MDPI and/or the editor(s). MDPI and/or the editor(s) disclaim responsibility for any injury to people or property resulting from any ideas, methods, instructions or products referred to in the content. |
© 2026 by the authors. Licensee MDPI, Basel, Switzerland. This article is an open access article distributed under the terms and conditions of the Creative Commons Attribution (CC BY) license.