Abstract
The stability of high and steep rock slopes in open-pit mines, particularly under ecological restoration, remains a significant concern. However, the quantitative assessment of the influence of vegetation restoration on slope stability is still underexplored. This study assessed the stability of a high and steep limestone slope in the Kazimiao mining area, Ningxia, before and after ecological restoration, utilizing Rocscience Slide software and 3D laser scanning point cloud data. The limit equilibrium method was applied to simulate slope stability under multiple conditions: natural, rainfall (20 mm/h to 200 mm/h), seismic (magnitude 6 to 9), and coupled slope-cutting–seismic scenarios. Results indicated that the slope’s safety factor increased slightly from 2.041 to 2.096 after restoration, demonstrating a marginal improvement in stability. Under rainfall conditions, the safety factor decreased from 1.861 to 1.342 (before restoration) and 1.979 to 1.408 (after restoration), showing limited but positive effects of revegetation. Seismic simulations revealed a decrease in stability with increasing magnitudes, as safety factors dropped from 1.761 to 0.916 in magnitude 9 conditions. These findings highlight the limited role of vegetation in enhancing slope stability, which is primarily determined by the intrinsic properties of the rock mass, while also contributing positively to surface integrity, erosion resistance, and ecological recovery. This study provides a novel framework for evaluating slope stability and ecological restoration performance in mining areas.
1. Introduction
In recent years, the scale of infrastructure construction in China has expanded significantly. The implementation of projects such as highways and railways often involves rock slope excavation operations. Therefore, researching rock slope stability holds essential theoretical and practical significance [1]. Currently, most analysis methods for slope stability in the geotechnical field are developed based on soil slopes. Soil slopes have a homogeneous internal structure and clear failure modes. In contrast, rock slopes have a more complex internal structure [2]. A series of significant achievements has been made in the research on the failure modes of homogeneous rock slopes. For example, scholars such as Huang Runqiu [3] have conducted in-depth analysis on the influence of the safe excavation thickness of mine slopes with underlying weak layers on slope stability; Lu Dunhua [4] explored the influence law of structural plane parameters on the stability and sliding mode of layered slopes; Xu Baotian [5] carried out stability analysis on the bedding artificial rock slope in Jiuding Mountain, and comprehensively considered the combined effect of slope excavation and reinforcement.
However, there are relatively few studies on the stability analysis of high rock slopes. The rock mass structure consists of two elements: structural planes and rock blocks. The distribution characteristics of structural planes have a significant impact on the engineering properties of rock masses. Therefore, obtaining information on rock mass structural planes is crucial for rock mass stability analysis [5]. Identifying potential sliding surfaces is an essential step in slope stability analysis. Currently, sliding surface search methods primarily include the fixed-mode search method, mathematical programming method, random search method, artificial intelligence method, and analytical method [6]. The fixed-mode search method predefines the search range, calculates the safety factor for each point or grid, gradually reduces the step size, and connects points corresponding to the minimum safety factor to determine the sliding surface. In recent years, 3D laser scanning technology has become a development trend for the non-contact acquisition of structural plane information because of its long measurement distance, fast sampling speed, high point positioning accuracy, and non-contact measurement [7,8]. Many scholars at home and abroad have applied 3D laser scanning technology to geological surveys of high and steep rock slopes, such as obtaining rock fracture information, rock outcrop information, and rock mass structural plane information [9,10].
Recent studies (2020–2025) have advanced our understanding of vegetation’s hydro-mechanical effects on slope stability, including refined parametrization of root reinforcement in models for shallow landslides and the role of evapotranspiration in pore-pressure reduction [11,12]. Innovative ecological restoration techniques, such as composite vegetation concrete and microbial-enhanced substrates, have also shown promise for steep rocky slopes in mining and highway contexts [13,14]. However, quantitative assessments of revegetation’s impact on steep rock slopes remain limited, particularly regarding marginal mechanical contributions versus dominant rock-mass properties [15,16].
Using laser scanning point cloud data and key field-measurement parameters, this paper used Rocscience Slide software to identify potential sliding surfaces and stability safety factors for high rock slopes during mining operations, both before and after revegetation, and applied the limit equilibrium method to analyze potential slope instability during mining. It is expected to provide a guarantee for the safe mining of mines and a reference for similar projects.
2. Overview of the Study Area
Ningxia is located in the arid and semi-arid region of northwest China, within the interior of the Eurasian continent. The central part of Ningxia has an arid climate, with an annual precipitation of less than 300 mm. The Kazimiao mining area is located in the low-to-medium mountainous region at the northwest foot of Niushou Mountain, south of Qingtongxia City, on the west bank of the Yellow River. It has an average annual precipitation of 181.1 mm, making it a typical limestone mining area in Ningxia. To provide theoretical and technical support for addressing the ecological and environmental challenges of mine slope management, research on mine geological environment monitoring and ecological restoration in this area is planned.
The slope studied is located in the Kazimiao limestone mine in Qingtongxia City, Ningxia. Most of the bedrock is exposed at the surface, with very little Quaternary overburden, and the average thickness of the overburden is less than 1 m. The studied rock slope is relatively high and steep, with deeply developed fractures at its top. Therefore, it was used as a calculation section and is representative of slopes in the study area. Around the slope study site, there are paths for transport vehicles and sites filled and leveled with mine waste (gravel). The current slope situation is illustrated in Figure 1.
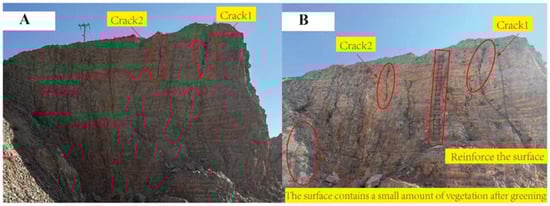
Figure 1.
Current situation of the slope. (A) Before greening and (B) after greening.
Field geological surveys were conducted in the study area in November 2023 and August 2024. According to the field survey, the slope is a rock slope with an elevation range of 1147.27 to 1157.12 m. The rock mass strike is 133°, the slope aspect is 200°, and the dip angle is 87°. Two large cracks are present at the top of the slope. Crack 1 (the first crack on the right when facing the slope): strike 317°, dip angle 79°, and penetration about 3 m downward from the top of the slope. Crack 2 (the second crack on the right when facing the slope): strike 310°, dip angle 81°, and penetration about 2.0 m downward from the top of the slope.
3. Research Methods
3.1. Introduction to Rocscience Slide Model
Rocscience Slide is professional software used for slope stability analysis, primarily to evaluate the stability of soil and rock slopes [5]. The software’s main features and functions are as follows:
Slide software offers comprehensive analysis capabilities, including support design, finite-element analysis of groundwater (seepage), and probabilistic stability analysis. These capabilities enable the software to address slope stability issues in various complex scenarios.
The software conducts slope stability analysis using the limit equilibrium method, applicable to various soil and rock slopes, embankments, dams, and retaining walls. Slide can also perform water level drop analysis, parameter sensitivity analysis, slope failure probability analysis, and support design. The software also features a seepage analysis function based on the finite element method, enabling steady-state and transient seepage calculations. Slide provides at least 17 strength models for soil and rock, including the Mohr–Coulomb model, anisotropic model, and the generalized Hoek–Brown model. The software supports various types of slope reinforcement and support, including anchor bolts, end-fixed anchor bolts, soil nails, piles, and geotextiles. Additionally, Slide features a back-analysis function that enables users to determine the support force required to achieve the expected safety factor. Users can define the search area, and the software automatically searches and calculates the safety factor for all effective sliding surfaces. Slide also includes powerful probabilistic analysis functions. Almost all input parameters can be specified as statistical distributions to estimate the failure probability or reliability index of the slope. Slide uses a Windows-based interactive interface and supports modeling based on CAD maps, enabling users to conduct analysis conveniently and intuitively, whether facing simple or complex problems. Rocscience Slide has been widely used in geotechnical engineering due to its powerful functions and flexibility, especially in slope stability analysis.
For critical slip surface analysis, Slide 6.0 offers several methods, including Grid Search, Path Search, Block Search, and advanced optimization techniques. The software’s automatic search uses an optimization algorithm (Surface Alteration Optimization, based on dynamic programming) to refine initial candidate surfaces and locate the global minimum factor of safety. This approach is particularly effective for non-circular, composite, or wedge-type failures in rock slopes. It ensures efficient convergence to kinematically admissible low-Fs surfaces without requiring extensive user-defined search grids, enhancing reproducibility when slope limits and material boundaries are specified.
3.2. Model Establishment
The model construction of the slope is shown in Figure 2. The relative height of the slope is 9.85 m. The slope angle is calculated according to the average slope obtained from the field geological survey to determine the initial shape of the slope. According to the positions of the two cracks determined by the field survey, they are depicted in the figure with their corresponding lengths and inclination angles. The extension length of the plateau edge is 20 m. The cross-sectional model construction of the slope is shown in Figure 2B, with a stratum base elevation of 1164.916 m, a stratum base depth of 0.5 m, and a stratum thickness of 0.5 m. The names and characteristics of the geotechnical materials are as follows: Quaternary plain fill, which is mottled in color, dry and slightly dense, irregularly accumulated, mainly composed of gravel soil, with local inclusion of a small amount of angular gravel; Marlstone, mainly yellowish-brown, belongs to sedimentary rocks, in a fully weathered to strongly weathered state, locally cemented with a small amount of sandstone, with a muddy structure and bedding structure, which can be softened when exposed to water. The rock mass is broken, and the rock core is incomplete, which is exceptionally soft rock.
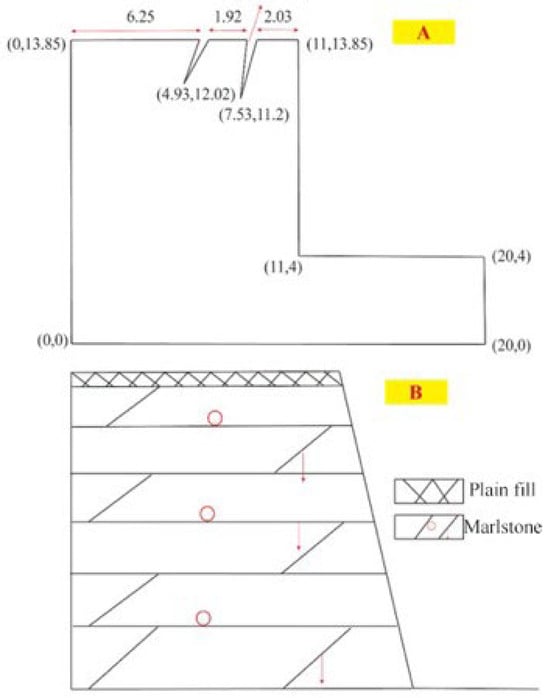
Figure 2.
Schematic diagram of the slope model. (A) Plan and (B) section.
3.3. Calculation Principle
This paper used the limit equilibrium method to conduct slope stability analysis. The limit equilibrium method is a crucial approach for analyzing slope stability. Based on the principle of mechanical equilibrium, it evaluates slope stability by determining the stress state (i.e., the sliding force and anti-sliding force on the sliding mass of the slope) when various failures occur in the rock slope [6]. Currently, the limit equilibrium stability analysis methods employed in engineering include the Fellenius method [17], Bishop method [18], Taylor method [19], Janbu method [20], Morgenstern–Price method [21], Spencer method [22], Sarma method [23], transfer coefficient method, wedge method [24], Baker–Grabel critical sliding surface method, and plane failure calculation method. Because the application scope of these methods differs, it is necessary in practical engineering to comprehensively consider both the geological conditions of the slope rock mass and the shape of the sliding surface when selecting an appropriate analysis method. For plane failure-like landslides in challenging rock slopes, the plane failure method can be used for stability analysis and calculation; for arc-like landslides in homogeneous or large-scale rock slopes, the Fellenius or Bishop method can be selected; for rock slopes with zigzag sliding surfaces, the Janbu or transfer coefficient method can be used; for landslides of wedge-shaped rock blocks, the wedge method can be used for analysis; for heterogeneous rock slopes or rock slopes with composite sliding surfaces, the Janbu, Sarma, Morgenstern–Price, or Spencer method can be used for analysis.
There are many limit equilibrium analysis methods. Although each analysis method has its specific assumptions and application scope, their basic ideas are consistent: assuming that the sliding rock mass is a rigid equilibrium body, and the slope sliding surface is a regular surface such as an arc surface, zigzag line, plane, logarithmic spiral surface or other irregularly shaped surfaces, then the rock mass deformation follows the failure condition of rigid body relative sliding on the sliding surface. The failure mode is determined by analyzing the overall static equilibrium of the sliding mass. Alternatively, the conditions can be further simplified by dividing the sliding mass into several strips and considering their static equilibrium, which allows for the calculation of the safety factor for each sliding surface. The sliding surface with the smallest safety factor is the most dangerous sliding surface of the landslide, and the ultimate load or safety factor of the rock slope can be calculated.
Among them, τ is the shear strength of the soil and rock on the sliding surface; c is the cohesion; σ′ is the effective stress on the sliding surface; and φ is the internal friction angle on the sliding surface.
Among them, is the factor of safety; is the maximum anti-sliding force on the most critical sliding surface; is the sliding force on the most vital sliding surface; C is the cohesion; β is the length of the base side of the sliding block; N is the normal force; α is the inclination angle of slip surface of the soil slice; ϕ is the internal friction angle; W is the weight of the soil strip.
3.4. Determination of Parameters Before and After Ecological Restoration
The parameters required by the Rocscience Slide software are unit weight, cohesion, and internal friction angle, and the other parameters adopt default values. Typical areas in the mining area are selected for geotechnical sampling and laboratory tests.
The observed minor changes post-revegetation (unit weight +1 kN/m3; internal friction angle +1°; cohesion unchanged) are based on direct shear tests and reflect limited shallow root reinforcement and surface organic accumulation on the fractured limestone rock mass (overburden < 1 m). In high-steep rock slopes, roots provide negligible deep anchorage, resulting in minimal bulk mechanical alterations. The literature confirms that root reinforcement primarily increases apparent cohesion (typically 1–10 kPa in shallow soil layers), with insignificant effects on the internal friction angle and only slight unit weight increases from surficial improvements [12,25,26]. Hydrological effects (e.g., evapotranspiration) often dominate over mechanical in rocky substrates.
In the formula: is the bulk density of the soil sample; is the mass of the soil sample; is the volume of the soil sample; and is the acceleration of free fall.
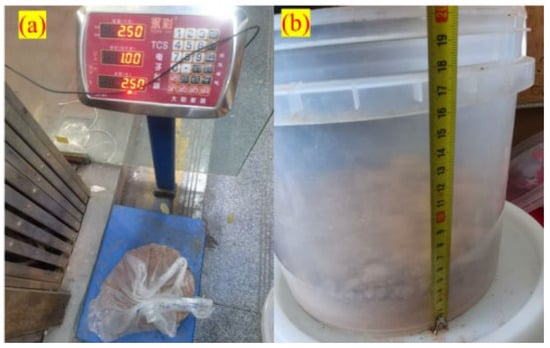
Figure 3.
The measurement process of severe indicators.
The cohesion and internal friction angles were obtained by a direct shear test, using direct shear test apparatus from Xianxian Rushi Technology Co., Ltd., Cangzhou, China as follows:

Figure 4.
Direct shear test instrument.
Figure 3 and Figure 4 depicts the procedure of laboratory testing of parameter determination. Based on field investigations, the slope body is essentially uniform; therefore, calculations in this paper were conducted under the assumption of a uniform slope. The required parameters for the slope obtained through testing are as follows: (1) Pre-vegetation restoration slope: unit weight of rock mass is 26 KN/m3, cohesion is 95 kPa, and the internal friction angle of the rock mass, φ, is 31°; (2) Post-vegetation restoration slope: unit weight of rock mass is 27 KN/m3, cohesion is 95 kPa, and the internal friction angle of the rock mass φ, is 32°. Table 1 depicts the physical and mechanical parameters of rock mass.

Table 1.
Physical and mechanical parameters of the rock mass before and after ecological restoration.
4. Results and Analysis
4.1. 3D Modeling of Laser Scanning Point Cloud Data Before and After Vegetation Restoration
Before revegetation, a 3D laser scanner was used to conduct a detailed scan of the exposed slope in the study area, generating high-density point cloud data, as shown in Figure 5. This point cloud data is constructed based on the laser signals reflected by the slope surface, which includes the micro-texture and structural characteristics of the slope mass, and accurately reflects the 3D shape of the terrain. The data present the spatial distribution of slope mass in the form of high-resolution point sets, which not only accurately capture the detailed features of steep areas but also include the distribution information of cracks and rock joints.
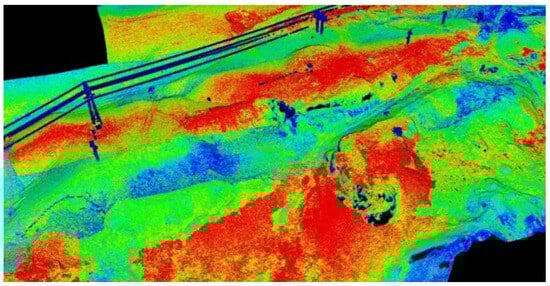
Figure 5.
3D laser scanning synthesis point cloud data (before regreening).
The point cloud data were processed to generate an elevation map of the slope body, as shown in Figure 6. The elevation map displays the distribution of terrain heights using color coding, intuitively distinguishing regional elevation differences through a range of colors. This elevation map effectively reveals the steepness of the slope body and localized abnormal fluctuations, providing a topographic basis for subsequent numerical simulations. Significant height differences between different geological structural zones are clearly observable on the elevation map, providing necessary evidence for potential risk assessments in landslide-prone areas.
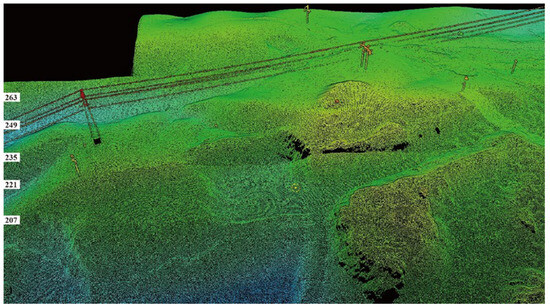
Figure 6.
Elevation data synthesized by 3D laser scanning (before regreening).
During the modeling process, the point cloud data underwent denoising to eliminate possible interfering reflection points and were stitched together through algorithms to ensure the completeness of the model. The 3D modeling before vegetation restoration demonstrates the actual state of the exposed slope body, laying the foundation for subsequent comparative analysis after vegetation restoration.
Comparatively, in August 2024, scans after revegetation (Figure 7 and Figure 8) showed notable surface changes: increased point cloud roughness in vegetated areas, reduced local height variations, and an overall flatter surface profile. These observations indicate that revegetation decreased terrain mutations and enhanced surface integrity, likely contributing to erosion resistance. This aligns with the slope stability results (Section 4.2 and Section 4.3), where post-revegetation safety factors were marginally higher (e.g., natural state: 2.096 vs. 2.041 before; rainfall conditions: consistently 0.01–0.12 higher). The TLS-derived smoother topography post-revegetation supports the minor mechanical improvements (e.g., slight increases in unit weight and friction angle) and positive but limited role of vegetation in stability.
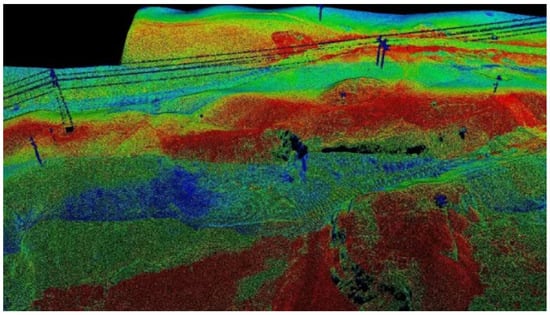
Figure 7.
3D laser scanning synthesis point cloud data (after greening).
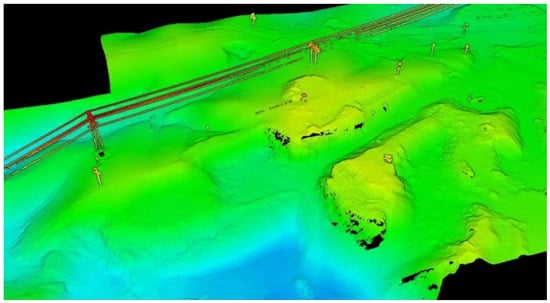
Figure 8.
3D laser scanning synthesized elevation data (after greening).
The processed elevation map (Figure 8) shows that the surface of the slope mass tends to be flat after revegetation, and the height difference in local areas decreases. This change reflects the role of revegetation measures in improving surface stability. The elevation map employs uniform color coding to clearly display the height distribution of the slope mass. Through data comparison, it is evident that vegetation coverage significantly reduces terrain mutation in high- and steep-slope areas while also enhancing the overall stability of the slope mass.
During model production after revegetation, filtering algorithms are used to optimize the quality of point cloud data, removing noise points affected by vegetation, so that the model can more accurately reflect the terrain and vegetation coverage. The 3D modeling after revegetation provides reliable data support for analyzing the effect of revegetation and its specific impact on slope stability. Table 2 depicts the Advantages and disadvantages of terrestrial laser scanning (TLS) for rock slope modeling and stability analysis.
Table 2.
Advantages and disadvantages of terrestrial laser scanning (TLS) for rock slope modeling and stability analysis.
4.2. Stability Safety Factor of the Slope Before Vegetation Restoration
Since the slope is a vertical rock slope, which is generally highly stable, Slide 6.0 software was selected to build a working condition simulation for the slope. The slope is a layered rock mass. According to Appendix A.0.3 of the “Technical Code for Open-pit Slope Engineering of Non-coal Mines” GB51016-2014 [27], its failure mode is determined as a wedge. The slope search function in Rocscience Slide 6.0 software was used to calculate the critical surface (i.e., the potential sliding surface with the smallest safety factor) where the slope is most likely to slide, as well as the safety factor Fs of the slope. Different working conditions, such as the natural state, rainfall conditions, seismic state, slope cutting state, and the coupling state of slope cutting and earthquakes, were designed to analyze the slope stability before and after revegetation.
The critical slip surfaces were determined using the software’s default automatic optimization search method (Surface Alteration Optimization algorithm), which iteratively refines candidate surfaces within user-defined slope limits to identify the global minimum Fs. For the wedge failure mode (as per GB51016-2014) [27], this efficiently locates the most critical planar or composite sliding planes controlled by the two major cracks and slope geometry.
The potential sliding surface and stability safety factor of the slope in its natural state, without rainfall, are shown in Figure 9, with a safety factor of 2.041.
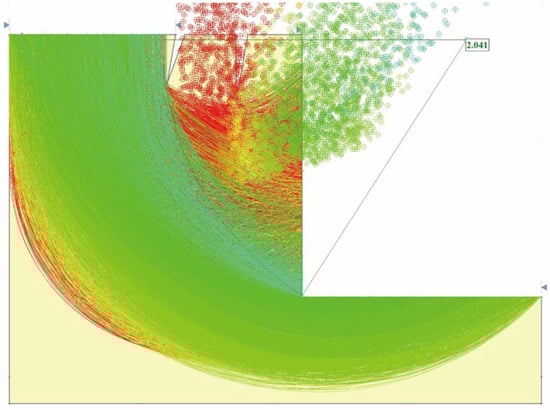
Figure 9.
Potential sliding surface and stability safety factor of the slope in the natural state.
Figure 10 illustrates the potential sliding surfaces and safety factors of the slope before revegetation under various rainfall conditions: 20 mm/h, 50 mm/h, 100 mm/h, and 200 mm/h, respectively. Under the rainfall condition of 20 mm/h, the safety factor of the slope was 1.861. Under the rainfall condition of 50 mm/h, the stability safety factor of the slope was 1.511. Under the rainfall condition of 100 mm/h, the stability safety factor of the slope was 1.425. Under the rainfall condition of 200 mm/h, the stability safety factor of the slope was 1.342. It can be seen from the above data that with the increase in rainfall, the stability safety factor of the slope decreased gradually.
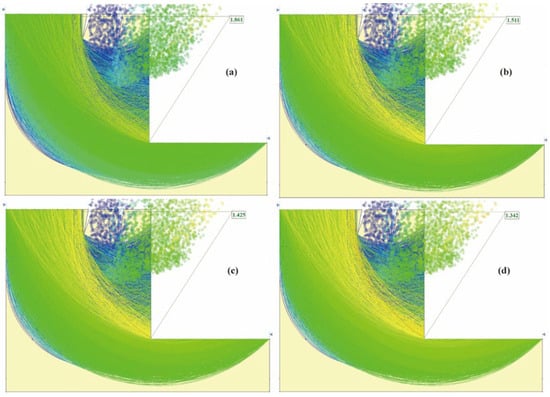
Figure 10.
Potential sliding surface and stability safety factor of slope under rainfall: (a) rainfall condition is 20 mm/h; (b) rainfall conditions of 50 mm/h; (c) rainfall conditions of 100 mm/h; (d) rainfall conditions of 200 mm/h.
According to the “Seismic Ground Motion Parameter Zonation Map of China” (GB 18306-2015) [28] and the “Seismic Intensity Zonation Map of China (1990) [29]”, the earthquake magnitudes and their corresponding acceleration values are listed in Table 3.
Table 3.
Relationship between seismic magnitude and corresponding seismic acceleration values (m/s2).
The potential sliding surfaces and safety factors under different seismic accelerations are shown in Figure 11. When a = 0.05 g (i.e., magnitude 6 earthquake), the safety factor of the slope was 1.761. At a = 0.1 g (i.e., magnitude 7 earthquake), the safety factor of the slope was 1.704. When a = 0.2 g (i.e., magnitude 8 earthquake), the safety factor of the slope dropped to 1.137. At a = 0.4 g (i.e., magnitude 9 earthquake), the safety factor of the slope further decreased to 0.903. From these data, it can be seen that as the magnitude of the quake increases, the stability safety factor of the slope gradually decreases. Moreover, when the earthquake magnitude reaches magnitude 8, the slope is in a less stable state, and during a magnitude 9 earthquake, the slope becomes unstable.
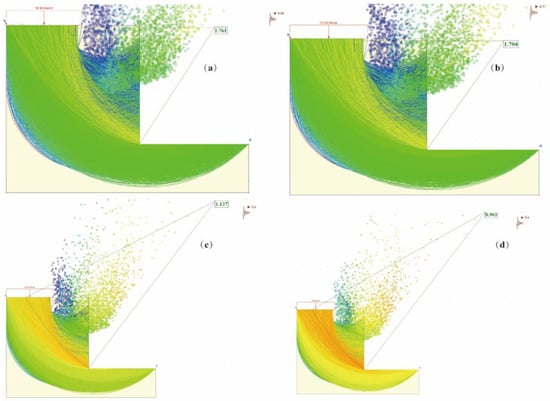
Figure 11.
Potential sliding surface and stability safety factor of the slope under seismic conditions: (a) magnitude 6 earthquake, a = 0.05; (b) magnitude 7 earthquake, a = 0.1; (c) magnitude 8 earthquake, a = 0.2; (d) magnitude 9 earthquake, a = 0.4.
The sliding surfaces and stability safety factors of the slope under slope cutting conditions are shown in Figure 12, with slopes of 40°, 50°, 60°, 80°, and 90°, respectively. Under the condition of 40° slope, the safety factor of the slope was 4.148; under the condition of 50° slope, the safety factor of the slope was 3.205; under the condition of 60° slope, the safety factor of the slope was 2.873; under the condition of 80° slope, the safety factor of the slope was 2.029; under the condition of 90° slope, the safety factor of the slope was 1.804. As shown in the data above, the safety factor of the slope decreases gradually as the slope angle increases. Under the condition of 90° slope cutting, the safety factor of the slope decreased to 1.804.
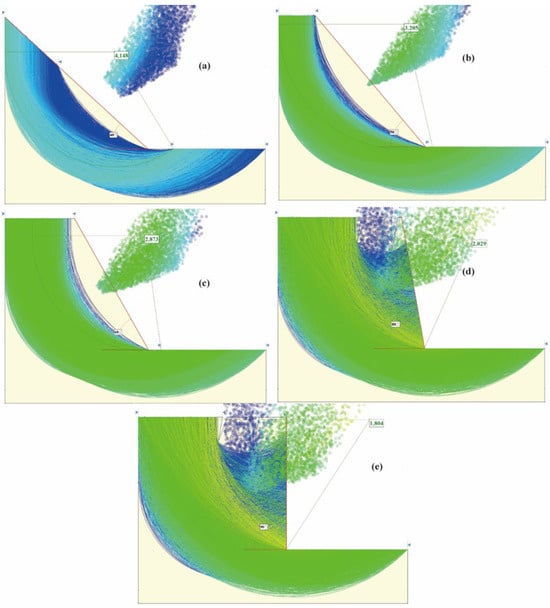
Figure 12.
Potential sliding surfaces and stability safety factors of the slope under cutting conditions at (a) 40 degrees; (b) 50 degrees; (c) 60 degrees; (d) 80 degrees; and (e) 90 degrees.
A coupled condition analysis was conducted for the above-mentioned single conditions, combining slope cutting with earthquakes of different magnitudes. Specifically, the following composite conditions were analyzed: slope cutting at 40 degrees combined with a magnitude 6 earthquake (a = 0.05), a magnitude 7 earthquake (a = 0.1), and a magnitude 8 earthquake (a = 0.2); slope cutting at 50 degrees combined with a magnitude 6 earthquake (a = 0.05), a magnitude 7 earthquake (a = 0.1), and a magnitude 8 earthquake (a = 0.2); slope cutting at 60 degrees combined with a magnitude 6 earthquake (a = 0.05), a magnitude 7 earthquake (a = 0.1), and a magnitude 8 earthquake (a = 0.2); slope cutting at 80 degrees combined with a magnitude 6 earthquake (a = 0.05), a magnitude 7 earthquake (a = 0.1), and a magnitude 8 earthquake (a = 0.2); and slope cutting at 90 degrees combined with a magnitude 6 earthquake (a = 0.05), a magnitude 7 earthquake (a = 0.1), and a magnitude 8 earthquake (a = 0.2).
Table 4 shows the stability safety factors of the slope under coupled conditions. Among them, the safety factors of the slope under 40° slope cutting + magnitude 6 earthquake, 40° slope cutting + magnitude 7 earthquake and 40° slope cutting + magnitude 8 earthquake were 3.892, 3.664 and 3.274, respectively; the safety factors of the slope under 50° slope cutting + magnitude 6 earthquake, 50° slope cutting + magnitude 7 earthquake and 50° slope cutting + magnitude 8 earthquake were 3.031, 2.873 and 2.597, respectively; the safety factors of the slope under 60° slope cutting + magnitude 6 earthquake, 60° slope cutting + magnitude 7 earthquake and 60° slope cutting + magnitude 8 earthquake were 2.748, 2.632, and 2.402, respectively; the safety factors of the slope under 80° slope cutting + magnitude 6 earthquake, 80° slope cutting + magnitude 7 earthquake and 80° slope cutting + magnitude 8 earthquake were 1.971, 1.916, and 1.771, respectively; the safety factors of the slope under 90° slope cutting + magnitude 6 earthquake, 90° slope cutting + magnitude 7 earthquake and 90° slope cutting + magnitude 8 earthquake were 1.745, 1.689, and 1.569, respectively.
Table 4.
Stability safety factor of slope under composite conditions.
It can be seen from the above data that under coupled conditions, the stability safety factor of the slope decreases with an increase in earthquake magnitude. Additionally, as the slope rises, the stability safety factor of the slope also decreases gradually.
Stability Safety Factor of the Slope After Vegetation Restoration
After vegetation restoration, the slope sliding surface and safety factor under natural conditions are shown in Figure 13 below, with a safety factor of 2.096.

Figure 13.
Potential sliding surface and stability safety factor of slope in natural state without rainfall.
Figure 14 shows the potential sliding surfaces and safety factors of the slope after revegetation under different rainfall conditions. Under the rainfall condition of 20 mm/h, the safety factor of the slope was 1.979. Under the rainfall condition of 50 mm/h, the stability safety factor of the slope was 1.551. Under the rainfall condition of 100 mm/h, the stability safety factor of the slope was 1.502. Under the rainfall condition of 200 mm/h, the stability safety factor of the slope was 1.408.
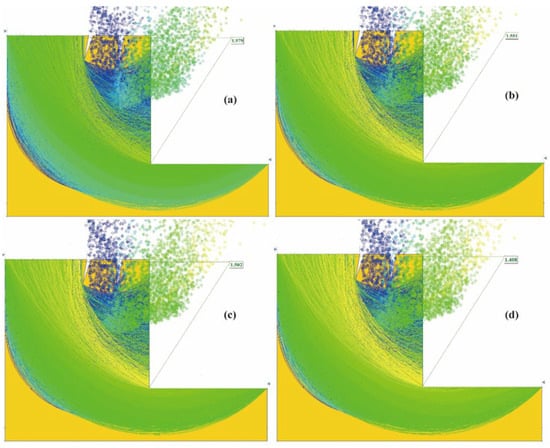
Figure 14.
Potential sliding surface and stability safety factor of slope under rainfall condition: (a) rainfall condition is 20 mm/h; (b) rainfall conditions of 50 mm/h; (c) rainfall conditions of 100 mm/h; (d) rainfall conditions of 200 mm/h.
The data suggest that as rainfall increases, the slope’s safety factor for stability gradually decreases. However, after vegetation restoration, the safety factor under rainfall conditions tends to be slightly higher than before restoration.
After vegetation restoration, the potential sliding surfaces and safety factors under different seismic accelerations are shown in Figure 15. When a = 0.05 g (corresponding to a magnitude 6 earthquake), the safety factor of the slope was 1.863; when a = 0.1 g (corresponding to a magnitude 7 earthquake), the safety factor was 1.752; when a = 0.2 g (corresponding to a magnitude 8 earthquake), the safety factor was 1.143; and when a = 0.4 g (corresponding to a magnitude 9 earthquake), the safety factor dropped to 0.916, from this data, it can be concluded that as earthquake magnitude increases, the slope’s safety factor decreases gradually. Additionally, at a magnitude of 8, the slope is in a less stable state, and at a magnitude of 9, it becomes unstable. The safety factor of the slope after vegetation restoration under seismic conditions was roughly similar to that before restoration.
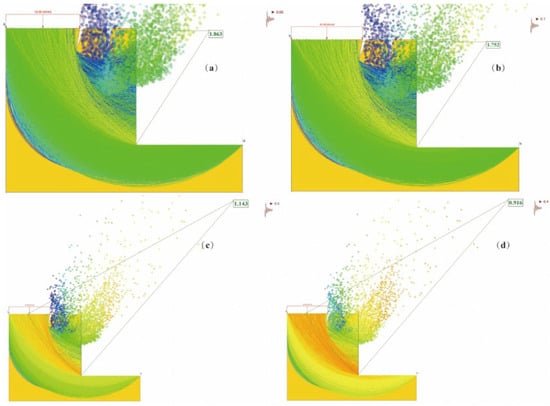
Figure 15.
Stability safety factor under seismic conditions: (a) magnitude 6 earthquake, a = 0.05; (b) magnitude 7 earthquake, a = 0.1; (c) magnitude 8 earthquake, a = 0.2; (d) magnitude 9 earthquake, a = 0.4.
After vegetation restoration, the potential sliding surfaces and safety factors under different slope angles are shown in Figure 16. Under a slope angle of 40°, the safety factor of the slope was 4.192. At a slope angle of 50°, the safety factor of the slope was 3.240. When the slope angle was 60°, the safety factor of the slope was 2.905. Under a slope angle of 80°, the safety factor of the slope decreased to 2.053. At a slope angle of 90°, the safety factor further dropped to 1.825. As the slope angle increases, the safety factor of the slope gradually decreases. At a slope angle of 90°, the safety factor of the slope reduced to 1.825 but it remained in a stable state. After vegetation restoration, the stability safety factor of the slope under cutting conditions increased slightly compared to before restoration.
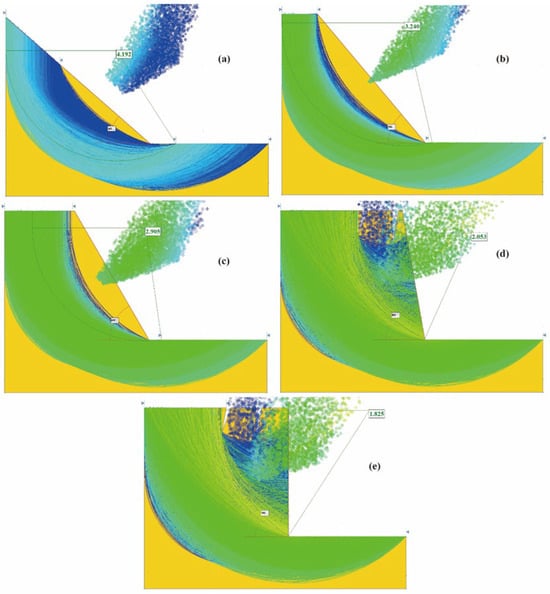
Figure 16.
Minimum potential sliding surface position and safety factor of slope at (a) 40 degrees; (b) 50 degrees; (c) 60 degrees; (d) 80 degrees; and (e) 90 degrees.
Table 5 shows the stability safety factors of the slope under coupled conditions after revegetation. Among them, the safety factors of 40° slope cutting + magnitude 6 earthquake, 40° slope cutting + magnitude 7 earthquake and 40° slope cutting + magnitude 8 earthquake are 3.934, 3.703 and 3.310, respectively; the safety factors of 50° slope cutting + magnitude 6 earthquake, 50° slope cutting + magnitude 7 earthquake and 50° slope cutting + magnitude 8 earthquake are 3.064, 2.905 and 2.625, respectively; the safety factors of 60° slope cutting + magnitude 6 earthquake, 60° slope cutting + magnitude 7 earthquake and 60° slope cutting + magnitude 8 earthquake are 2.778, 2.661 and 2.429, respectively; the safety factors of 80° slope cutting + magnitude 6 earthquake, 80° slope cutting + magnitude 7 earthquake and 80° slope cutting + magnitude 8 earthquake are 1.995, 1.939 and 1.792, respectively; the safety factors of 90° slope cutting + magnitude 6 earthquake, 90° slope cutting + magnitude 7 earthquake and 90° slope cutting + magnitude 8 earthquake are 1.766, 1.709 and 1.589, respectively.
Table 5.
Stability safety factor of slope under composite conditions.
It can be seen from the Table 5 that, under coupled conditions, the stability safety factor of the slope decreases with an increase in earthquake magnitude. Additionally, as the slope rises, the stability safety factor of the slope also decreases gradually. However, after revegetation, the stability safety factor of the slope tends to be slightly higher than that before revegetation.
4.3. Slope Stability Analysis
4.3.1. Qualitative Analysis of Slope Stability
The measured attitudes of the slope surface and fractures are as follows:
The rock slope has two free faces, as shown in Figure 1. Slope A (i.e., the slope on the right-hand side when facing the photograph) is in a state of intense weathering. On Slope B (i.e., the slope visible in the picture), approximately vertically oriented fractures can be observed.
Slope A: The strike of the slope is 133°, with a dip direction towards the NE and an inclination of approximately 40°.
Slope B: The strike of the slope surface is 200°, dipping towards the NW with an inclination of 87°.
Fractures: The fracture strike ranges from 310° to 317°, with the fracture plane dipping towards the SW at an inclination of approximately 79° to 81°. The deepest fracture extends from the slope top to a depth of 3 m at the slope base.
The slope stability analysis is as follows:
Slope A: The strike of the slope surface is generally consistent with the strike of the fractures (with a slope inclination of about 40° and a fracture inclination of about 80°). Since the dip direction of the slope surface is opposite to that of the fracture plane, the likelihood of slope sliding is low (its stereographic projection is shown in Figure 17).
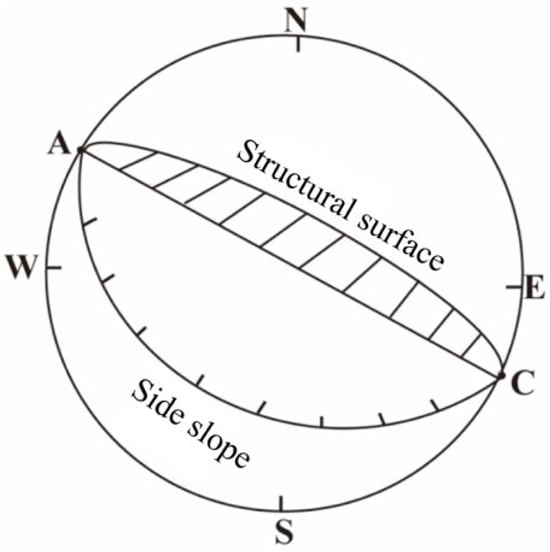
Figure 17.
Chipping projection of the relationship between structural plane A and slope.
Slope B: The strike of the slope surface is inconsistent with the strike of the fracture plane. The strike of the slope surface is 200°, while the strike of the fractures ranges from 310° to 317°, resulting in an angle between the slope strike and the fracture strike that is greater than 40°. Therefore, this slope can generally be considered stable, and the possibility of sliding in the hard rock layer is low (its stereographic projection is shown in Figure 18).
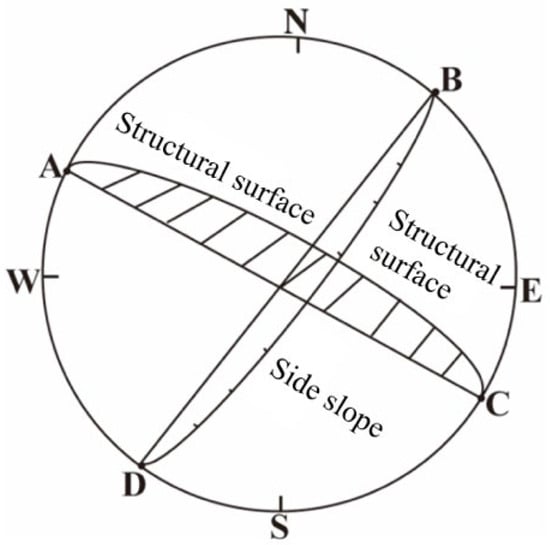
Figure 18.
Chipping projection of the relationship between structural plane B and slope.
However, comparing the photos of the rock slope before revegetation in November 2023 and after revegetation in August 2024, it is evident that the fracture density on Slope B increased significantly after revegetation. This indicates that fractures develop and change rapidly, and the slope has a high possibility of collapse failure. It is suggested that the necessary protective measures are taken for this.
4.3.2. Quantitative Analysis of Slope Stability
Using the slope search function in Rocscience Slide 6.0 software, the dangerous surface (i.e., the potential sliding surface with the smallest safety factor) where the slope is most likely to slide before and after revegetation was calculated, and the safety factor of the slope was calculated. Before revegetation, the minimum safety factor of the slope was 2.041 (Figure 9); after revegetation, the minimum safety factor of the slope was 2.096 (Figure 13). The results show that the safety factors before and after revegetation were basically similar.
In addition, according to the “Specification for Investigation of Landslide Prevention Engineering” (GB/T 32864-2016) [30], when the stability coefficient Fs ≥ 1.15, the slope is in a stable state; when 1.15 ≥ Fs > 1.05, it is basically stable; when 1.05 ≥ Fs > 1.0, it is less stable; when Fs < 1.0, it is unstable [13]. Under different working conditions, the slope is in a stable state. Combined with the field investigation results and numerical simulation analysis, the numerical simulation results are considered reliable.
Slope stability is a crucial factor to consider in the maintenance and management of engineering geological structures. Many factors induce common landslide geological hazards. Therefore, in the process of engineering structure maintenance and treatment, it is necessary to strengthen preventive measures, comprehensively consider the influence of external and internal factors, and formulate reasonable prevention strategies.
5. Discussion
In the process of mine mining, the stability of rock slopes is of great importance, especially in the ecological treatment of high and steep slopes. Vegetation restoration is considered an effective method for ecological restoration. However, through numerical simulation analysis using Rocscience Slide software in this study, it was found that the impact of vegetation restoration on the stability of high and steep rock slopes is relatively limited, with a small variation range in the safety factor.
Firstly, the stability of rock slopes primarily depends on the inherent properties of the rock mass itself, including its structure, degree of weathering, and fracture distribution [14]. Compared with soil slopes, rock slopes have a more complex structure, and the physical and mechanical properties of the rock mass play a decisive role in their stability. In this study, the rock mass characteristics of the slope, such as cohesion and friction angle, remained relatively unchanged before and after vegetation restoration, which is the primary reason for the slight variation in the safety factor before and after vegetation restoration.
Through numerical simulation analysis, it was found that the minimum safety factors of the slope under natural working conditions before and after vegetation restoration were 2.041 and 2.096, respectively, with a slight difference. This indicates that vegetation restoration does not significantly alter the stability of the rock slope. This result shows that although vegetation can reduce soil erosion through soil consolidation and has a good stabilizing effect on some soil slopes, its impact on rock slopes is relatively weak. The role of vegetation in stabilizing rock slopes appears to be less critical than in soil slopes.
However, this does not mean that vegetation restoration has no impact on slope stability. Although the effect of vegetation restoration is relatively limited, it has significant value in improving the ecological environment of the slope, reducing soil erosion, increasing biodiversity, and restoring ecological functions. In addition, after vegetation restoration, the soil layer covering the slope surface and the growth of plants are also beneficial in improving the ecological environment of the slope. Although this improvement cannot significantly improve the stability of the slope, it plays a positive role in ecological restoration and environmental protection. This is consistent with recent reviews highlighting that root reinforcement predominantly enhances apparent cohesion in soil-dominated slopes, with hydrological mechanisms (e.g., rainfall interception and transpiration) providing greater stabilization benefits in fractured rock environments [11,12]. Advanced restoration approaches, such as vegetation concrete and species-specific planting, further improve surface integrity and erosion resistance without substantially altering bulk rock stability [13,14].
To contextualize the limited mechanical contribution of revegetation observed in this study (an increase in Fs of ~0.055 under natural conditions and a proportionally slight increase under rainfall/seismic loading), it is helpful to compare it with conventional engineering methods and empirical data from similar high-steep rocky slopes.
Engineering measures, such as rock bolting, anchoring, or soil nailing, typically provide substantial increases in Fs (often 0.5–2.0 or more) by directly reinforcing the rock mass and resisting shear along discontinuities, far exceeding the marginal effects of vegetation roots in fractured rock with thin overburden. Vegetation primarily provides hydrological reinforcement (e.g., reduced pore pressure through evapotranspiration) and controls surface erosion, with mechanical root anchorage typically limited to shallow layers in rock slopes. Table 6 summarizes indicative Fs improvements from selected studies.
Table 6.
Indicative factor of safety (Fs) improvements from vegetation versus engineering stabilization methods in rocky or mine slopes (adapted from the literature).
Empirical cases from arid/semi-arid Chinese mining areas (e.g., limestone quarries or coal dumps) similarly show that revegetation yields excellent ecological outcomes (e.g., high vegetation coverage and biodiversity recovery) but constrained mechanical stability on bare steep rock, often requiring combined engineering (e.g., slope cutting or substrates) for effective restoration. This supports our findings and underscores the practical value of hybrid approaches in mining contexts.
To contextualize our findings, Table 7 summarizes selected studies on slope stability following revegetation/ecological restoration in mining or similar contexts, focusing on quantitative Fs assessments where available.
Table 7.
Comparison of slope stability effects from revegetation/ecological restoration in selected studies.
These comparisons highlight that revegetation often yields more substantial stability benefits in soil-rich or less steep mining dumps (via direct root-soil reinforcement) compared to high-steep fractured rock slopes, where effects are confined to surface protection and minor hydrological improvements. Our results align with cases that emphasize the limited mechanical contributions in bare rock environments, supporting the need for hybrid engineering-ecological strategies.
Additionally, the research results also indicate that a single factor does not determine the stability of rock slopes. In practical engineering, in addition to vegetation restoration, climate conditions, geological characteristics, and engineering technical measures should also be considered comprehensively. The treatment of rock slopes should adopt comprehensive measures, including traditional reinforcement, support, and other engineering technical means, and supplemented by vegetation restoration to improve the environment and ecological conditions.
Finally, it is worth noting that this study only considered the single factor of vegetation restoration. Future research can further investigate the comprehensive impact of multiple factors, including climate change, precipitation, soil quality, and rock mass structure, on the stability of rock slopes. Only through multi-factor coupling analysis can the stability of rock slopes be evaluated more comprehensively, and more reliable theoretical support and practical guidance can be provided for mine mining and slope treatment.
5.1. Limitations of Rainfall and Seismic Loading Assumptions
The rainfall conditions in this study were simulated using constant intensities (20–200 mm/h) applied as steady-state scenarios in the limit equilibrium analyses, without explicitly modeling transient infiltration processes or the effects of rainfall duration. In reality, prolonged rainfall (even at lower intensities) can lead to deeper infiltration and greater pore pressure buildup, potentially causing larger reductions in the factor of safety (Fs) compared to short-duration high-intensity events with equivalent total rainfall [33,34]. For rock slopes with fractures and thin overburden, infiltration is often rapid but limited in depth. However, ignoring duration may overestimate stability in extended rainfall events or underestimate surface runoff contributions.
Similarly, seismic loading was analyzed using the pseudo-static method in Rocscience Slide, with a constant horizontal acceleration coefficient applied. This simplification is conservative and widely used for preliminary assessments but does not account for dynamic effects such as wave propagation, ground motion amplification, cyclic degradation of rock mass strength, or time-dependent inertial forces [35,36]. Complete dynamic analyses (e.g., finite element time-history methods) could reveal different critical acceleration thresholds or permanent displacements, particularly for higher-magnitude events.
These assumptions likely yielded conservative Fs estimates for the studied high-steep limestone slope, where intrinsic rock properties dominate stability. For more refined evaluations in rainfall-prone or seismically active regions, coupled transient seepage and dynamic analyses are recommended.
5.2. Engineering Significance of the Observed Safety Factor Variations
The calculated improvements in the factor of safety (Fs) after vegetation restoration were consistently minor across all scenarios, for example, from 2.041 to 2.096 (ΔFs ≈ 0.055) under natural conditions, and proportionally minor under rainfall (typically ΔFs = 0.05–0.12), seismic, and coupled loading. From an engineering standpoint, this magnitude of change holds limited practical significance for the overall stability of high and steep rock slopes. According to standard design codes (e.g., GB 51016-2014 [27] for open-pit mines and similar international guidelines requiring Fs ≥ 1.5–2.0 with adequate margins for uncertainties), such a marginal increase does not alter the stability classification (remaining well above 2.0 in natural state) nor justify vegetation as a standalone structural reinforcement measure.
The slight Fs enhancement likely stems from shallow surface effects (e.g., minor frictional improvements and reduced superficial erosion), which may contribute positively to localized integrity and long-term durability against weathering. However, it does not meaningfully mitigate risks from dominant controlling factors such as rock mass fracturing, seismic loading, or deep-seated failure modes. This underscores that revegetation’s primary engineering value in such contexts lies in complementary roles, enhancing hydrological stability (e.g., reduced infiltration via evapotranspiration) and erosion control, rather than providing substantial mechanical reinforcement comparable to engineering interventions (e.g., anchoring or bolting, which routinely achieve ΔFs > 0.5).
5.3. Comparison with Long-Term Field Studies on Vegetation Restoration Effects
Our study assessed stability changes over a short ~9-month period post-revegetation, capturing only initial effects such as marginal Fs increases (ΔFs ≈ 0.055 natural; 0.05–0.12 under rainfall) from shallow surface improvements. Long-term observations (5–20+ years) from similar mining sites indicate progressive enhancements in stability, driven by deeper root development, soil aggregation, and hydrological maturation, which our simulations may underestimate. Table 8 summarizes selected long-term field studies, comparing their outcomes to our simulation results.
Table 8.
Comparison of simulation results with long-term field studies on vegetation restoration in mining slopes.
6. Conclusions
- (1)
- Revegetation measures have a relatively small impact on the stability of steep, high rock slopes, with marginal changes in the safety factor (Fs) before and after restoration (e.g., from 2.041 to 2.096 under natural conditions; 1.861–1.342 to 1.979–1.408 under 20–200 mm/h rainfall). This confirms that rock slope stability is primarily controlled by inherent rock mass properties (e.g., structure, weathering, fractures), and standalone vegetation cannot significantly enhance bulk mechanical stability.
- (2)
- Despite limited mechanical effects, vegetation restoration contributes to ecological recovery by reducing surface erosion, improving biodiversity, enhancing ecosystem functions in the mining area, and supporting long-term environmental resilience.
- (3)
- Effective rock slope management requires a comprehensive strategy that integrates engineering measures (e.g., anchoring, retaining walls, soil nailing), climate factors (e.g., extreme precipitation and temperature variability), and environmental enhancements (e.g., soil amendments, microbial aids). Vegetation alone provides limited mechanical stabilization but valuable surface protection and hydrological benefits.
- (4)
- Based on this study’s data, targeted engineering recommendations include:
- For slopes with Fs < 1.5 under rainfall (e.g., >100 mm/h) or seismic (e.g., magnitude ≥ 8) conditions, prioritize structural reinforcement measures such as rock bolts or slope cutting (which increased Fs by 0.2–2.3 in our simulations) over revegetation alone.
- Use vegetation as a complementary measure for erosion-prone surfaces, particularly in arid mining areas such as Kazimiao, where it marginally improves Fs (ΔFs ≈ 0.05–0.12) and enhances ecological integrity without altering the overall stability classification (per GB 51016-2014) [27].
- In coupled scenarios (e.g., 80–90° cutting + magnitude 8 earthquake, Fs ≈ 1.57–1.79 post-revegetation), adopt hybrid approaches that combine revegetation with engineering to maintain Fs > 1.5, accounting for site-specific fractures and thin overburden.
To move beyond current limitations (e.g., short-term assessments), future studies should prioritize:
- Long-term monitoring (5–20+ years) using remote sensing (e.g., UAV-NDVI, satellite imagery) and in situ sensors to evaluate vegetation succession, root reinforcement, and stability under climate variability, including temperature fluctuations and altered precipitation.
- Multi-factor coupled analyses incorporating climatic conditions (e.g., temperature variability inducing freeze–thaw and intensified rainfall), rock mass properties (e.g., fracturing, permeability, shear strength), and engineering interactions in advanced simulations (e.g., finite element analyses with unsaturated flow and hydro-mechanical root models).
- Optimized revegetation techniques for steep rock slopes, including drought-tolerant species mixtures, innovative substrates (e.g., composite vegetation concrete, geosynthetics), and microbial inoculation to improve establishment in thin overburden and arid conditions.
- Hybrid frameworks with standardized metrics that integrate stability, ecology (e.g., biodiversity, carbon sequestration), and socioeconomics for sustainable mine reclamation.
These advancements, informed by recent progress in hydro-mechanical vegetation modeling and climate-impacted slope analyses, will enable more effective and resilient strategies for managing rock slopes in mining areas.
Limitations
This study offers valuable insights into the limited role of revegetation in rock slope stability, but it also has several constraints. The 9-month revegetation period (November 2023–August 2024) may not capture long-term effects, such as deeper root development or vegetation succession, potentially underestimating delayed hydrological benefits. Modeling simplifications, including constant rainfall intensities without transient infiltration (which could amplify pore pressure during prolonged events) and pseudo-static seismic analysis (neglecting dynamic wave effects and cyclic degradation), yield conservative Fs estimates but may not fully capture real-world complexities. The uniform slope assumption and site-specific parameters (e.g., fractured limestone with <1 m overburden) limit generalizability to other rock types or overburden depths. Future work should incorporate dynamic modeling, longer-term data, and multi-site comparisons to refine these findings.
Author Contributions
Conceptualization, J.Z., H.W. and A.A.; Data curation, H.W., G.W., F.L. and S.Q.M.; Investigation, J.Z.; Methodology, J.Z., J.A. and A.A.; Project administration, A.A.; Software, J.Z. and J.A.; Supervision, A.A.; Validation, J.F., Y.G. (Yongfeng Gong), Y.G. (Yu Gao), G.Z. and S.Q.M.; Writing—original draft, J.Z., H.W. and J.A.; Writing—review and editing, F.L., A.A., J.F. and Y.G. (Yu Gao). All authors have read and agreed to the published version of the manuscript.
Funding
This research was funded by the National Natural Science Foundation of China (Grant No. 42261144749); the National Foreign Expert Individual Human Project (Category H) (H20240400); International Science and Technology Cooperation Program of Shaanxi Province (Grant No. 2024GH-ZDXM-24).
Institutional Review Board Statement
Not applicable.
Informed Consent Statement
Not applicable.
Data Availability Statement
The original contributions presented in this study are included in the article material, and further inquiries can be directed to the corresponding author.
Acknowledgments
We sincerely thank the editor and all reviewers for their valuable comments and feedback.
Conflicts of Interest
The authors declare no conflicts of interest.
References
- Zhu, D.; Xu, Q.; Li, S. Analysis of the Genetic Model and Geological Characteristics of Large to Extra-Large Layered Rock Landslides in the Three Gorges Reservoir Area. Geol. Sci. Technol. Bull. 2020, 39, 158–167. [Google Scholar]
- Li, N.; Guo, S.; Yao, X. Further Discussion on Stability Analysis Methods for High Rock Slopes. Geomechanics 2018, 39, 397–406+416. [Google Scholar]
- Huang, R.; Fu, J.A.; Chen, L. Study on the safe thickness of mine slope excavation with underlying weak layer. J. Geol. Hazards Prev. 2000, 9–13. [Google Scholar]
- Lu, D.H.; Qv, Y.W.; He, Z.M.; Peng, W.X.; Zhou, L.J. Three-dimensional analysis of the influence of structural surface strength parameters on the stability of layered slopes. J. Cent. South Univ. (Nat. Sci. Ed.) 2011, 42, 147–151. [Google Scholar]
- Xu, B.Q.; Qian, Q.H.; Yan, C.H.; Xv, H.F. Stability and reinforcement analysis of multi-layered weak interlayered slope rock mass. Chin. J. Rock Mech. Eng. 2009, 28, 3959–3964. [Google Scholar]
- Wang, Z.; Lu, X.; Gu, X. Slope Stability Analysis of Gongchangling Open-pit Mine Based on Limit Equilibrium Method. Mod. Min. 2023, 39, 76–79. [Google Scholar]
- Dong, X. Research on 3D Laser Scanning Technology and Its Engineering Applications. Master’s Thesis, Chengdu University of Technology, Chengdu, China, 2007. [Google Scholar]
- Wang, C.; Xia, X. A Review of Critical Slip Surface Search Methods in Slope Stability Analysis. Sichuan Build. Sci. Res. 2002, 34–39. [Google Scholar]
- Fardin, N.; Feng, Q.; Stephansson, O. Application of a new in situ 3D laser scanner to study the scale effect on the rock joint surface roughness. Int. J. Rock Mech. Min. Sci. 2004, 41, 329–335. [Google Scholar] [CrossRef]
- Ge, Y.F.; Xia, D.; Tang, H.M.; Zhao, B.B.; Wang, L.Q.; Chen, Y. Intelligent identification and information extraction of rock mass structural surfaces based on 3D laser scanning technology. Chin. J. Rock Mech. Eng. 2017, 36, 3050–3061. [Google Scholar]
- DiBiagio, A.; Capobianco, V.; Oen, A.; Tallaksen, L.M. State-of-the-art: Parametrization of hydrological and mechanical reinforcement effects of vegetation in slope stability models for shallow landslides. Landslides 2024, 21, 2417–2446. [Google Scholar] [CrossRef]
- Lann, T.; Bao, H.; Lan, H.; Zheng, H.; Yan, C.; Peng, J. Hydro-mechanical effects of vegetation on slope stability: A review. Sci. Total Environ. 2024, 926, 171691. [Google Scholar] [CrossRef] [PubMed]
- Cheng, X.; Yang, R.; Han, Y. Construction method for ecological protection of stone side slopes using composite vegetation concrete. Sci. Rep. 2023, 13, 16871. [Google Scholar] [CrossRef] [PubMed]
- Liu, C.; Bi, H.; Wang, D.; Li, X. Stability reinforcement of slopes using vegetation considering the existence of soft rock. Appl. Sci. 2021, 11, 9228. [Google Scholar] [CrossRef]
- Masi, E.B.; Segoni, S.; Tofani, V. Root reinforcement in slope stability models: A review. Geosciences 2021, 11, 212. [Google Scholar] [CrossRef]
- Xu, H.; Qiao, X.; Gao, G.; Dou, H.; Waheed, A.; Aili, A. Advances in Ecological Restoration of Mining-Impacted Landscapes: Techniques, Case Studies, and Key Challenges. Environ. Res. 2025, 290, 123485. [Google Scholar] [CrossRef]
- Fellenius, W. Calculation of stability of earth dam. In Transactions 2nd Congress Large Dams; International Commission on Large Dams (ICOLD): Washington, DC, USA, 1936. [Google Scholar]
- Bishop, A.W. The use of the slip circle in the stability analysis of slopes. Geotechnique 1955, 5, 7–17. [Google Scholar] [CrossRef]
- Taylor, D.W. Stability of earth slopes. J. Boston Soc. Civ. Eng. 1937, 24, 197–247. [Google Scholar]
- Janbu, N. Application of composite slip surfaces for stability analysis. In European Conferrence on Stability of Earth Slopes; Royal Swedish Geotechnical Institute: Linköping, Sweden, 1955; Volume 3, pp. 43–49. [Google Scholar]
- Morgenstern, N.; Price, V.E. The analysis of the stability of general slip surfaces. Geotechnique 1965, 15, 79–93. [Google Scholar] [CrossRef]
- Spencer, E. A method of analysis of the stability of embankments assuming parallel inter-slice forces. Geotechnique 1967, 17, 11–26. [Google Scholar] [CrossRef]
- Sarma, S.K. Stability analysis of embankments and slopes. Geotechnique 1973, 23, 423–433. [Google Scholar] [CrossRef]
- Hoek, E.; Bray, J.D. Rock Slope Engineering; CRC press: Boca Raton, Florida, USA, 1981. [Google Scholar]
- Gonzalez-Ollauri, A.; Mickovski, S.B. Hydrological effect of vegetation against rainfall-induced landslides. J. Hydrol. 2017, 549, 374–387. [Google Scholar] [CrossRef]
- Pollen, N.; Simon, A. Estimating the mechanical effects of riparian vegetation on stream bank stability using a fiber bundle model. Water Resour. Res. 2005, 41. [Google Scholar] [CrossRef]
- GB 51016-2014; Technical Code for Non-Coal Open-Pit Mine Slope Engineering. Standardization Administration of the People’s Republic of China: Beijing, China, 2014.
- GB 18306-2015; Seismic Ground Motion Parameter Zonation Map of China. Standardization Administration of the People’s Republic of China: Beijing, China, 2015.
- Jia, S.-J.; Yan, J.-Q. Research on seismic intensity zonation by use of the response intensity of historical earthquakes—with the central part of Shanxi Province as an example. Acta Seismol. Sin. 1996, 9, 645–657. [Google Scholar] [CrossRef]
- GB/T 32864-2016; Code for Geological Investigation of Landslide Prevention. Standardization Administration of the People’s Republic of China: Beijing, China, 2016.
- Li, X.; Qin, Z.; Tian, Y.; Zhang, H.; Zhao, H.; Shen, J.; Shao, W.; Jiang, G.; Guo, X.; Zhang, J. Study on stability and ecological restoration of soil-covered rocky slope of an abandoned mine on an island in rainy regions. Sustainability 2022, 14, 12959. [Google Scholar] [CrossRef]
- Ranjan, V.; Sen, P.; Kumar, D.; Sarsawat, A. A review on dump slope stabilization by revegetation with reference to indigenous plant. Ecol. Process. 2015, 4, 14. [Google Scholar] [CrossRef]
- Iverson, R.M. Landslide triggering by rain infiltration. Water Resour. Res. 2000, 36, 1897–1910. [Google Scholar] [CrossRef]
- Collins, B.D.; Znidarcic, D. Stability analyses of rainfall induced landslides. J. Geotech. Geoenviron. Eng. 2004, 130, 362–372. [Google Scholar] [CrossRef]
- Kramer, S.L. Geotechnical Earthquake Engineering; Prentice Hall: New York, NY, USA; CRC Press: Boca Raton, FL, USA, 1996; Volume 794. [Google Scholar]
- Newmark, N.M. Effects of earthquakes on dams and embankments. Geotechnique 1965, 15, 139–160. [Google Scholar] [CrossRef]
- Cui, Z.; Kang, H.; Wang, W.; Guo, W.; Guo, M.; Chen, Z. Vegetation restoration restricts rill development on dump slopes in coalfields. Sci. Total Environ. 2022, 820, 153203. [Google Scholar] [CrossRef]
- Du, Z.; Zhou, R.; Chen, Y.; Zhan, E.; Chen, Y.; Zheng, H.; Deng, D.; He, L.; Chen, D.; Gao, H.; et al. Effects of long-term vegetation restoration on soil aggregate and aggregate-associated nutrient stoichiometry of desertified grassland on the eastern Qinghai–Tibet Plateau. Agric. Ecosyst. Environ. 2025, 388, 109661. [Google Scholar] [CrossRef]
- Zhao, X.; Li, H.; Li, P.; Chen, Y.; Dai, Q.; Shi, P.; Li, X.; Qu, Y.; Ma, J. Impact of Mining Area Steep Slope Conditions on the Soil and Water Conservation Benefits of Ecological Restoration. Water 2025, 17, 256. [Google Scholar] [CrossRef]
Disclaimer/Publisher’s Note: The statements, opinions and data contained in all publications are solely those of the individual author(s) and contributor(s) and not of MDPI and/or the editor(s). MDPI and/or the editor(s) disclaim responsibility for any injury to people or property resulting from any ideas, methods, instructions or products referred to in the content. |
© 2026 by the authors. Licensee MDPI, Basel, Switzerland. This article is an open access article distributed under the terms and conditions of the Creative Commons Attribution (CC BY) license.