Abstract
To achieve energy savings, reduce consumption, and support the “dual-carbon” strategy in China, this study applies digital twin technology to investigate the centralized air-conditioning water system of a metro-station HVAC installation and develops a high-fidelity digital twin model to reveal the thermal delay and thermal attenuation characteristics of the pipeline network. Using the noncausal modeling approach of the Modelica language, a full digital twin representation of the centralized air-conditioning water network is constructed by covering chillers, cooling towers, pumps, terminal units, the pipeline network, etc. The model is validated against real operation data to ensure high fidelity. Validation shows the predicted chilled water flow rate of the digital twin model agrees well with the measured chilled water flow rate with an RMSE of 0.27 kg/s. Validation also shows the difference is about 0.3 °C between the digital twin prediction and the measurement in the main pipe. Based on the validation digital twin model, the thermal delay and thermal attenuation characteristics of the centralized air-conditioning water system are seriously evaluated. The results indicate that branch K3, due to its longest transport distance, exhibits a delay of 227 s. The overall thermal delay of the system reaches 7.5 min. The temperature attenuation of this water system is about 0.2 °C due to heat loss through pipe walls. The findings may offer theoretical support for the optimal regulation and control, fault detection, and anomaly identification of this centralized air-conditioning water system.
1. Introduction
China’s metro has experienced rapid development, and central air-conditioning water systems are typically adopted in metro stations to regulate the internal environment [1,2]. As the carrier of the cooling energy, the pipeline network of a centralized air-conditioning water system exhibits obvious dynamic characteristics that directly affect system efficiency and the matching accuracy of the cooling supply and cooling demand [3,4]. In a long and complex pipeline network in particular, energy transport experiences significant delays due to the limitation of the fluid velocity and the thermal inertia of the pipe material. This delay may cause the cooling source regulation to respond sluggishly and undermine the rigid requirement of real-time load balance [4]. Meanwhile, the heat exchange driven by the temperature difference between the pipe interior and exterior induces an irreversible temperature drop along the pipeline, which is known as the attenuation characteristic of the network. The magnitude of this attenuation is jointly influenced by many factors such as the transport distance, the ambient temperature, and the overall pipe heat-transfer coefficient. If these dynamic behaviors are not accurately assessed, the system may suffer from over-designed capacities, mismatched control strategies, and unnecessary energy waste. Exploration of digital technologies for real-time equipment-state mapping, operational optimization, and energy-consumption management of metro-station air-conditioning systems is therefore of great significance.
On the other hand, the development of digital twin technology provides an effective solution for efficient management and application in engineering projects [5]. Digital twin is a cutting-edge technological concept aimed at creating a virtual representation or model of physical entities in the real world [6]. The concept was first proposed by Grieves [7] and has since been widely applied in aerospace, aviation, and other precision industrial fields [8]. Although some researchers have begun to explore the application of digital twin technology in the HVAC field, its current scope of use remains relatively limited. Most existing studies focus on a single subsystem or specific component, such as digital twin models of pumps [9] or cooling plants [10]. Digital twin technology enables the efficient design and operational supervision of the centralized air-conditioning water systems of metro stations for improving energy efficiency and reducing carbon emissions [11]. Therefore, developing a digital twin-enabled centralized air-conditioning water system can not only enhance the interaction between the digital model and physical environment but also leverage this technology to achieve energy savings and reduce overall energy consumption.
Modelica is a unified modeling language for multi-physics systems. In recent years, commercial software tools such as Dymola (Dymola 2026x) and MWorks (MWORKS 2025b) have been developed based on the Modelica language. In the fields of electronic systems [12,13] and electromechanical systems [14], extensive experiments and applications have been conducted using the Modelica language. These tools support integrated modeling across multiple physical domains and offer efficient simulation and strong cross-domain collaboration capabilities, making them well-suited for simulating thermal and hydraulic behaviors [15]. Over the past two decades, Modelica has also been applied in the building sector, particularly in research related to HVAC systems and energy applications. Appelhaus et al. [16] implemented in Modelica a model describing how fluid dynamics affects residence time distribution in a thin-film evaporator. Owing to Modelica’s modular structure, the approach facilitates the estimation of the influence of system variables and process parameters. Lu et al. [17], in order to evaluate three high-performance HVAC controllers in a VAV cooling system, integrated these controllers with a medium-sized office building model in Modelica. They compared their performance in terms of operational energy efficiency and indoor thermal comfort, thereby investigating the effectiveness of intelligent controllers. Zhu et al. [18] developed a dynamic simulation model of a metro chilled water system using the Dymola/Modelica platform and applied a genetic algorithm optimization implemented in MATLAB (via a Python (Python 3.14.2) interface). System-level energy consumption was simulated in Dymola, while MATLAB (R2025b)-GA was used to optimize chiller sequencing, pump flow rates, and temperature setpoints, enabling a comparative evaluation of four control strategies. Liu et al. [19] built a leakage-simulation hydraulic model of an air-conditioning chilled water system using the Dymola/Modelica platform and developed a two-stage leakage-fault diagnosis method based on an Adam-optimized BP neural network implemented in Python. Leakage scenarios were generated through Dymola simulation, and the improved neural network model was then used to identify the leaking pipe section and pinpoint the exact leakage location, enabling high-accuracy leakage diagnosis for ACWS pipe networks.
For large-scale pipe network systems, many researchers have conducted related studies on simulation and prediction. Cox et al. [20] developed an ice storage system on the energy station side using the Jmodelica (JModelica 2.14) [21] platform and formulated demand–response control strategies under time-of-use and real-time electricity pricing. Tang et al. [22] considered the thermal storage characteristics of the pipeline network and optimized the chiller operation strategy for the early start-up of building cooling systems in summer. Ali et al. [23] used Modelica to build a dynamic system model, which was coupled with the GenOpt optimization program through Dymola dynamic modeling to determine the optimal configuration of chilled water system equipment. This optimal configuration may reduce system energy consumption by 17–43%. Tian et al. [24] integrated an HVAC system model with multi-zone airflow and CFD simulations, addressing the gap in airflow representation between multi-zone models and CFD analysis. Hinkelman et al. [25] used Modelica’s graphical modeling capabilities to develop a real campus district cooling model, and by implementing different energy-saving measures, achieved an annual electricity cost reduction of 8.9% for the campus.
The modeling of large-scale pipe network systems by considering the thermal process, hydraulic process, and control simultaneously is a typical multiple domain physical modeling process. Conventionally, TRNSYS provides HVAC component models that focus mainly on thermodynamic characteristics while neglecting hydraulic behavior; therefore, if TRNSYS is to be used, the required modules must be custom-developed [26,27]. FloMaster is widely used for modeling pipe network topology and is commonly applied to simulate complex real-world piping systems. However, its components are primarily based on pressure–flow relationships, which often overlook the influence of thermodynamic characteristics on hydraulic behavior [28]. Similarly, IDA ICE (Indoor Climate and Energy), as a building performance simulation platform developed on the basis of the IDA methodology, is highly mature in building energy analysis, indoor thermal environment assessment, and system-level control strategy studies [29,30]. However, its pipe network models typically rely on simplified hydraulic descriptions or quasi-steady assumptions and thus remain limited in their ability to accurately capture transient thermohydraulic coupling processes in complex piping systems. Therefore, when studying the hydraulic and thermal characteristics of large-scale pipeline networks, it is not appropriate to use the aforementioned simulation software. In contrast, the Modelica language is based on multi-domain physical modeling, allowing simultaneous representation of both hydraulic and thermodynamic characteristics in large-scale pipeline networks, thereby avoiding the need to develop intermediate modules. Modelica can automatically transform complex pipeline network topologies involving thermal processes and hydraulic processes, etc., into systems of differential-algebraic equations (DAEs) and solve their transient responses using numerical algorithms. This capability provides a high-fidelity simulation foundation for the development of digital twins, energy-efficiency optimization, and real-time control of complex pipe network systems.
In this study, a digital twin model of the centralized air-conditioning water system of a metro station with a complex pipe network is developed for evaluating the thermal delay and thermal attenuation characteristics of this water system. This digital twin model is established on the MWorks platform using the Modelica modeling language and a noncausal modeling approach. This modeling paradigm directly describes physical laws such as mass conservation, energy transfer, and heat conduction by capturing their dynamic characteristics. It supports bidirectional dynamic interaction and multi-domain coupling. The model is validated by using field measurements. Based on this validated model, the thermal delay and thermal attenuation characteristics of this centralized air-conditioning water system with a complex pipe network are evaluated and analyzed. The main objective of this study is to develop and validate a digital twin model of a centralized air-conditioning water system with a complex pipeline network. Based on the validated digital twin model, the thermal delay and attenuation characteristics of the system are systematically evaluated and analyzed, providing a scientific basis for system optimization and control. In addition, the development of the digital twin model using MWorks in a multi-domain physical modeling environment offers a methodological reference for the simulation and analysis of other water systems.
There is no existing literature to present the evaluation of thermal delay and thermal attenuation simultaneously since the thermal process and hydraulic process need to be simulated simultaneously, while there are no appropriate simulation tools such as TRNSYS and FloMaster. This study develops the water system digital twin model in MWorks, a multi-physics modeling environment based on the Modelica language. This model allows simultaneous representation of both hydraulic and thermodynamic characteristics in large-scale pipe networks, thereby avoiding the need to develop intermediate modules. The main contribution of this study is to evaluate the thermal delay and thermal attenuation characteristics of a complex water system in a multi-physics modeling environment, and this study provides a methodological reference for the simulation and analysis of other types of water systems. The technical roadmap of this paper is shown in Figure 1.
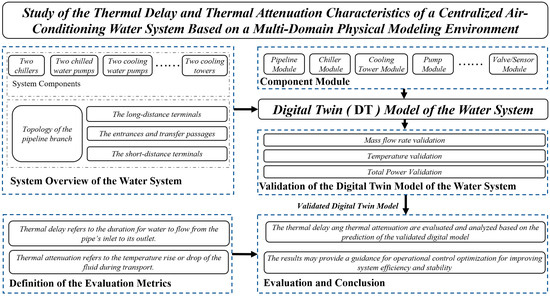
Figure 1.
The technical roadmap of this paper.
2. Thermal Delay and Thermal Attenuation
This time lag stems from factors such as pipe length, fluid inertia, and frictional resistance. Since the medium connected to the source is separated by a significant distance, it reaches the delivery end only after a certain time delay during the heating or cooling transfer process. Notably, pressure changes can be considered nearly instantaneous, so the pressure delay within the pipeline network is generally not taken into account. The thermal delay of a pipe refers to the duration for water to flow from the pipe’s inlet to its outlet as shown in Equation (1), which describes the delay characteristics of an individual pipe section. The thermal attenuation of a pipeline network is represented by the temperature rise or drop of the fluid during transport, which is reflected in the temperature difference between the pipe inlet and its outlet. This phenomenon occurs due to the heat exchange driven by the temperature difference between the fluid inside the pipe and its ambient environment. Even with insulation measures in place, the fluid still undergoes irreversible heat transfer through the pipe wall to the ambient environment (air or soil) during transport. Equation (2) describes the thermal attenuation of an individual pipe section.
where tout is the time when the water flows out of the individual pipe (s); tin is the time when the water flows into the individual pipe (s); L is the pipe length (m); mflow is the flow rate (m3/s); dh is the pipe diameter (m); ρ is the fluid density (kg/m3); Tout is the temperature of the fluid flowing out of the individual pipe (°C); Tin is the temperature of the fluid flowing into the individual pipe (°C); Tb is the temperature of the external ambient medium around the pipe (°C); C is the thermal capacity of the pipe per unit length (J/(m·°C)); and R is the thermal resistance of the pipe ((m·°C)/W).
Equations (1) and (2) describe the thermal delay and thermal attenuation characteristics of the fluid transport within an individual pipe section, respectively. For evaluating the thermal delay and thermal attenuation of a complex water pipe network, a digital twin model of the water system is necessary for considering the thermal transfer process and hydraulic process. For each individual pipe, a pipe module is used by simply inputting a set of parameters, i.e., pipe diameter (dh), pipe length (L), thermal conductivity of the insulation material, insulation thickness, and ambient temperature. In the digital twin model of the water system, equations for fluid flow rate, pipe wall heat capacity, and environmental heat dissipation of all the pipe sections can be integrated, and thereby the combined effects of the thermal delay and thermal attenuation can be quantified.
3. System Overview
This study focuses on the centralized air-conditioning water system of a subway station in Wuhan serving specialized functional areas such as some equipment rooms. The station is an underground two-level island-type station, with multiple entrances, exits, and transfer passages connecting the concourse and platforms. The total design load of the system is about 700 kW, which includes the calculated cooling load for the equipment management rooms as well as the entrances, exits, and transfer passages. This system is equipped with two screw chillers, two chilled water pumps, two cooling water pumps, and two cooling towers. Each chiller has a cooling capacity of 387 kW, a power consumption of 71 kW, an evaporator flow rate of 66.6 m3/h, and a condenser flow rate of 79 m3/h. Each cooling tower has a water flow rate of 100 m3/h and a fan power of 3.0 kW. The rated power of each pump is 15 kW. The design flow rates of the chilled water pump and cooling water pump are 67 m3/h and 90 m3/h with heads of 36 mH2O and 33 mH2O, respectively.
The chilled water from the central air-conditioning plant is distributed via a manifold to three areas: the long-distance terminals, the entrances and transfer passages, and the short-distance terminals. The short-distance terminal branch supplies the air-handling unit, K1, for conditioning all the A-end equipment management rooms. The long-distance terminal branch supplies two air-handling units, i.e., K2 and K3, for conditioning the B-end equipment management rooms. Fan coil units are installed at the entrances, exits, and transfer passages.
The schematic topology of the system pipeline network is shown in Figure 2, where the pipeline routes, diameters, and lengths of the three branches downstream of the manifold are roughly shown. The far end of the system is supplied by the long-distance terminal branch, while the near end is supplied by the short-distance terminal branch. In this centralized air-conditioning water system, the total pipeline length from the chiller to the far end of the long-distance terminal is approximately 450 m, and the extra-long pipeline network is shown to have a significant impact on thermal performance during both the design and operation of the system. Solid lines indicate the supply piping for each branch, while dashed lines indicate the return piping for each branch.
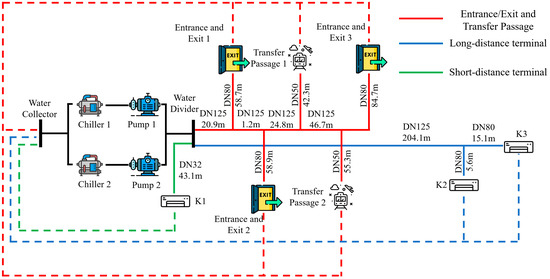
Figure 2.
The topology of the chilled water piping network.
The design load includes a portion of reserved capacity. Therefore, for actual operation, the cooling demand of the system is lower than the design capacity, and generally only one chiller needs to be in operation to meet the system’s cooling demand. The cooling season is from June 1 to October 1. For the remaining period, this system is not operated. During operation, the chillers, pumps, and cooling towers are controlled in an integrated start–stop sequence. The chiller outlet water temperature is set at 9 °C. One chiller dedicated to one chilled water pump, one cooling water pump, and one cooling tower is operated with the pumps and the cooling tower running at a fixed frequency of 45 Hz. This system is equipped with a centralized energy management and control system. Operation data collected by the centralized system mainly include the temperature and pressure of the supply and return mains, flow rates, valve openings and supply air temperatures at each equipment terminal, the start–stop frequency of the chiller, and the operating frequency of the pumps and fans. Environmental parameters such as temperature and humidity inside and outside the station are also recorded.
4. Development of a Digital Twin Model of the Water System
Digital twin was developed in 2002 by Michael Grieves, and a more detailed and widely recognized research definition is given by Glaessgen, Stargel (2012) [31]: “digital twin is an integrated multi-physics, multi-scale, probabilistic simulation of a complex product and uses the best available physical models, sensor updates, etc., to mirror the life of its corresponding twin”. Based on technical maturity, functional completeness, and application depth, a digital twin (DT) may be classified into three development stages. The premilitary stage is the digital mapping or basic simulation stage; the main objective is to achieve a geometric and data mirroring of physical entities such as the 3D structural model of a building. The intermediate stage is the digital simulation or analysis and optimization stage; its core objective is to endow the model with dynamic simulation and decision support capabilities, such as the simulation of a building’s HVAC system for energy or control analysis [32]. The advanced stage is the digital twin entity or autonomous interaction stage; it can realize bidirectional closed-loop interactions between physical entities and digital models. These three stages are also referred to as the digital model, digital shadow, and digital twin [33]. In this study, the digital twin model of the centralized air-conditioning water system is developed based on the field pipeline topology as well as the real configuration of the chillers, pumps, and terminals. It is also validated by using real system operation data although it is not related to the real system and may be referred to as the digital shadow.
The digital twin model of the centralized air-conditioning water system (the water system) has many digital twin modules, and all of these should be developed in advance. Each module requires a mathematical model. Based on the mathematical equations, the module is programmed to construct the relevant parameters, variables, and equations in MWorks (MWORKS 2025b, China) with the Modelica language. The equations written have no sequential order during the solution process. Once constructed, interfaces are added to the module so that it can be organically connected with other modules facilitating the construction of the digital twin model of the centralized air-conditioning water system. This section briefs the development process of digital twin modules and the MWorks modeling method. Thereafter, the digital twin modules of the pipeline and chiller are presented as examples to illustrate the modeling process, also including the validation of the digital twin chiller module.
4.1. Introduction to the Digital Twin Module and the Development Process
The centralized air-conditioning water system is a coupled system in which components mutually influence each other. The digital twin model of the centralized air-conditioning water system includes modules of various equipment and components. When developing this digital twin model, it is necessary not only to simulate the thermal characteristics of the system but also its hydraulic characteristics. First, digital twin modules for each piece of equipment and component must be established based on the underlying model principles and validated. These modules are then organically connected to form the digital twin model of the entire system. The digital twin modules simulate the characteristics of equipment or components to verify the accuracy and validity of each module. The validation of a certain module is performed to check whether the module outputs match those of the actual physical object to ensure that the simulation requirements are met. This prevents errors or incorrect parameters in individual digital twin modules propagating from upstream to downstream equipment when the modules are combined into the final model, which could affect the accuracy of the overall system model.
The digital twin model of the centralized air-conditioning water system mainly includes modules of chillers, cooling towers, pumps, pipes, terminal equipment, valves, temperature sensors, pressure sensors, flow sensors, and other auxiliary components. In this study, the cooling tower module is developed by using the YorkCalc calculation method [34], which analyzes the heat dissipation performance of the cooling tower under different air and cooling water flow rates. It describes the impact of these parameters on heat dissipation performance under off-design conditions based on empirical calculation formulas. The pump module determines the operating head and power of the pump by fitting the flow-head and flow-power curves [35]. The chiller uses a chiller model based on DOE-2.1 [36]. The module of the terminal equipment is developed by directly using simple heat transfer equations to calculate the outlet temperature of the equipment based on the load, inlet temperature, and flow rate. In the following section, as an example to illustrated the modeling process, the development of the digital twin modules of the pipeline and chiller are presented, and the validation of the digital twin chiller module is also included.
4.2. Modelica Language and MWorks Modeling Method
In the field of engineering system modeling, the Modelica language offers two typical paradigms: causal block-diagram modeling and acausal physical modeling. Causal block-diagram modeling decomposes a system into representations of known and unknown variables. A block diagram consists of multiple components, and each component computes the unknown quantities based on the known ones. Acausal physical modeling uses conservation laws to describe the behavior and performance of a system or component, without explicitly defining system inputs and outputs. The complete set of system equations is obtained by combining the constitutive equations of the components with the conservation equations.
In this study, an acausal modeling approach based on conservation laws is adopted to construct the digital twin modules of the centralized air-conditioning water system on the MWorks simulation platform, which is developed using the Modelica language. This method is driven by physical principles and is particularly suitable for the simulation and analysis of complex fluid networks (i.e., the water system). To construct an acausal model, it is necessary to identify the “flow variables” and “potential variables” of the system being modeled. “Potential variables” represent the driving forces of a system while “flow variables” represent the flow induced by those potentials. For example, in electrical systems, voltage (V) is the potential variable and current (I) is the flow variable; in heat transfer, temperature (K) is the potential variable and heat flow (W) is the flow variable; and in fluid flow, pressure (P) is the potential variable and mass flow rate (kg/s) is the flow variable. Flow variables are defined using the flow keyword and represent conserved quantities, such as electric current or heat flow. When connected, all flow variables at the connected ports follow the conservation law, with their algebraic sum equal to zero. Potential variables are generally defined using the stream keyword and represent the driving force of the flow such as pressure or temperature. When connected, the potential variables at the connected ports are equal.
To achieve the physical interconnection of fluid components, a dedicated fluid connector, FluidPort, is used. Its core includes three types of variables: potential variables, flow variables, and flow property variables. Its potential variable, pressure, represents the driving force of the flow. When connected, all port potential variables are automatically equal, directly reflecting the physical constraint of pressure balance. The mass flow in the flow variables is defined using the flow keyword, representing a conserved extensive quantity. When connected, the algebraic sum of all port flow variables is zero, strictly satisfying the law of mass conservation. Flow property variables, such as specific enthalpy, represent intensive quantities related to the direction of transfer and flow. They are effective only when the fluid flows out, ensuring the directionality of energy and component transfer. This design allows component interfaces to inherently incorporate physical conservation laws. For example, when three pipes converge, the compiler automatically generates mass flow conservation and pressure balance equations, significantly reducing modeling complexity. Using the potential variable (pressure) and flow variable (mass flow) of the fluid connector, the pressure balance equations and flow conservation constraints at network nodes can be automatically generated.
4.3. Development of the Pipeline Module
The digital twin pipeline module needs to be able to describe the thermal delay, thermal attenuation (i.e., temperature attenuation), and energy storage (cooling capacity) characteristics of the water flowing inside the centralized air-conditioning water pipe network. Constructing the mathematical model of the pipe involves establishing equations that reflect these three dynamic characteristics, thereby forming the dynamic module of the pipeline. This study adopts a thermohydraulic pipe model based on dynamic equations [37,38]. The flow and heat transfer characteristics of the fluid are described using mathematical equations derived from the Reynolds transport theorem. For long pipelines, temperature variations are mainly governed by radial heat losses to the environment. The gradient of the pipe temperature along the pipeline is very small, and the effects of axial heat conduction and frictional heating on the temperature field can be neglected. This point is also presented in the Refs. [37,38]. Therefore, the above assumptions are adopted in this study to simplify the model and facilitate a more efficient analysis of the results. The axial heat conduction and viscous dissipation due to frictional pressure losses are neglected. The flow equations of the pipeline are simplified based on the following assumptions: (1) The pipe is assumed to be made of homogeneous material with a uniform wall temperature and a uniform temperature distribution along the pipe diameter. Axial heat conduction in the pipe wall is neglected, and the pipe wall is assumed to be a constant-temperature boundary; (2) The insulation layer is assumed to be homogeneous, and variations in the pipe heat transfer coefficient along the radial direction are not considered; (3) Pipe friction generates heat which is neglected since its impact on the system is small.
The energy transfer through the pipeline and the associated heat loss to the ambient environment are caused by the combination of the energy and continuity equations with internal energy. Minor influencing factors, such as thermal diffusion, pressure loss, and pipe friction, are neglected in the energy equation. The internal energy is expressed as a function of the axial position x and time t in the pipeline as shown in Equation (3). By changing the partial differential on the left-hand side of Equation (3) to a total differential, Equation (4) is obtained. Integrating both sides then yields Equation (5). Rearranging gives Equation (6), which can be used to calculate the outlet temperature of the pipeline module based on the inlet temperature and determine the heat loss within the pipeline module. The thermal capacity and thermal resistance of the pipeline are calculated as shown in Equations (7) and (8).
where ρ is the fluid density (kg/m3); cv is the specific heat capacity of the fluid (J/(kg·K)); A is the cross-sectional area of the pipe (the water flow area) (m2); v is the fluid velocity (m/s); qe is the heat exchange between the system interior and the pipe wall representing the system heat source; klns is the thermal conductivity of the insulation layer (W/(m·°C)); dlns is the thickness of the insulation layer (m); and dh is the pipe diameter (m).
Based on the above mathematical model, the digital twin pipeline module can be developed in the MWorks platform. The module icon is shown in Figure 3: the fluid medium passes through the blue port, flows through the pipe model, and exits via the white port; the red port connects to the ambient environment to simulate heat exchange between the pipeline and its surroundings. The module parameters are listed in Table 1.
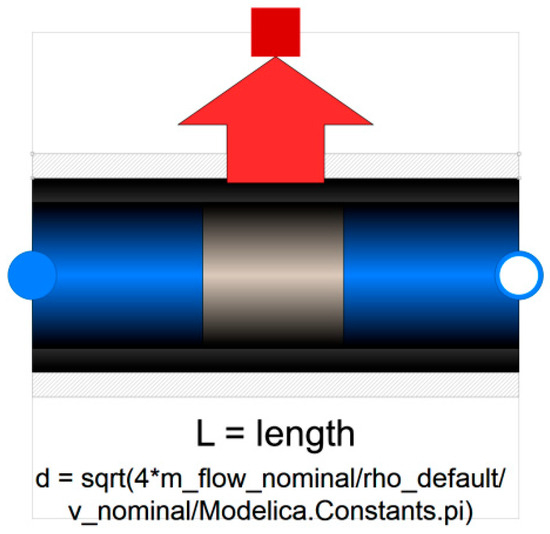
Figure 3.
The icon of the digital twin pipeline module.

Table 1.
Module parameters of the digital twin pipeline module.
4.4. Development and Validation of the Chiller Module
The digital twin chiller module captures both the hydraulic resistance characteristics and thermodynamic characteristics. The thermodynamic model is formulated using the capacity multiplier of the chiller, CAPFT (i.e., maximum capacity or cooling capacity), the full-load efficiency, EIRFT, and the part-load efficiency, EIRPLR, together with the temperature curves of the evaporator and condenser as shown in Equations (9)–(13). The part-load ratio, PLR, and chiller power consumption, Pchi, are computed using Equations (12) and (13).
where Qavail is the cooling load that the chiller is required to meet (W); Qref is the reference cooling capacity of the chiller (W); Pchiref is the reference power of the chiller (W); Tchw,out is the chilled water outlet temperature (°C); Tcw,out is the cooling water outlet temperature (°C); [a1, a2, a3, a4, a5, a6] are the polynomial coefficients of the chiller’s available capacity factor; [b1, b2, b3, b4, b5, b6] are the polynomial coefficients of the chiller’s full-load efficiency; and [c1, c2, c3, c4, c5, c6, c7] are the polynomial coefficients of the chiller’s part-load efficiency.
Based on the above mathematical model, the digital twin chiller module can be developed in the MWorks platform. The module icon is shown in Figure 4, and the model parameters are listed in Table 2.
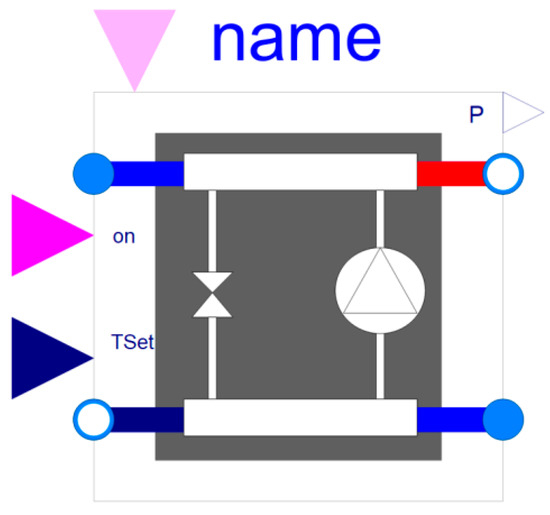
Figure 4.
The icon of the digital twin chiller module.
Table 2.
The module parameters of the digital twin chiller module.
The chiller module requires the input of the load ratio limits, reference cooling capacity and reference COP, and the polynomial coefficients of three performance curves. It also requires the inlet and outlet temperatures and flow rates on both the condenser and evaporator sides. The load ratio limits are used to control the maximum and minimum cooling capacity of the chiller, while the reference cooling capacity and reference COP are used to calculate the reference power. The polynomial coefficients of the three curves are obtained by the least-squares fitting of the full-load and part-load data. Limiting the inlet and outlet temperatures and flow rates on the condenser and evaporator sides prevents the model results from exceeding realistic ranges. On-site measured data are used as input to simulate the digital twin chiller module to validate the performance of the chiller thermal characteristic model.
This study identifies the parameters of the chiller mathematical model based on on-site measured data. For existing systems, the performance of the chiller has typically degraded compared to its original factory specifications, and the actual cooling capacity is generally lower than the design value. Using actual full-load data, the current cooling capacity and instantaneous power were averaged to serve as reference data. Based on the analysis of operational data, the selected reference cooling capacity of the chiller is 317 kW, with a reference power of 60 kW. The accuracy of parameter calibration and validation data was verified through simulation results, as shown in Figure 5. The Pearson correlation coefficient (i.e., PCC) of the chiller mathematical model exceeds 0.766, indicating that the simulation results show good trends and agreement with the actual values. The results also show that the normalized mean bias error (i.e., NMBE) is generally within 5%, and the average absolute error of power is small. Simulation of the chiller module demonstrates that the fitted curve parameters can accurately predict the performance of the chiller.
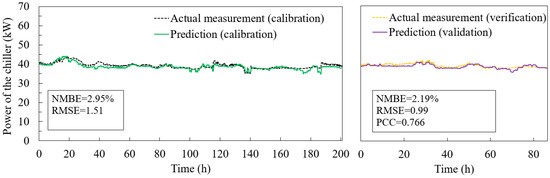
Figure 5.
Validation of the chiller mathematical module.
4.5. Digital Twin Model of the Water System
The individual digital twin modules of the centralized air-conditioning water system are organically connected to form the digital twin model of the centralized air-conditioning water system as shown in Figure 6. The system mainly consists of the chiller, pumps, piping network, and input data tables. On the right side of the chiller is the chilled water side of the piping network. The solid red lines represent the chilled water supply pipeline, and the solid blue lines represent the chilled water return pipeline. After the fluid (i.e., the water) exchanges heat with the refrigerant in the evaporator, it flows through the supply mains to three branches and then reaches each terminal before finally returning to the evaporator inlet. Each terminal is equipped with a flow control balancing valve to adjust the flow rate. On the left side of the chiller is the cooling water side of the piping network: dashed red lines represent the cooling water supply pipes, and dashed blue lines represent the cooling water return pipes. After exchanging heat with the refrigerant in the condenser, the fluid temperature rises, and it is subsequently cooled by the cooling tower before being pumped back to the condenser. On the indoor side, heat is transferred between the room and outdoor air through the chiller, completing the indoor–outdoor heat transfer process.
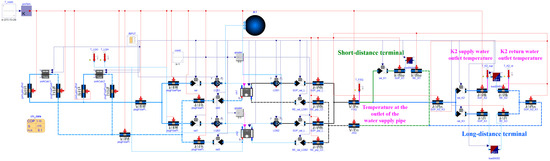
Figure 6.
The digital twin model of the centralized air-conditioning water system of the metro station.
In the figure, the green dashed lines connect the thermal interfaces of the pipeline to the design temperatures of the equipment rooms, which are used to calculate the heat exchange between the pipe insulation layers and pipe environment (Tb). The parameters of each piece of equipment can be modified either through the parameter tables or directly within the components. The input parameter tables include parameters such as the speeds of the pumps and cooling towers, chiller start/stop status and outlet temperature setpoints, valve openings, and the cooling load.
5. Validation of the Digital Twin Model of the Water System
Based on the digital twin model, the hydraulic characteristics of the centralized air-conditioning water system were first validated. In the study and application of hydraulic characteristics, flow rate is a critical parameter. A comparison between the measured and digital twin model-predicted flow rates in the chilled water main pipe and cooling water main pipe is shown in Figure 7. At this time, the pump operating frequency was 45 Hz. The measured average chilled water flow rate is 13.08 kg/s, and the measured cooling water flow rate is 26.12 kg/s. These data were obtained through on-site flow sensors and temperature sensors installed at the corresponding measurement points. The measurement accuracy of the temperature sensor is ±0.2 °C, and that of the flow sensor is ±0.3%. For the chilled water main pipe, the predicted flow rate showed a PCC of 0.995 with the measured values, a normalized mean bias error (i.e., NMBE) of 1.84%, and a root mean square error (i.e., RMSE) of 0.28 kg/s. For the cooling water main pipe, the predicted flow rate had a PCC of 0.999, NMBE of −0.05%, and RMSE of 0.16 kg/s. The hydraulic characteristics of the piping network show very good agreement with the actual measurements, with small errors satisfying the system simulation requirements for hydraulic performance.
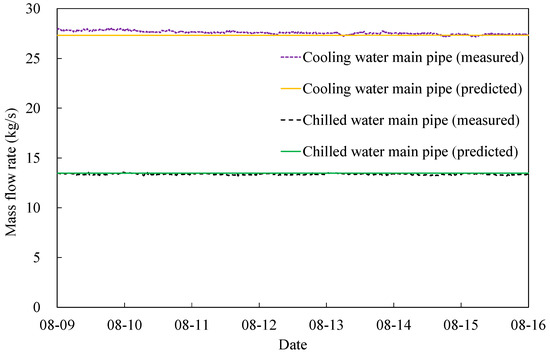
Figure 7.
Comparison of the measured flow rates and digital twin-predicted flow rates.
The comparison between measured and digital twin-predicted supply and return water temperatures in the chilled water main pipe and cooling water main pipe is shown in Figure 8 and Figure 9. In the thermal characteristics of the air-conditioning chilled water system of this digital twin model, temperature is a physical quantity describing the thermal state of the fluid, which critically affects equipment status, energy conversion, and transfer processes. For the chilled water side, the predicted supply temperature has a PCC of 0.664 with the measured values, an NMBE of 0.47%, and an RMSE of 0.3 °C. The predicted return temperature has a PCC of 0.685, NMBE of 3.29%, and RMSE of 0.5 °C. As for the cooling water side, the predicted return temperature has a PCC of 0.993, NMBE of 1%, and RMSE of 0.4 °C, while the predicted supply temperature has a PCC of 0.996, NMBE of 1%, and RMSE of 0.2 °C. The predicted supply and return temperatures on both the chilled water side and cooling water side fluctuate consistently with the measured values, showing a very good correlation.
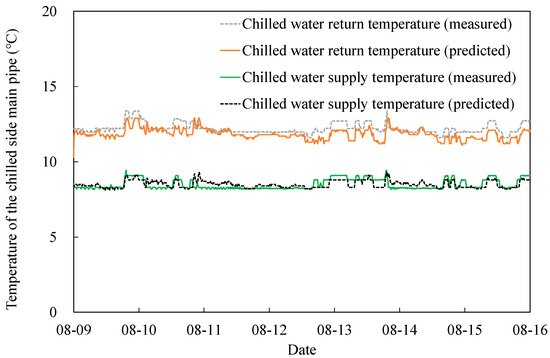
Figure 8.
Comparison of measured water temperature and digital twin-predicted water temperature in the chilled water main pipe.
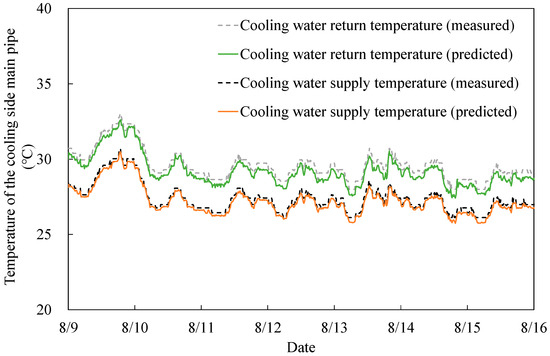
Figure 9.
Comparison of measured water temperature and digital twin-predicted water temperature in the cooling water main pipe.
This study also compared and analyzed the measured total power of the centralized water system and the digital twin-predicted one. The total power of the system includes the power of the chilled water pumps, cooling water pumps, cooling towers, and chillers. The result is shown in Figure 10. The measured power fluctuated steadily between 59.0 kW and 67.7 kW, while the model-predicted values ranged from 55.7 kW to 76.3 kW. The comparison results show a PCC of 0.939, indicating a moderate linear correlation between the predicted and measured power. The RMSE is 2.78 kW, demonstrating a good accuracy for power prediction.
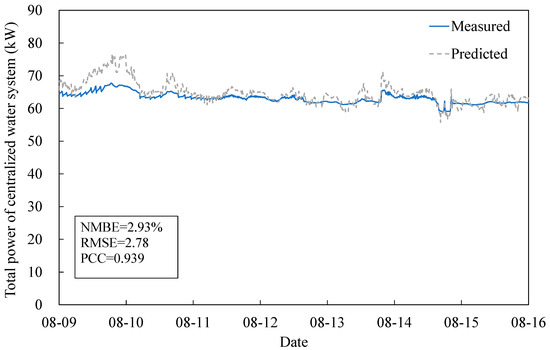
Figure 10.
Comparison of the measured total power of the chilled water system and the predicted value using the digital twin model.
In addition to the model described above including the thermodynamic equations and fluid dynamics modeling, the digital twin model’s virtual space also incorporates three-dimensional visualization of the physical entities and data connections between the two models. The support of virtual–physical mapping technology enhances the 3D visualization, allowing users to more intuitively understand the equipment’s functions and performance and optimize the control of the physical entities. Through data-driven approaches and communication technologies, the physical entities, simulation models (digital twin models), and 3D visualization models can be truly interconnected and interactive.
6. Analysis of the Thermal Delay and Thermal Attenuation Characteristics of the Water System
The centralized air-conditioning water system of a subway station in Wuhan is considered in this study. The digital twin model of this water system is developed in Section 4, Development of a Digital Twin Model of the Water System, and validated in Section 5, Validation of the Digital Twin Model of the Water System. A simulation of this validated digital twin model of the centralized air-conditioning water system was conducted to obtain parameters such as temperature, flow rate, and velocity for each pipe segment in the network. The pump was operated at a frequency of 45 Hz, with only Pump 1 in service. The control valves were adjusted according to their actual openings to ensure that the flow rates at the network terminals matched the measured values. The simulated flow rates at terminals K1, K2, and K3 were 0.65 kg/s, 5.59 kg/s, and 7.56 kg/s, respectively, consistent with their design flow rates. The pipeline network requires an initialization period. To study thermal delay characteristics, a step signal was applied, which raised the chilled water supply temperature from 7 °C to 10 °C at the 20th minute. During the thermal delay analysis, the terminal loads were set to zero.
In the pipeline network, the outlet temperature of each upstream supply segment equals the inlet temperature of the downstream segment. The outlet temperatures of all chilled water system pipe segments were plotted. The outlet temperatures of the supply pipe segments in the network branches are shown in Figure 11, which correspond to the inlet temperatures of the terminal coil units. As shown in this figure, the supply segment of Chilled Water Pump 1 and the supply main responds rapidly. It begins within 10 s. Next to respond are the K1 and K2 supply pipe segments, while the K3 terminal, the farthest from the pump, responds last: the K1 supply pipe begins to respond after 74 s from 7.2 °C, with the inlet temperature stabilizing at 10.2 °C; the K2 supply pipe starts to respond after 216 s from 7.2 °C, stabilizing at 10.2 °C at the inlet; and the K3 supply pipe responds after 227 s from 7.2 °C, with the supply temperature eventually stabilizing at 10.2 °C.
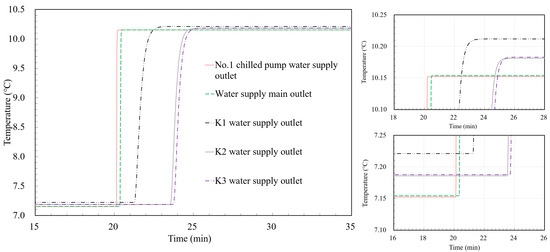
Figure 11.
Outlet temperature of the chilled water supply pipe segments.
The outlet temperatures of the return pipe segments in the network are shown in Figure 12, which correspond to the inlet temperatures of the return mains or collectors. The outlet temperature trends of the return pipes are generally consistent with those of the supply pipes: for the K1 return pipe, the outlet begins to respond after 127 s from 7.3 °C, stabilizing at 10.3 °C before entering the return main; the K2 return pipe starts to respond after 220 s from 7.2 °C, with the temperature stabilizing at 10.2 °C at the inlet to the return main; and the K3 return pipe responds after 242 s from 7.2 °C, stabilizing at 10.2 °C before entering the return main. Since terminal K1 is closest to the return main, the return main begins to respond at 142 s after the K1 return pipe starts to respond. The water in the return main that has not yet warmed mixes with the already warmed water from the K1 terminal. After the more distant terminals contribute their return flow, the temperature in the return main rises to a stable value. The outlet of Pump 1’s return pipe (i.e., the chiller inlet) responds about 8 s later than the return main.
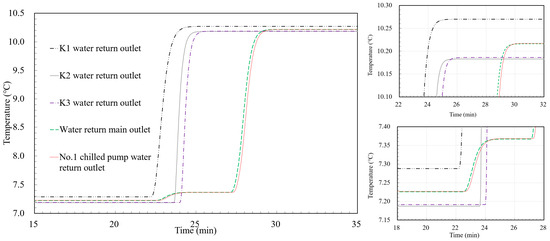
Figure 12.
Outlet temperature of the chilled water return pipe segments.
Based on the outlet temperature response times of the pipe segments, it can be seen that the order in which the pipe segments respond is closely related to the structural topology of the pipeline network. The closer a pipe is to the source, the earlier it responds, with the temperature rising after a certain delay. The start time of each pipe segment’s response is calculated by cumulatively summing the delay time in Equation (1), which corresponds to the flow time of the water through the pipe segment. For the entire pipeline network, the farthest terminal, K3, takes 227 s to respond to the chilled water supplied by the chiller. At the present flow rate, it takes 455 s, approximately 7.5 min, for the water to complete one circulation through the entire pipeline network. Since the present flow rate matches the design flow rate, one full loop through the pipeline network takes about 7.5 min.
The stabilized temperatures at all terminals are slightly higher than the supply temperature of the main pipe of 7 °C. This is due to during the 20 min before the step signal change, the water in the pipeline network experienced heat loss to the surrounding environment of 29 °C through the pipe insulation, which causes the water temperature inside the pipeline to be noticeably higher than 7 °C, approximately 7.2 °C. Therefore, for long-term operation, the actual supply temperature reaching the terminals will rise, resulting in obviously reduced cooling quality when the pipe insulation is not effective. The larger the network and the longer the pipeline, the more pronounced the cooling quality reduction or energy waste. When the step signal rises to 10 °C 20 min later, the terminal supply temperatures stabilize at 10.2 °C, meaning that the temperature rise at the terminals is still 0.2 °C. This indicates a temperature decay of approximately 0.2 °C. Based on the above analysis, thermal delay is caused by the pipe length of large-scale networks and the flow velocity of the fluid within the pipelines, whereas thermal attenuation results from the insulation material and insulation thickness of the pipelines.
7. Conclusions
Thermal delay and thermal attenuation are fundamental hydraulic–thermal behaviors in large air-conditioning water systems, especially in metro-station centralized water networks where long pipelines and complex topologies make transient responses difficult to capture. These characteristics directly influence the timing, stability, and efficiency of cooling-capacity delivery. With the continuous advancement of digital twin technologies, it has become possible to evaluate such dynamic behaviors with higher precision and real-time insight. By integrating measurement data, physical modeling, and data–model fusion, digital twins offer a powerful platform for revealing the mechanisms behind thermal transport, enabling a more transparent and interpretable analysis of system dynamics in actual engineering scenarios.
MWorks is used in this study as the simulation platform and applied to construct a digital twin model of the air-conditioning centralized water system of a metro station integrating thermodynamics and fluid dynamics, which is based on the configuration and operation of the centralized water system and the distributed system control architecture. Model validation against measured operational data demonstrates high accuracy. Validation results indicate that the root mean square error (i.e., RMSE) between the predicted and measured chilled water flow rates in the main pipe is 0.27 kg/s; the root mean square error (i.e., RMSE) for supply temperature is 0.3 °C; and the root mean square error (i.e., RMSE) for return temperature is 0.5 °C. The NMBE between the predicted and measured total system power is only 0.78%, showing good agreement between predictions and actual operation. These results show that the constructed digital twin model successfully replicates the real system’s physical and operational characteristics, providing a reliable basis for further dynamic analysis.
Based on the validated digital twin model, the thermal delay and thermal attenuation characteristics of the air-conditioning centralized water system are evaluated in detail. The results show the thermal delay and thermal attenuation characteristics of the centralized water network are determined by the pipeline network topology. In this study, the terminal K1 responds after 74 s, K2 responds after 216 s, and the farthest terminal, K3, responds last at 227 s. The total pipeline network thermal delay is approximately 7.5 min, and the thermal attenuation in the pipeline network is about 0.2 °C. These quantitative findings may benefit the practical implications of control strategies, fault detection, or energy savings. Take branch K3 as an example, which represents the farthest circuit in this system: it takes approximately 5 min for the chilled water discharged from the chiller to reach the inlet of the terminal. To achieve more precise control, especially during the morning start-up phase, the chiller should be activated at least 5 min in advance to satisfy the operational requirements of the farthest terminal when compared to the original operation schedule. On the other hand, every terminal exhibits a relative time delay in response to the chilled water temperature supplied by the chiller. Therefore, this thermal delay should be incorporated into the actual control strategy, particularly in predictive control schemes, to optimize control performance. Regarding the fault detection and diagnosis of the pipe network, the temperature difference between the inlet and outlet of a given pipe segment is monitored and then compared with the predicted thermal attenuation by using the digital twin model. This method enables a straightforward assessment of whether the pipe insulation has deteriorated or become damp, both of which directly increase heat loss.
Compared with traditional modeling methods, this study introduces the core concept of digital twins by establishing a unified linkage and collaborative analysis between the physical model and the simulation model using the Modelica language within the MWorks software environment. Although a complete three-dimensional visualization platform has not yet been developed, and full-process interconnection between the physical space, virtual space, and data space has not been achieved, this digital twin-oriented modeling framework lays a foundation for the future realization of multi-dimensional interaction, real-time mapping, and deep integration. The development of this digital twin model of the water system using MWorks software may offer a methodological reference for the simulation and analysis of other types of water systems.
Author Contributions
Conceptualization, X.X., J.X., Q.Z. and J.D.; methodology, X.X., J.X., Q.Z. and J.D.; software, X.S. and X.Z.; validation, X.S. and X.Z.; formal analysis, X.S.; investigation, X.S.; resources, X.Z.; data curation, X.Z.; writing—original draft preparation, X.S. and X.Z.; writing—review and editing, X.X., J.X., Q.Z. and J.D.; visualization, X.S. and X.Z.; supervision, X.X., J.X., Q.Z. and J.D.; project administration, X.X., J.X., Q.Z. and J.D.; funding acquisition, X.X., J.X., Q.Z. and J.D. All authors have read and agreed to the published version of the manuscript.
Funding
This work was supported by the Key R&D Project of Hubei Provincial Science and Technology Plan (2025BCB033) and the CITIC Limited (Grant No. 2022ZXKYD30100).
Data Availability Statement
Data will be made available on request.
Conflicts of Interest
The authors declare no conflict of interest.
References
- Wei, Z.; Hu, Y.; Chen, Y.; Wang, T. Optimized Design of Cultural Space in Wuhan Metro: Analysis and Reflection Based on Multi-Source Data. Buildings 2025, 15, 2201. [Google Scholar] [CrossRef]
- Shu, X.; Dong, Y.; Liu, J.; Xu, X. Study of the Optimal Control of the Central Air Conditioning Cooling Water System for a Deep Subway Station in Chongqing. Buildings 2025, 15, 8. [Google Scholar] [CrossRef]
- Wang, W.; Yang, L.; Wang, L.; Zhang, P.; Huang, J.; Wang, K. Optimal Dispatch of Integrated Electricity-Heat Energy System Considering Heat Storage Characteristics of Heating Network. Dianli Xitong Zidonghua/Autom. Electr. Power Syst. 2018, 42, 45–52. [Google Scholar]
- Gu, W.; Lu, S.; Wang, J.; Xiang, Y.; Zhang, C.; Wang, Z. Modeling of the Heating Network for Multi-district Integrated Energy System and Its Operation Optimization. Proc. CSEE 2017, 37, 1305–1315. [Google Scholar]
- Loureiro, T.; Jiménez Argumosa, P.; Aggeli, A.; Arniani, M.; Blanke, J.; Barrios, B. Energy communities: Engaging people and technologies in the future of energy. Open Res. Eur. 2022, 2, 137. [Google Scholar] [CrossRef] [PubMed]
- Zsidai, B.; Hilkert, A.S.; Kaarre, J.; Narup, E.; Senorski, E.H.; Grassi, A.; Ley, C.; Longo, U.G.; Herbst, E.; Hirschmann, M.T.; et al. A practical guide to the implementation of AI in orthopaedic research—Part 1: Opportunities in clinical application and overcoming existing challenges. J. Exp. Orthop. 2023, 10, 117. [Google Scholar] [CrossRef]
- Grieves, M. Digital Twin: Manufacturing Excellence through Virtual Factory Replication. White Pap. 2015, 1, 1–7. [Google Scholar]
- Tuegel, E.J.; Ingraffea, A.R.; Eason, T.G.; Spottswood, S.M. Reengineering Aircraft Structural Life Prediction Using a Digital Twin. Int. J. Aerosp. Eng. 2011, 2011, 1687–5966. [Google Scholar] [CrossRef]
- Yang, B.; Yang, S.; Lv, Z.; Wang, F.; Olofsson, T. Application of Digital Twins and Metaverse in the Field of Fluid Machinery Pumps and Fans: A Review. Sensors 2022, 22, 9294. [Google Scholar] [CrossRef]
- Alves de Araujo Junior, C.A.; Mauricio Villanueva, J.M.; Almeida, R.J.S.d.; Azevedo de Medeiros, I.E. Digital Twins of the Water Cooling System in a Power Plant Based on Fuzzy Logic. Sensors 2021, 21, 6737. [Google Scholar] [CrossRef]
- Kuang, Y.; Fan, Y.; Bin, J.; Fan, M. Impact of the digital economy on carbon dioxide emissions in resource-based cities. Sci. Rep. 2024, 14, 16514. [Google Scholar] [CrossRef]
- Gravelle, A.; Robinson, S.; Picarelli, A. Modeling the Effects of Energy Efficient Glazing on Cabin Thermal Energy and Vehicle Efficiency. In Proceedings of the 11th International Modelica Conference, Versailles, France, 21–23 September 2015. [Google Scholar]
- Winter, M.; Moser, S.; Schoenewolf, S.; Taube, J.; Herzog, H. Average Model of a Synchronous Half-Bridge DC/DC Converter Considering Losses and Dynamics. In Proceedings of the 11th International Modelica Conference, Versailles, France, 21–23 September 2015. [Google Scholar]
- Tilly, A.; Johnsson, V.; Sten, J.; Perlman, A.; Akesson, J. Optimica Testing Toolkit: A Tool-Agnostic Testing Framework for Modelica Models. In Proceedings of the 11th International Modelica Conference, Versailles, France, 21–23 September 2015. [Google Scholar]
- Pourarian, S.; Kearsley, A.; Wen, J.; Pertzborn, A. Efficient and robust optimization for building energy simulation. Energy Build. 2016, 122, 53–62. [Google Scholar] [CrossRef] [PubMed]
- Appelhaus, D.; Jasch, K.; Jahnke, S.; Bin, H.; Tegethoof, W.; Kohler, J.; Scholl, S. A new approach to simulate the fluid dynamics in a wiped film evaporator using Modelica. Chem. Eng. Res. Des. 2020, 161, 115–124. [Google Scholar] [CrossRef]
- Lu, X.; Fu, Y.; O’neill, Z. Benchmarking high performance HVAC Rule-Based controls with advanced intelligent Controllers: A case study in a Multi-Zone system in Modelica. Energy Build. 2023, 284, 112854. [Google Scholar] [CrossRef]
- Zhu, Y.; Luo, Y.; Wang, D.; Luo, H.; Zhong, X.; Qin, X.; Zhu, H. Optimizing Subway HVAC Control Strategies for Energy Savings Using Dymola Simulation. Buildings 2025, 15, 3064. [Google Scholar] [CrossRef]
- Liu, R.; Zhang, Y.; Li, Z. Leakage Diagnosis of Air Conditioning Water System Networks Based on an Improved BP Neural Network Algorithm. Buildings 2022, 12, 610. [Google Scholar] [CrossRef]
- Cox, S.; Kim, D.; Cho, H.; Mago, P. Real time optimal control of district cooling system with thermal energy storage using neural networks. Appl. Energy 2019, 238, 466–480. [Google Scholar] [CrossRef]
- Åkesson, J.; Årzén, K.; Gäfvert, M.; Bergdahl, T.; Tummescheit, H. Modeling and optimization with Optimica and JModelica.org—Languages and tools for solving large-scale dynamic optimization problems. Comput. Chem. Eng. 2009, 34, 1737–1749. [Google Scholar] [CrossRef]
- Tang, R.; Wang, S.; Shan, K.; Cheung, H. Optimal control strategy of central air-conditioning systems of buildings at morning start period for enhanced energy efficiency and peak demand limiting. Energy 2018, 151, 771–781. [Google Scholar] [CrossRef]
- Ali, M.; Vukovic, V.; Sahir, M.; Fontanella, G. Energy analysis of chilled water system configurations using simulation-based optimization. Energy Build. 2013, 59, 111–122. [Google Scholar] [CrossRef]
- Tian, W.; Sevilla, T.; Zuo, W.; Sohn, M. Coupling fast fluid dynamics and multizone airflow models in Modelica Buildings library to simulate the dynamics of HVAC systems. Build. Environ. 2017, 122, 269–286. [Google Scholar] [CrossRef]
- Hinkelman, K.; Wang, J.; Zuo, W.; Gautier, A.; Wetter, M.; Fan, C.; Long, N. Modelica-based modeling and simulation of district cooling systems: A case study. Appl. Energy 2022, 311, 118654. [Google Scholar] [CrossRef]
- Fan, B.; Jin, X.; Du, Z. Optimal control strategies for multi-chiller system based on probability density distribution of cooling load ratio. Energy Build. 2011, 43, 2813–2821. [Google Scholar] [CrossRef]
- Wang, W.; Beausoleil-Morrison, I. Integrated simulation through the source-code coupling of component models from a modular simulation environment into a comprehensive building performance simulation tool. J. Build. Perform. Simulation 2009, 2, 115–126. [Google Scholar] [CrossRef]
- Tang, J.; Sha, L.; Sun, H.; Zhang, W. Optimizing energy efficiency in buildings’ cold water systems: A differential pressure control-based global approach. Energy Build. 2025, 327, 115108. [Google Scholar] [CrossRef]
- Nageler, P.; Schweiger, G.; Pichler, M.; Brandl, D.; Mach, T.; Heimrath, R.; Schranzhofer, H.; Hochenauer, C. Validation of dynamic building energy simulation tools based on a real test-box with thermally activated building systems (TABS). Energy Build. 2018, 168, 42–55. [Google Scholar] [CrossRef]
- Hirsch, H.; Nicolai, A. An efficient numerical solution method for detailed modelling of large 5th generation district heating and cooling networks. Energy 2022, 255, 124485. [Google Scholar] [CrossRef]
- Glaessgen, E.H.; Stargel, D.S. The Digital Twin Paradigm for Future NASA and U.S. Air Force Vehicles. In Proceedings of the 53rd Structures, Structural Dynamics and Materials Conference Special Session: Digital Twin, Honolulu, HI, USA, 23–26 April 2012. [Google Scholar]
- Li, H.; Hong, T. A digital twin platform for building performance monitoring and optimization: Performance simulation and case studies. Build. Simul. 2025, 18, 1563–1578. [Google Scholar] [CrossRef]
- Kritzinger, W.; Karner, M.; Traar, G.; Henjes, J.; Sihn, W. Digital Twin in manufacturing: A categorical literature review and classification. IFAC-Pap. 2018, 51, 1016–1022. [Google Scholar] [CrossRef]
- Benton, D.; Bowman, C.; Hydeman, M.; Miller, P. An Improved Cooling Tower Algorithm for the CooiTools™ Simulation Model. ASHRAE Trans. 1999, 108, 760–768. [Google Scholar]
- Wetter, M. Fan and pump model that has a unique solution for any pressure boundary condition and control signal. In Proceedings of the BS 2013: 13th Conference of the International Building Performance Simulation Association, Chamery, France, 26–28 August 2013; pp. 3505–3512. [Google Scholar]
- Hydeman, K. Tools and Techniques to Calibrate Electric Chiller Component Models. ASHRAE Trans. 2002, 108, 733–741. [Google Scholar]
- Van der Heijde, B.; Fuchs, M.; Ribas Tugores, C.; Schweiger, G.; Sartor, K.; Basciotti, D.; Müller, D.; Nytsch-Geusen, C.; Wetter, M.; Helsen, L. Dynamic equation-based thermo-hydraulic pipe model for district heating and cooling systems. Energy Convers. Manag. 2017, 151, 158–169. [Google Scholar] [CrossRef]
- Yu, J.; An, C.; Tang, Q.; Zhang, J.; Zhang, Y. Heat transfer characteristics of subsea long-distance pipeline subject to direct electrical heating. Geoenergy Sci. Eng. 2024, 234, 212679. [Google Scholar] [CrossRef]


Disclaimer/Publisher’s Note: The statements, opinions and data contained in all publications are solely those of the individual author(s) and contributor(s) and not of MDPI and/or the editor(s). MDPI and/or the editor(s) disclaim responsibility for any injury to people or property resulting from any ideas, methods, instructions or products referred to in the content. |
© 2026 by the authors. Licensee MDPI, Basel, Switzerland. This article is an open access article distributed under the terms and conditions of the Creative Commons Attribution (CC BY) license.