Article

Numerical Evaluation of Interlayer Gaps on Dynamic Response of Precast Concrete Slab Track Systems with Maintenance Thresholds


1
Department of Civil Engineering, Kyung Hee University, 1732 Deogyeong-daero, Giheung-gu, Yongin-si 17104, Republic of Korea
2
Hyundai E&C, Hyundai Bldg., 75, Yulgok-ro, Jongno-gu, Seoul 03058, Republic of Korea
*
Author to whom correspondence should be addressed.
Buildings 2026, 16(2), 448; https://doi.org/10.3390/buildings16020448
Submission received: 16 December 2025 / Revised: 18 January 2026 / Accepted: 18 January 2026 / Published: 21 January 2026
(This article belongs to the Section Building Structures)

Abstract

This study presents a comprehensive numerical investigation into the dynamic response of railway precast concrete slab track (PST) systems subjected to various interlayer gap conditions. Key parameters including gap width, depth, and location were examined, along with the geometric configuration of the grouting layer, comparing current (as-is) and earlier (as-was) models. A conservative modeling approach was adopted, assuming fully unbonded interfaces and delamination gap depths extending to the shear key, with dynamic loading applied. Results showed that the maximum principal stress in both the slab and grouting layer increased with larger gap widths but stabilize beyond specific thresholds. In the as-is model, stress levels remained below reference flexural tensile strength, indicating a low risk of cracking. However, the as-was model exhibited grouting layer stresses exceeding the allowable limit at the gap widths near 4 mm and approaching critical levels even at 1.5 mm. Stress responses also varied depending on whether gaps were located at the slab–grouting layer or grouting layer–hydraulic stabilized basecourse (HSB) interfaces. Based on the examinations, allowable interlayer gap width criteria were proposed to support maintenance decisions. The study provides a rational framework for monitoring and managing interlayer gaps, enhancing resistance to early fatigue cracking and structural integrity of PST systems under dynamic railway loads.

1. Introduction

Concrete slab track systems have been increasingly adopted in modern railway infrastructure due to their excellent performance under heavy axle loads and high-speed train operations [1,2]. In Korea, concrete slab tracks have been implemented in various railway lines, including the Korea Train Express (KTX) Kyungbu Line between Daegu and Busan [3], and the Honam Line, aiming to address frequent maintenance issues associated with conventional ballasted tracks [4,5,6].
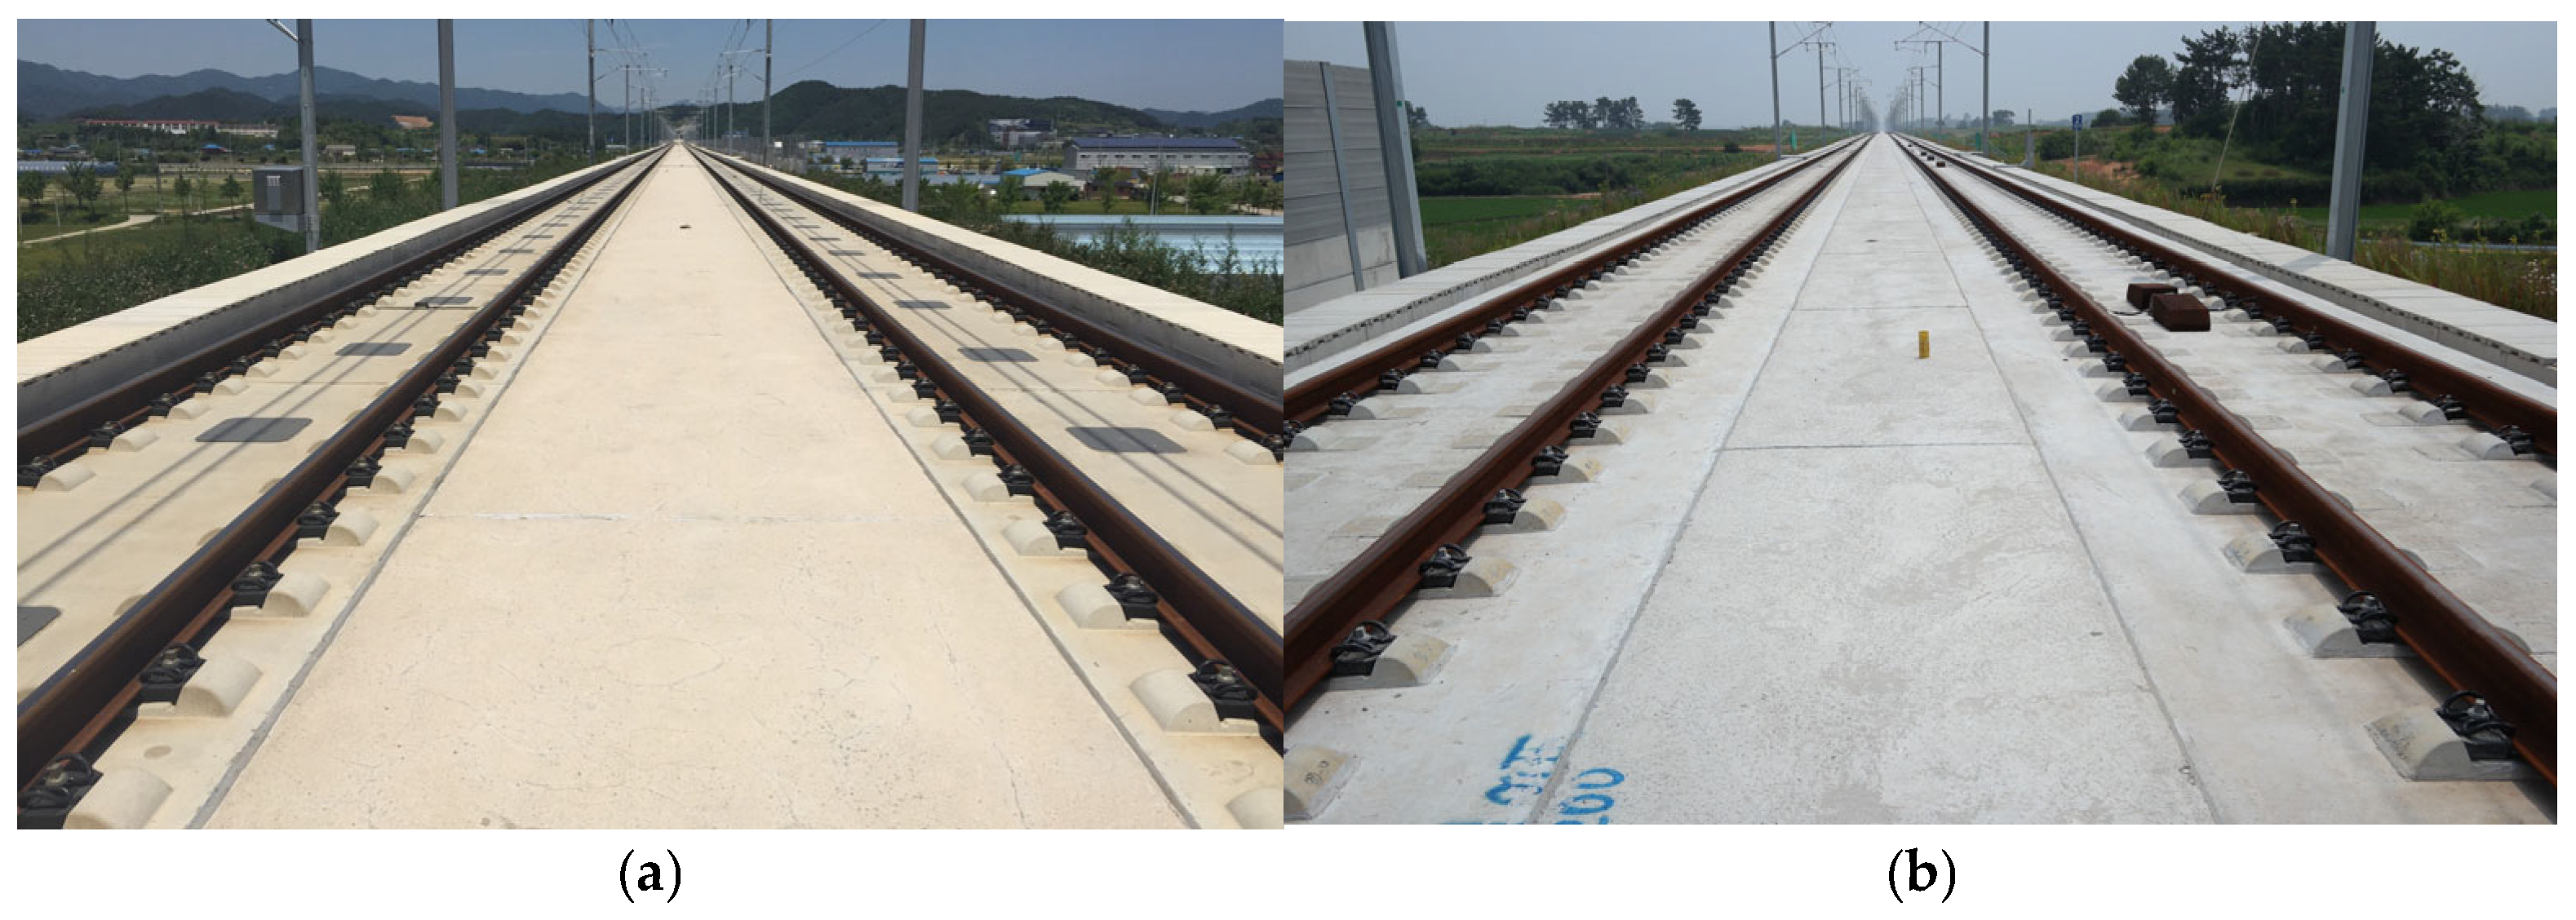
Concrete slab tracks can be categorized into two types: precast concrete slab tracks (PST) and cast-in-place continuously reinforced concrete tracks (CRCT) as illustrated in Figure 1a,b, respectively. PST systems, such as the Japanese Shinkansen system [1,7], the Austrian Slab Track Austria system [8], and the German Bögl system [9,10], have been increasingly adopted worldwide. The primary advantages of PST systems include factory-level quality control, rapid installation, and life-cycle costs that are 20–40% lower than those of conventional ballasted track [11,12]. Designs include legacy as-was models (full-width grouting) and modern as-is models (recessed edges), developed to mitigate edge damage.
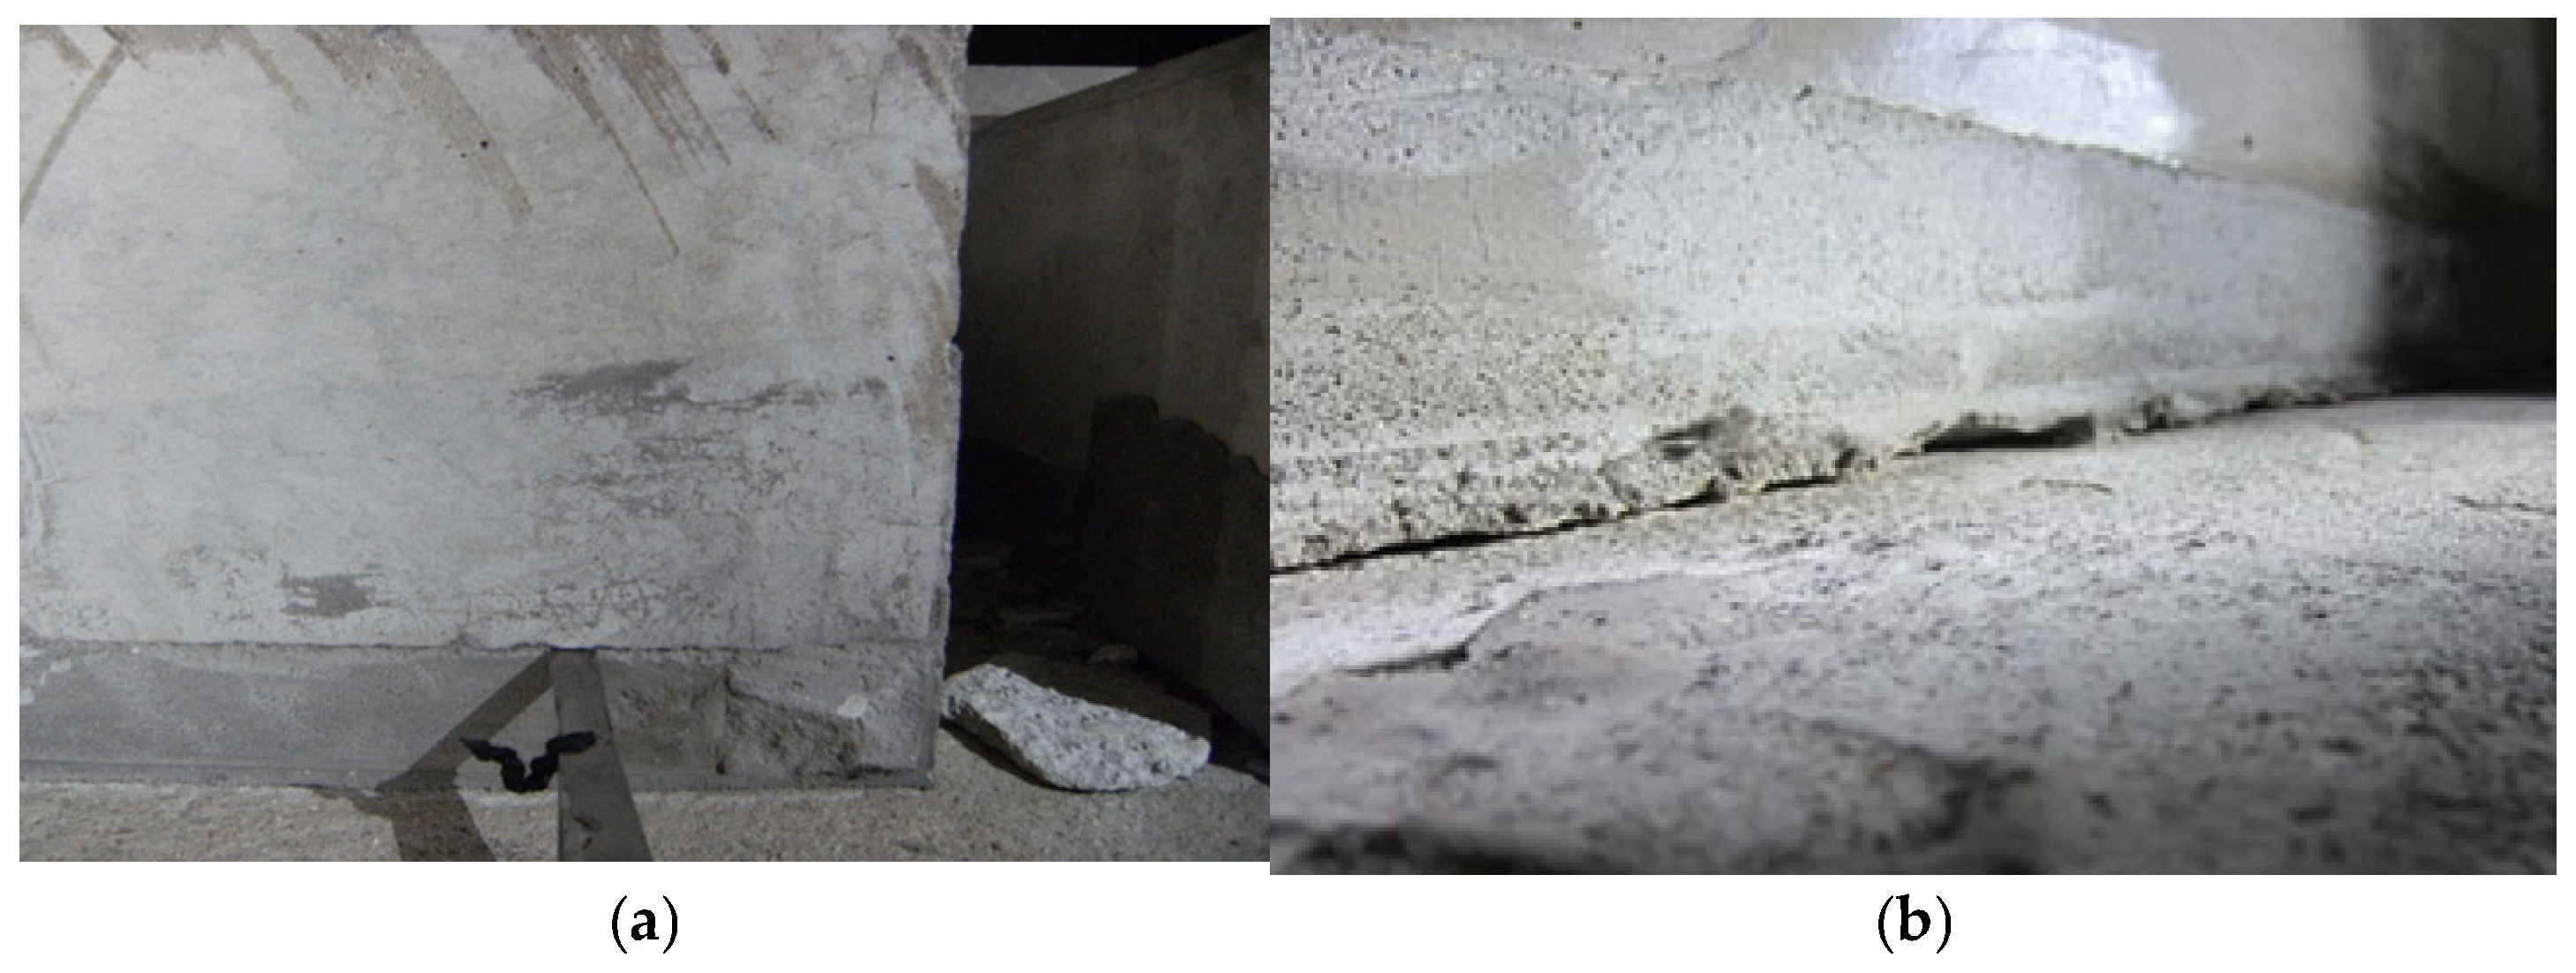
In Korea, PST systems have also been developed and applied to several railway projects, and their performance is continuously being improved [13]. A typical PST system consists of three layers: a precast concrete slab on top, a grouting layer in the middle, and a hydraulic stabilized base (HSB) layer at the bottom. During construction, the precast slabs are placed on the HSB, and the gap between them is filled with cementitious grouting materials, forming an intermediate layer that ensure contact and load transfer between the slab and the supporting layer. However, due to environmental loading such as temperature and moisture gradients through slab thickness, the concrete slab undergoes curling and warping behavior, respectively, causing vertical displacements through corners and edges of the slabs [14,15,16]. Field investigations indicate that millimeter-scale interfacial debonding can develop and propagate over tens of centimeters, with severe cases extending toward the shear-key region; these trends are reported across CRTS-type slab tracks under in-service conditions [17,18]. In parallel, recent studies show that temperature gradients in slab induce curling and periodically modify interlayer contact conditions and stiffness, and that thermos-mechanical coupling with moving loads accelerates interface deterioration relative to either action alone [19]. As a result, although various approaches, such as alternative material applications and adhesive bonding techniques [20,21,22], have been attempted, it remains difficult for the grouting layer to maintain a perfect bond with both the upper slab and the lower HSB. As shown in Figure 2, this often leads to interface separation or layer gaps, either between the slab and grouting layer, the grouting layer and HSB, or both.
The presence of interlayer gaps in PST systems caused by progressive de-bonding over time due to repeated train loads and the environmental effects may significantly influence the structural behavior under dynamic loading [23,24,25]. In particular, temperature gradients throughout the slab thickness induce curling, periodically modifying contact conditions at the interfaces and coupling with traffic loading to accelerate gap initiation and growth [26]. A finite element (FE) study has shown that even a 1 mm vertical gap can raise the maximum principal stress in grouting layer by up to 40% [27,28]. This high sensitivity at small separations is consistent with thermos-mechanical analyses in which transient contact loss and recovery under moving loads amplify local tensile demands in grout [29]. Furthermore, another numerical study reported that when the gap depth, which refers to the horizontal extent of delamination, extends beyond the sleeper, the predicted maximum stress approaches the flexural strength of typical cement mortar [30]. This depth effect reflects a shift in load paths and local stiffness once delamination passes the sleeper line, with attendant increases in dynamic amplification and changes in dominant frequency content [31,32,33]. A previous study on the KTX PST system has shown that such gap formations can increase stress concentrations in the grouting layer, potentially leading to cracking and other forms of damage [34]. Therefore, it is important to evaluate the effects of the layer gaps based on their occurrence conditions and characteristics. While this study utilizes physics-based numerical simulations, recent advancements have also demonstrated the efficacy of data-driven methods and machine learning algorithms for predicting the dynamic response and damage of reinforced concrete structures [35,36].
Accordingly, this study numerically investigates the dynamic response of the PST system, uniquely quantifying the coupled effects of interlayer gap width, depth, and location. A FE analysis model that incorporates different types of interlayer gaps was developed, and parametric analyses were conducted to evaluate the effects of gap characteristics across both modern (as-is) and legacy (as-was) grouting configurations. To provide conservative results for maintenance decision-making, all interfaces are modeled as unbonded and gap delamination is propagated to the shear key. The analysis intentionally employs conservative assumptions that bias responses toward upper-bound estimates. Accordingly, results are interpreted as trends and relative comparisons rather than absolute predictions. Based on the results, this study aims to establish quantitative allowable thresholds for interlayer gaps and suggest practical maintenance criteria to prevent early fatigue failure in PST systems.

2. Numerical Modeling

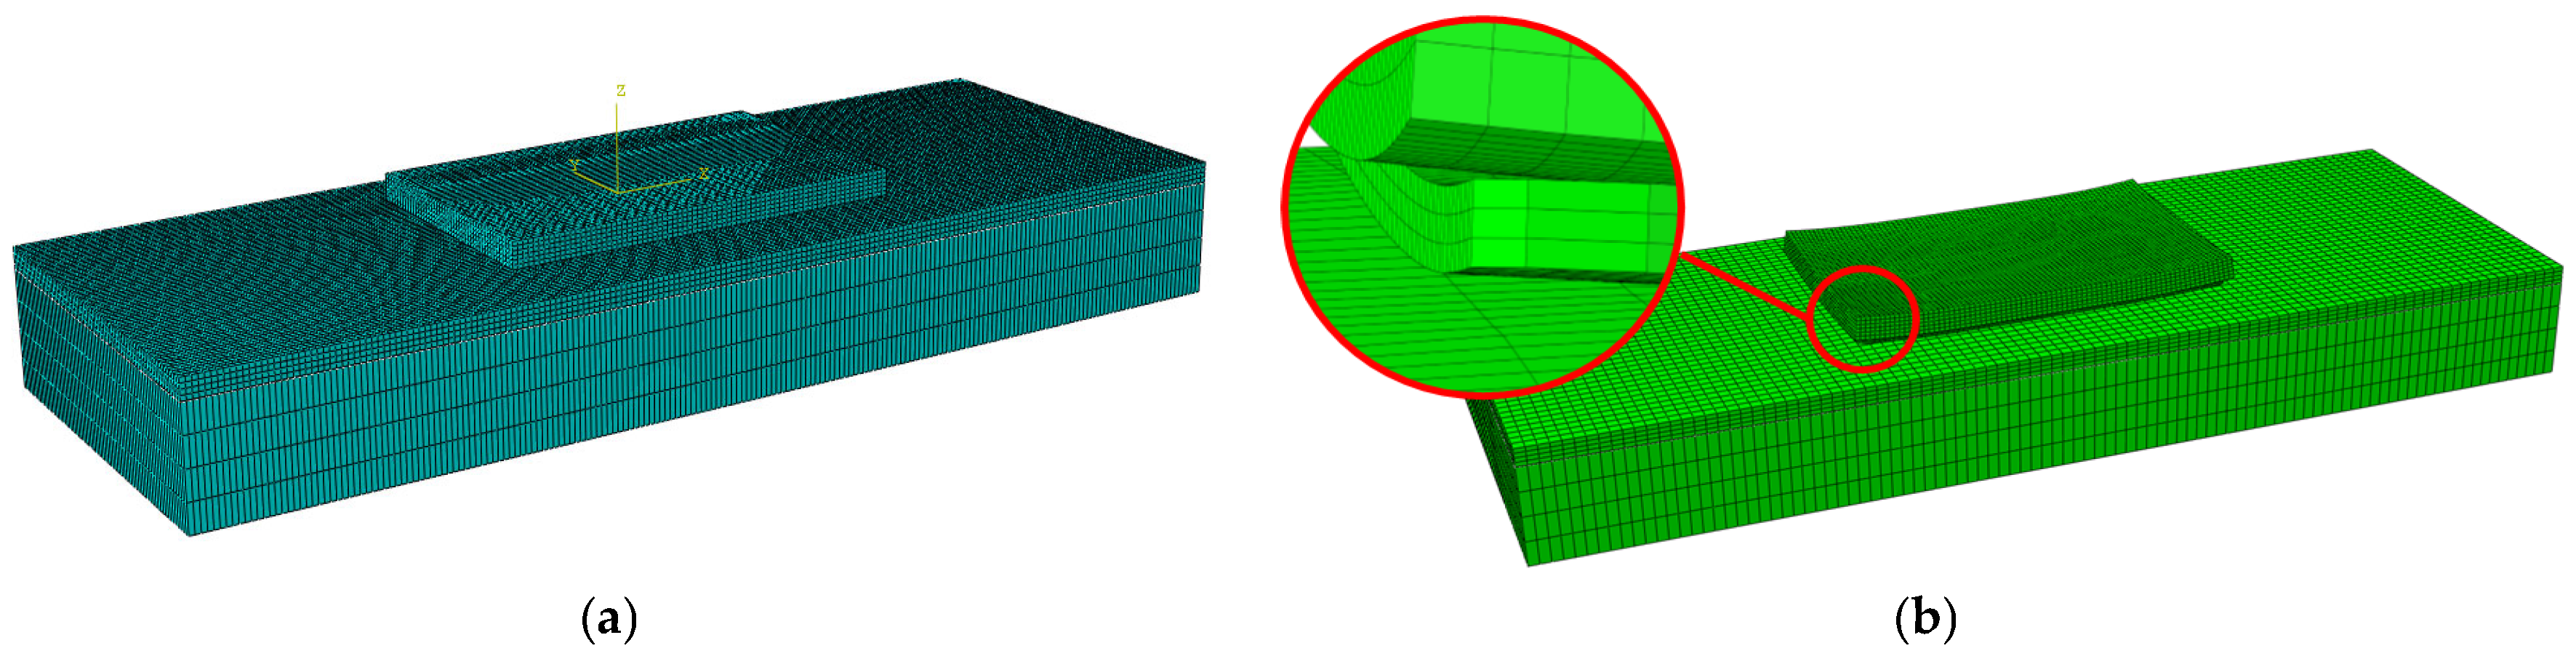
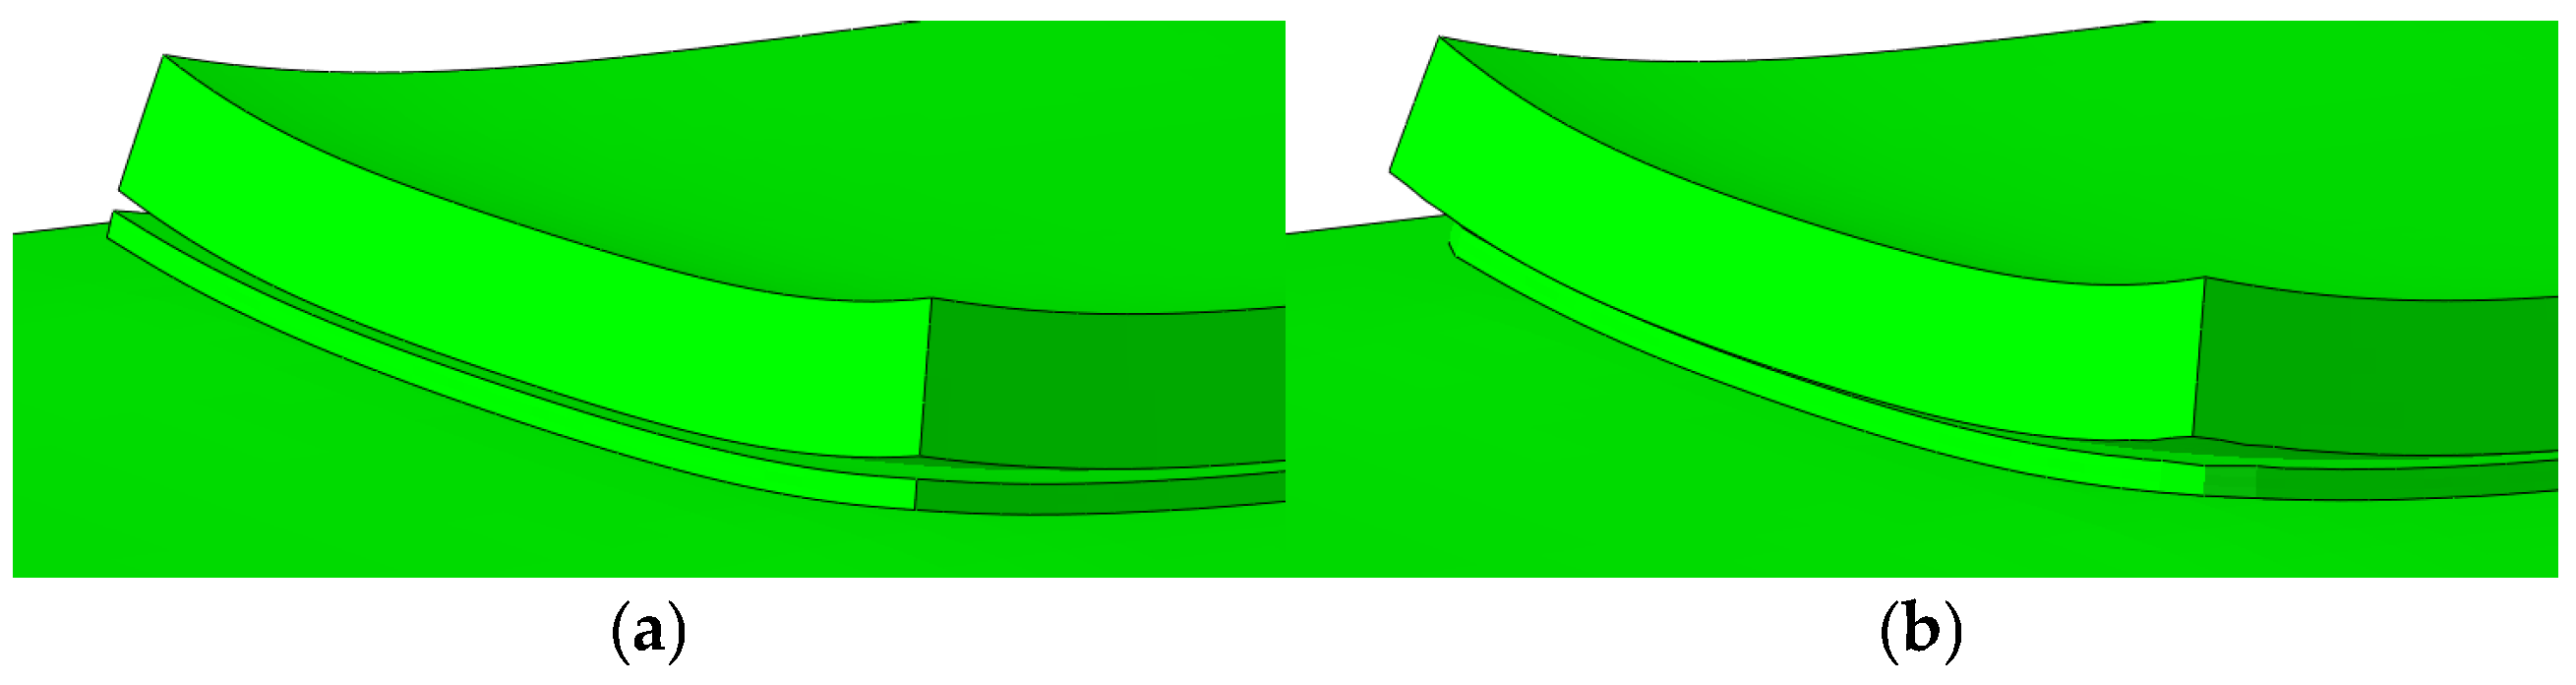
To evaluate the behavior characteristics of the PST systems under various interlayer gap conditions, a three-dimensional FE model was developed using ABAQUS 2024 as shown in Figure 3a. The model components include the precast concrete slab, grouting layer, HSB, and subgrade. All components were modeled using 8-noded linear rectangular solid (3D) elements [37], with an element size of 50 mm × 50 mm on the horizontal plane. Uniform layer thickness was assumed, consistent with the tight tolerances of factory-produced precast slabs and automated HSB construction. To examine the effects of interlayer gaps, the FE models were constructed with predefined debonding conditions either between the concrete slab and grouting layer or between the grouting layer and HSB as illustrated in Figure 3b. The sizes of the gaps, specifically gap width and gap depth, were modeled by applying controlled temperature gradients along the depth of the layers, producing curling deformations typically occurred under environmental loading. To simulate relatively large gap conditions, large temperature gradients were introduced through the slab and grouting layer to induce significant curling. The resulting deformed geometry was then used to reconstruct the FE model, and dynamic analyses were carried out under train loading. The present study evaluates the dynamic response of an uncracked PST system for prescribed gap states, rather than simulating long-term gap evolution.
In the early PST system, the grouting layer was constructed to match the full dimensions of the concrete slab as shown in Figure 4a. In contrast, more recent implementations typically feature a grouting layer that is formed approximately 50 mm inward from the concrete slab edges and incorporates rounded corners with a radius of 50 mm, as shown in Figure 4b. This study primarily adopted the as-is model as the standard configuration for the grouting layer. However, to evaluate the influence of the as-was model, additional analyses were conducted, as it is necessary to consider maintenance perspectives for aging PST systems.
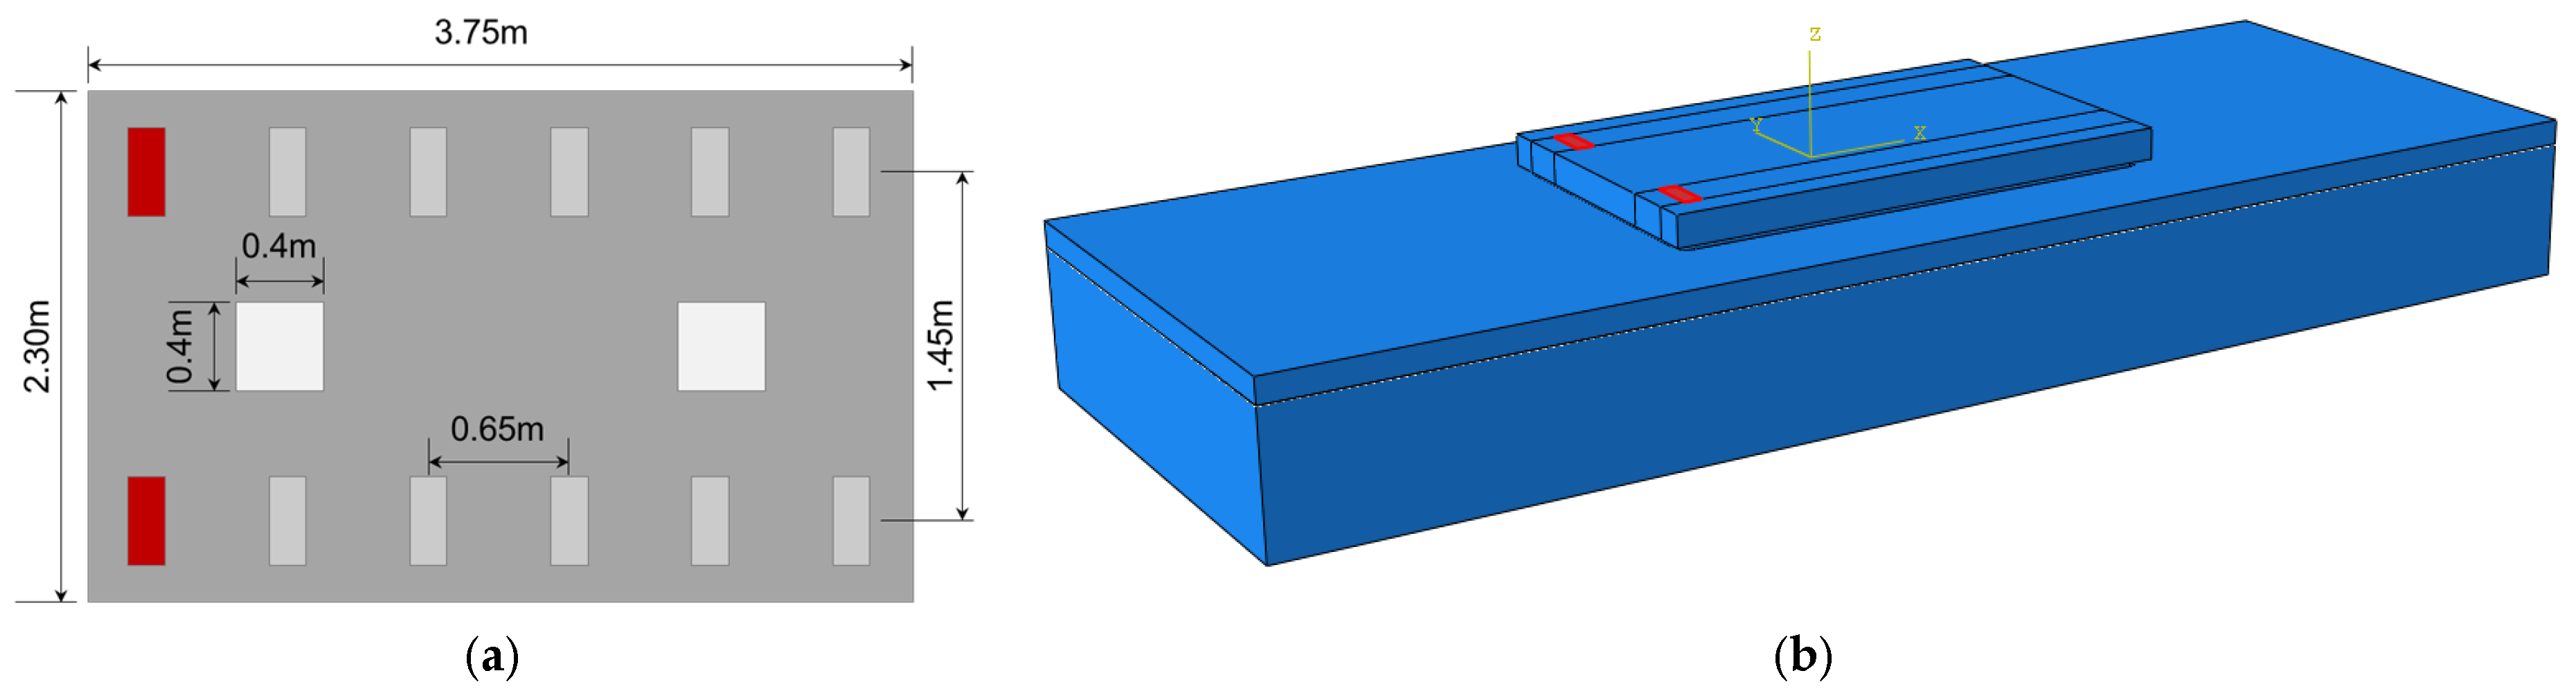
Figure 5a,b illustrate the slab dimensions and loading position, respectively. The length and width of the precast concrete slab was set to 3.75 m and 2.30 m, respectively. Six sleepers (0.40 m × 0.18 m) were arranged with a longitudinal spacing of 0.65 m and a transverse spacing of 1.45 m. The HSB and subgrade layers were modeled with sufficient horizontal extension beyond the slab to simulate a semi-infinite track foundation. To prevent horizontal movement of the slab and to ensure firm bonding between the slab, grouting layer, and HSB, shear keys were also applied in the model. Two shear keys (0.40 m × 0.40 m) are installed along the longitudinal centerline at the 1/4 and 3/4 points of the slab length. Specifically, at the two locations where the shear keys are installed in the slab, the interfaces between the slab, grouting layer, and HSB were modeled as fully bonded. In contrast, in regions outside the shear keys, the interfaces were modeled as unbonded, even when no physical gap was present, in order to represent the most vulnerable interlayer condition that may occur in the field. The concrete slab, grouting layer, and basecourse are discretized with 6, 3, and 4 elements, respectively, along the vertical direction. For bonded interfaces, tie options are applied between layers. For unbonded interfaces, hard contact is defined with frictionless interaction in the horizontal direction. This frictionless assumption reflects the actual construction practice where thin plastic sheets (bond breakers) are installed between the HSB and the upper layers to reduce restraint stresses. Additionally, this serves as a conservative assumption by neglecting any frictional shear transfer. The HSB is assumed to be fully bonded to the underlying bedrock. The base and lateral sides of the bedrock layer were constrained with fixed boundary conditions. Given the high elastic modulus of the bedrock, it was modeled as a rigid foundation where wave reflection effects are negligible. Table 1 summarizes the input values used in the FE analysis. It was assumed that the foundation layer consisted of bedrock, modeled with the same area as the HSB and sufficient thickness. Elastic modulus of 1000 GPa was assigned to simulate a rigid supporting condition. The dynamic analysis was performed using an implicit dynamic procedure. Based on the design axle load of 220 kN according to the Korean standard train load (KRL-2012) [38], together with a load distribution factor of 0.4 and a dynamic impact factor of 1.5, an equivalent load of 132 kN was calculated and applied at each of the two loading areas. Specifically, the load was applied at the rail seat positions of the sleeper located at the longitudinal end of the slab to simulate the most critical edge loading scenario. To avoid high-frequency excitation, the load was applied with smooth amplitude for a total duration of 0.2 s, and the structural response was sampled at Δt = 0.0002 s throughout the loading period. This time history focuses on the main frequency components below about 5 Hz and suppresses higher harmonics through a smooth ramp, while the chosen time step ensures adequate temporal resolution. A small amount of Rayleigh damping was introduced into the model to represent energy dissipation in the slab-track system and to stabilize high-frequency numerical components. The ABAQUS Rayleigh coefficients were set to achieve a damping ratio approximately 2% of critical within the dominant response band of the slab and grouting layer [39]. Steel reinforcement in the precast slab was not modeled explicitly, because this study focuses on elastic stress demand and comparative trends among prescribed gap conditions.
The modeling framework employed in this study is based on methodologies established in previous research [34], which demonstrated reasonable agreement with field measurements. Accordingly, the current model is considered suitable for the comparative parametric evaluations presented herein.

3. Effects of Gap Width

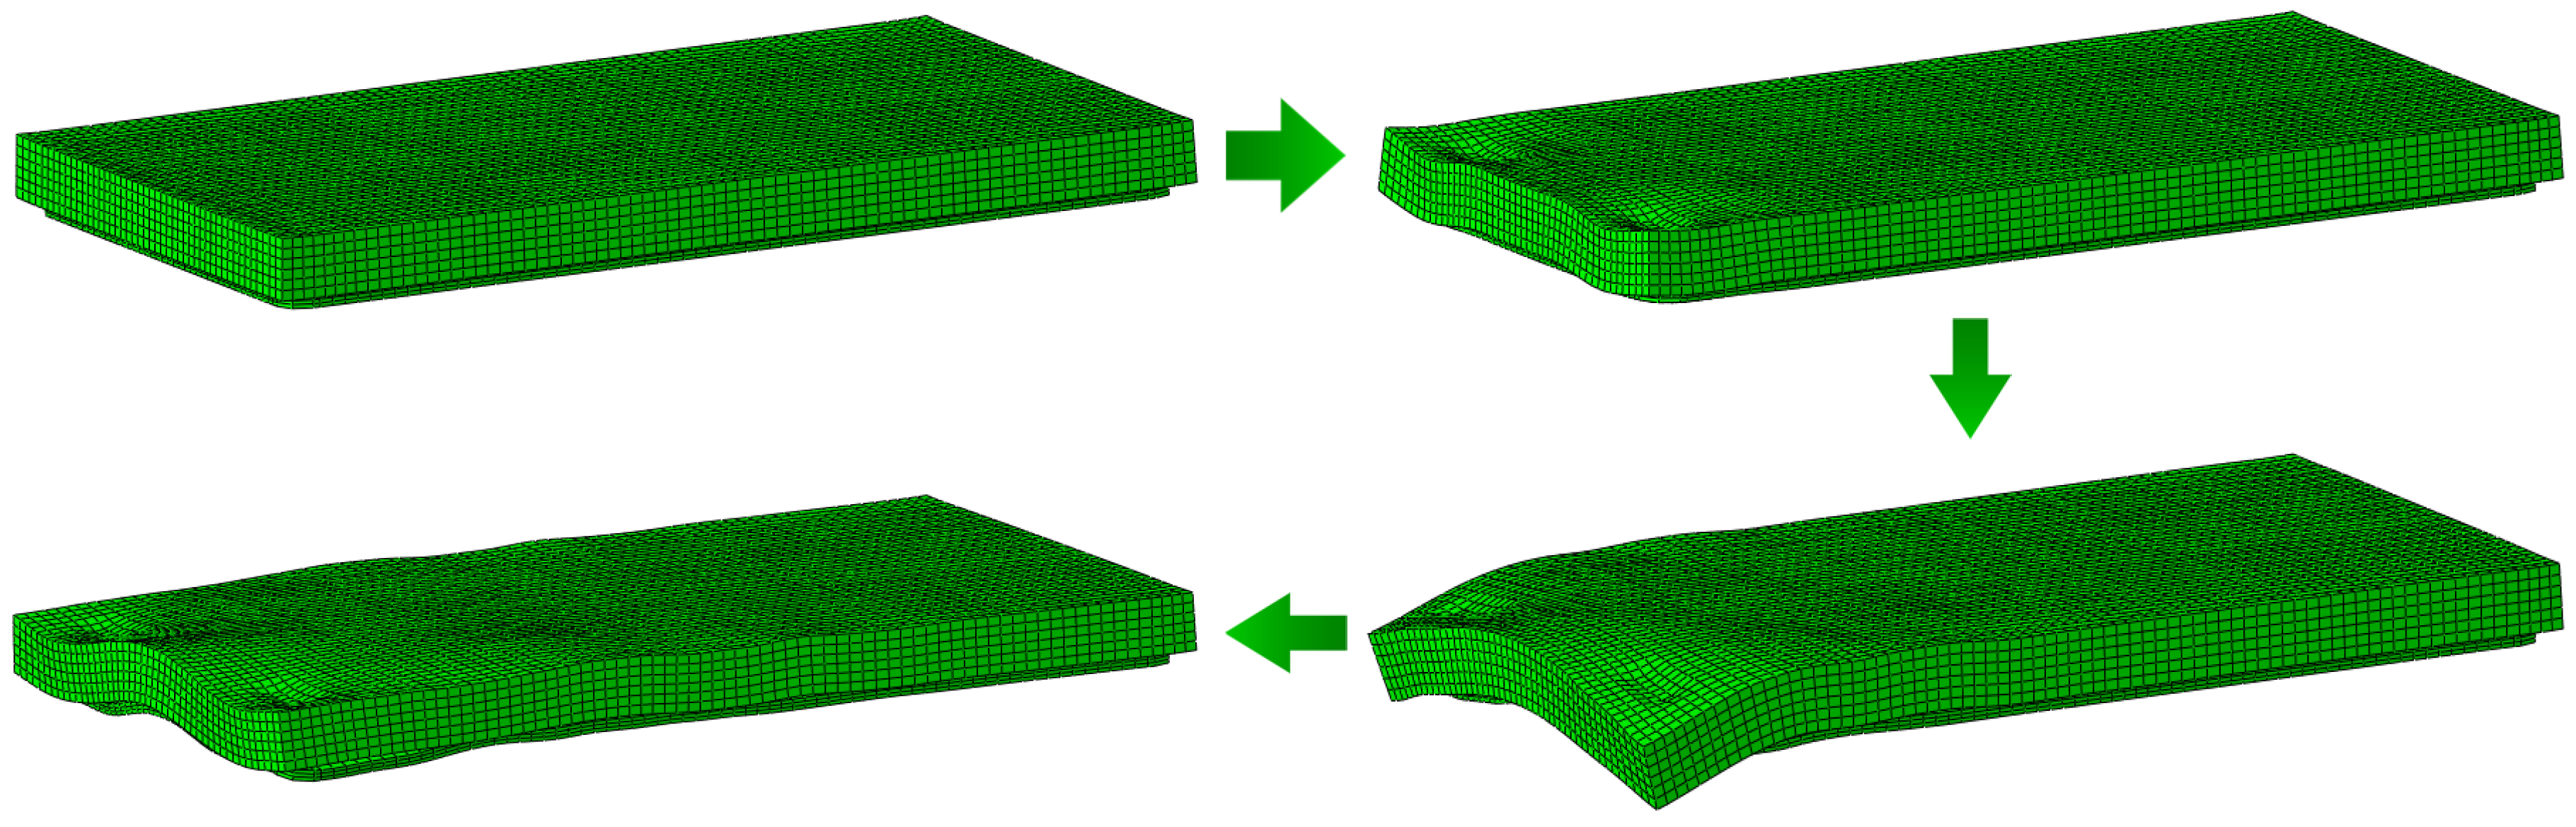
To evaluate the dynamic behavior of the PST system under various interlayer gap conditions, the most critical case, where gaps exist both above and below the grouting layer, was considered. Moreover, the gap depth was fixed to extend to the shear key location to simulate the most critical delamination scenario. Since the gap width is not necessarily identical at the upper and lower interfaces of the grouting layer, the analysis adopted realistic gap widths based on curling deformation caused by temperature gradients in the system. A range of gap widths from 0 to 4.1 mm was considered, produced by inducing temperature gradients of 0–0.05 °C/mm through the slab and grouting layer to generate curling. This range is consistent with field monitoring results for slab/ballastless track systems, where the maximum top-to-bottom temperature difference typically corresponds to vertical temperature gradients of approximately 0.015–0.060 °C/mm [25]. Figure 6 illustrates, for instance, the time-dependent dynamic deformation of the PST system in the case where the combined gap width at the upper and lower interfaces of the grouting layer is 1.9 mm. The two recessed areas on the slab surface indicate the load application points.

3.1. Behavior of Concrete Slab

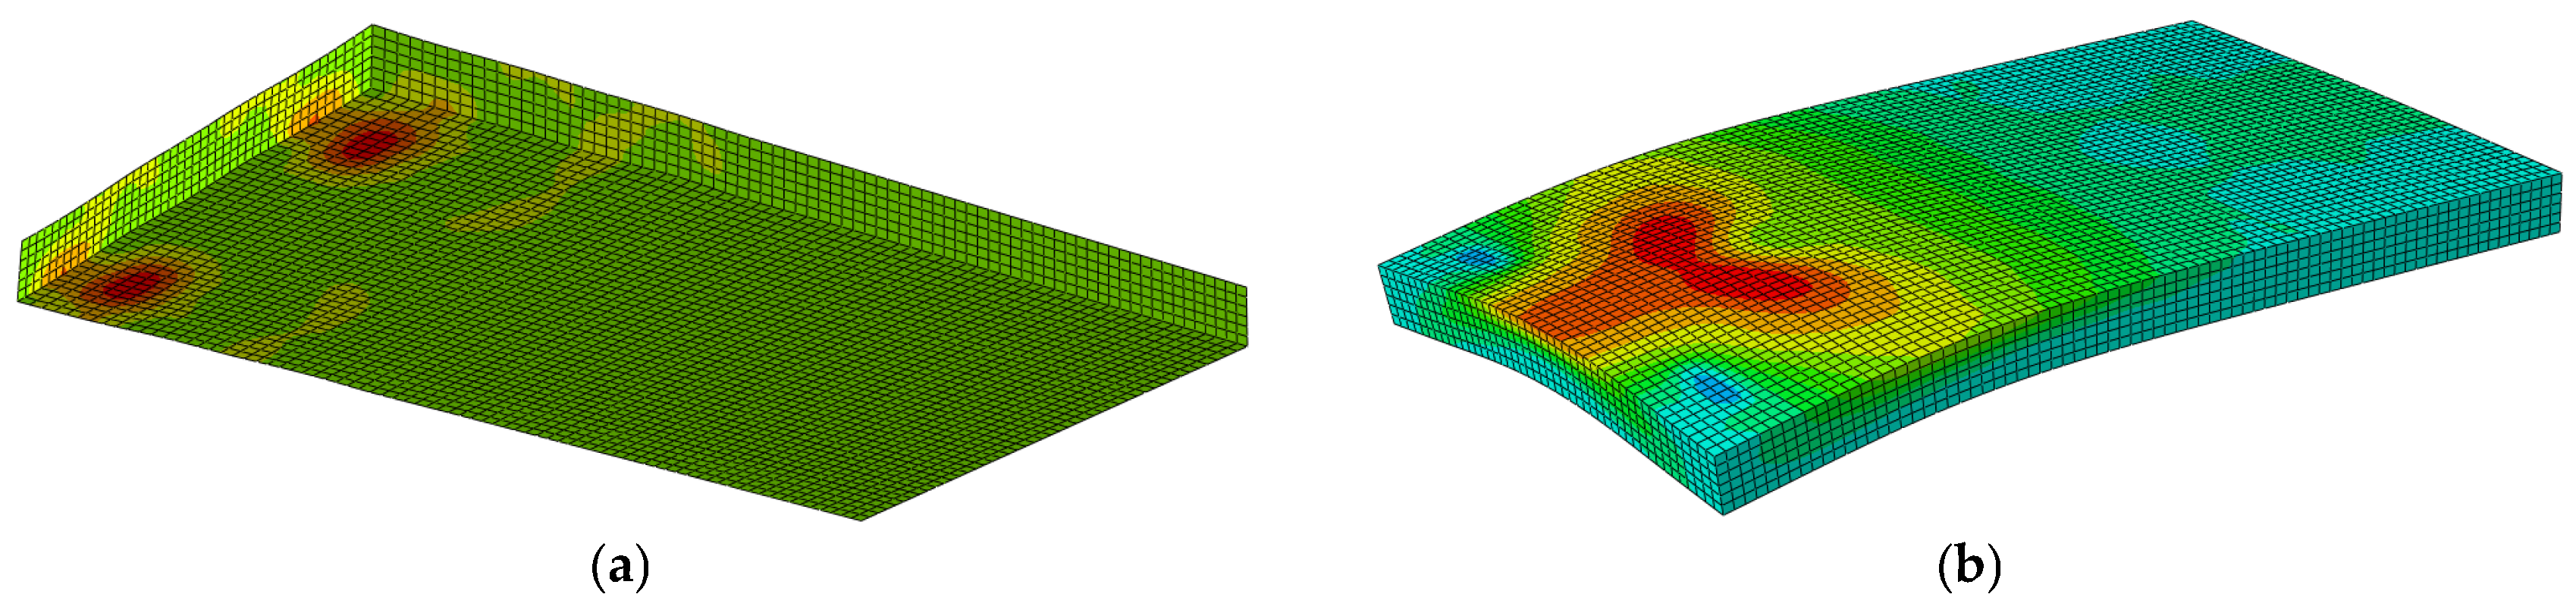
The stress analysis was conducted based on the principal tensile stress at the location where the maximum stress value occurred within the concrete slab. This location may vary depending on the presence of interlayer gaps. As shown in Figure 7, when no gap is present, even if the layers are unbonded, the maximum principal tensile stress occurs at the bottom of the slab, directly beneath the loading points (Figure 7a). However, when gaps are present, the maximum stress typically occurs near the top of the slab, around the midpoint between the two loading positions (Figure 7b). This shift is attributed to a reduction in support stiffness at the slab ends due to the presence of gaps beneath the slab, resulting in structural behavior similar to that of a cantilever.
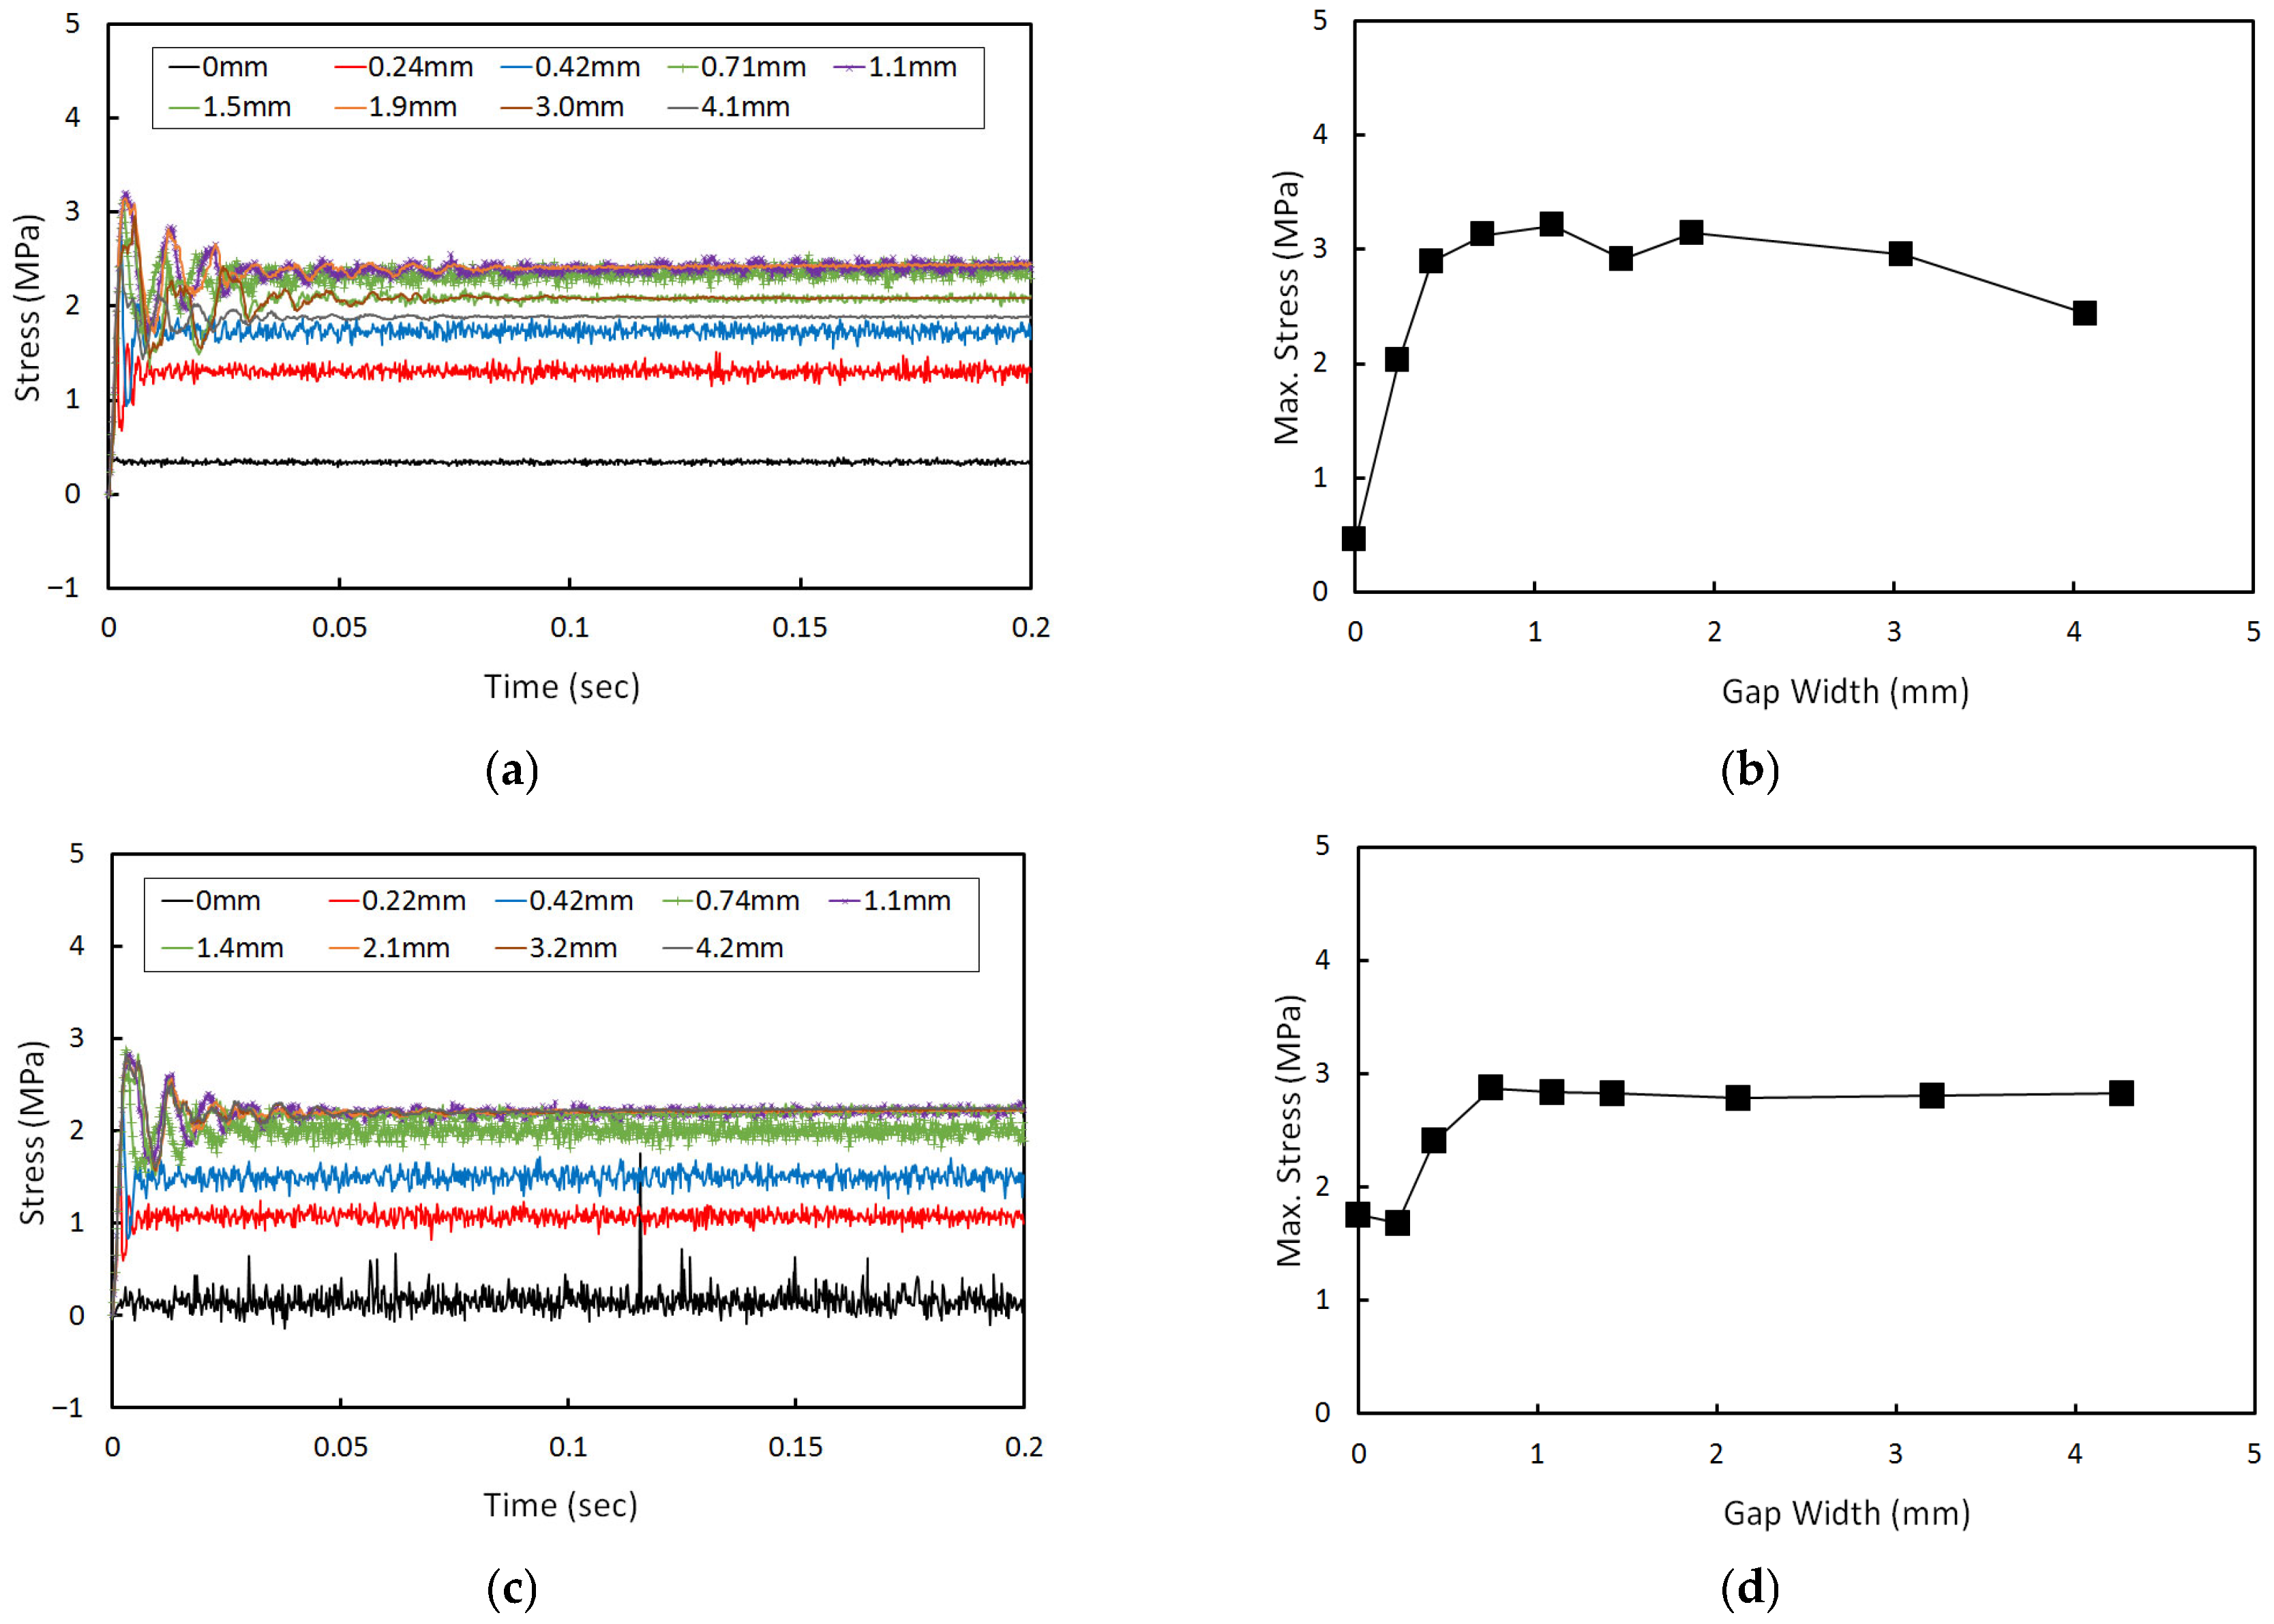
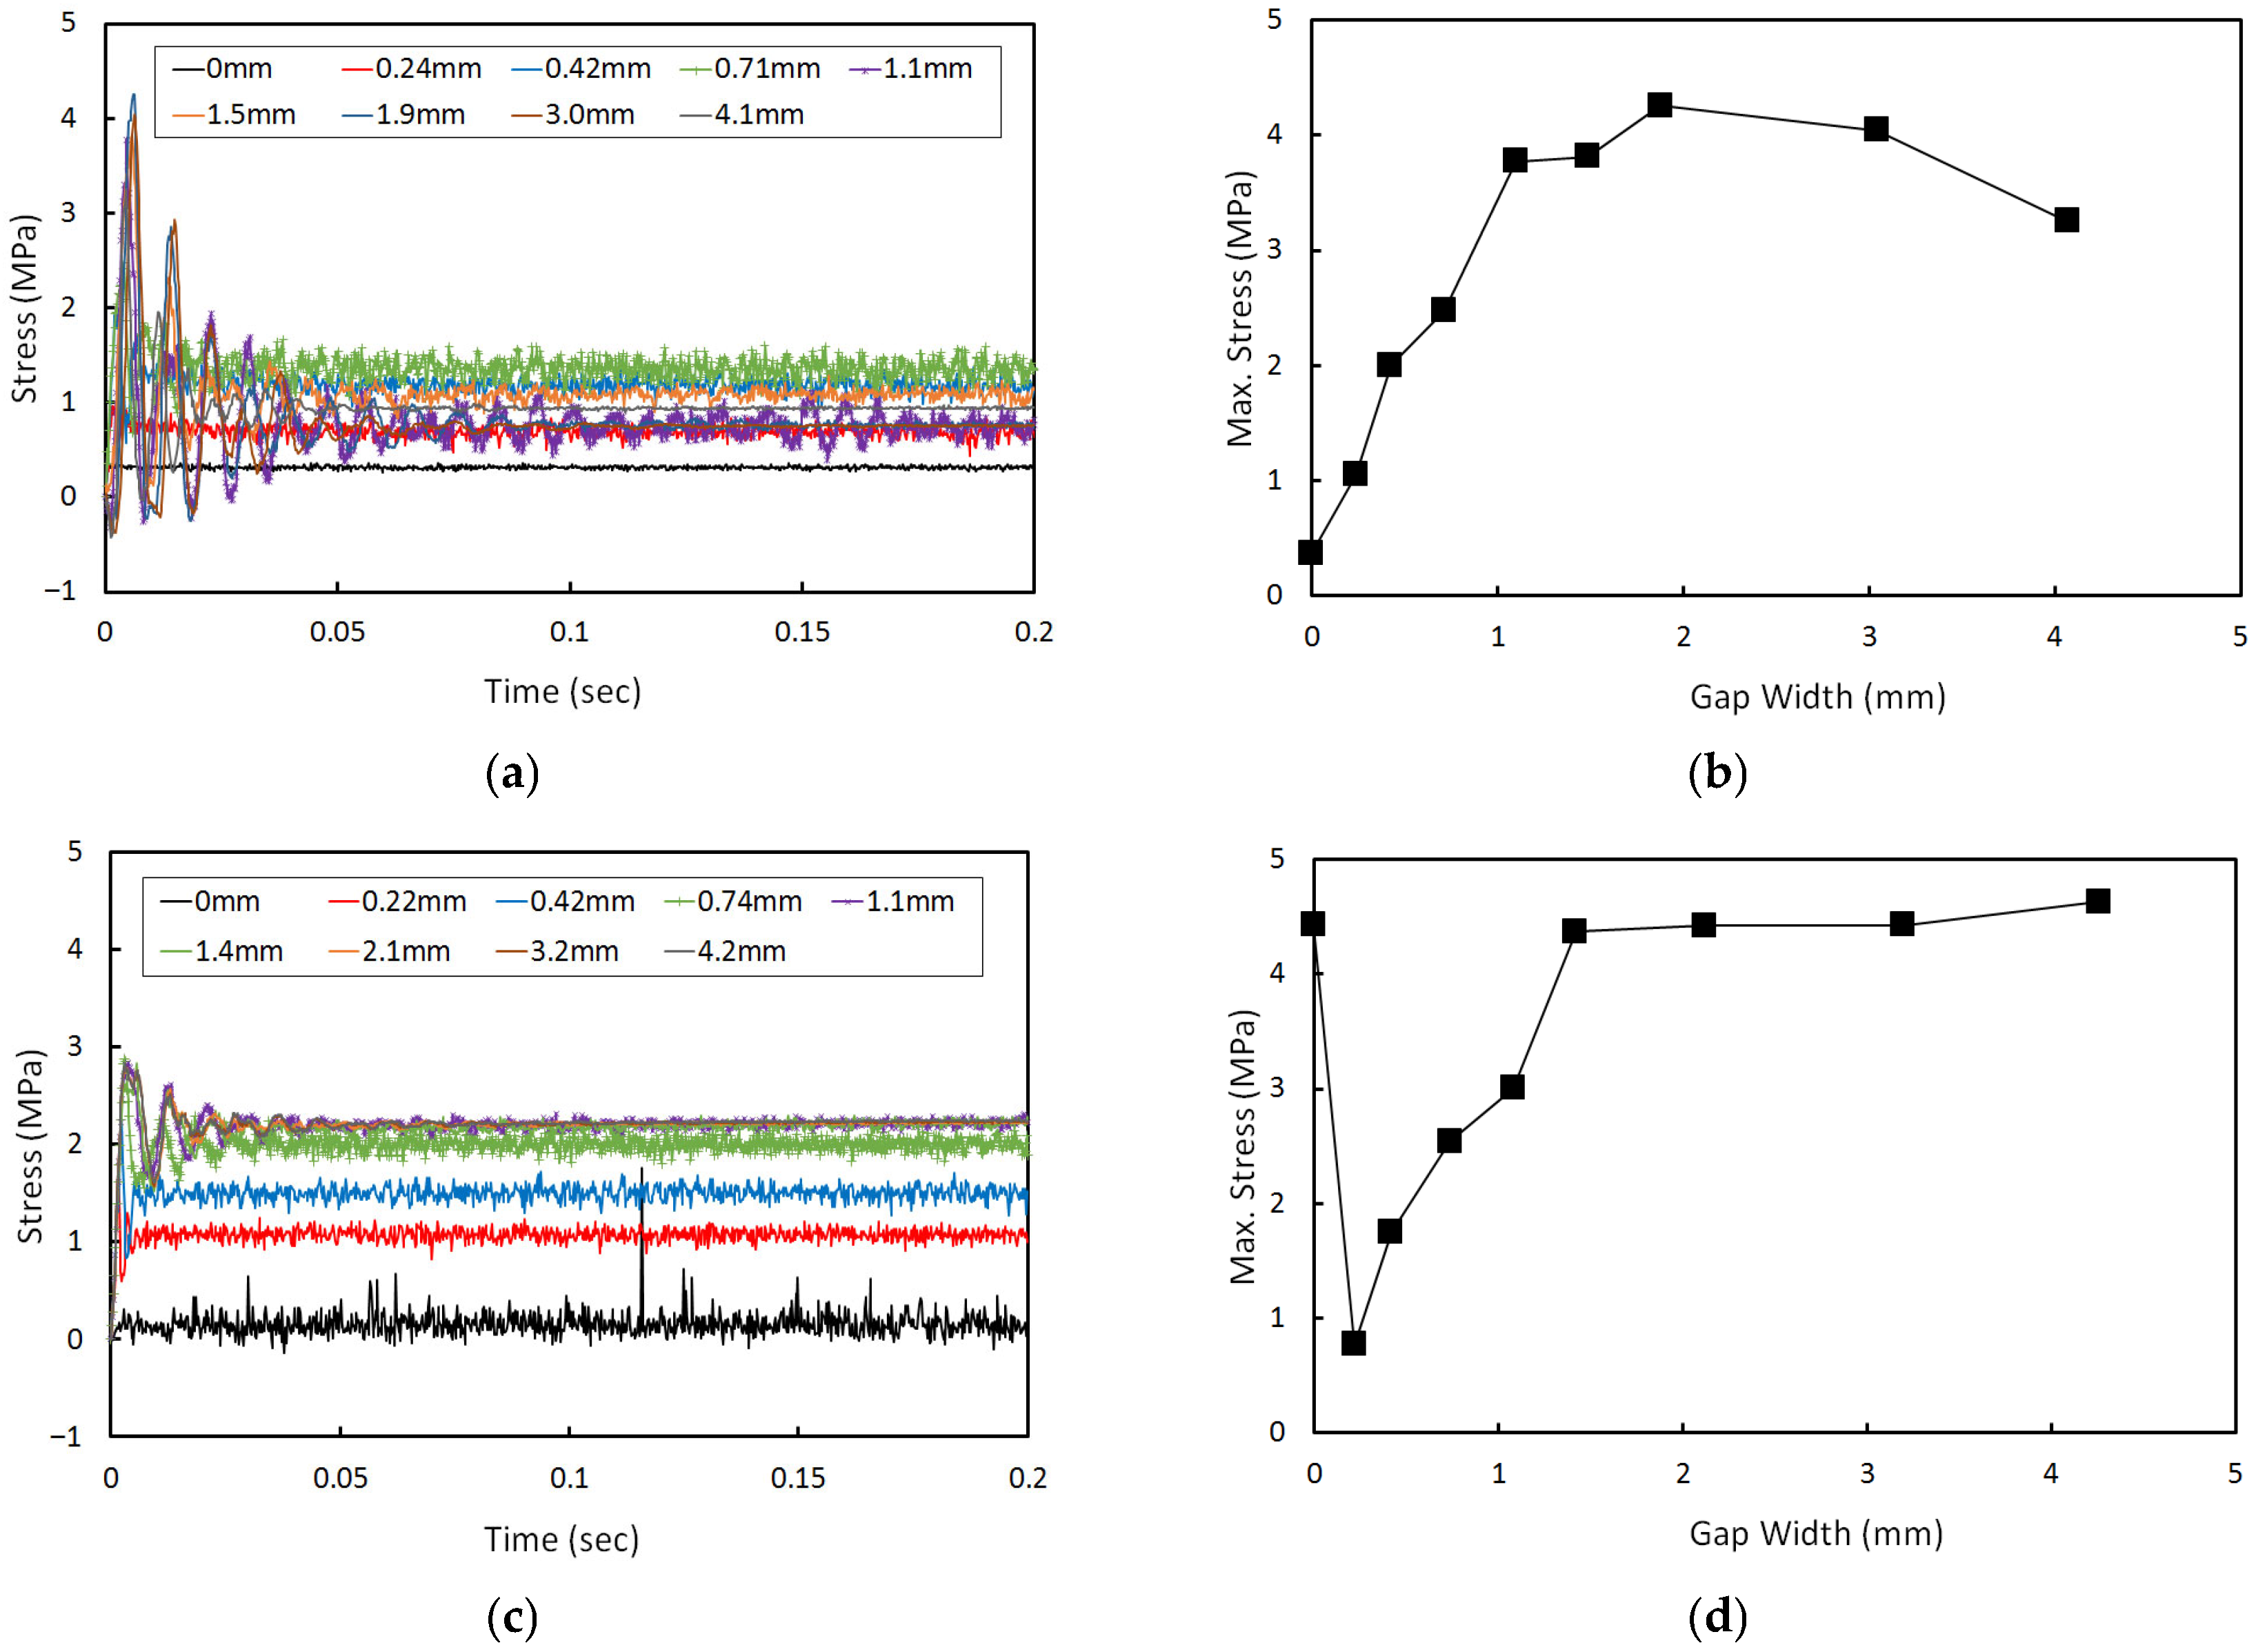
Figure 8a shows the variation of the principal stress in the slab over time with respect to gap width, for the case where gaps exist at both the upper and lower interfaces of the grouting layer. The gap width represents the sum of the top and bottom interface gaps. It can be observed that even a small gap at either interface leads to an increase in slab stress. The maximum stress occurs during the early stage of load application, after which the stress rapidly stabilizes. Figure 8b presents the variation of the maximum principal tensile stress in the concrete slab according to the combined gap width at the upper and lower interfaces of the grouting layer. It is observed that even a small gap leads to an increase in the slab’s maximum stress. For example, when the combined gap width is approximately 0.4 mm, the maximum tensile stress in the slab increases to around 3 MPa. However, further increases in the gap width beyond 0.4 mm do not significantly raise the slab’s maximum stress. Therefore, considering the typical flexural tensile strength of concrete, approximately 4.5 MPa, which is a representative 28-day flexural tensile strength commonly used for slab-type concrete applications [40], it can be expected that the presence of gaps at both interfaces of the grouting layer in a PST system does not immediately induce tensile stress levels high enough to cause cracking in the slab.
Figure 8c,d present the time-dependent stress variation and the maximum stress in the concrete slab, respectively, for the as-was model. Even in the absence of interlayer gaps between the grouting layer and the adjacent layers, the slab experiences greater stress fluctuations compared to the as-is model. As the gap width increases, the dynamic stress in the slab shows a slight increase. When gaps are present, the maximum stress in the slab occurs at the early stage of load application. In contrast, in the absence of gaps, the maximum stress arises at a random time during the application of dynamic loading. Additionally, even without interlayer gaps at the top and bottom of the grouting layer, the maximum stress in the slab remains within approximately 2 MPa. As the gap width increases, the maximum stress increases to around 3 MPa. However, once the gap width exceeds approximately 0.8 mm, the maximum stress in the slab tends to stabilize. The initial increase in slab stress with widening interlayer gap reflects a rapid loss of end support stiffness and a shift toward cantilever-like action. Once end contact is largely lost, further increases in gap width produce minor changes in global stiffness, and the maximum stress therefore stabilizes (≈0.4 mm in the as-is model and ≈0.8 mm in the as-was model). Wider gaps also reduce the frequency of intermittent recontacts between layers, which further limits additional stress growth at larger gap widths.
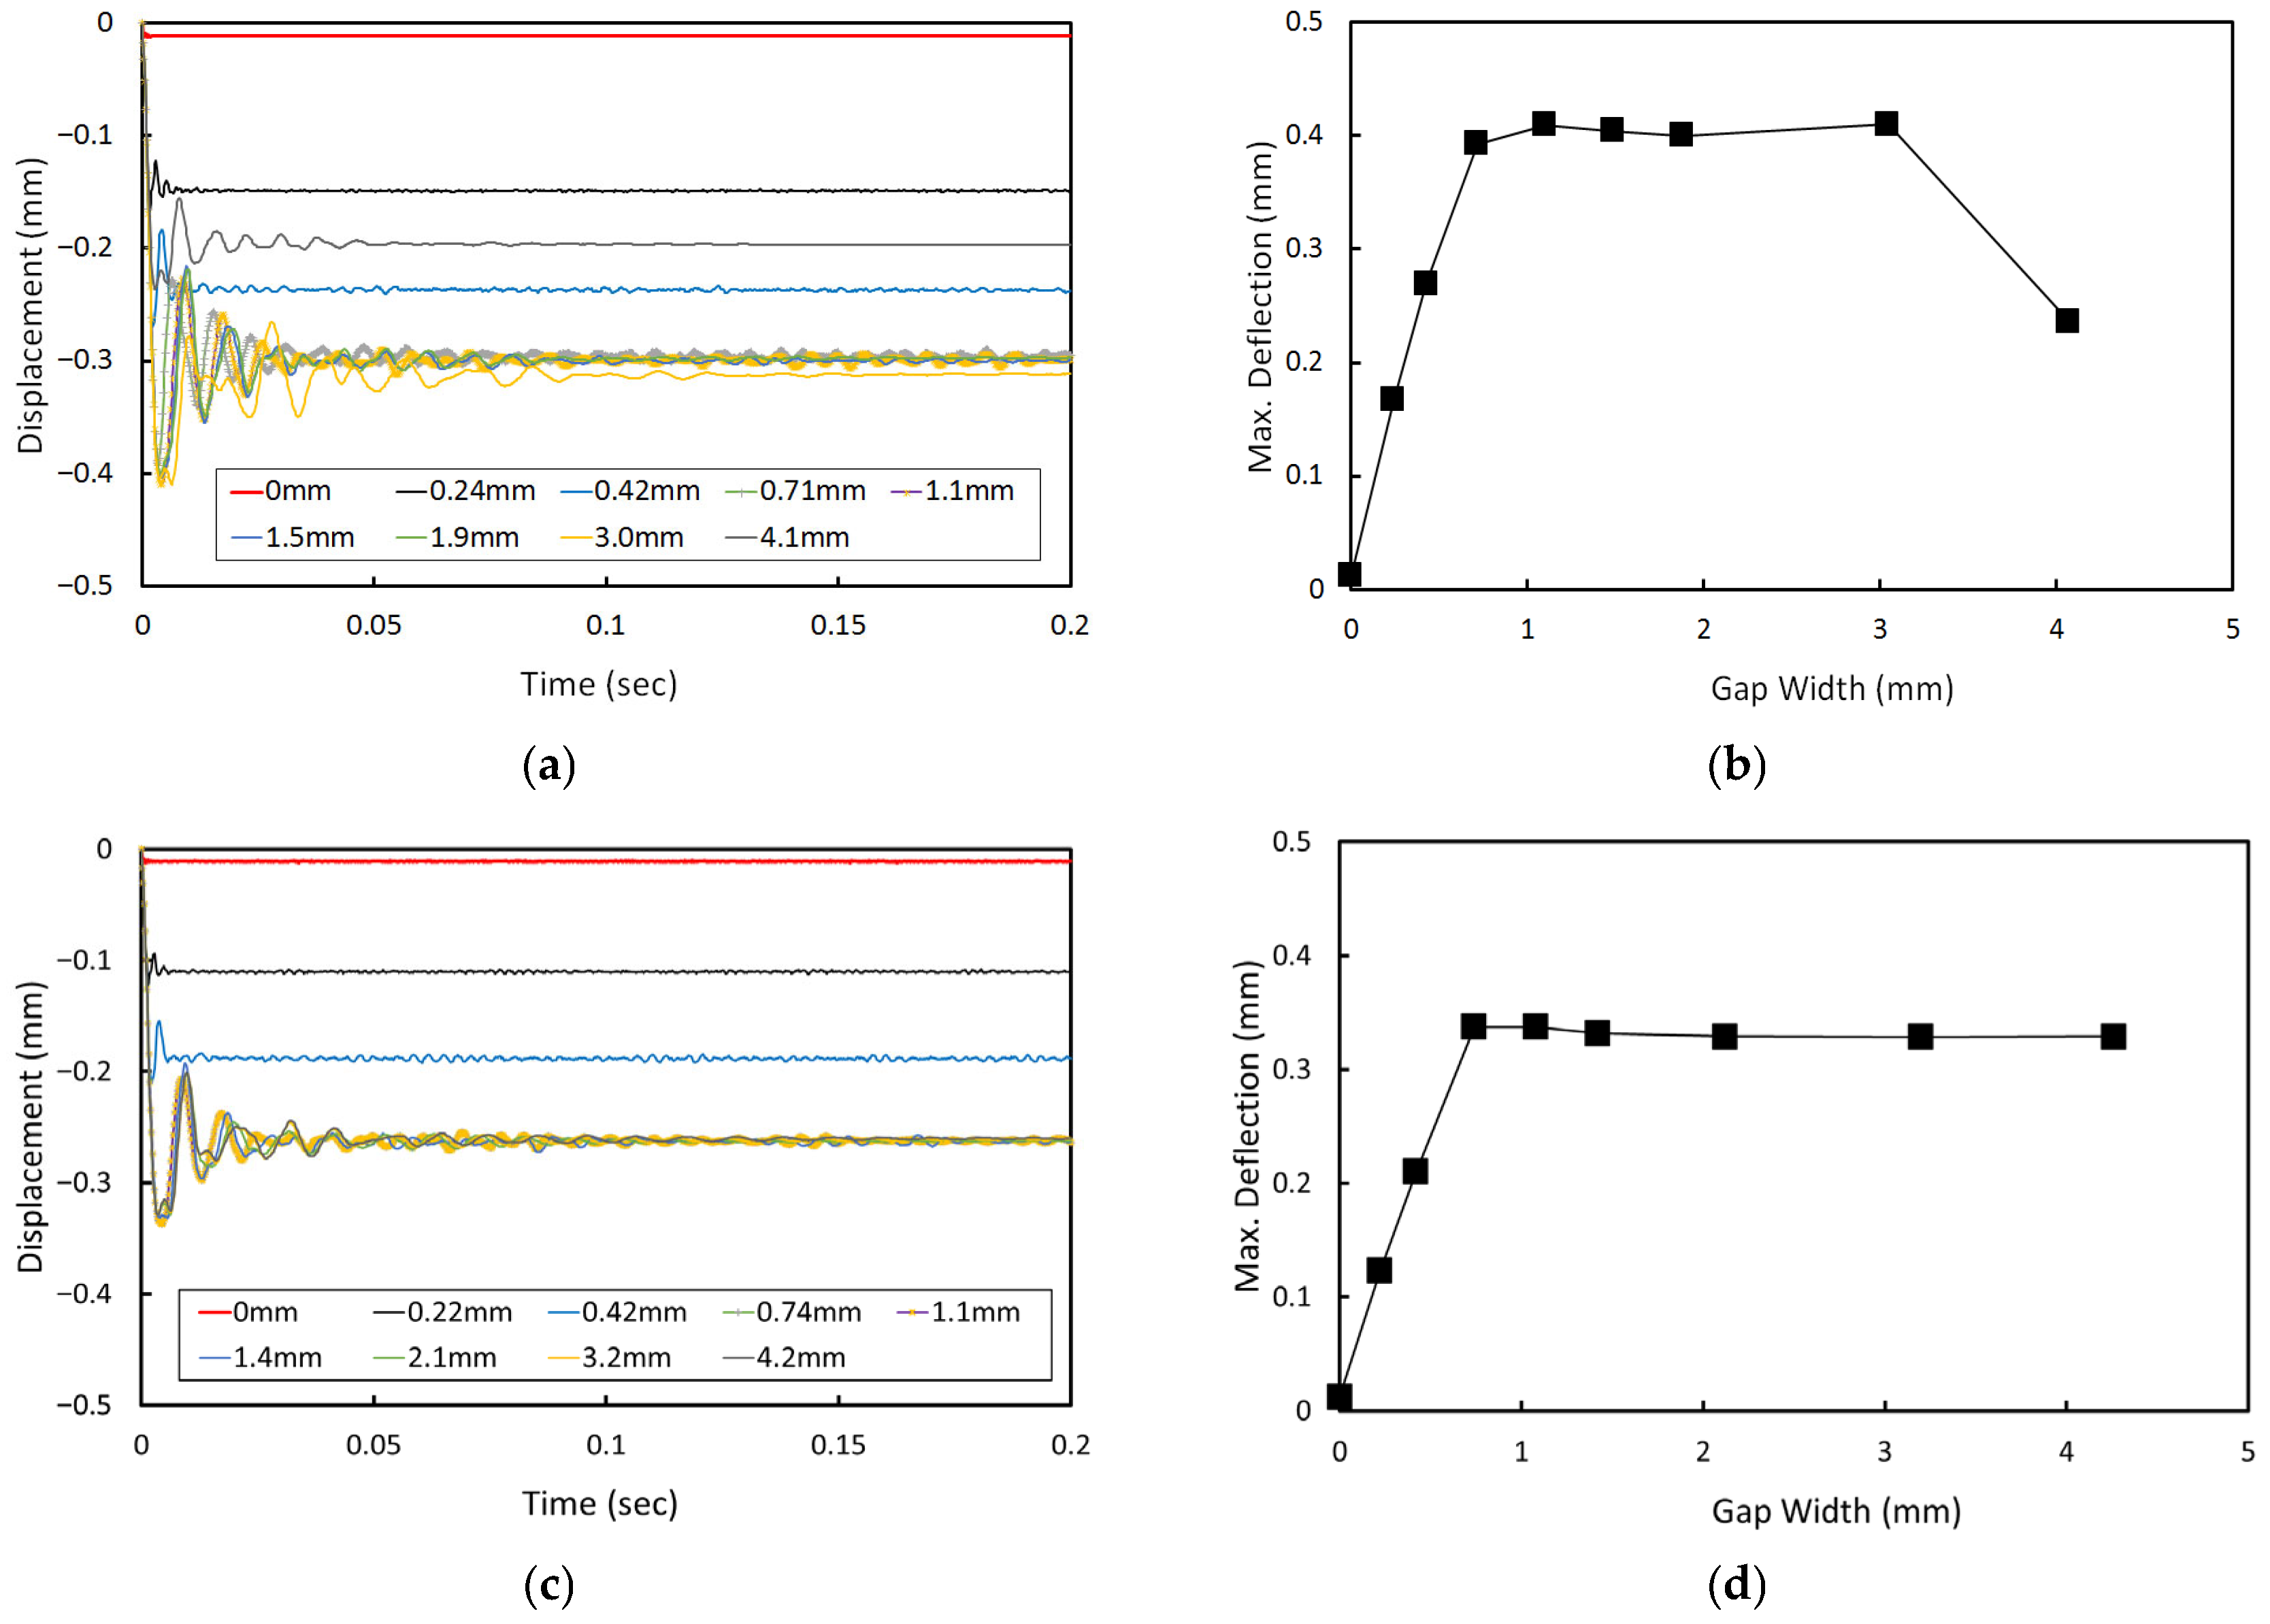
Excessive deflection of the concrete slab can negatively affect ride quality for passengers. Therefore, an analysis of slab deflection was conducted for the PST system with interlayer gaps. In the case where no gap is present (0 mm), the maximum deflection is effectively zero. This is because the underlying layers are modeled with a rigid foundation, providing full vertical support to the slab. As the gap width increases, the slab end loses the support and exhibits cantilever-like behavior, allowing the slab to deflect into the void. Figure 9a shows the variation in slab deflection over time when gaps exist at both the upper and lower interfaces of the grouting layer. As the combined gap width increases, the deflection of the slab also increases. It is also observed that the maximum deflection occurs during the early stage of load application. Figure 9b presents the maximum slab deflection as a function of the combined gap width. Even very small gaps at both interfaces lead to an increase in the slab’s maximum deflection. For example, when the total gap width is approximately 0.7 mm, the maximum deflection reaches about 0.4 mm. However, similar to the trend observed in the principal stress analysis, further increases in gap width do not lead to a significant increase in slab deflection.
Figure 9c,d present the time-dependent variation in slab deflection and the maximum deflection of the slab, respectively, for the as-was model. As the gap width increases, the deflection of the slab also increases; however, when the gap width exceeds approximately 0.74 mm, the vibration pattern of the deflection stabilizes. Additionally, even very small gaps at both the upper and lower interfaces of the grouting layer result in an increase in maximum slab deflection. For instance, when the combined gap width is around 0.74 mm, the maximum deflection reaches approximately 0.35 mm. Nevertheless, similar to the trend observed in the as-is model, further increases in gap width do not produce a noticeable increase in deflection.

3.2. Behavior of Grouting Layer

Figure 10a shows the variation in principal stress over time within the grouting layer according to the combined gap width at the upper and lower interfaces, for the case where gaps are present on both sides. Similarly to the slab stress analysis, the time-dependent stress variation was evaluated at the location where the maximum principal stress occurs in the grouting layer. The peak stress is observed during the early stage of load application and tends to increase as the combined gap width increases. In addition, as the gap width becomes larger, the vibration wavelength of the grouting layer increases, leading to a reduction in vibration frequency. This implies that the number of contacts between the grouting layer and the adjacent layers per unit time decreases with wider gaps. However, the stress induced in the grouting layer during the initial contact tends to increase as the gap widens. Figure 10b presents the maximum principal stress in the grouting layer with respect to the combined gap width. As the gap width increases, the maximum stress also increases. However, when the combined gap width exceeds approximately 2 mm, a slight decreasing trend is observed. Considering the typical flexural strength of cement mortar, approximately 4.5 MPa, it is unlikely that the interlayer gap conditions would cause immediate cracking in the grouting layer. Nevertheless, as the stress levels in the grouting layer are higher than those observed in the concrete slab, the potential for early fatigue cracking is elevated. This corresponds with field observations, where damage such as corner breaks in the grouting layer is frequently reported.
Figure 10c,d present the time-dependent stress variation and the maximum stress in the grouting layer, respectively, for the as-was model. When interlayer gaps are present, the maximum stress tends to occur during the early stage of load application and increases with larger gap widths. In contrast, when no interlayer gap exists, the maximum stress occurs at an arbitrary point during the loading period. Furthermore, compared to the as-is model, the as-was model exhibits significantly greater stress oscillations in the absence of gaps. Regarding the relationship between gap width and the maximum principal stress in the grouting layer, the as-was model shows relatively high stress levels even without interlayer gaps. Interestingly, the presence of a small gap initially reduces the peak stress sharply. However, as the gap width increases, the maximum stress gradually rises again. When the combined gap width exceeds approximately 1.5 mm, the rate of increase becomes marginal. Notably, if the combined gap width surpasses 4 mm, the maximum stress exceeds 4.5 MPa, indicating a potential risk of cracking in the grouting layer.

4. Effects of Gap Location

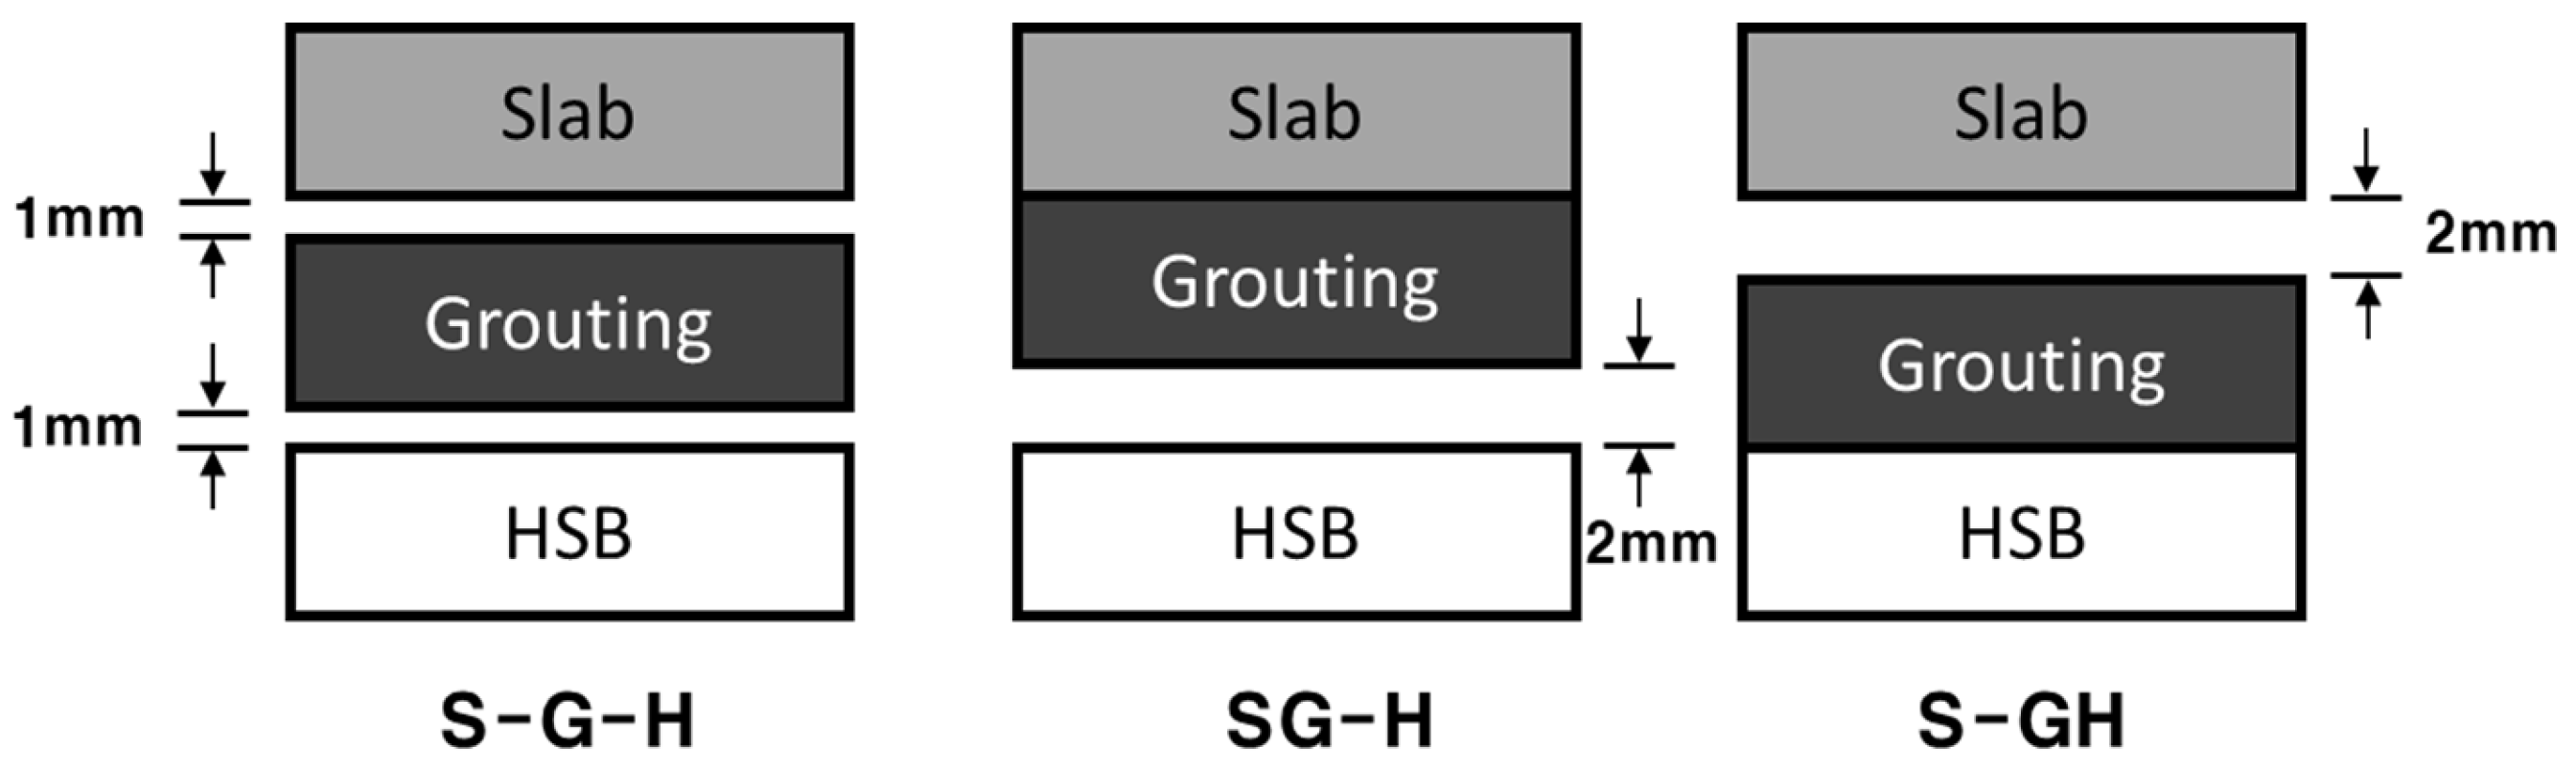
To investigate the effects of interlayer gap location, three cases were classified based on the presence or absence of gaps at the interfaces between the slab (S), grouting layer (G), and HSB (H), as illustrated in Figure 11. The first case (S-G-H) considers gaps at both the upper and lower interfaces of the grouting layer, corresponding to the previously analyzed conditions. The second case (SG-H) includes a gap only at the lower interface between the grouting layer and HSB, while the third case (S-GH) includes a gap only at the upper interface between the concrete slab and the grouting layer. For all cases, the combined gap width was set to 2 mm. Even when no physical gap was present at an interface, it was modeled as unbonded to represent the weakest interfacial condition of the PST system.

4.1. Behavior of Concrete Slab

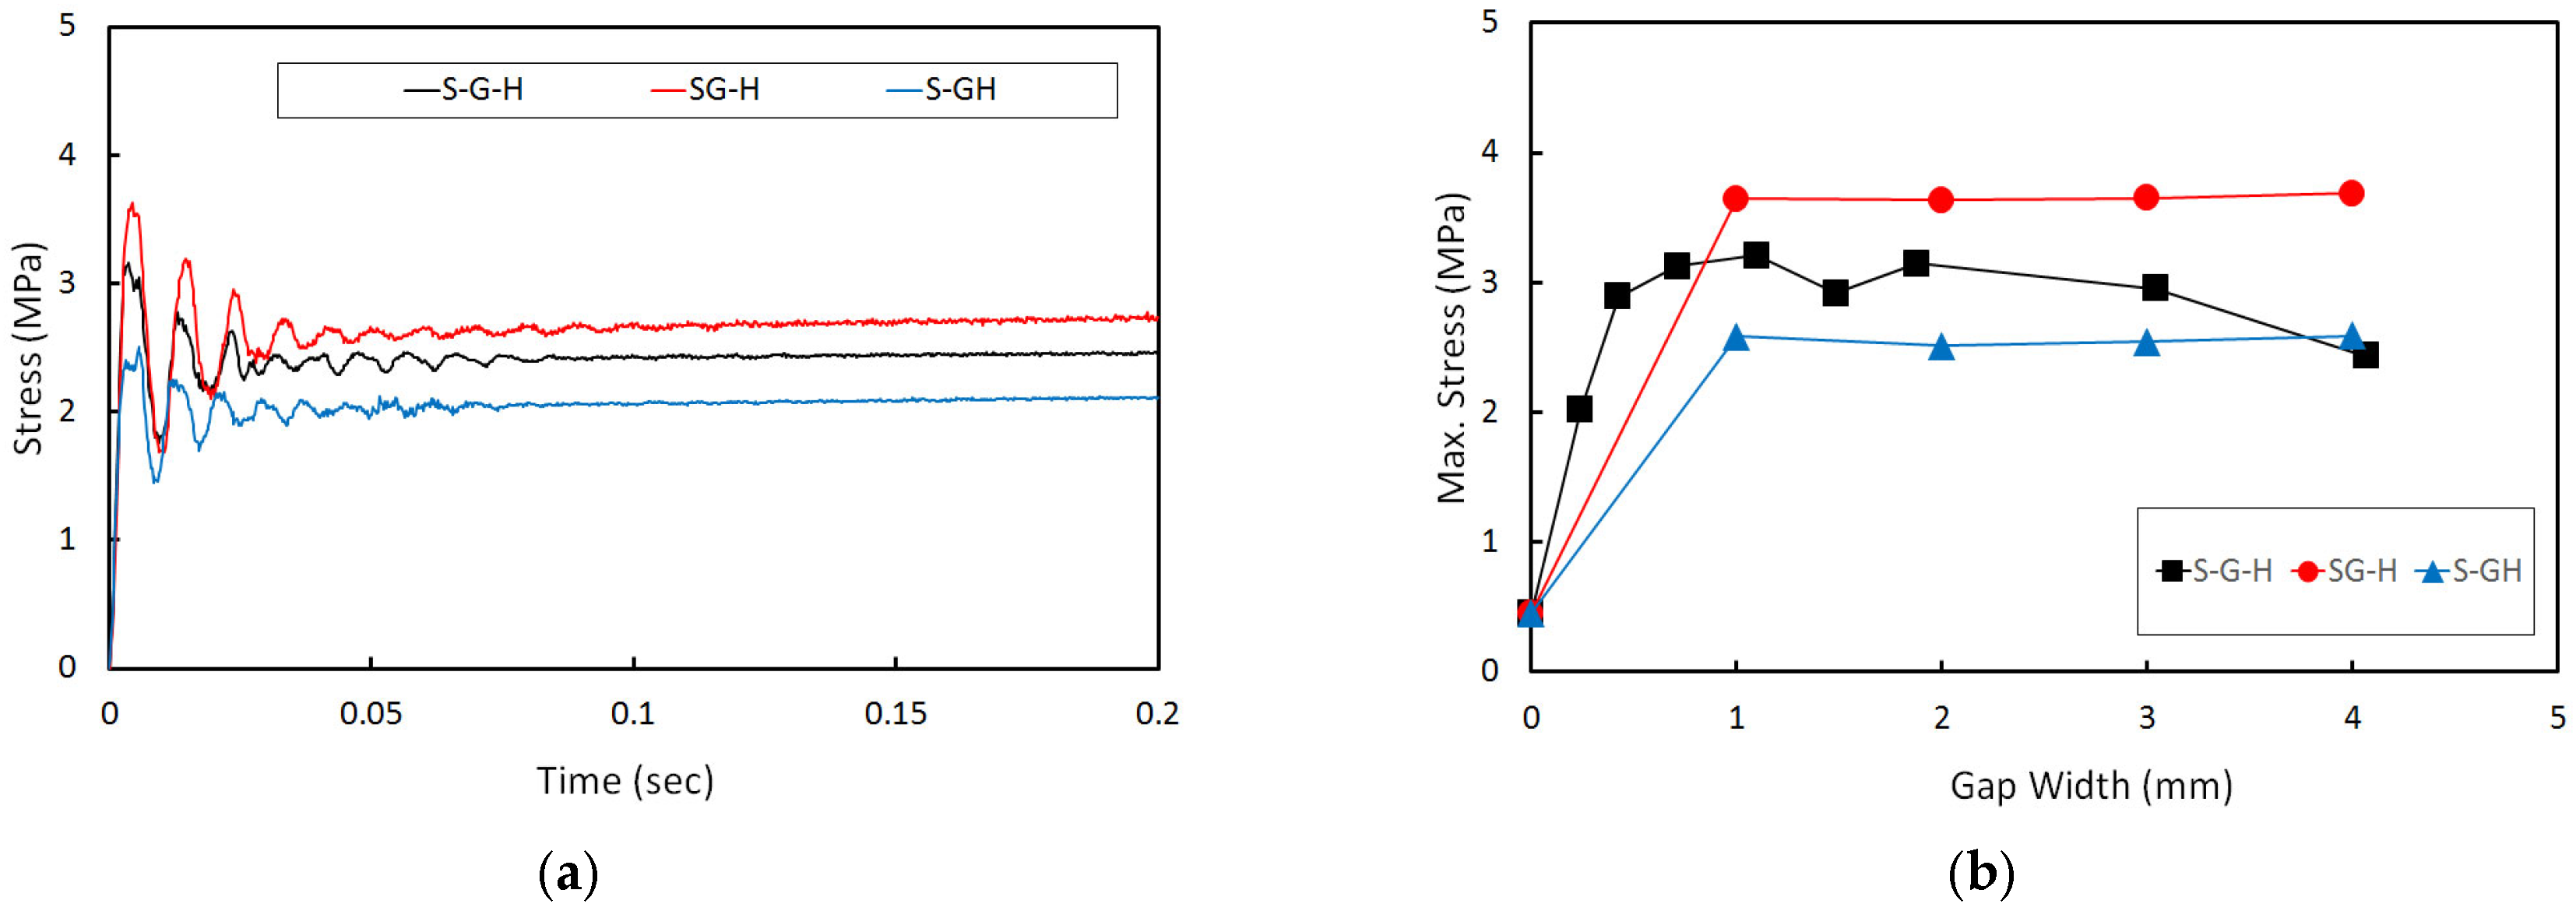
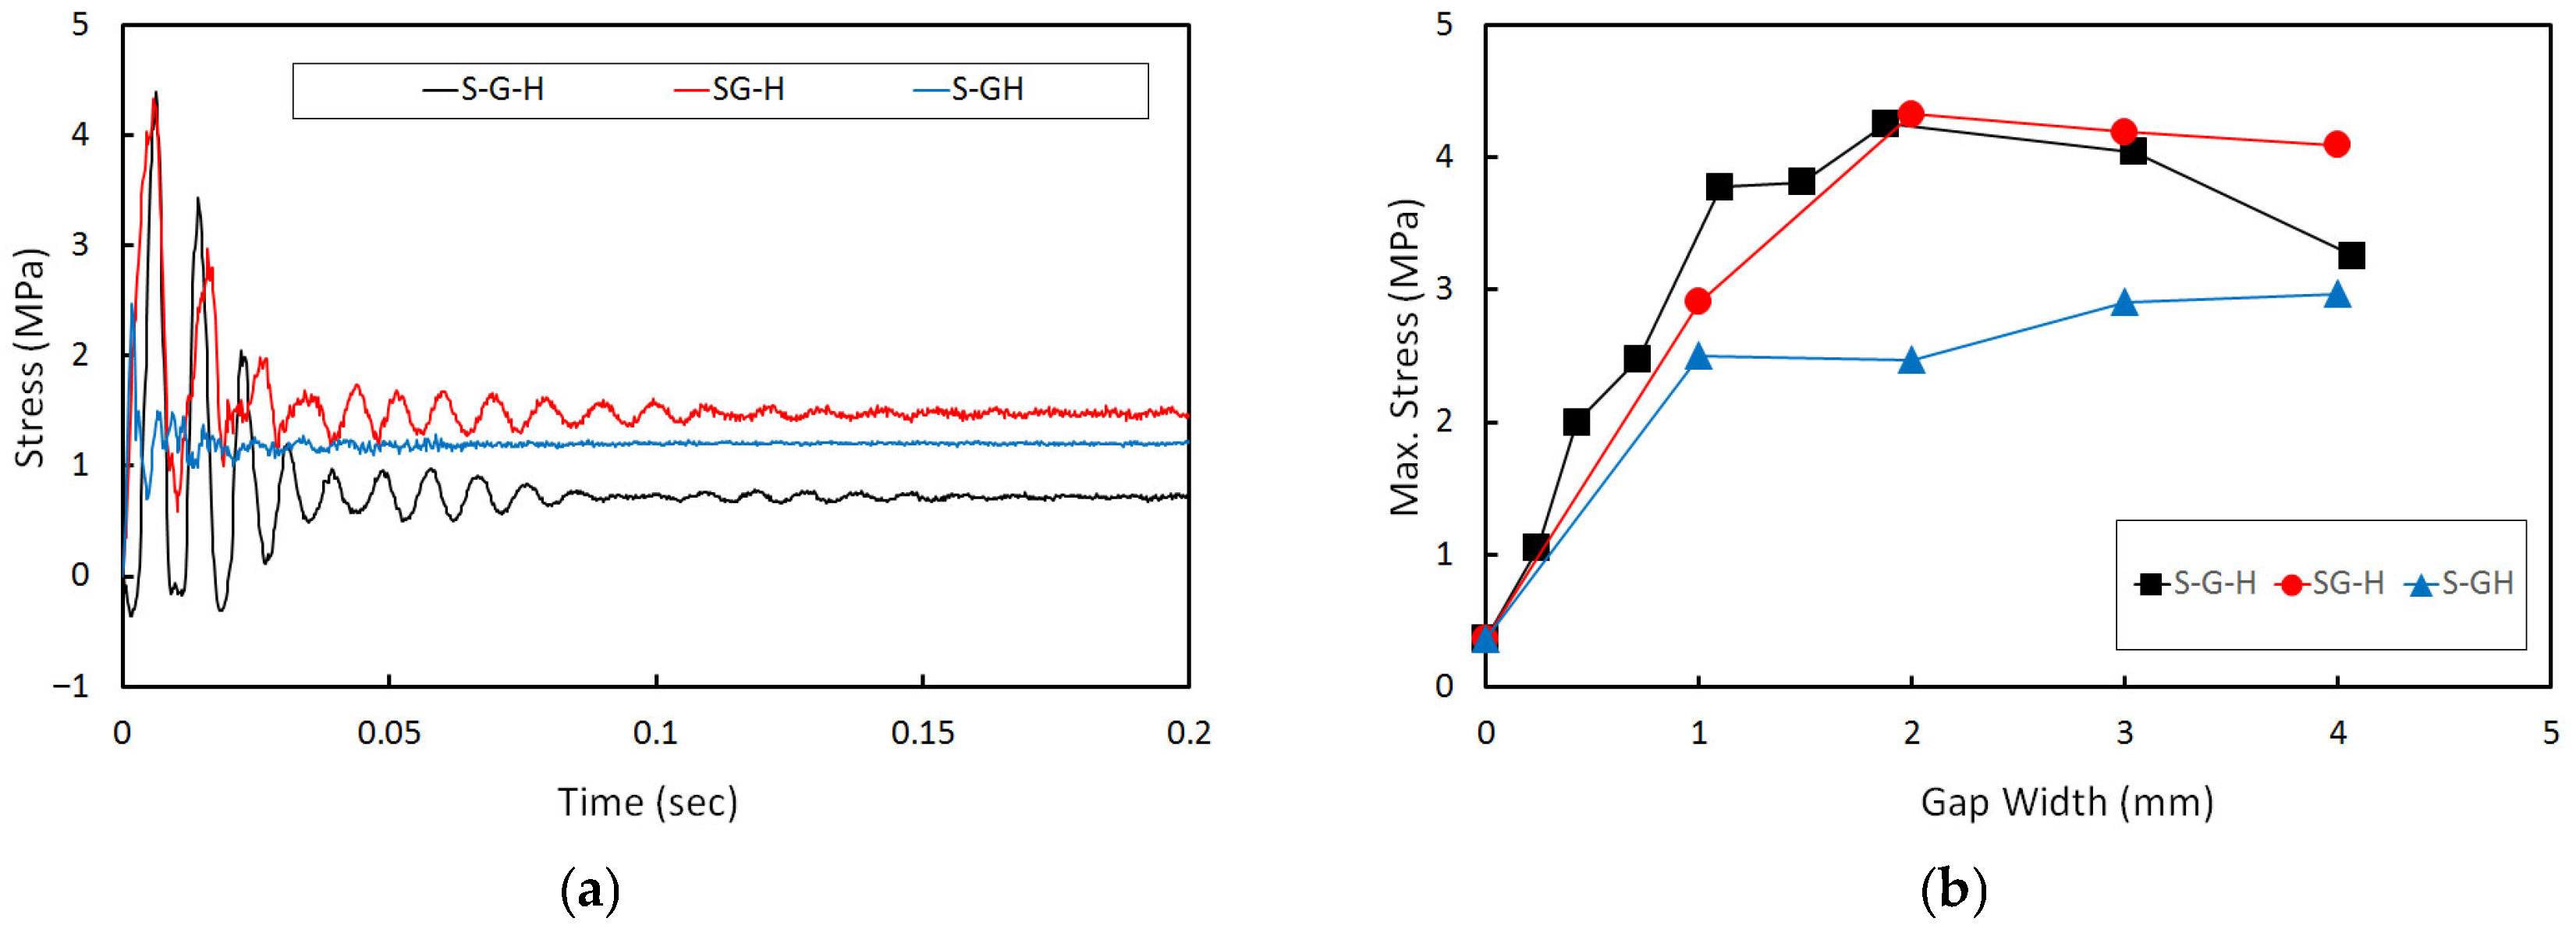
Figure 12a illustrates the time-dependent variation of principal stress at the location of maximum stress in the slab for the as-is model, under different interlayer gap location conditions in the PST system. While the vibration frequency of the slab appears similar across all three cases, the maximum stress occurring at the early stage of load application is highest in the SG-H case, where the gap exists only between the grouting layer and the HSB. In contrast, the lowest maximum stress is observed in the S-GH case, where the gap exists only between the slab and the grouting layer. Figure 12b compares the maximum principal stress in the slab with respect to gap width for the different interlayer gap configurations for the as-is model. Cases with a combined gap width smaller than 1 mm were excluded from the comparison. When the total gap width is held constant, the slab exhibits the highest maximum stress in the SG-H condition and the lowest in the S-GH condition. However, in all cases, the maximum stress remains below the typical flexural strength of concrete, approximately 4.5 MPa.
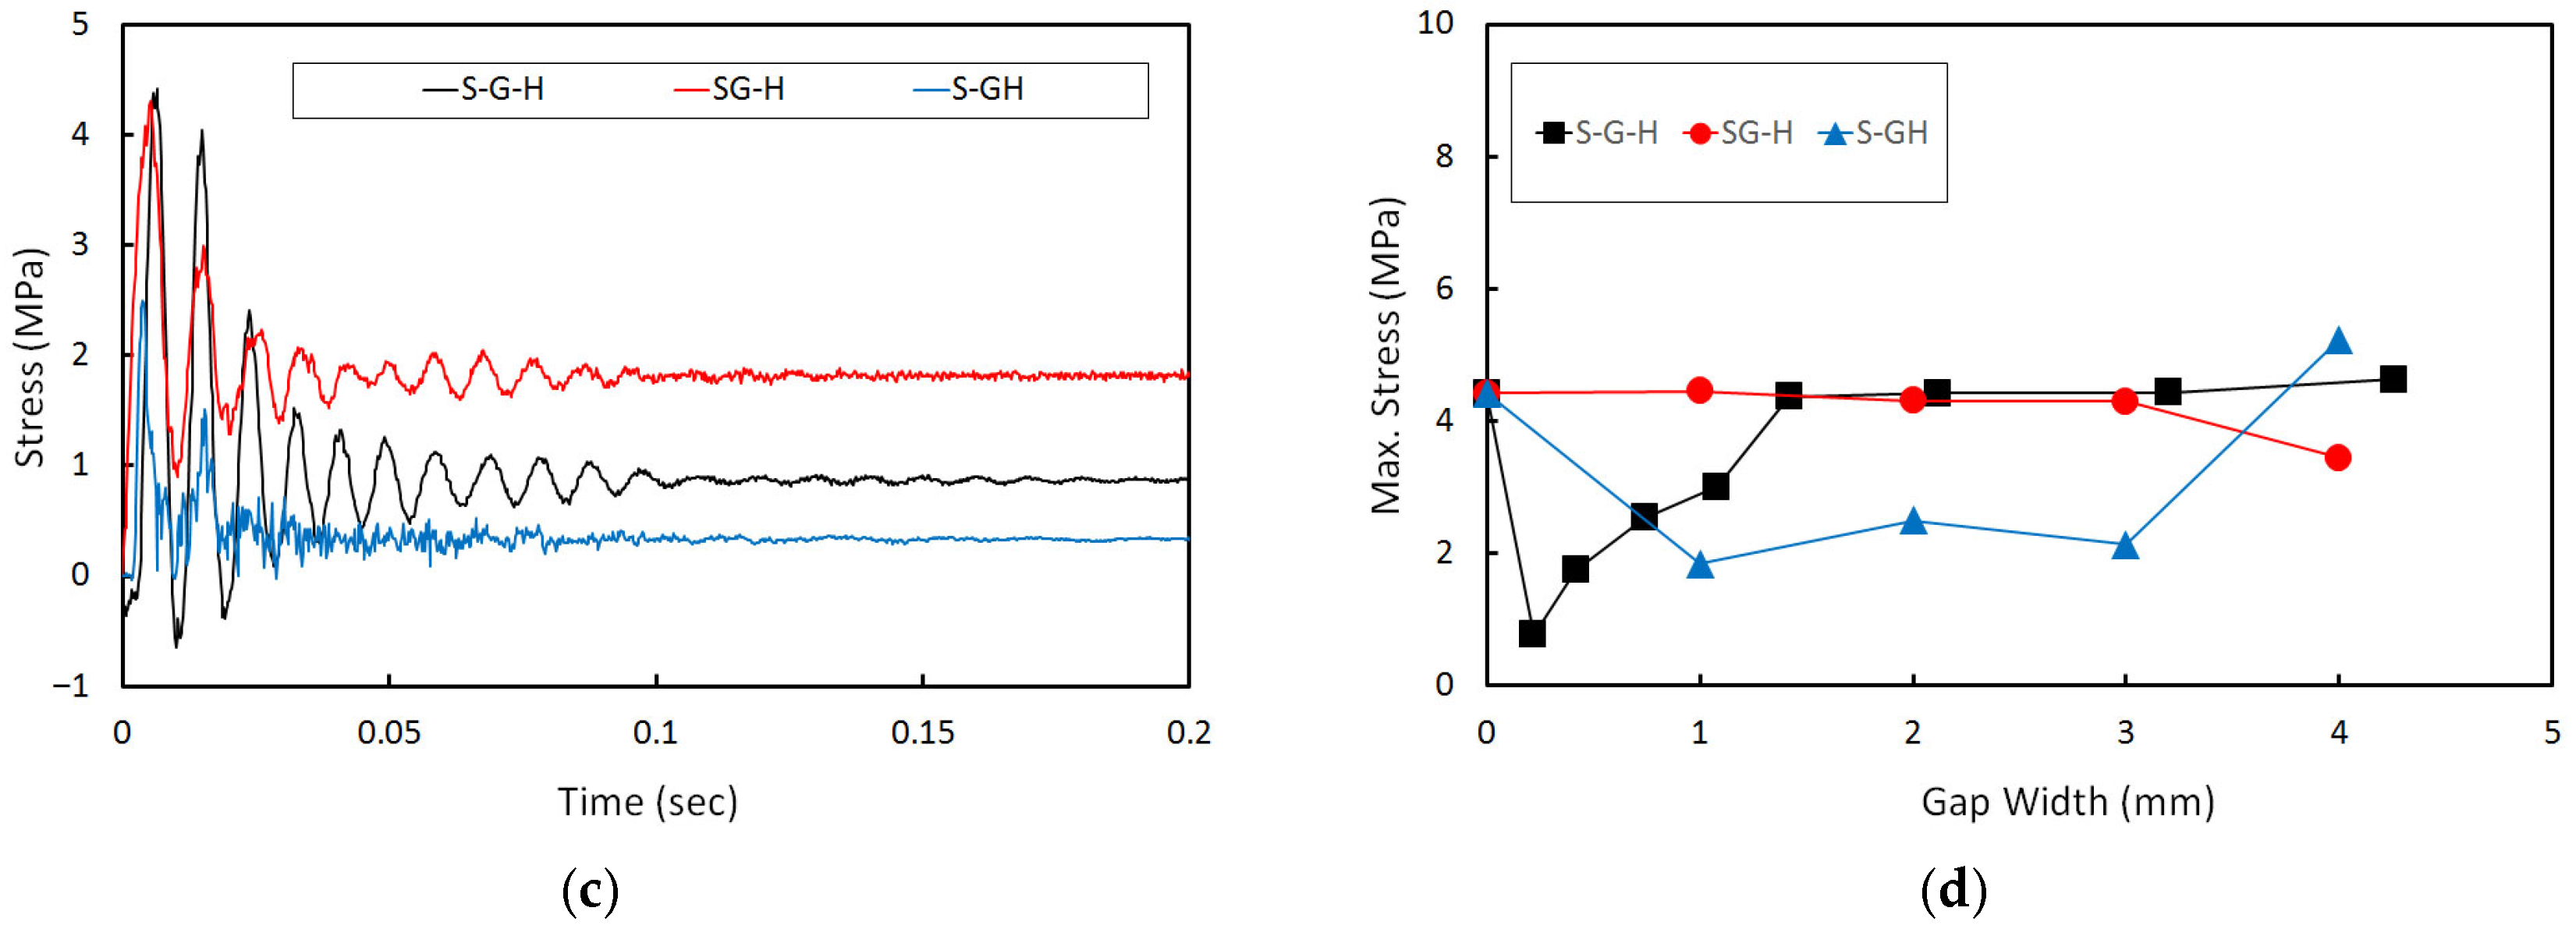
Figure 12c,d show the time-dependent stress variation and the maximum stress in the concrete slab, respectively, for the as-was model. The stress responses of the slab under the S-G-H and SG-H conditions exhibit similar trends. However, under the S-GH condition, significantly higher stress is observed. In particular, the maximum stress during the early stage of load application exceeds 4.5 MPa, indicating a potential risk of cracking in the slab. When comparing the maximum principal stress in the slab with respect to gap width, both the S-G-H and SG-H show increasing stress as the gap widens, but the stress tends to stabilize once the gap width exceeds approximately 1 mm. In contrast, under the S-GH condition, the maximum stress in the slab continues to increase with larger gap widths. Therefore, in such cases, repair may be required to mitigate stress and prevent potential cracking in the slab.
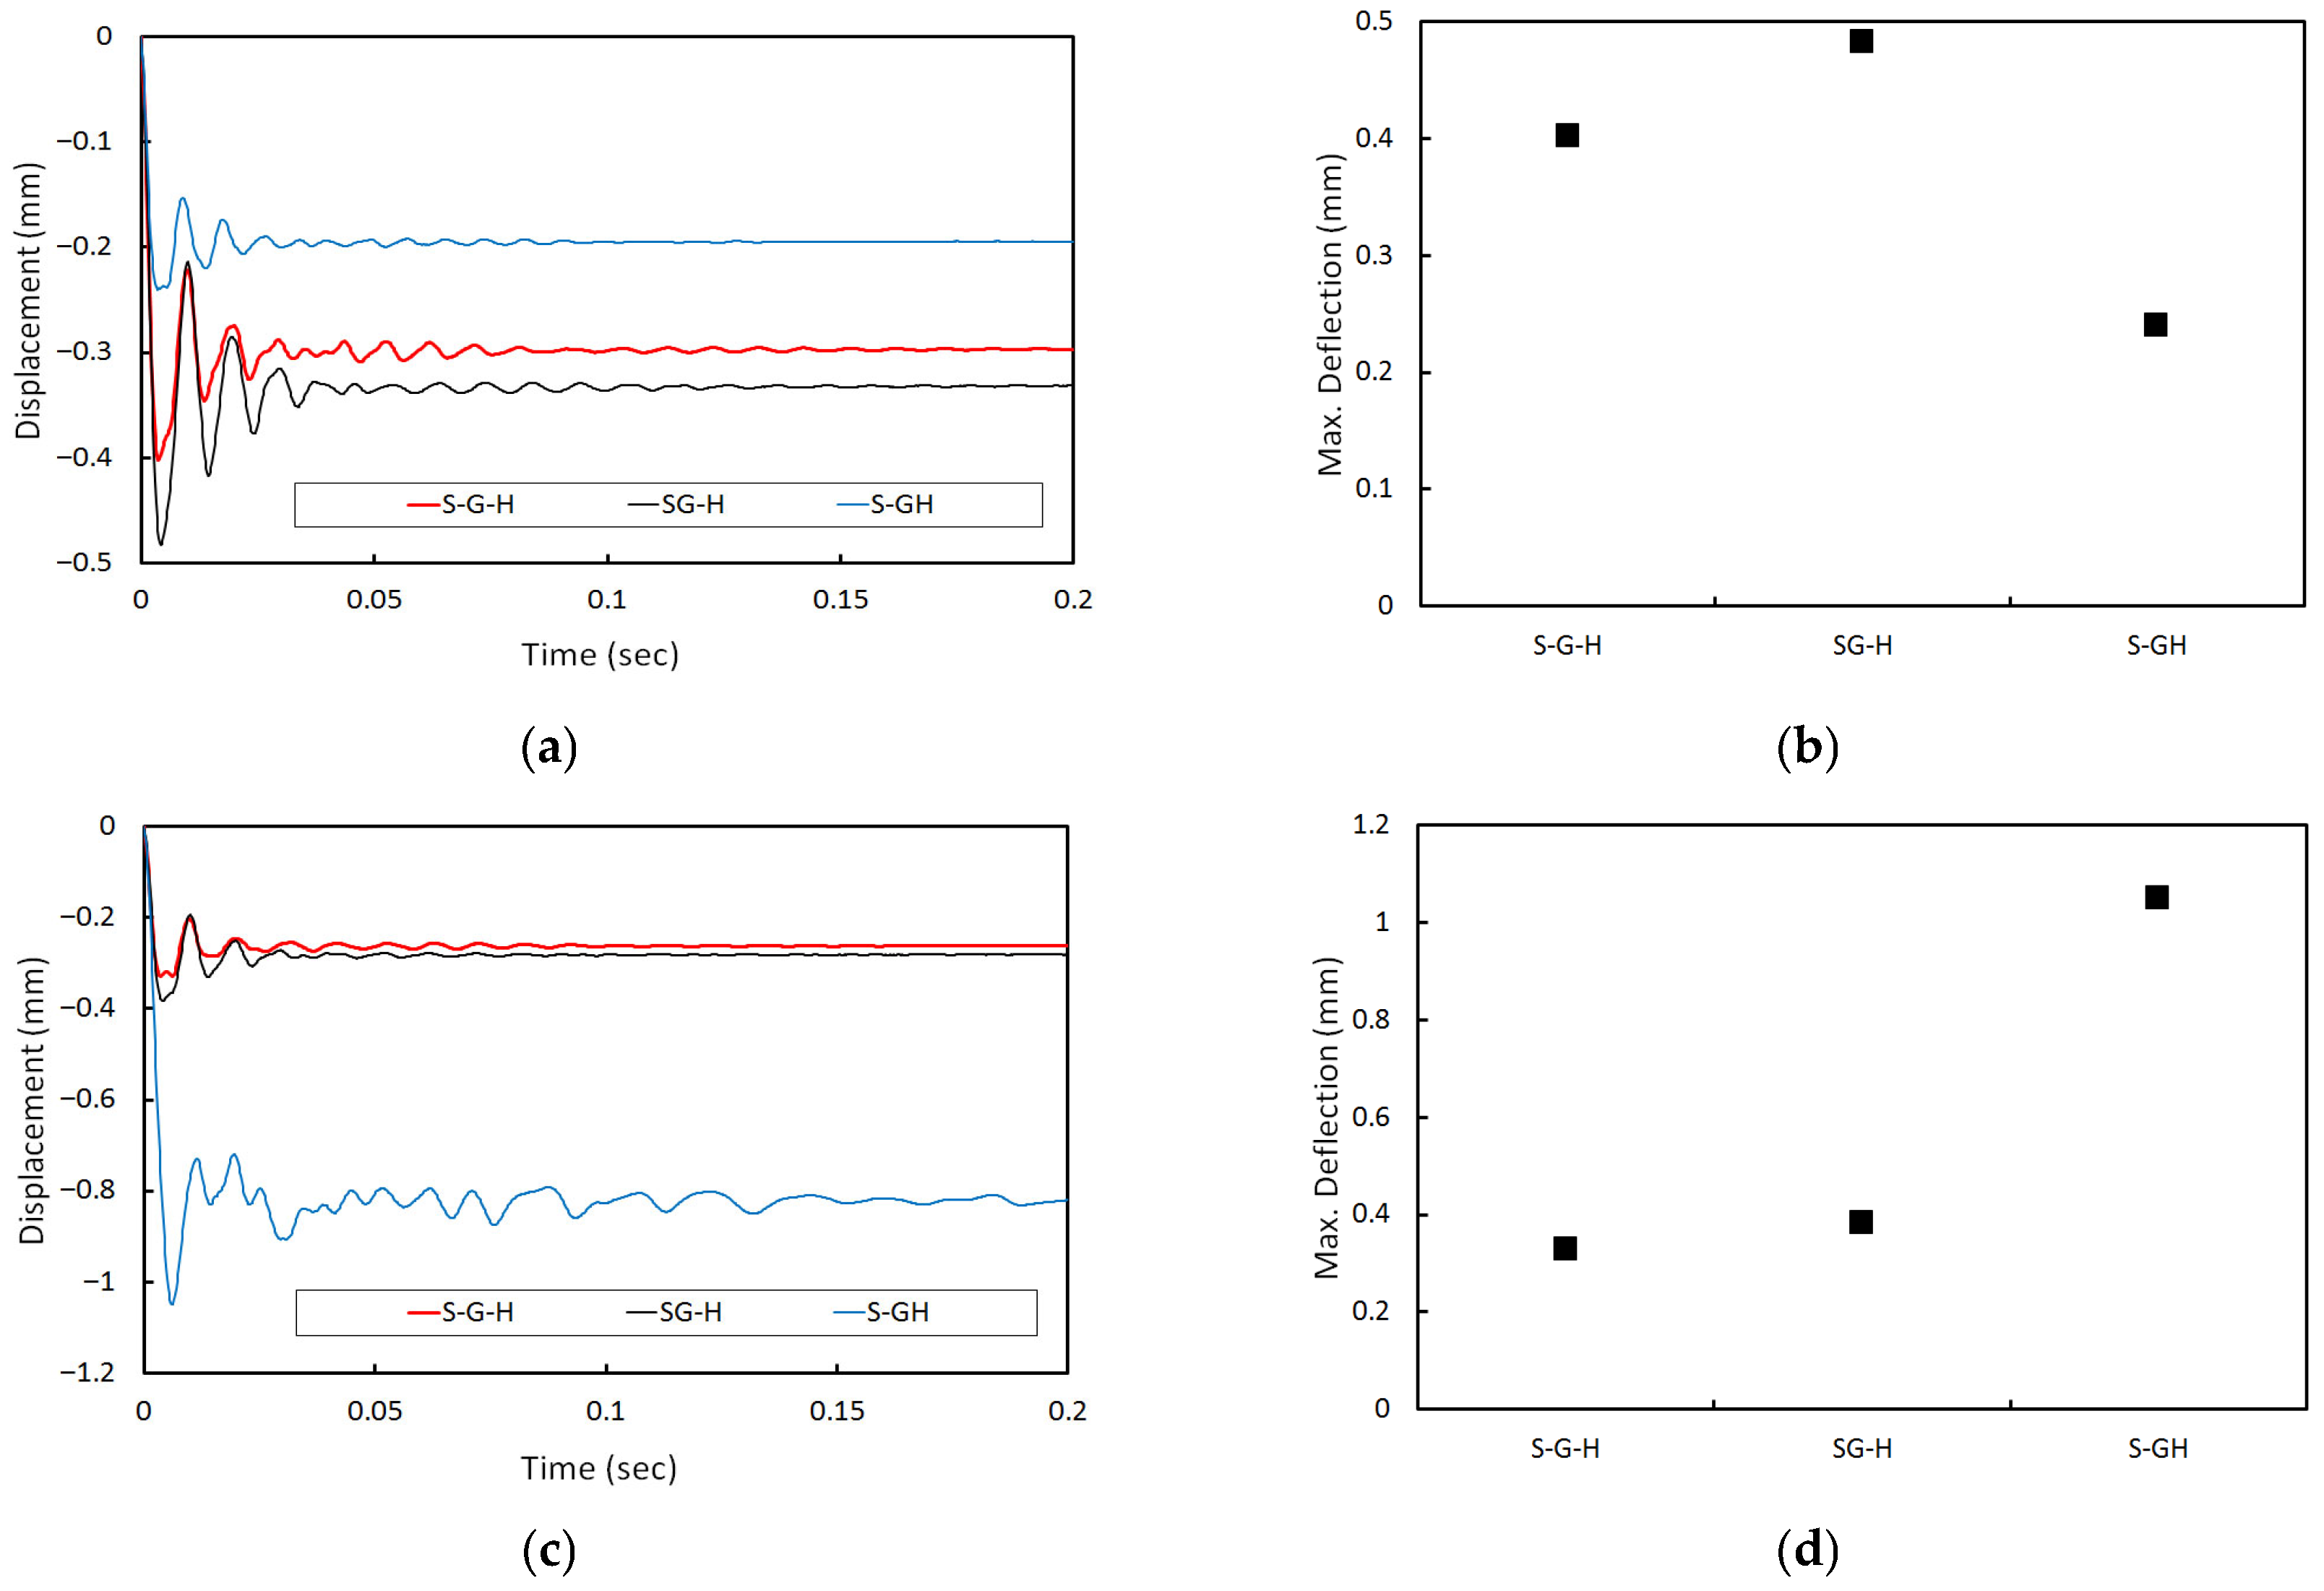
Figure 13a presents the time-dependent variation in slab deflection at the loading point under different interlayer gap conditions in the as-is modeled PST system. The largest deflection occurs in the SG-H case. Conversely, the smallest deflection is observed in the S-GH case. Figure 13b compares the maximum deflection of the slab at the loading point for each interlayer gap condition for the as-is model. The results indicate that the maximum deflection is greatest in SG-H case, and smallest in the S-GH case.
Figure 13c,d illustrate the time-dependent variation in slab deflection and the maximum deflection of the slab, respectively, for the as-was model. Similarly to the trend in slab stress, the S-GH condition results in the greatest dynamic deflection of the concrete slab. In contrast, the SG-H and S-G-H show relatively small and similar levels of deflection. When comparing the maximum dynamic deflection of the slab, the S-GH condition exhibits the largest value, whereas the S-G-H and SG-H cases show considerably smaller deflections.

4.2. Behavior of Grouting Layer

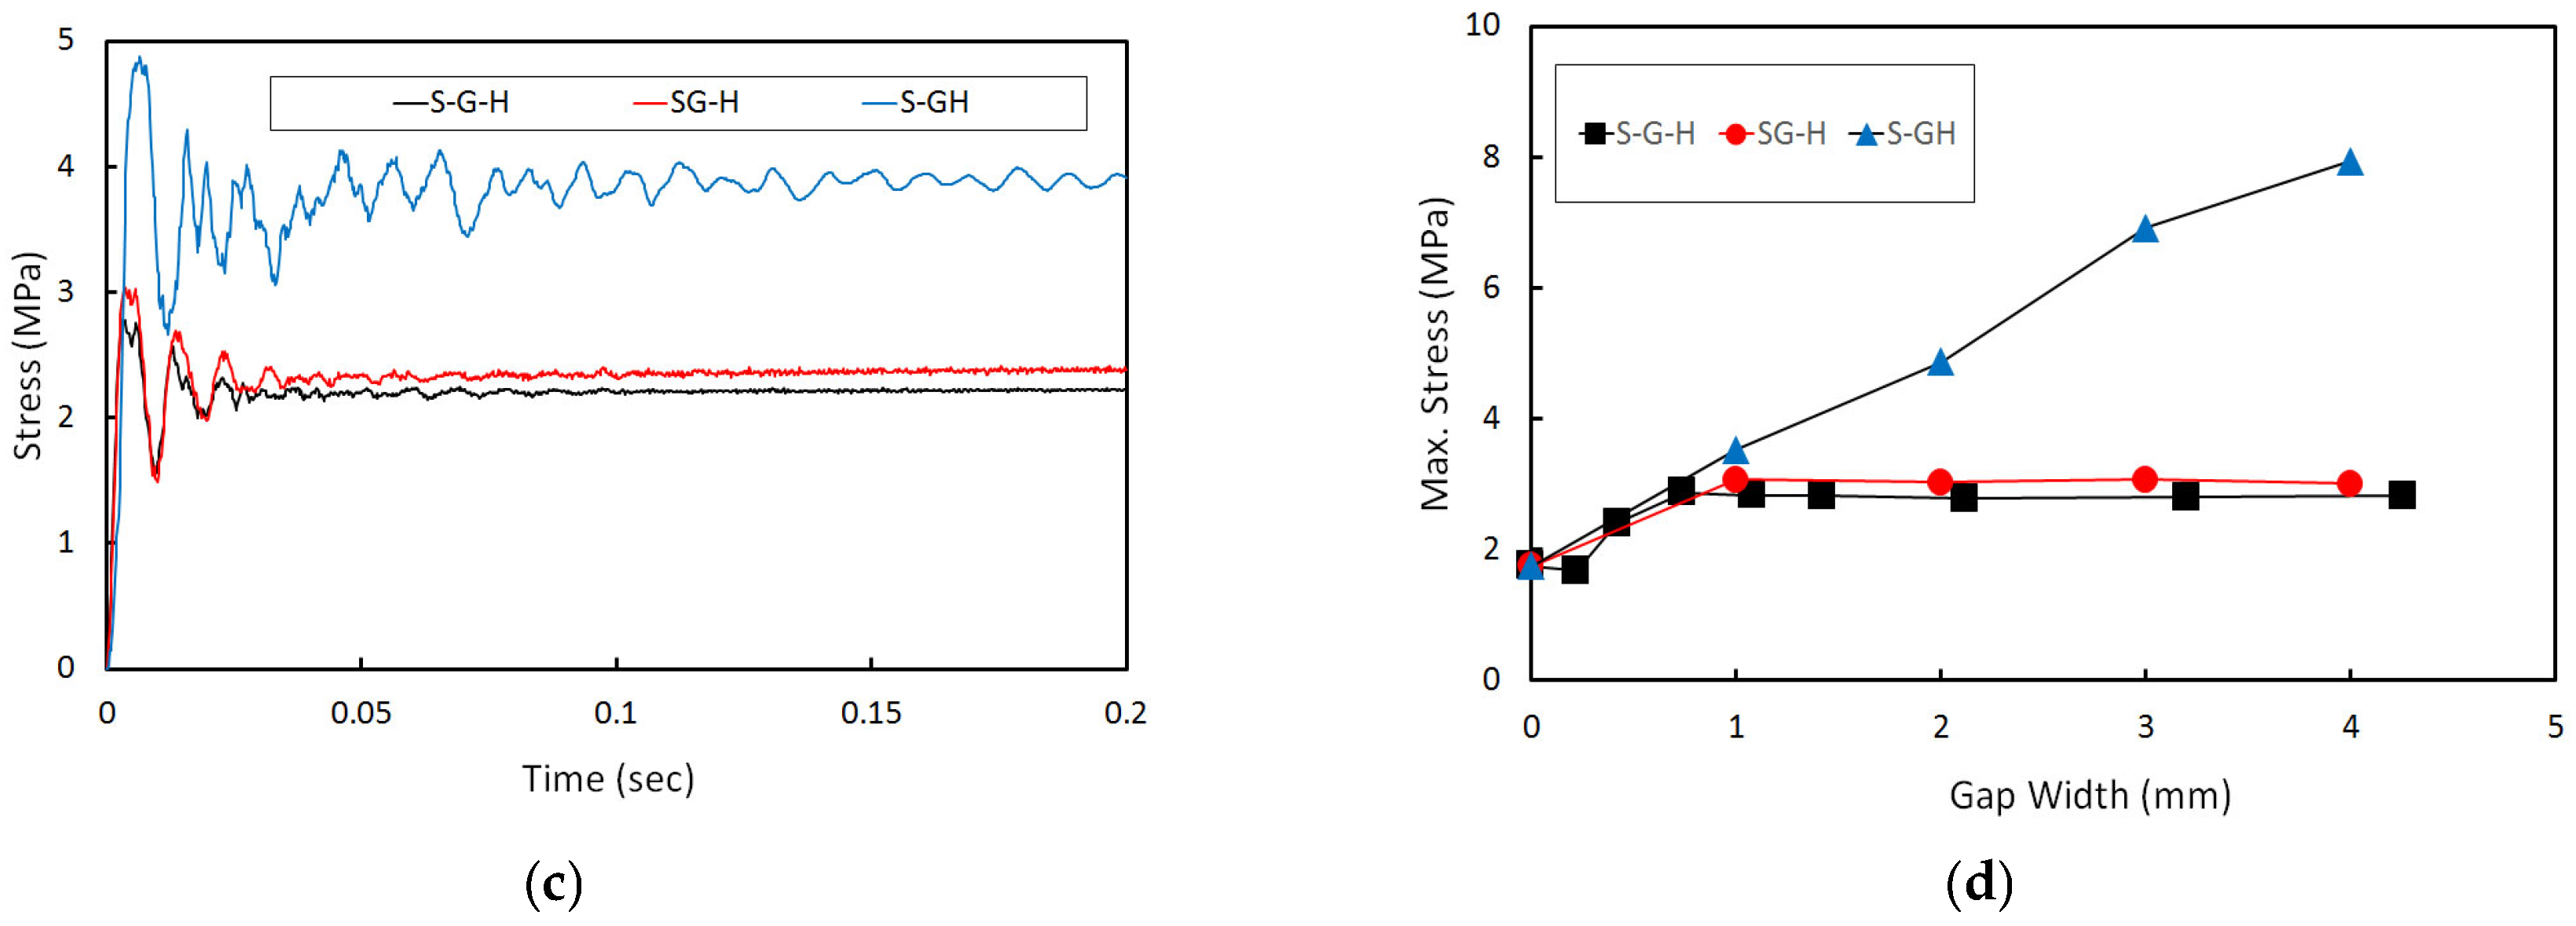
Figure 14a shows the variation in principal stress within the grouting layer under different interlayer gap conditions in the as-is model. The maximum principal stress in the grouting layer occurs during the early stage of load application. Similar stress levels are observed in the S-G-H and SG-H cases, whereas the S-GH case exhibits a notably lower peak value during the initial loading phase, indicating that the grouting layer experiences less stress under this condition. Figure 14b compares the maximum principal stress in the grouting layer as a function of gap width for each interlayer gap condition. For smaller gap widths, the highest stress is observed in the S-G-H case, while the lowest occurs in the S-GH case. However, when the gap width exceeds approximately 2 mm, the SG-H condition results in the highest stress, with the S-GH condition consistently producing the lowest stress. When interlayer gaps occur only between the slab and the grouting layer, and no gap exists between the grouting layer and the HSB, the maximum principal stress in the grouting layer is reduced by up to approximately 40% compared to conditions with gaps at both interfaces or only at the bottom interface. Therefore, for the as-is model system, if interlayer gap formation cannot be completely prevented, encouraging gap development exclusively at the upper interface may significantly mitigate stress accumulation in the grouting layer.
Figure 14c,d present the time-dependent stress variation and the maximum stress in the grouting layer, respectively, for the as-was model. The maximum stress in the grouting layer occurs during the early stage of load application. Under the S-G-H and SG-H conditions, the peak stress is induced at the initial loading phase, with both cases showing similar stress levels. In contrast, the S-GH condition exhibits a notable reduction in stress. When comparing the maximum principal stress with respect to gap width under different interlayer conditions, the SG-H demonstrates relatively consistent maximum stress levels regardless of the gap width. From approximately 1.5 mm and beyond, the S-G-H case begins to exhibit stress behavior to that of SG-H. In the S-GH condition, although the maximum stress remains relatively low even as the gap width increases, a sharp rise in stress is observed as the gap width increases from 3 mm to 4 mm, exceeding 4.5 MPa and indicating a potential risk of cracking in the grouting layer.

5. Effects of Gap Depth

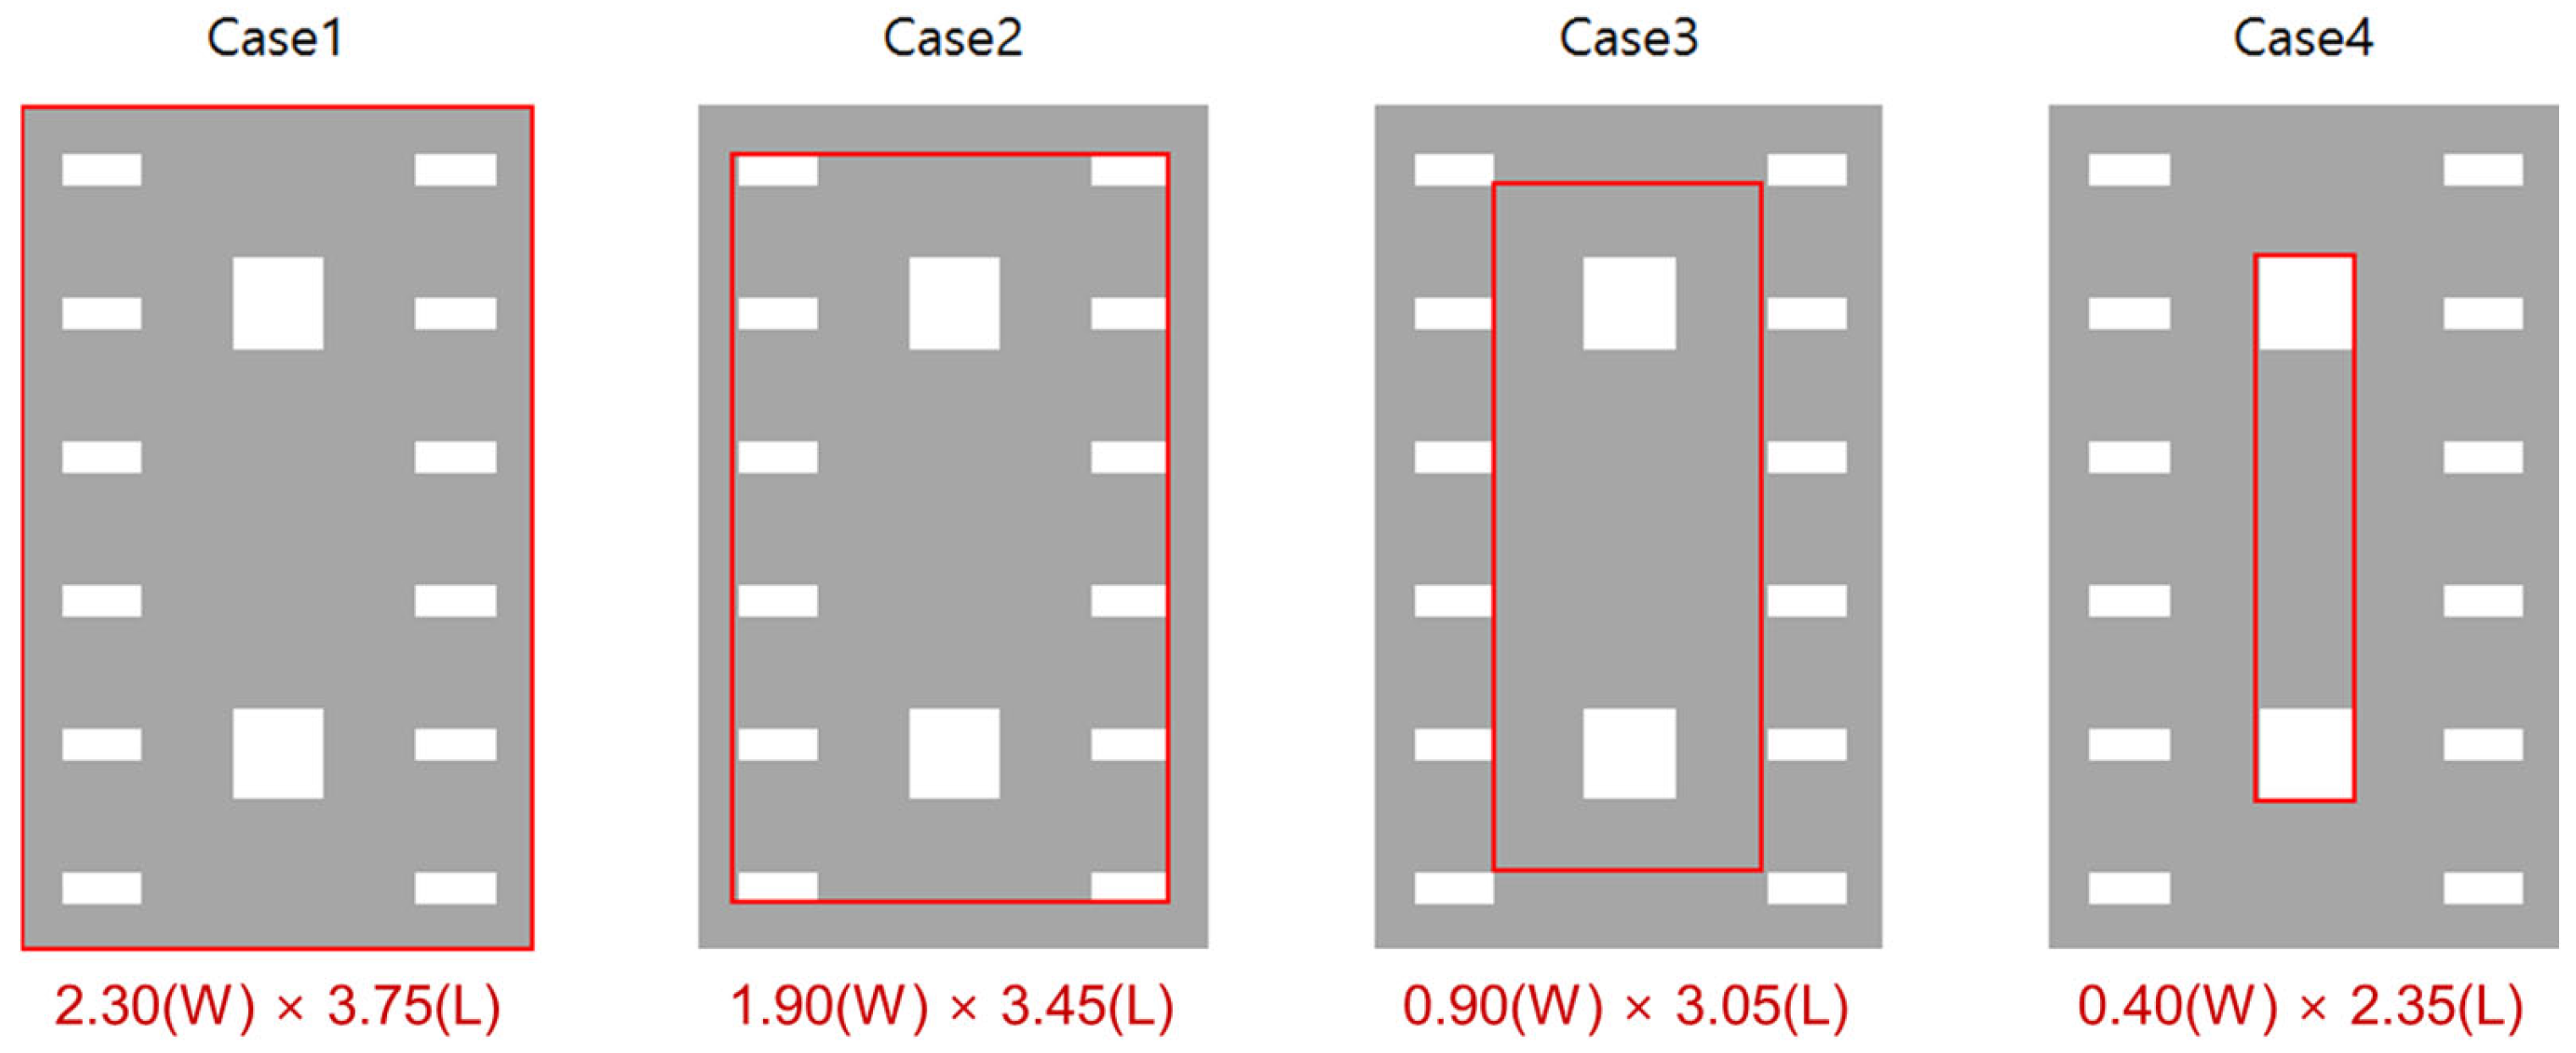
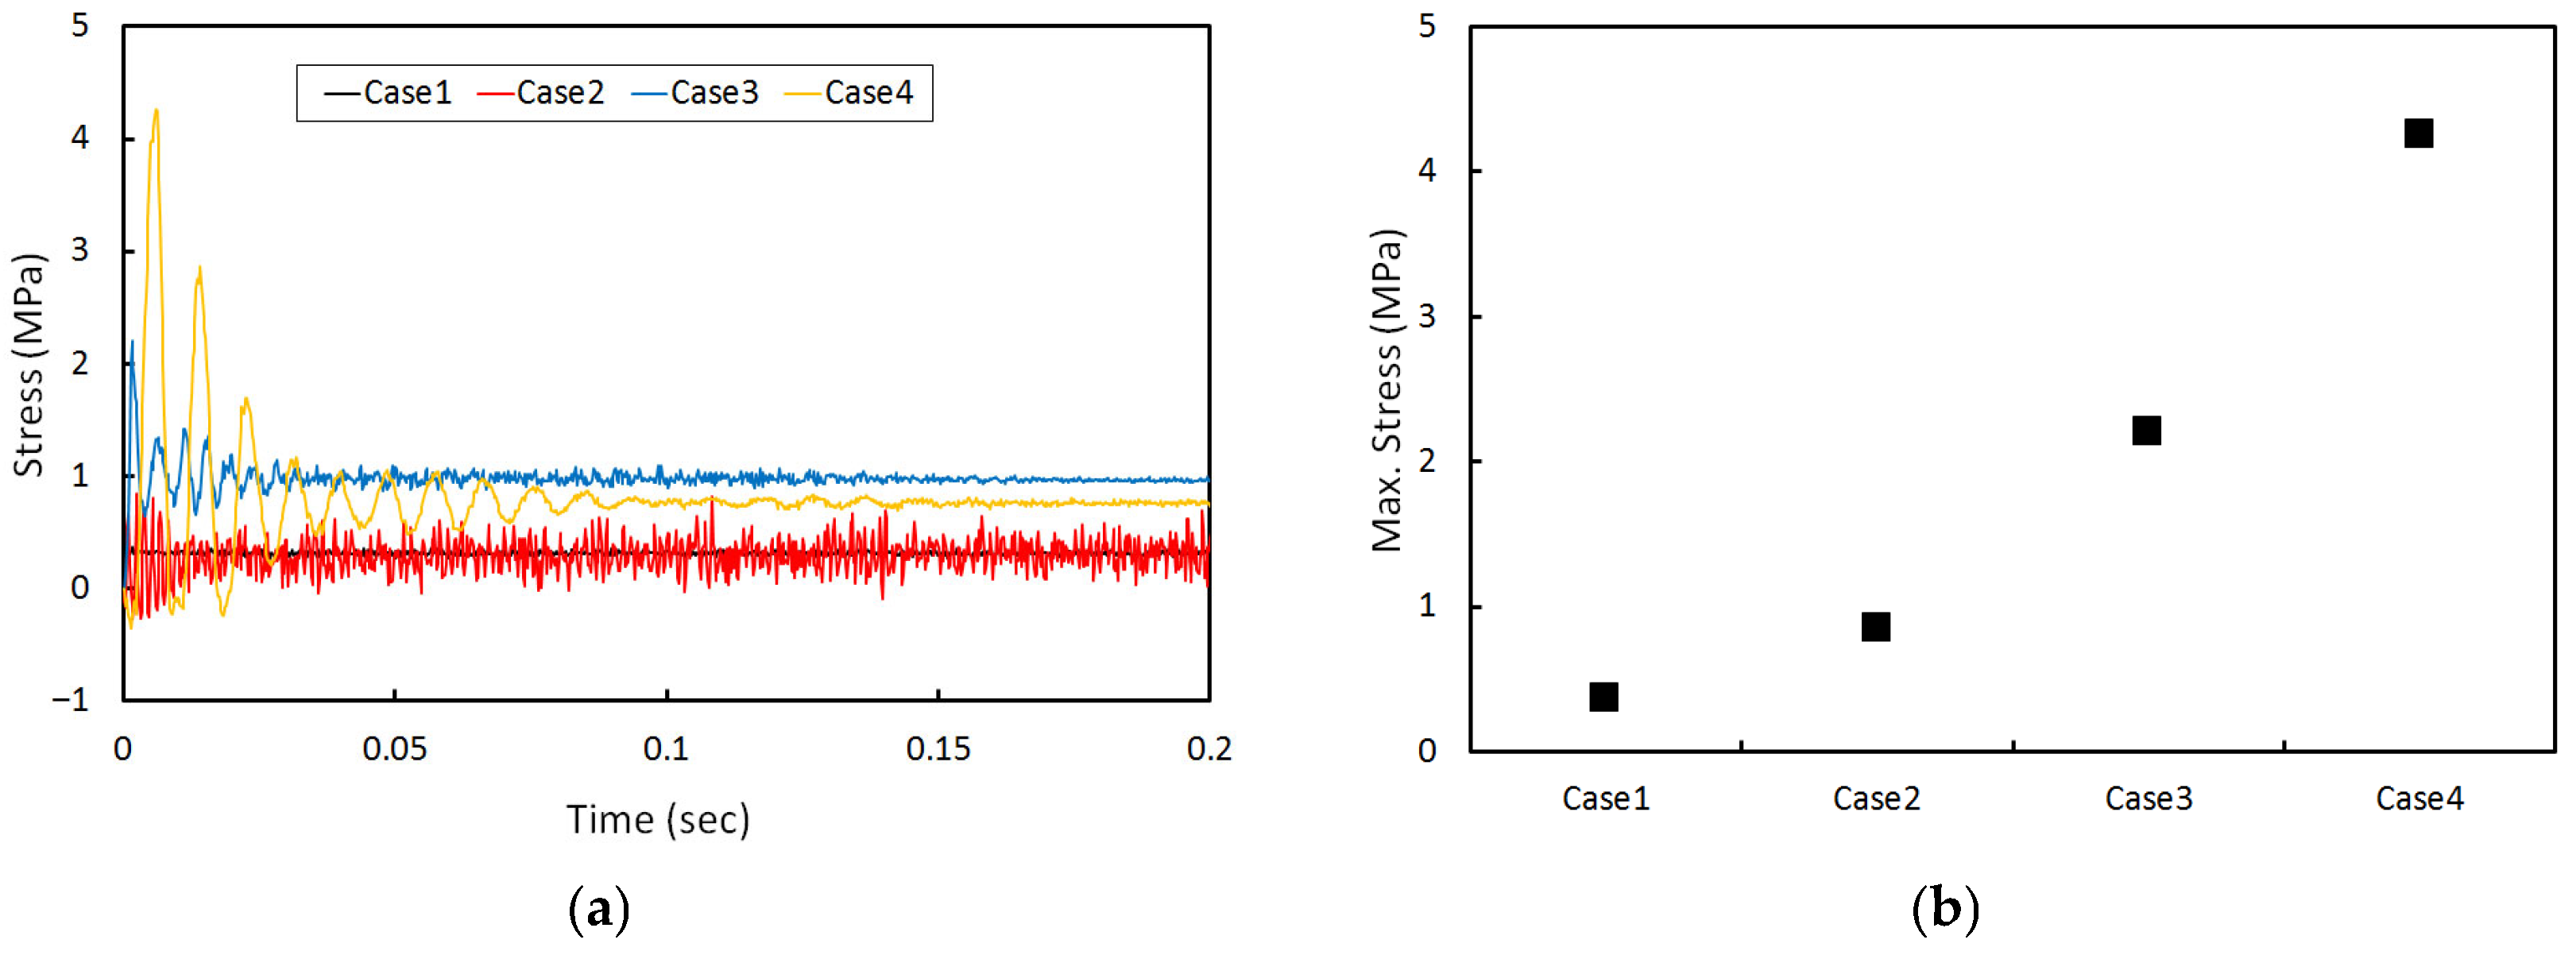
In the PST system, interlayer gaps are primarily caused by curling behavior of the concrete slab due to environmental loads such as temperature and moisture gradients. In such cases, even if the vertical separation (gap width) between layers is relatively small, the gap depth, defined as the horizontal extent of delamination between the grouting layer and the adjacent layers, can extend significantly inward, potentially reaching the location of the shear keys. In other words, interlayer delamination typically initiates at the edge of the slab and gradually propagates inward over time. This progressive separation reduces the effective contact area and compromises the structural continuity of the system. Therefore, it is critical to assess the effects of gap depth in order to understand the dynamic behavior of the PST system. To investigate this, dynamic analyses were performed under various gap depth conditions, as shown in Figure 15, while maintaining a constant gap width. The sum of the gap widths at the upper and lower interfaces was fixed at approximately 2.0 mm, with all interfaces assumed to be unbonded. In the figure, the dimensions of the no-gap area are explicitly denoted by width (W) and length (L). The four cases with varying gap delamination conditions were compared. Case 1 represents the condition with no interlayer gap. Case 2 considers the gap extending inward to the outer side of the sleeper. In Case 3, the gap progresses further to the inner side of the sleeper, and in Case 4, the gap extends to the location of the shear key. These cases were analyzed to evaluate the effects of progressive gap depth on the dynamic behavior of the PST system. In this analysis, the as-is model was only considered.

5.1. Behavior of Concrete Slab

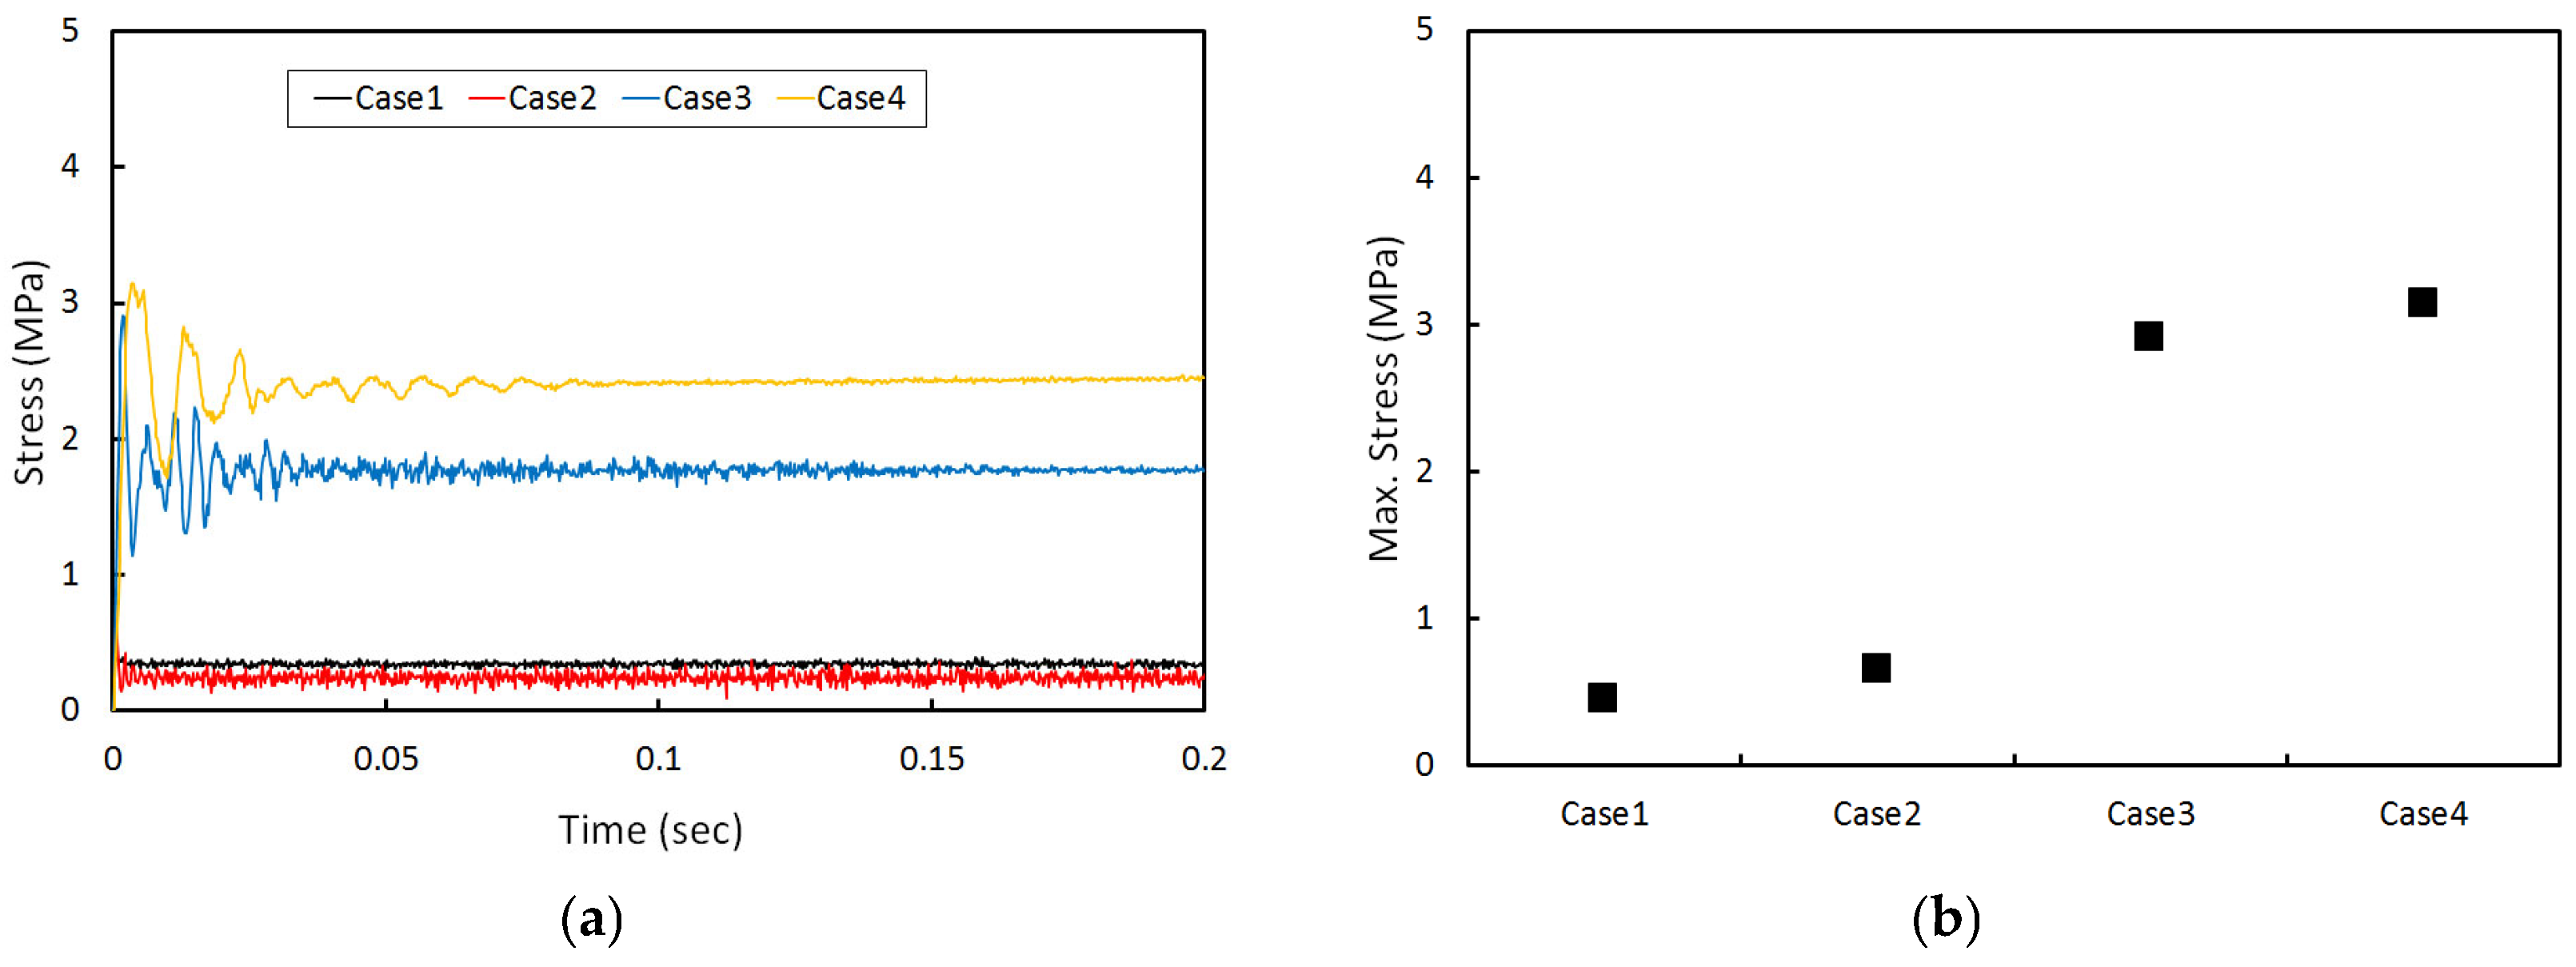
Figure 16a shows the variation of principal stress in the concrete slab over time according to the gap depth at the upper and lower interfaces of the grouting layer. When the gap depth extends only to the outer side of the sleeper (Case 2), the time-dependent stress distribution in the slab is very similar to the case without no interlayer gap (Case 1), and the stress values remain relatively low. However, when the gap extends further to the inner side of the sleeper (Case 3), the principal stress in the slab increases noticeably compared to Cases 1 and 2. In Case 4, where the gap reaches the location of the shear key, the slab stress increases slightly further. Figure 14b compares the maximum principal stress in the slab for each gap depth condition. The results indicate that the maximum slab stress is significantly affected by the gap depth. A notable transition is observed around the sleeper location, where the train load is applied: the stress increases sharply between Case 2 and Case 3. Nevertheless, in all cases, the maximum stress does not exceed the level required to initiate cracking in the concrete slab. Therefore, even when the interlayer gap width is relatively large, the slab’s maximum stress remains low as long as the gap depth does not extend inward beyond the sleeper position.
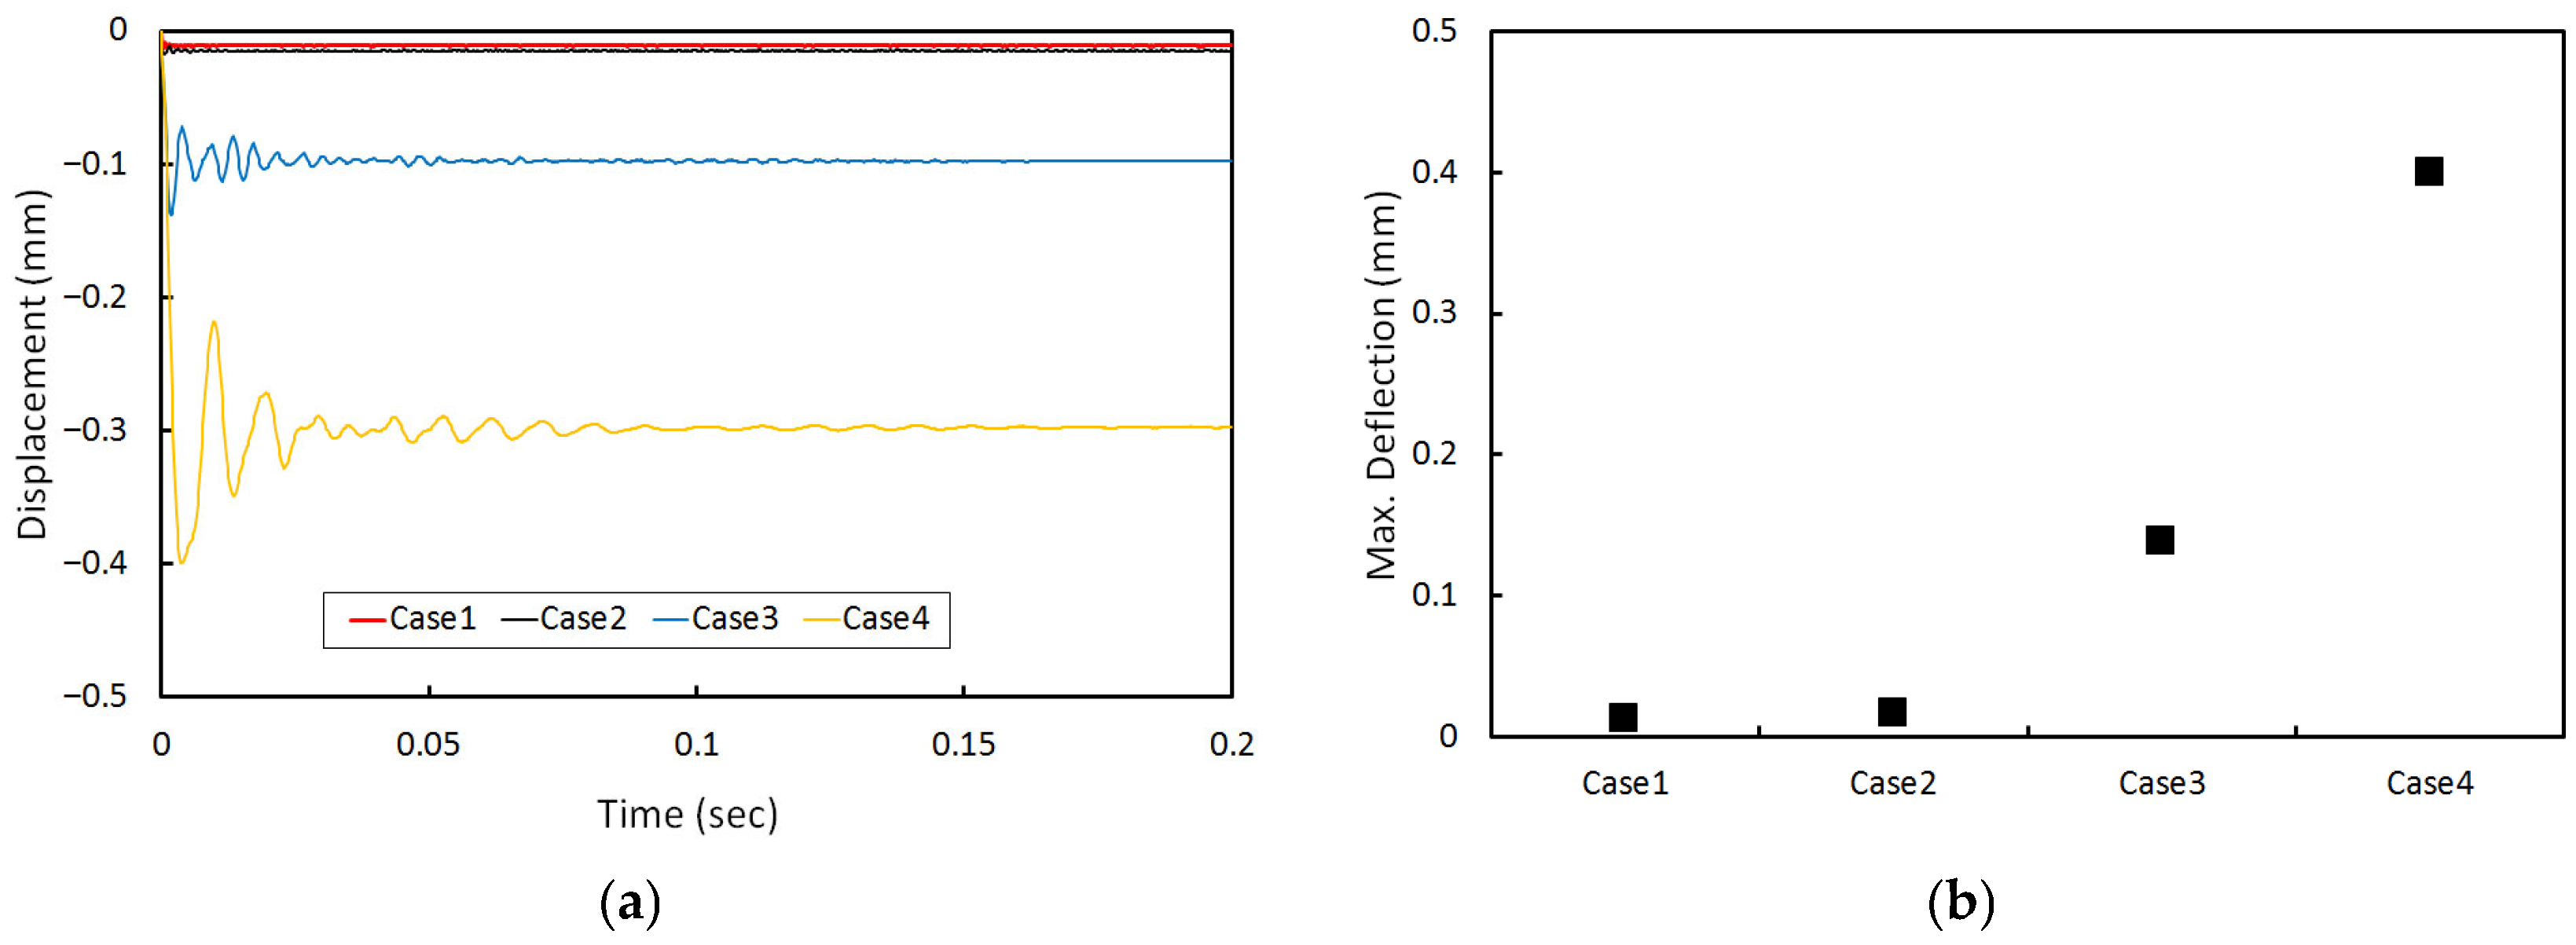
Figure 17a presents the variation of slab deflection over time at the loading position, depending on the interlayer gap depth at the upper and lower interfaces of the grouting layer. When the gap depth extends only to the outer side of the sleeper (Case 2), the deflection behavior is very similar to that of the case with no interlayer gap (Case 1), and the deflection magnitude remains relatively small. However, when the gap progresses to the inner side of the sleeper (Case 3), the slab deflection increases, and further increases are observed in Case 4. Figure 17b compares the maximum deflection of the slab for each gap depth condition. The results indicate that the maximum slab deflection is influenced by the gap depth. A noticeable increase in deflection begins to occur when the gap depth extends beyond the sleeper position, where the train load is applied. Therefore, even if a relatively large interlayer gap width exists, the slab’s maximum deflection at the loading position does not significantly increase as long as the gap depth is limited to the sleeper region and does not extend toward the center of the PST system.

5.2. Behavior of Grouting Layer

Figure 18a illustrates the time-dependent variation of principal stress in the grouting layer according to the interlayer gap depth at the upper and lower interfaces. When the gap depth extends only to the outer side of the sleeper (Case 2), the stress fluctuations in the grouting layer are slightly higher compared to Case 1, but the overall dynamic stress variation remains relatively modest. However, in Case 3, the stress in the grouting layer increases noticeably. In Case 4, the stress increases further. Figure 18b compares the maximum principal stress in the grouting layer under the same gap width condition, for various gap depths. The results show a clear trend of increasing stress with greater gap depth. In particular, when the gap progresses beyond the sleeper location, where the train load is applied, the stress in the grouting layer rises significantly. Therefore, even if a relatively large interlayer gap width is present, the maximum stress in the grouting layer does not increase considerably as long as the delamination does not extend beyond the sleeper position.

6. Interlayer Gap Criteria

As demonstrated in the preceding analyses, the maximum principal stresses induced in both the concrete slab and the grouting layer of the PST system are affected by various interlayer gap parameters, including gap width, gap depth, and the location of the gap within the layered structure (i.e., between the slab, grouting layer, and HSB). In addition, the stress response varies depending on the geometry of the grouting layer: the as-was model, where the grouting layer matches the full dimensions of the slab, and the as-is model, where the grouting layer is recessed 50 mm from the slab edges and has rounded corners. Since stresses exceeding the reference flexural tensile strength stress of concrete or mortar increase the risk of cracking, interlayer gap criteria should be established to ensure that the induced stresses remain within acceptable limits. When measured gaps exceed these thresholds, maintenance or repair works should be conducted to restore structural integrity. This stress-based assessment methodology has been adopted in previous studies [41,42].
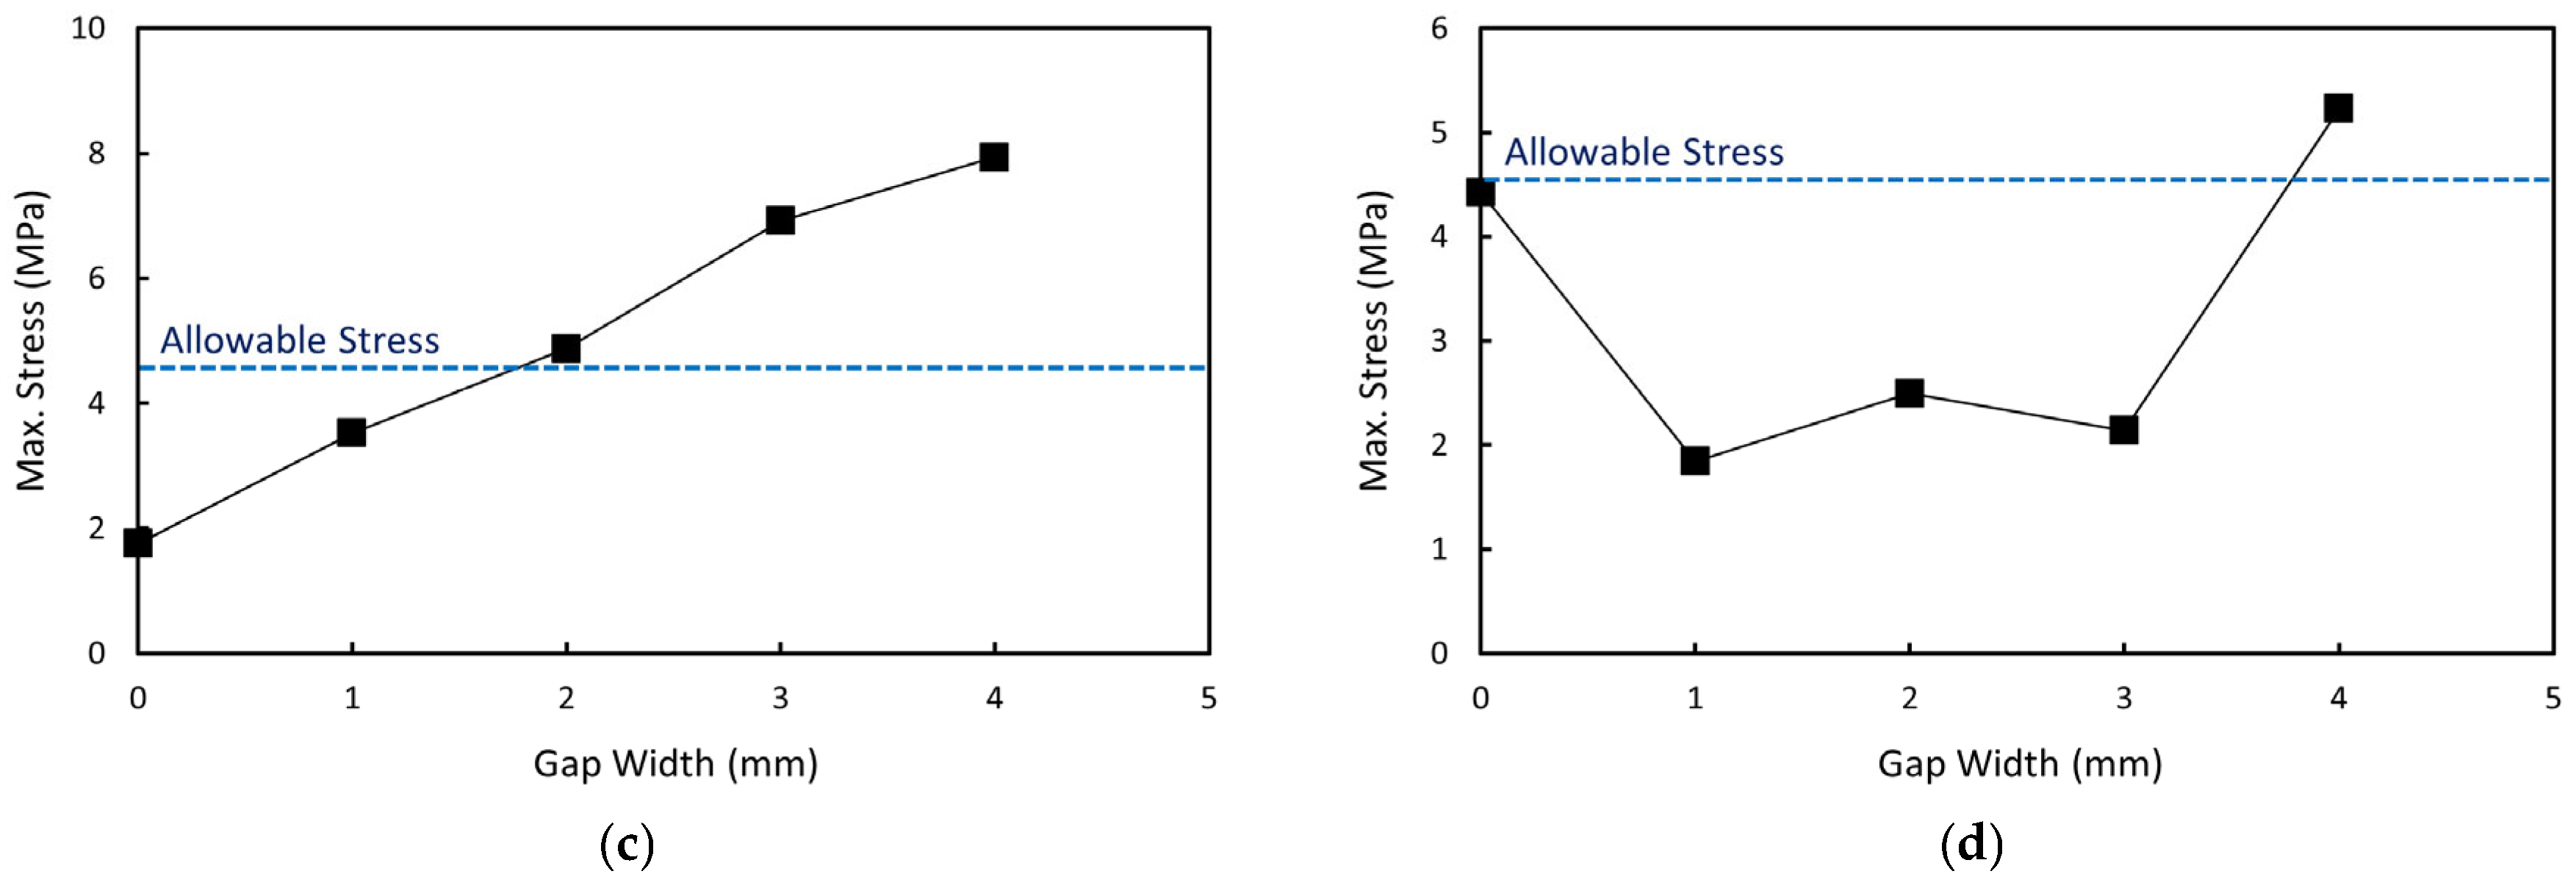
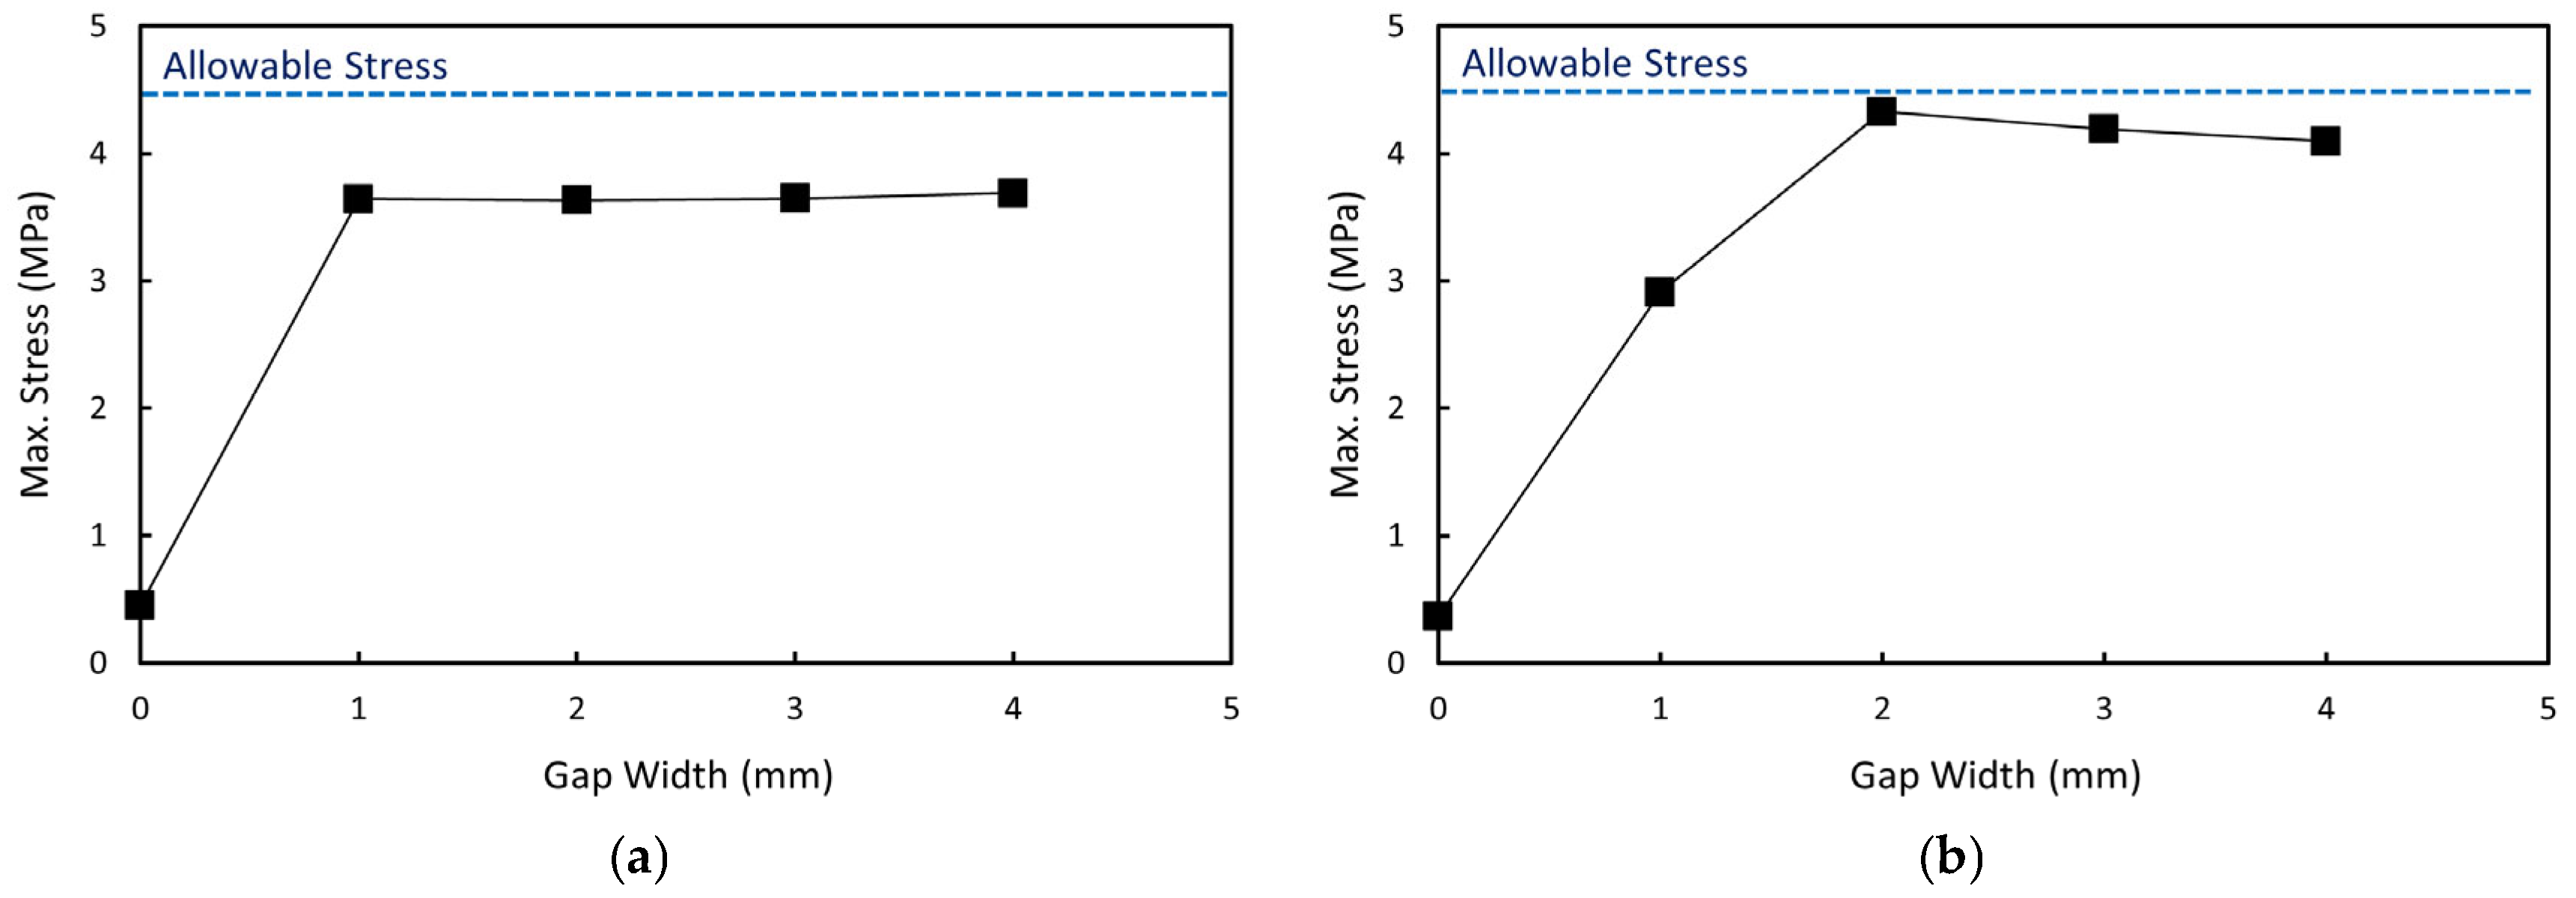
In this study, to consider the weakest possible structural condition, all interfaces between layers were assumed to be unbonded, regardless of the presence or absence of physical gaps. Furthermore, in all gap scenarios, the gap depth was assumed to extend fully to the location of the shear key. As a result, the stress values obtained from the analysis inherently incorporate a substantial safety margin. Based on the results, interlayer gap limits were established using the commonly accepted flexural strength of concrete and mortar, approximately 4.5 MPa. The interlayer gap criteria were classified based on three interlayer gap conditions (i.e., S-G-H, SG-H, and S-GH), as well as the shape of the grouting layer (i.e., as-is and as-was models).

6.1. S-G-H Condition

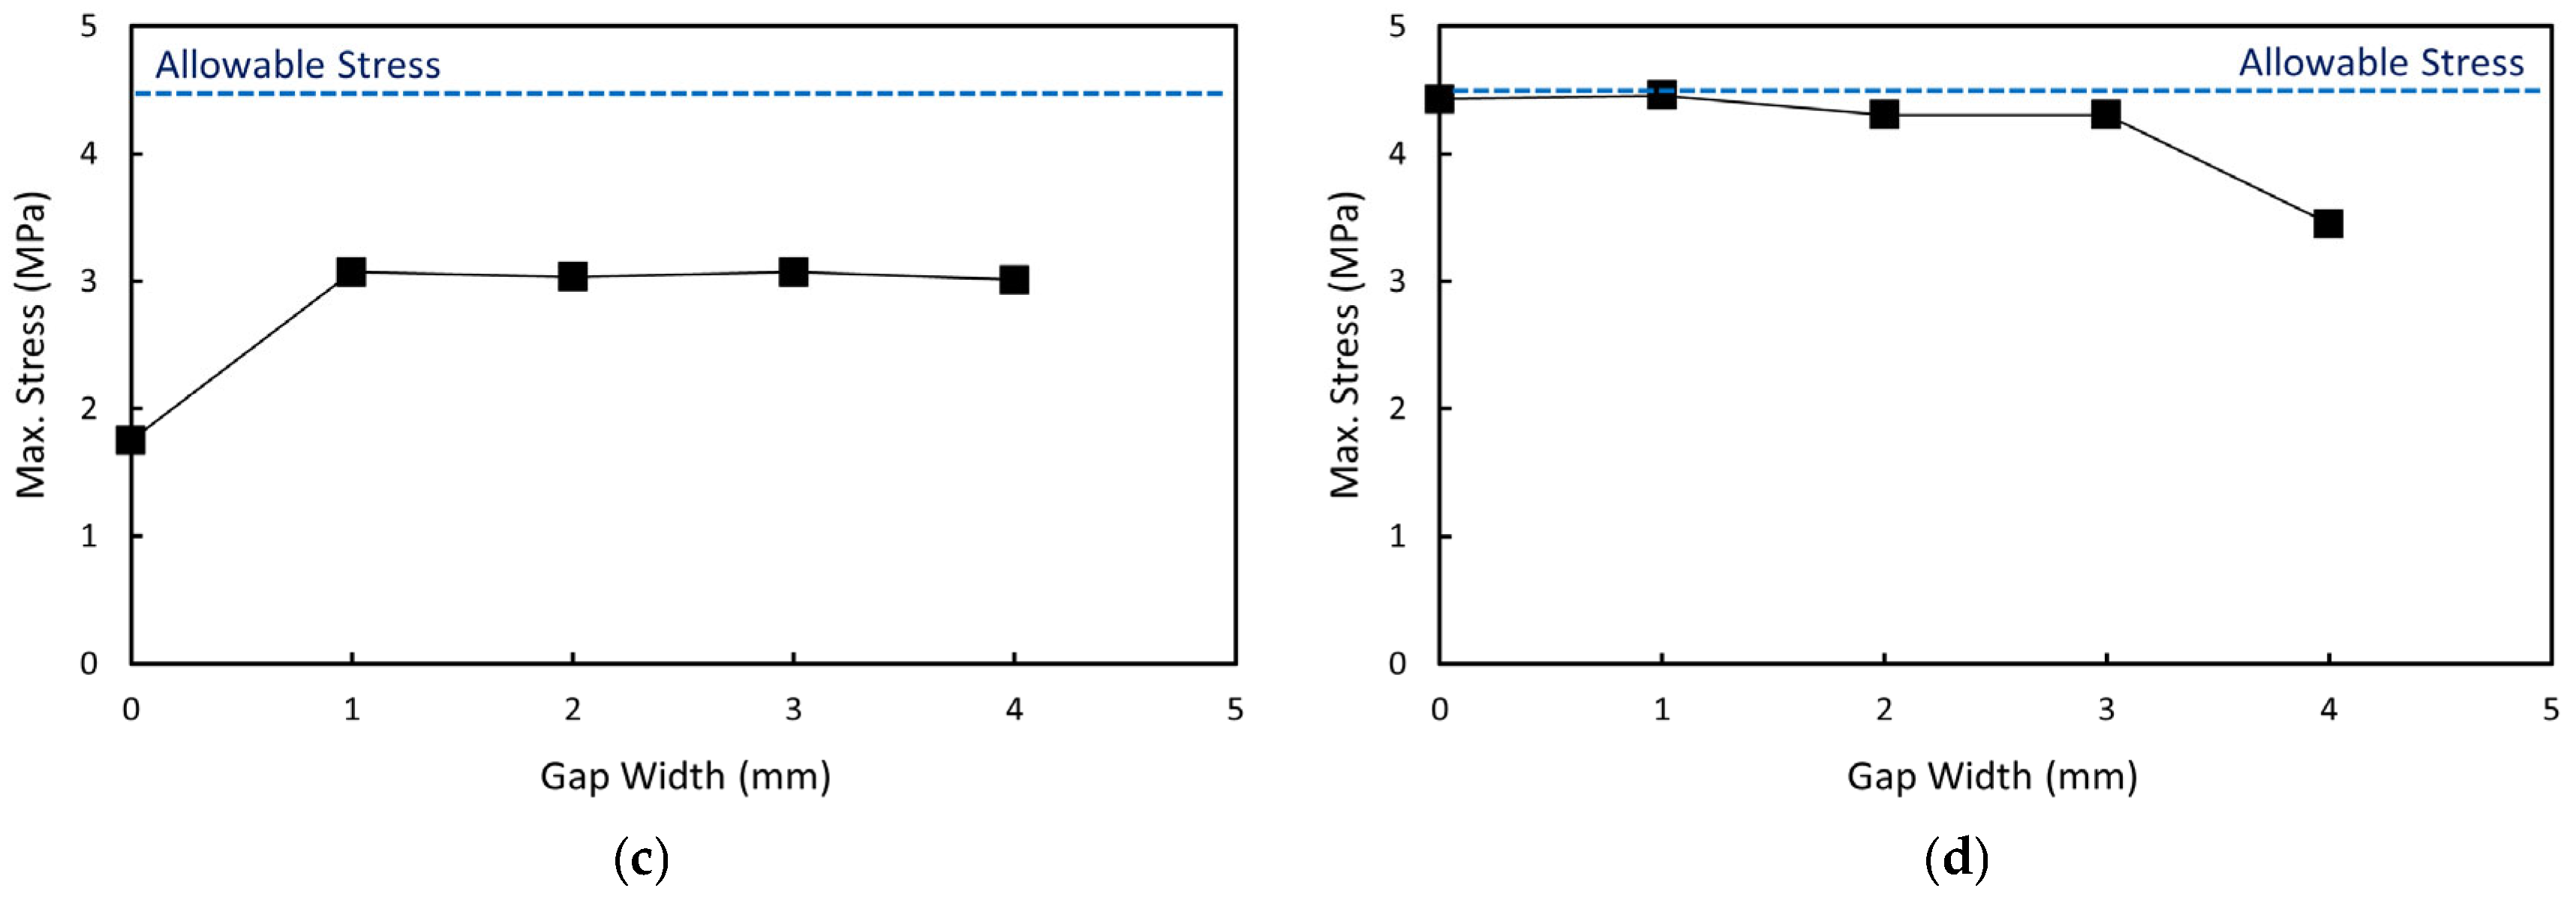
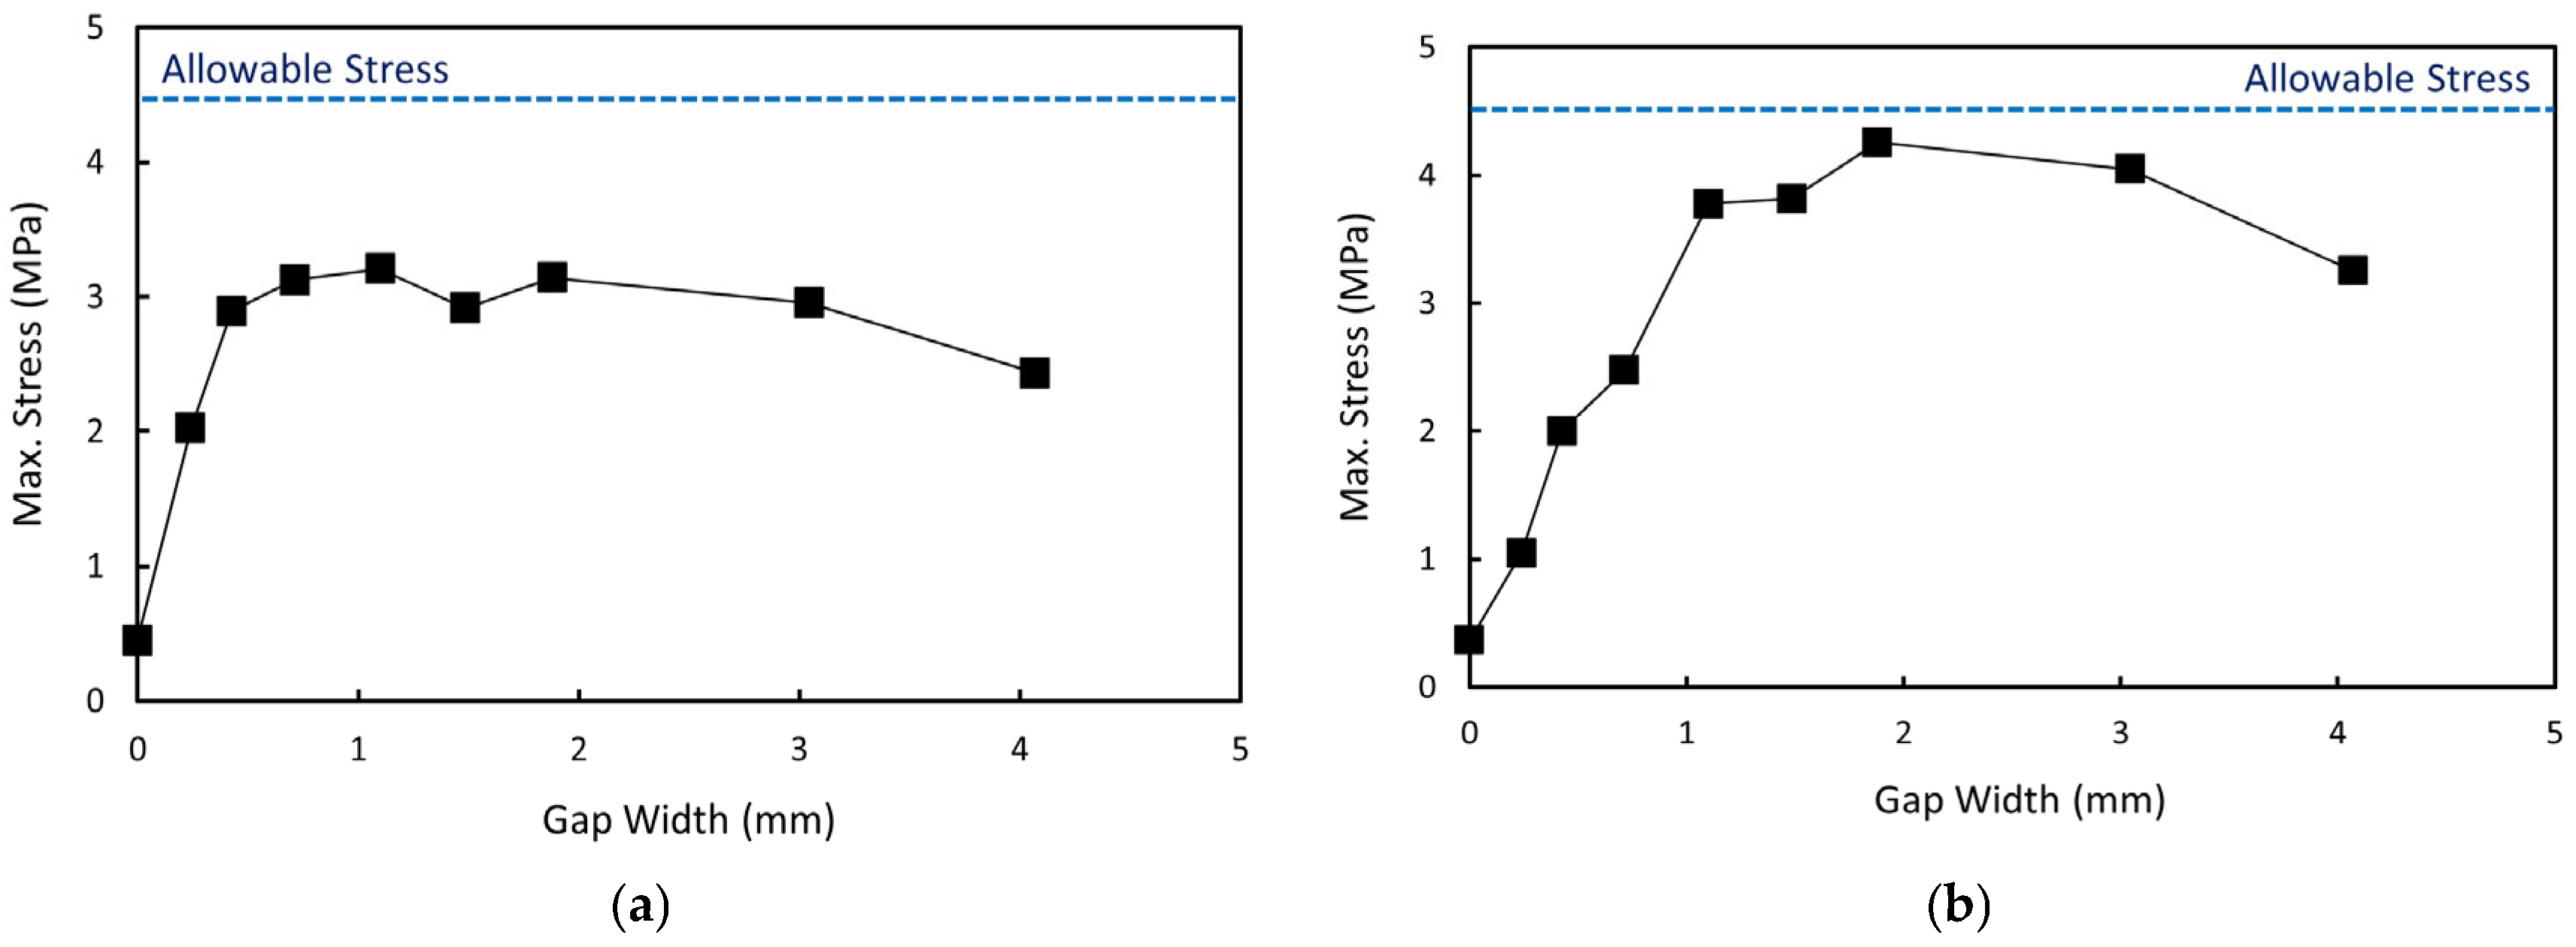
Figure 19a,b show the maximum principal stresses induced in the concrete slab and grouting layer, respectively, as a function of gap width for the as-is model, with the allowable stress level of 4.5 MPa indicated in the figures for reference. In both layers, the stresses remain below the threshold across all gap widths. However, when the gap width reaches 2 mm, the stress in the grouting layer nears the allowable limit, resulting in a high stress ratio that could lead to early fatigue cracking if sustained. Figure 19c,d present the corresponding results for the as-was model. While slab stress remains below the threshold, the grouting layer exceeds 4.5 MPa when the gap width reaches approximately 4 mm. Even at widths over 1.5 mm, the high stress ratio indicates a risk of early fatigue cracking. Accordingly, under the S-G-H condition, a combined gap width limit of 2 mm is recommended for the as-is model, and 1.5 mm for the as-was model.

6.2. S-GH Condition

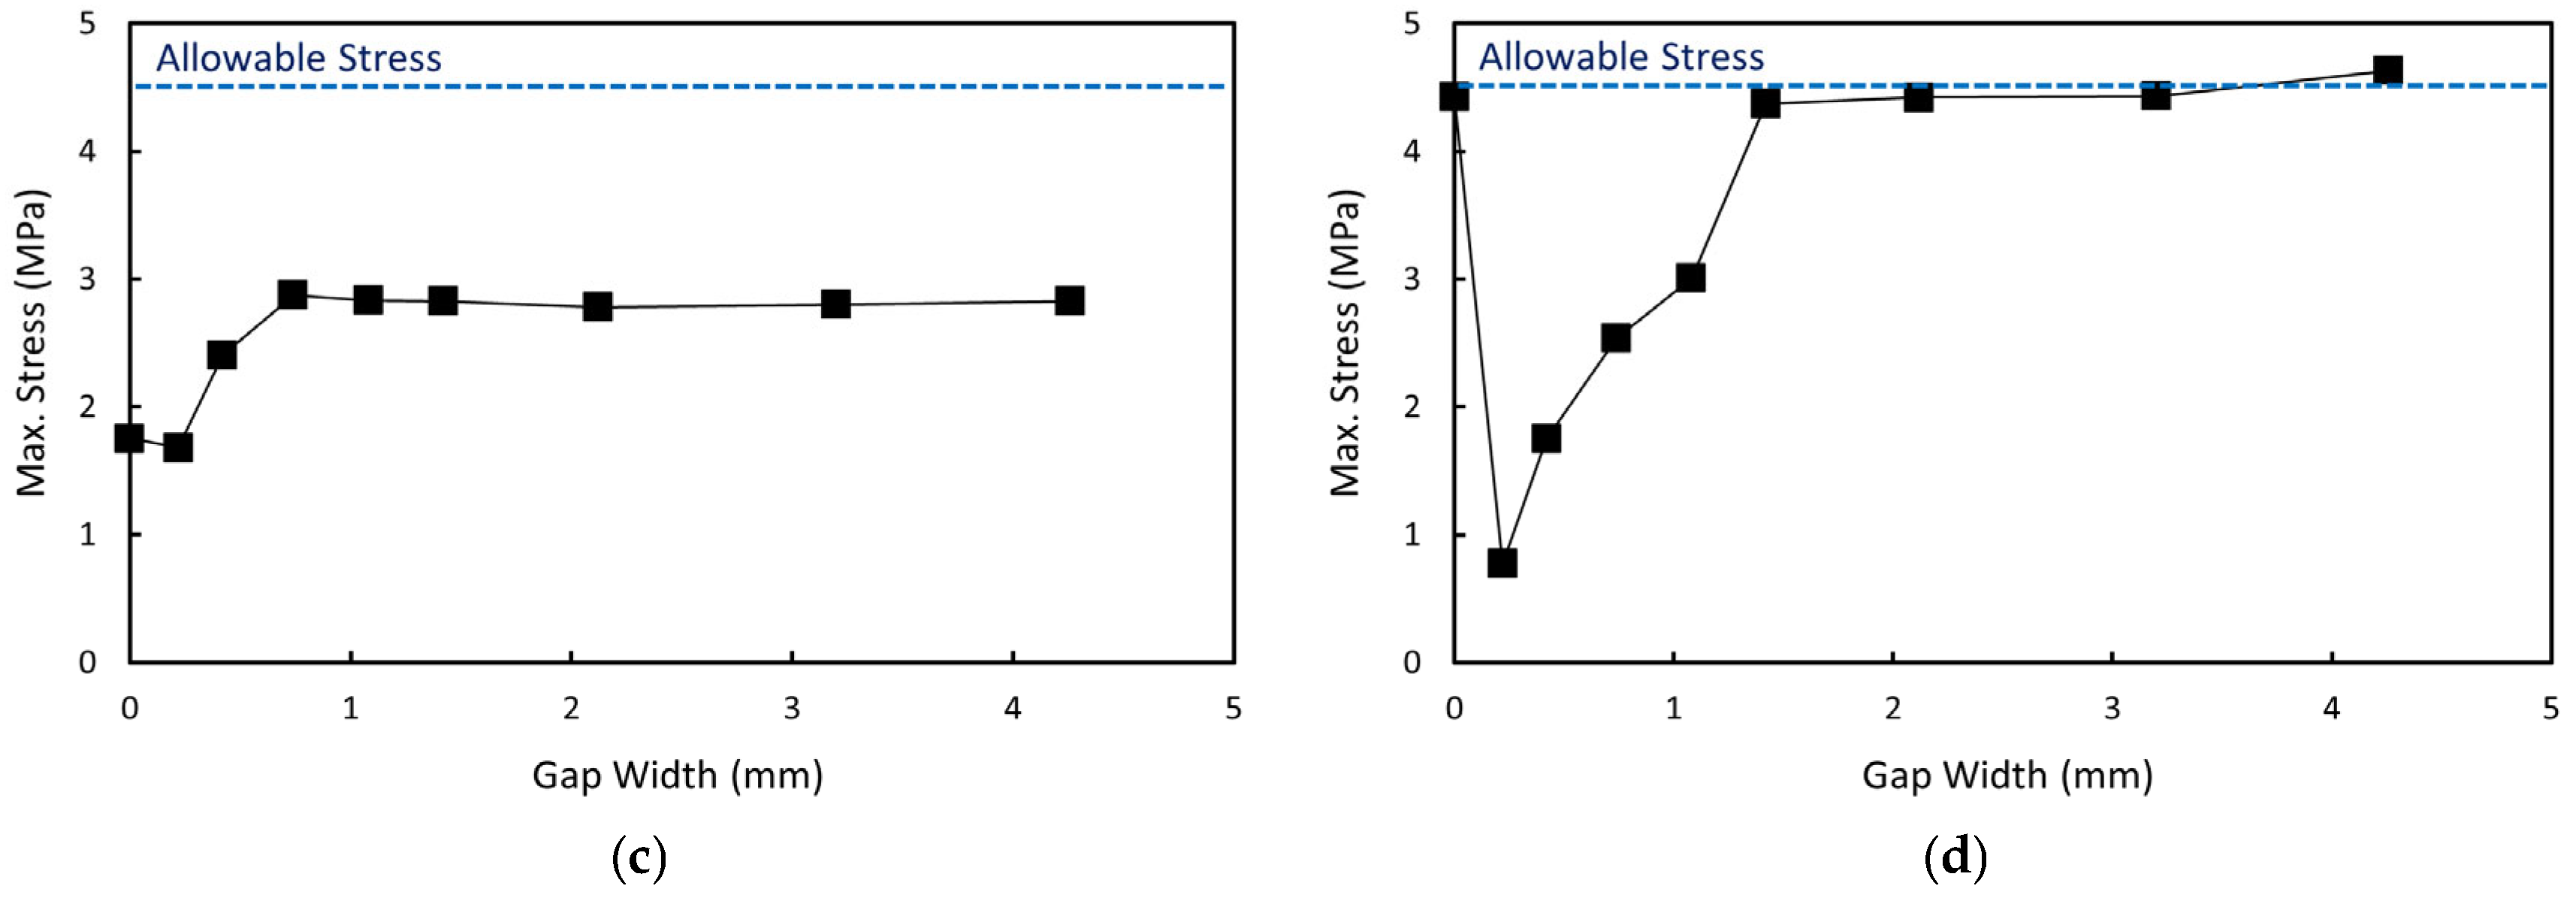
Figure 20a,b illustrate the maximum principal stresses in the slab and grouting layer, respectively, under the S-GH condition for the as-is model. In both components, the stress levels remain consistently below the allowable limit (4.5 MPa), regardless of the gap width. Therefore, when a gap exists only at the upper interface of the grouting layer in the as-is model, a gap width criterion is essentially unnecessary. This suggests that interlayer gaps between the slab and the grouting layer do not pose a structural risk to the PST system under this condition. In contrast, Figure 20c,d present the corresponding results for the as-was model, which exhibit a different trend. The slab’s maximum stress increases with gap width and exceeds the allowable limit at approximately 2 mm, indicating a potential for cracking. Similarly, the stress in the grouting layer exceeds the allowable threshold when the gap width reaches around 4 mm. Accordingly, under the S-GH condition, no gap width criterion is required for the as-is model, whereas for the as-was model, a 2 mm limit is recommended to prevent structural damage.

6.3. SG-H Condition

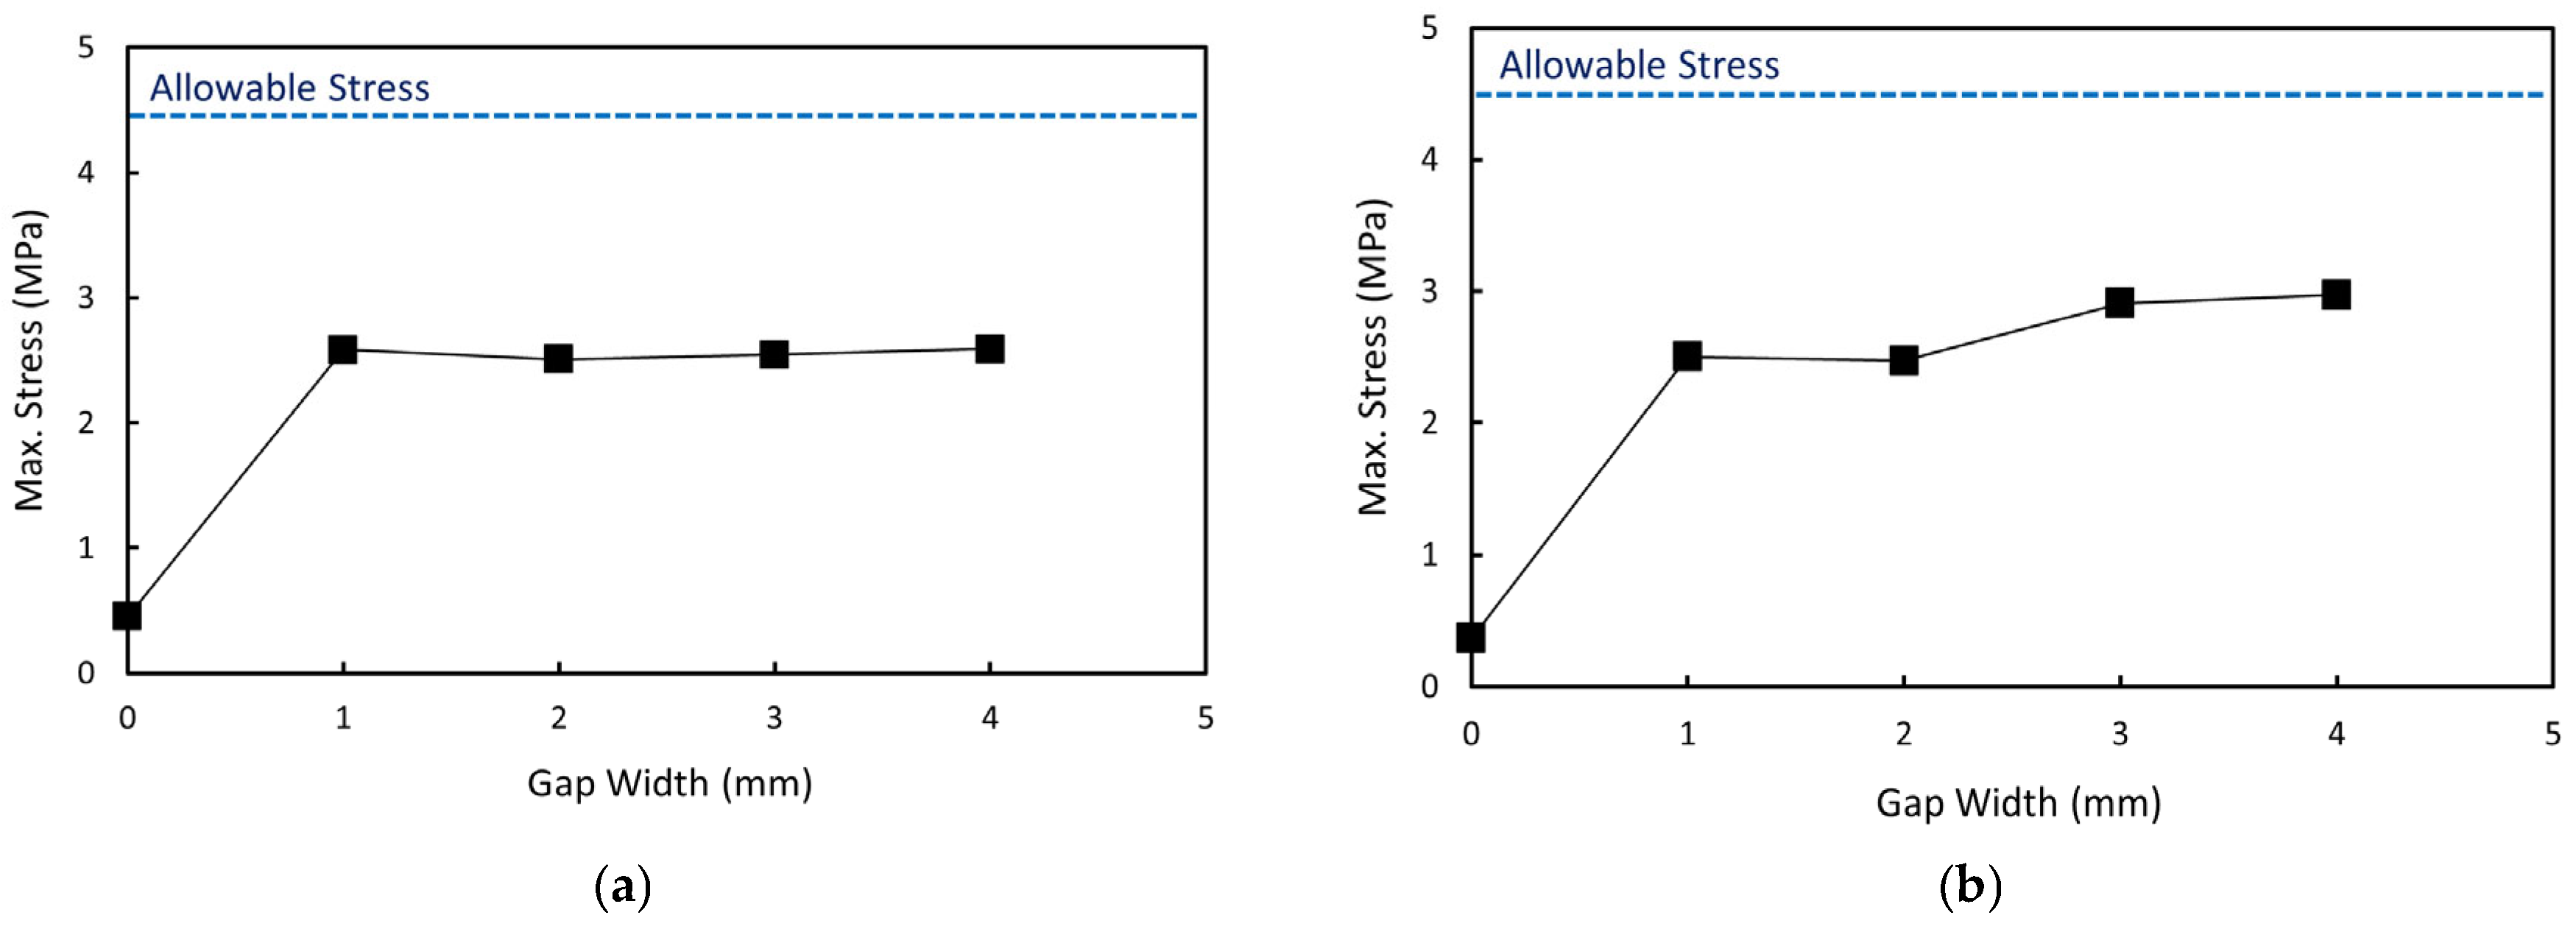
The stress responses of the concrete slab and grouting layer under the SG-H condition for the as-is model are shown in Figure 21a,b. In both the slab and the grouting layer, the maximum stress remains within the allowable threshold across all gap widths. Nonetheless, as the gap width nears 2 mm, the stress in the grouting layer approaches the threshold, indicating a heightened risk of early fatigue cracking. Meanwhile, the corresponding results for the as-was model are illustrated in Figure 21c,d. While the slab maintains stress levels below the allowable limit regardless of gap widths, the grouting layer exhibits a high stress ratio immediately upon gap formation, with peak stress nearing the critical limit, indicating a substantial risk of early fatigue damage. Therefore, a 2 mm gap width limit is recommended for the as-is model, whereas for the as-was model, immediate repair is advised upon detection of any gap.
Even when the induced maximum stress remains below the allowable or reference flexural tensile strength, a high tensile stress ratio, particularly over the range of 0.70–0.85, can lead to early fatigue cracking under repeated loading [43]. To address this risk, allowable interlayer gap width criteria from a maintenance perspective are proposed as summarized in Table 2, considering both gap location and grouting layer configuration. It is important to note that the presented criteria are intended to prevent structural failure of the PST system under dynamic loading from railway operations. Potential damage due to environmental factors, such as debris or moisture ingress, is beyond the scope of these criteria.

7. Conclusions

This study numerically evaluated the structural behavior of railway PST systems under various interlayer gap conditions, including gap width, depth, location, and grouting geometry (as-is and as-was). To simulate adverse conditions, a conservative modeling approach was employed, assuming fully unbonded interfaces and gap depths extending to the shear key. Additionally, instantaneous peak dynamic loading was applied to yield stress responses with substantial safety margins. Based on the simulations, the following conclusions were derived.
  • In both models, maximum principal stresses increased with gap width before plateauing. This stress plateau indicates that stress demand stabilizes once the effective contact path no longer changes with further separation. Gap-induced loss of vertical support also triggers a cantilever-like response, shifting the critical tensile stress region. The as-is model maintained stresses below the 4.5 MPa limit, though fatigue risks emerged near 2 mm. In contrast, the as-was grouting layer exhibited significantly higher stresses, approaching flexural strength at 1.5 mm and exceeding it at 4 mm, emphasizing the need for close monitoring.
  • For single-interface gaps, stress responses depended on location and geometry. In S-GH, the as-is model remained safe, whereas the as-was model reached allowable limits near 2 mm in the slab and exceeded them beyond 4 mm in the grouting layer. For SG-H, slab stress remained safe, but the grouting layer approached critical limits at 1 mm in the as-was model and indicated fatigue risks near 2 mm in the as-is model. Overall, the as-is reduces stress sensitivity by isolating edge effects from the grout core, whereas the as-was is more vulnerable.
  • Gap depth significantly influenced maximum principal stresses in both layers. When depths remained outside sleeper locations, responses were comparable to the no-gap condition. However, extending inward beyond the sleeper to the shear key notably increased stresses, particularly in the grouting layer. Delamination depth relative to the sleeper is a primary trigger for stress escalation, often more critical than gap width alone. Therefore, limiting gap depth within the sleeper zone is essential to mitigate stress escalation and preserve structural performance.
  • Allowable interlayer gap width criteria were proposed based on stress assessments indicating potential fatigue damage. For the as-is model, a 2.0 mm limit was recommended for S-G-H and SG-H, while no limit was required for S-GH. Stricter criteria were necessary for the as-was model: 1.5 mm for S-G-H, 2.0 mm for S-GH, and immediate repair for SG-H due to consistently elevated stresses in the grouting layer. These results support a hierarchical maintenance strategy prioritizing gap depth and location, with gap width used as a secondary criterion.
Finally, the limitations of this study should be acknowledged. The linear elastic model identifies crack initiation thresholds but excludes post-cracking behavior, while the frictionless interface assumption ensures conservative, upper-bound stress estimates. Consequently, the proposed criteria function as proactive maintenance triggers intended to prevent fatigue damage rather than absolute predictors of structural collapse. Despite these limitations, this study provides a rational basis for defining interlayer gap tolerances in PST systems and emphasizes targeted inspection and maintenance, particularly for aging systems with earlier-generation grouting geometries. Future work will focus on validation using field measurements or experiments and on extending the model to include moving-load effects and nonlinear behavior for site-specific assessment.

Author Contributions

Conceptualization, S.-M.K. and B.H.C.; methodology, S.-M.K. and B.H.C.; software, Y.K.C.; validation, S.-M.K. and Y.K.C.; formal analysis, Y.K.C. and B.H.C.; investigation, Y.K.C.; resources, S.-M.K.; data curation, S.-M.K. and Y.K.C.; writing—original draft preparation, S.-M.K. and B.H.C.; writing—review and editing, S.-M.K. and B.H.C.; visualization, Y.K.C.; supervision, S.-M.K. and B.H.C.; funding acquisition, S.-M.K. All authors have read and agreed to the published version of the manuscript.

Funding

This research was funded by Sampyo Railway Corporation.

Data Availability Statement

Data are available from the authors upon reasonable request.

Conflicts of Interest

Author Young Kyo Cho was employed by the company Hyundai Engineering & Construction. The remaining authors declare that the research was conducted in the absence of any commercial or financial relationships that could be construed as a potential conflict of interest.

References

  1. Nakahara, A. Shinkansen slab track to be laid on earthworks. Railw. Gaz. Int. 1996, 152, 3. [Google Scholar]
  2. Holzinger, H.; Schreiner, U. Feste Fahrbahn Bögl: Generationenwechsel im Gleisoberbau. Eisenbahningenieur 2000, 51, 74–78. [Google Scholar]
  3. Authority, K.R.N. Standard Design of Kyungbu KTX Between Daegu and Busan; Korea Rail Network Authority: Daejeon, Republic of Korea, 2006. [Google Scholar]
  4. Chen, R.; Zhao, X.; Wang, Z.; Jiang, H.; Bian, X. Experimental study on dynamic load magnification factor for ballastless track-subgrade of high-speed railway. J. Rock Mech. Geotech. Eng. 2013, 5, 306–311. [Google Scholar]
  5. Sun, L.; Duan, Y.-F.; Yang, X. Static Response Analysis of CRTS III Ballastless Track Structure. J. Railw. Eng. Soc. 2013, 30, 32–39. [Google Scholar]
  6. Liu, X.; Su, C.; Xian, F.; Liu, D.; Ding, C.; Zhao, P. Model experiment on concrete cracking characteristics of ballastless track. J. China Railw. Soc. 2017, 39, 105–110. [Google Scholar]
  7. Ando, K.; Sunaga, M.; Aoki, H.; Haga, O. Development of slab tracks for Hokuriku Shinkansen line. Q. Rep. RTRI 2001, 42, 35–41. [Google Scholar] [CrossRef]
  8. PORR. Slab Track Austria. 2018. Available online: https://www.porr-group.com/en/services/special-skills/slab-track-system/ (accessed on 15 July 2025).
  9. Bögl, S. LRB TS-Fertigteilweiche Bögl, Steckerfertige Weiche, Saalburgstrasse, Frankfurt am Main, ZEV rail. Glas. Ann. 2009, 133, 444–445. [Google Scholar]
  10. Antlauf, W. Bögl system slab track: Installation on the new Nuremberg–Ingolstadt line. Eisenbahningernieur 2004, 55, 64–67. [Google Scholar]
  11. Esveld, C. Modern Railway Track; MRT-Productions: Zaltbommel, The Netherlands, 2001. [Google Scholar]
  12. Dong, W.; Wang, X.; He, Q.; Ren, J. A survey of Ballastless track defects in China’s high-speed railway after ten years of service. Intell. Transp. Infrastruct. 2022, 1, liac023. [Google Scholar]
  13. Jang, S.; Lee, H.; Kim, Y.; Kim, E.; Lee, I.; Kang, Y.; Kang, Y. Development of Prefabricate Concrete Slab Track System and Trial Installation on Revenue Line; Korea Railroad Research Institute: Uiwang, Republic of Korea, 2008. [Google Scholar]
  14. Oh, H.J.; Cho, Y.K.; Seo, Y.; Kim, S.-M. Experimental analysis of curling behavior of continuously reinforced concrete pavement. Constr. Build. Mater. 2016, 128, 57–66. [Google Scholar]
  15. Kim, S.-M.; Nam, J.-H. Measurements and experimental analysis of temperature variations in Portland cement concrete pavement systems. Road Mater. Pavement Des. 2010, 11, 745–771. [Google Scholar]
  16. Zhao, L.; Zhao, G.; Yang, G. Warping deformation of the track slab and their influence on the interlayer stiffness and vibration transmission characteristics of the unit ballastless track. Structures 2023, 57, 105078. [Google Scholar] [CrossRef]
  17. Zhang, Y.; Gao, L.; Zhong, Y.; Wang, J.; Huang, Y. Interlayer damage evolution of CRTS III slab track under passenger and freight train loads. Constr. Build. Mater. 2024, 436, 136944. [Google Scholar] [CrossRef]
  18. Guo, G.; Wang, J.; Du, B.; Du, Y. Application study on fiber optic monitoring and identification of CRTS-II-Slab ballastless track debonding on viaduct. Appl. Sci. 2021, 11, 6239. [Google Scholar] [CrossRef]
  19. Wang, J.; Zhang, H.; Shi, C.; Wang, M. Effect of temperature gradient-induced periodic deformation of CRTS Ⅲ slab track on dynamic responses of the train-track system. Railw. Sci. 2024, 3, 437–452. [Google Scholar]
  20. Li, Y.; Li, H.; Wang, J.; Chen, J.; Wang, R.; Yu, J. Effects of dual application of interface adhesives and solar reflective coatings on damage of longitudinally continuous slab tracks. Constr. Build. Mater. 2024, 438, 137112. [Google Scholar] [CrossRef]
  21. Zhang, Y.; Wu, K.; Jiang, J.; Hu, Y.; Liu, L.; Cai, X.; Lu, Z. Static and fatigue performance of the interface between the epoxy resin and cement asphalt mortar for CRTS II slab track. Case Stud. Constr. Mater. 2025, 22, e04642. [Google Scholar] [CrossRef]
  22. Li, Y.; Chen, J.; Wang, J.; Shi, X.; Wang, R. Study on the effects of solar reflective coatings on the interfacial damage of the CRTS II slab track. Constr. Build. Mater. 2022, 325, 126711. [Google Scholar] [CrossRef]
  23. Liu, J.; Zhou, W.; Cao, J.; Li, X.; Jin, Y.; Ye, Q.; Feng, G. Dynamic performance of a slab track–concrete box subgrade under a double-line high speed railway. PLoS ONE 2024, 19, e0311969. [Google Scholar]
  24. Li, Y.; Li, H.; An, L.; Zhao, J.; Shi, X.; Walubita, E. Interfacial failure behavior of longitudinally coupled slab tracks restored by interface adhesives. Int. J. Adhes. Adhes. 2024, 132, 103662. [Google Scholar] [CrossRef]
  25. Guo, G.; Hao, C.; Du, B. Static and dynamic response characteristics of a ballastless track structure of a high-speed railway bridge with interlayer debonding under temperature loads. Eng. Fail. Anal. 2023, 151, 107377. [Google Scholar] [CrossRef]
  26. Wang, J.; Gao, L.; Zhao, W.; Zhong, Y.; Tong, F.; Wang, Q. Evolution mechanism of interlayer fatigue properties of CRTS III slab track. Constr. Build. Mater. 2022, 360, 129459. [Google Scholar] [CrossRef]
  27. Xu, Q.; Sun, S.; Xu, Y.; Hu, C.; Chen, W.; Xu, L. Influence of temperature gradient of slab track on the dynamic responses of the train-CRTS III slab track on subgrade nonlinear coupled system. Sci. Rep. 2022, 12, 14638. [Google Scholar] [CrossRef]
  28. Chen, X.; Pan, Y.; Deng, X.; Chen, N. Study on Dynamic Responses of Unit Slab Track Considering the Influence of Cement Asphalt Mortar Rough Surface. Adv. Civ. Eng. 2024, 2024, 9972652. [Google Scholar] [CrossRef]
  29. Zhao, L.; Zhao, G.; Yang, G.; Jin, H.; Li, C. Study on the dynamic contact relationship between layers under temperature gradients in CRTSⅢ ballastless track. High-Speed Railw. 2024, 2, 133–142. [Google Scholar] [CrossRef]
  30. Yan, D.; Xu, Y. Numerical study on bonding degradation of concrete-concrete interface in CRTS III slab ballastless track subjected to fatigue temperature gradient loading. Constr. Build. Mater. 2025, 483, 141754. [Google Scholar] [CrossRef]
  31. Zhu, S.; Luo, J.; Wang, M.; Cai, C. Mechanical characteristic variation of ballastless track in high-speed railway: Effect of train–track interaction and environment loads. Railw. Eng. Sci. 2020, 28, 408–423. [Google Scholar] [CrossRef]
  32. Xie, H.; Xu, L.; Yan, B. Mechanical properties of ballastless track considering freeze–thaw deterioration damage. Mathematics 2023, 11, 2289. [Google Scholar] [CrossRef]
  33. Xie, H.; Luo, Q.; Wang, T.; Jiang, L.; Connolly, D.P. Stochastic analysis of dynamic stress amplification factors for slab track foundations. Int. J. Rail Transp. 2024, 12, 281–303. [Google Scholar] [CrossRef]
  34. Cho, Y.K.; Kim, S.-M. Evaluation of grouting layer vibration of railway precast concrete slab track system. Constr. Build. Mater. 2018, 193, 244–254. [Google Scholar] [CrossRef]
  35. Bhatta, S.; Dang, J. Seismic damage prediction of RC buildings using machine learning. Earthq. Eng. Struct. Dyn. 2023, 52, 3504–3527. [Google Scholar] [CrossRef]
  36. Lazaridis, P.C.; Kavvadias, I.E.; Demertzis, K.; Iliadis, L.; Vasiliadis, L.K. Structural damage prediction of a reinforced concrete frame under single and multiple seismic events using machine learning algorithms. Appl. Sci. 2022, 12, 3845. [Google Scholar] [CrossRef]
  37. Dassault Systèmes Simulia Corporation. ABAQUS; 2024; Dassault Systèmes Simulia Corporation: Providence, RI, USA, 2024. [Google Scholar]
  38. Lee, J.H.; Park, J.S.; Lim, K.M. Comparison of the Behavior of PSC Bridges According to Design Train Load before and after Revision of Railway Bridge Design Standard. J. Korean Soc. Hazard Mitig. 2018, 18, 45–50. [Google Scholar] [CrossRef]
  39. Cho, Y. Numerical Analysis of Continuously Reinforced Concrete Pavement and Railway Track. Ph.D. Thesis, Kyung Hee University, Seoul, Republic of Korea, 2015. [Google Scholar]
  40. Tayabji, S.D. Precast Concrete Pavement Technology Implementation; United States, Department of Transportation, Federal Highway Administration: Washington, DC, USA, 2019.
  41. Ren, J.; Deng, S.; Zhang, K.; Du, W.; Wu, Q. Design theories and maintenance technologies of slab tracks for high-speed railways in China: A review. Transp. Saf. Environ. 2021, 3, tdab024. [Google Scholar] [CrossRef]
  42. Juanjuan, R.; Wengao, L.; Jiale, L.; Wenlong, Y.; Shijie, D.; Xueyi, L.; Bin, T. Performance deterioration and structural state diagnosis of slab tracks for high-speed railways: A review. Eng. Fail. Anal. 2024, 158, 107955. [Google Scholar] [CrossRef]
  43. Chen, H.; Sun, Z.; Zhang, X.; Fan, J. Tensile fatigue properties of ordinary plain concrete and reinforced concrete under flexural loading. Materials 2023, 16, 6447. [Google Scholar] [CrossRef]
Figure 1. Concrete slab track system: (a) PST; (b) CRCT.
Buildings 16 00448 g001
Figure 2. Gaps between layers of PST system: (a) Gap between slab and grouting layer; (b) Gap between grouting layer and HSB.
Buildings 16 00448 g002
Figure 3. Finite element model: (a) PST system; (b) Interlayer gaps.
Buildings 16 00448 g003
Figure 4. Shapes of grouting layer: (a) as-was model; (b) as-is model.
Buildings 16 00448 g004
Figure 5. Slab dimensions and loading position: (a) Slab dimensions; (b) Loading position.
Buildings 16 00448 g005
Figure 6. Time-dependent dynamic deformation of PST system.
Buildings 16 00448 g006
Figure 7. Principal stress distribution of slab: (a) Without gaps between layers; (b) With gaps between layers.
Buildings 16 00448 g007
Figure 8. Principal stress in the slab according to the combined gap width of grouting layer: (a) Principal stress variation of slab over time; (b) Maximum principal stress of slab; (c) Principal stress variation of slab over time (as-was model); (d) Maximum principal stress of slab (as-was model).
Buildings 16 00448 g008
Figure 9. Slab deflection according to the combined gap width of grouting layer: (a) Variation of slab deflection over time; (b) Maximum deflection of slab; (c) Variation of slab deflection over time (as-was model); (d) Maximum deflection of slab (as-was model).
Buildings 16 00448 g009
Figure 10. Principal stress in the grouting layer depending on gap width: (a) Variation of principal stress over time; (b) Maximum principal stress; (c) Variation of principal stress over time (as-was model); (d) Maximum principal stress (as-was model).
Buildings 16 00448 g010
Figure 11. Cases of gap location between layers.
Buildings 16 00448 g011
Figure 12. Principal stress in the slab according to gap locations: (a) Principal stress variation of slab over time; (b) Maximum principal stress of slab; (c) Principal stress variation of slab over time (as-was model); (d) Maximum principal stress of slab (as-was model).
Buildings 16 00448 g012aBuildings 16 00448 g012b
Figure 13. Slab deflection according to gap locations: (a) Variation of slab deflection over time; (b) Maximum deflection of slab; (c) Variation of slab deflection over time (as-was model); (d) Maximum deflection of slab (as-was model).
Buildings 16 00448 g013
Figure 14. Principal stress in the grouting layer depending on gap locations: (a) Variation of principal stress over time; (b) Maximum principal stress; (c) Variation of principal stress over time (as-was model); (d) Maximum principal stress (as-was model).
Buildings 16 00448 g014aBuildings 16 00448 g014b
Figure 15. Various gap delamination conditions between layers with no-gap area dimensions (m).
Buildings 16 00448 g015
Figure 16. Principal stress in the slab according to the gap depth: (a) Principal stress variation of slab over time; (b) Maximum principal stress of slab.
Buildings 16 00448 g016
Figure 17. Slab deflection depending on gap depth: (a) Variation of slab deflection over time; (b) Maximum deflection of slab.
Buildings 16 00448 g017
Figure 18. Principal stress in the grouting layer depending on gap depth: (a) Variation of principal stress over time; (b) Maximum principal stress.
Buildings 16 00448 g018
Figure 19. Maximum principal stresses for the S-G-H condition: (a) Concrete slab; (b) Grouting layer; (c) Concrete slab (as-was model); (d) Grouting layer (as-was model).
Buildings 16 00448 g019aBuildings 16 00448 g019b
Figure 20. Maximum principal stresses for the S-GH condition: (a) Concrete slab; (b) Grouting layer; (c) Concrete slab (as-was model); (d) Grouting layer (as-was model).
Buildings 16 00448 g020aBuildings 16 00448 g020b
Figure 21. Maximum principal stresses for the SG-H condition: (a) Concrete slab; (b) Grouting layer; (c) Concrete slab (as-was model); (d) Grouting layer (as-was model).
Buildings 16 00448 g021aBuildings 16 00448 g021b
Table 1. Input values.
VariableThickness
(m)
Elastic Modulus
(MPa)
Density
(kg/m3)
Poisson’s Ratio
Precast concrete slab0.2253.19 × 10424000.2
Grouting layer0.0433.19 × 1042100
HSB0.1801.13 × 1042300
Subgrade1.00 × 1061800
Table 2. Allowable gap width.
Gap LocationAs-Is ModelAs-Was Model
S-G-H2.0 mm1.5 mm
S-GHN/A2.0 mm
SG-H2.0 mmImmediate repair
Disclaimer/Publisher’s Note: The statements, opinions and data contained in all publications are solely those of the individual author(s) and contributor(s) and not of MDPI and/or the editor(s). MDPI and/or the editor(s) disclaim responsibility for any injury to people or property resulting from any ideas, methods, instructions or products referred to in the content.