Abstract
Urban perception research has long focused on global metropolises, but has overlooked many cities with complex functions and spatial structures, resulting in insufficient universality of existing theories when facing diverse urban contexts. This study constructed an analytical framework that integrates street scene images and interpretable machine learning. Taking Zhengzhou City as the research object, it extracted street visual elements based on deep learning technology and systematically analyzed the formation mechanism of multi-dimensional urban perception by combining the LightGBM model and SHAP method. The main findings of the research are as follows: (1) The urban perception of Zhengzhou City shows a significant east–west difference with Zhongzhou Avenue as the boundary. Positive perceptions such as safety and vitality are concentrated in the central business district and historical districts, while negative perceptions are more common in the urban fringe areas with chaotic built environments and single functions. (2) The visibility of greenery, the openness of the sky and the continuity of the building interface are identified as key visual elements affecting perception, and their directions and intensifies of action show significant differences due to different perception dimensions. (3) The influence of visual elements on perception has a complex mechanism of action. For instance, the promoting effect of greenery visibility on beauty perception tends to level off after reaching a certain threshold. The research results of this study can provide quantitative basis and strategic reference for the improvement in urban space quality and humanized street design.
1. Introduction
Cities are important spatial carriers of human civilization. Their built environment not only supports the production and living activities of residents, but also profoundly influences people’s psychological experiences and behavioral patterns [1]. In this complex process of human-land interaction, urban visual landscapes, as the direct presentation of environmental information, play a crucial role in shaping and developing human perceptual responses. Urban perception, which refers to the subjective cognition and comprehensive evaluation of the urban spatial environment by residents based on visual cues [2], has become an important field of interdisciplinary research involving architecture, urban and rural planning, and sociology.
The existing research methods still face significant challenges. Traditional research methods such as questionnaires and in-depth interviews [3,4], although they can obtain relatively in-depth perceptual data, generally have inherent limitations such as limited sample size, high survey costs, and difficulty in achieving continuous spatial coverage [3,4]. In recent years, breakthroughs in deep learning technology have provided a new technical path for large-scale urban perception research [5,6]. The method based on street view images and deep neural networks can achieve efficient and standardized perception prediction, effectively overcoming the shortcomings of traditional methods. However, advanced predictive models often exhibit a “black-box” nature, which means that while they achieve high prediction accuracy, their internal decision-making logic remains opaque [7,8]. This lack of transparency hinders the clear explanation of how predictions are generated and fails to effectively reveal the specific environmental factors that shape urban perception. Consequently, the practical application of such models in urban planning is limited, as planners require not only predictive outcomes but also interpretable insights to inform design interventions. Although traditional statistical methods have good interpretability, they often have deficiencies when dealing with the complex nonlinear correlations between the environment and perception [9,10].
Against this backdrop, the emergence of explainable machine learning methods offers new ideas for addressing the aforementioned challenges [11]. Techniques such as SHAP (Shapley Additive Explanations) have been applied to uncover the nonlinear effects of visual elements on safety perception [12] or to identify key streetscape features influencing the sense of security [13]. Despite these advances, several critical research gaps persist, limiting both theoretical understanding and practical application.
Most studies focus on identifying key visual features that influence perception, but have not systematically analyzed the interactions between different visual elements and their synergistic or antagonistic effects on multidimensional perception. Urban perception is shaped by a combination of environmental features, yet the compound effects and potential trade-offs among elements remain underexplored. Existing research predominantly examines coastal metropolises or cities at specific developmental stages, paying insufficient attention to inland megacities undergoing rapid urbanization and spatial restructuring. The unique spatial patterns, development trajectories, and perceptual dynamics of such cities—characterized by distinct urban forms, historical layers, and development pressures—are not adequately represented in the current literature, limiting the generalizability of findings. While correlations between visual elements and perceptual scores have been established, the causal mechanisms and directional effects linking specific environmental features to particular perceptual dimensions require further validation through more rigorous modeling and interpretability frameworks. The “why” behind the predictions—the explicit pathways through which environmental attributes translate into subjective experience—remains inadequately addressed.
To address these gaps, this study constructs a comprehensive analytical framework integrating street view images, deep learning, and explainable machine learning. We select Zhengzhou City, a major inland transportation hub and a rapidly developing megacity in central China, as an empirical case. Zhengzhou’s urban spatial structure shows distinct east–west differences with Zhongzhou Avenue as the boundary: the eastern part is a newly built urban area with larger street scales and higher greening levels, while the western part is the old urban area with high density and complex street interfaces. This spatial duality provides an ideal setting to explore perceptual variations and their environmental drivers.
This study focuses on the following three research questions: (1) How to measure the multi-dimensional urban perception spatial pattern of Zhengzhou City based on machine learning methods? (2) What are the key environmental elements that influence the formation of urban perception in Zhengzhou City? (3) How do these environmental elements act on different dimensions of urban perception?
By answering these questions, this study aims to advance the methodological application of explainable machine learning in urban perception research and provide a scientific, interpretable evidence base for spatial quality enhancement and human settlement optimization in Zhengzhou and similar inland megacities.
2. Literature Review
2.1. The Concept and Measurement Dimensions of Urban Perception
Urban perception research originated from environmental psychology and humanistic geography, focusing on the interaction between people and the built environment. In “Urban Image”, Lynch innovatively proposed that residents form psychological representations of a city through five elements: paths, boundaries, regions, nodes and landmarks [13]. This theory laid the foundation for the study of urban perception. With the deepening of research, the connotation of urban perception has been continuously enriched, expanding from the initial spatial cognition to multiple dimensions such as emotional response and esthetic evaluation. Its research scope has also transcended static spatial images, covering more complex psychological constructions such as emotions and a sense of belonging [14]. In terms of measurement dimensions, existing research has established a diversified evaluation system. The Place Pulse project developed by the MIT Media Lab identified six core perception dimensions—safety, vitality, beauty, affability, repression and boredom—through a large-scale online survey [15]. This framework has been widely adopted due to its systematicness and operability. Sal et al. further verified the intrinsic correlations among these dimensions through factor analysis and found significant positive correlations between dimensions such as safety and prosperity, vitality and beauty [16]. These studies provide a theoretical basis for the quantitative assessment of urban perception. With the popularization of multi-source data and deep learning methods, the measurement dimensions of urban perception are showing a trend of refinement and contextualization. For instance, Liu et al. integrated the physical characteristics of the built environment and subjective perception dimensions in their research to quantify urban vitality [17]; Zhao et al. conducted a more detailed assessment of the visual quality of the built environment by integrating deep learning models [18]. These studies not only verified the classical dimensions but also promoted the deepening and development of the perceptual measurement methodology.
2.2. The Application of Traditional Data and Methods in Urban Perception Research
Traditional urban perception research mainly relies on two types of data sources: location-based abstract data and concrete image data. In terms of abstract data, indicators such as Point of interest (POI) density and land use mix degree are widely used to characterize the functional features of cities. Liu et al. verified the positive correlation between the degree of functional mixing and the perception of block vitality through the calculation of entropy values of POI data [19]. Social media data provides a new perspective for perception research. Ge et al. analyzed the emotional perception characteristics of urban green Spaces using Weibo check-in data [20]. In terms of the application of image data, remote sensing images, due to their wide coverage capability, were widely used in the analysis of urban forms at a macro scale in the early days. Xie et al. combined high-resolution remote sensing images and social perception data to achieve precise identification of urban functional areas [18]. However, the top-down perspective of remote sensing images limits their representational ability for visual perception at the street scene level.
Traditional research methods such as questionnaires and in-depth interviews [19,20], although they can obtain relatively in-depth perceptual data, generally have inherent limitations such as limited sample size, high survey costs, and difficulty in achieving continuous spatial coverage [21,22]. Against this backdrop, the emergence of explainable machine learning methods offers new ideas for addressing the aforementioned challenges. Among them, the SHAP (Shapley Additive Explanations) framework is based on the principle of game theory and can quantify the contribution of each feature to the prediction results of the model [23,24], providing an effective tool for understanding the decision-making mechanism of machine learning models.
2.3. Breakthrough Progress in Street View Imaging and Deep Learning
The emergence of street view images has brought about a revolutionary change to urban perception research. Compared with remote sensing images, street view images truly present the built environment from a human perspective and can more directly capture the visual elements that affect perception. Cheng et al. systematically demonstrated the advantages of street view images in visual perception research, including the authenticity of perspective, spatial continuity and temporal comparability [25]. The application of deep learning methods has further promoted the development of this field. Zhang et al. applied deep learning technology to large-scale urban perception research. By training convolutional neural network models, they achieved a quantitative assessment of the urban image of Beijing [26]. Wei et al. employed the transfer learning method to demonstrate the generalization ability of deep learning models among different cities [27]. These studies have established the position of “street view images + deep learning” as a new paradigm in urban perception research.
2.4. The Application and Challenges of Explainable Machine Learning in Urban Research
Although deep learning performs well in prediction accuracy, its “black box” feature limits the transformation of research results into planning practice. To address this challenge, explainable machine learning methods emerged [28]. In the field of urban studies, explainable machine learning methods have demonstrated great potential. Liu et al. analyzed the nonlinear influence of visual elements on safety perception using the SHAP method and found that the improvement effect of tree coverage on safety perception was the most significant within a specific range [29]. In the research on community safety perception in Macao, Pan et al. identified through SHAP values that the tidiness of building interfaces and the permeability of streets are the key factors affecting a sense of security [30].
In conclusion, although existing research has made significant progress in the quantification and mechanism exploration of urban perception, there is still room for further improvement in its theoretical framework and empirical basis. Firstly, most studies focus on identifying the key features that affect perception, but have not systematically analyzed the interactions between different visual elements and their synergistic or antagonistic effects on perception. Secondly, existing research mostly focuses on the types of cities at specific development stages or spatial forms, paying insufficient attention to typical inland metropolises that are in the stage of rapid urbanization and structural reorganization, which limits the universality and representativeness of the theoretical system. Furthermore, the causal relationship between visual elements and specific perceptual dimensions still needs to be verified through more rigorous modeling and interpretability methods.
Based on the above, this study will advance the relevant work in the following aspects: (1) Construct a complete technical chain of “street view images–deep learning–explainable machine learning”, forming a closed-loop analysis process from perception prediction to mechanism explanation; (2) Take Zhengzhou City as a case of a rapidly developing inland megacity, and expand the regional types and sample spectrum of urban perception research; and (3) Introduce SHAP interaction value analysis to deeply reveal the joint action mechanism of multiple visual elements in the process of influencing perception, providing a theoretical basis for refined urban design oriented to perception optimization. By systematically analyzing the visual driving mechanism of urban perception in Zhengzhou City, this study aims to deepen the research on urban perception from “phenomenon description” to “mechanism explanation”, and provide methodological support for data-driven urban planning.
3. Data Collection
3.1. Research Area
Zhengzhou, the capital of Henan Province, is located in the southern part of the North China Plain and on the south bank of the lower reaches of the Yellow River. It is an important comprehensive transportation hub and a core city in the central region of China. According to the data from the seventh national census, the permanent resident population of Zhengzhou City has reached 12.6 million, with the urban population accounting for 78.4% [31]. In 2023, the city’s gross domestic product (GDP) exceeded 1.3 trillion yuan, forming a modern industrial system dominated by electronic information, automobile manufacturing, modern logistics and other industries. This study selected the main urban area of Zhengzhou City as the research scope, including Jinshui District, Huiji District, Guancheng Hui District, Zhongyuan District, Erqi District and the central administrative area of Zhongmu County (Figure 1). The total area of the research region is approximately 580 square kilometers, and the built-up area exceeds 400 square kilometers. This area concentrates the main administrative, commercial, cultural and residential functions of Zhengzhou City. Its spatial structure presents the development characteristics of “multiple centers and clusters”, specifically manifested as a spatial pattern of “two axes, one belt and multiple centers”. With Jinshui Road–Zhongyuan Road as the east–west development axis and Huayuan Road–Zijing Mountain Road as the north–south development axis, relying on the Yellow River ecological belt, multiple functional centers such as CBD, Longzi Lake and High-tech Zone have been formed. The street view images in this area are fully covered and can meet the data requirements of large-scale sampling. The area encompasses various spatial types such as traditional commercial districts, modern business districts, industrial heritage areas, and waterfront landscape belts, with rich environmental features. This is conducive to exploring the perception differences under different built environments. The area is currently in the process of rapid urbanization and spatial reconstruction. The research results have direct practical guiding significance for optimizing the quality of urban space.
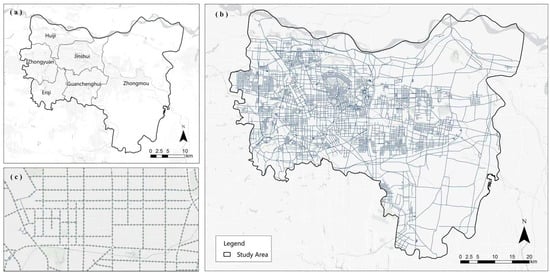
Figure 1.
Research Area Map. (a) Location of Zhengzhou in China; (b) Administrative divisions of Zhengzhou main urban area; (c) Street view sampling points distribution.
3.2. Street View Image Data
To quantify the visual characteristics of the urban environment, this study adopts the street view image service provided by the Baidu Maps Open Platform. As a leading digital map service provider in China, Baidu Maps’ street view data features comprehensive coverage, timely updates, and accurate positioning, and has been widely applied in domestic urban research [14]. Considering the temperate monsoon climate characteristics of Zhengzhou City, there are seasonal variations in vegetation coverage. Image data from 2022 were uniformly collected to reflect the urban landscape during the vegetation growth season and minimize the impact of seasonal factors on perception assessment to the greatest extent [32]. The data collection process includes the following steps:
(1) Road network data acquisition: Obtain vector data of all grades of roads in the study area through Open street map, including expressways, main roads, secondary roads and branch roads;
(2) Sampling point generation: Based on the spatial analysis tool of the Geographic Information System, sampling points were systematically generated along the route elements at intervals of 100 m, and a total of 39,736 initial point positions were obtained. The 100 m interval was selected based on a balance between data density and computational efficiency. This spacing ensures sufficient coverage to capture street-level visual variability while avoiding oversampling redundancy, and aligns with previous urban perception studies using street view imagery [33].
(3) Image acquisition: The Baidu Panorama Static Image API (http://lbs.baidu.com, accessed on 3 February 2022) was called through a Python program 3.9 to implement coordinate conversion to the BD09 geodetic coordinate system. The parameters for simulating human visual perception are set as follows: vertical field of view = 0°, horizontal field of view Angle = 90°, and image resolution = 512 × 512 pixels. Each sampling point collects images from four directions (0°, 90°, 180°, and 270°) to comprehensively record the street environment.
(4) Data cleaning: Invalid images caused by access restrictions, construction areas or data loss were excluded. Ultimately, 25,862 valid sampling points were obtained, corresponding to 103,448 street view images.
3.3. Perception Label Data
This study adopts the MIT Place Pulse 2.0 dataset as the source of perception labels. This dataset contains 110,988 street view images from cities around the world. Each image was perceived and evaluated by 81,630 participants through pairwise comparisons, covering six dimensions: beauty, boring, depression, vitality, safety and affluence [25]. By adopting the transfer learning strategy and using the ResNet-50 (Residual Network with 50 layers) model pre-trained on this dataset, through the forward propagation calculation of Zhengzhou street view images, the perception scores of six dimensions were obtained. This method has been proven to maintain stable prediction performance in different geographical environments [34]. Thus, the dataset used in this study consists of two components:
(1) Visual element data: 103,448 Baidu street view images from Zhengzhou, from which 19 categories of visual elements were extracted via semantic segmentation.
(2) Perception label data: Six-dimensional perception scores predicted by the ResNet-50 model trained on the MIT Place Pulse 2.0 dataset.
4. Research Methods
This study adopts a comprehensive analysis framework integrating street view images, deep learning and interpretable machine learning. The framework is designed to address the three core research questions outlined in the Introduction: (1) measuring the spatial pattern of multi-dimensional urban perception, (2) identifying key visual elements influencing perception, and (3) elucidating the mechanisms through which these elements affect different perceptual dimensions. The technical route covers three core stages that are successively connected (Figure 2). The first stage is visual element analysis: The SegFormer-BB5 model pre-trained on the Cityscape dataset is used to perform fine semantic segmentation on street view images, and the system extracts and quantifies the composition ratios of 19 key visual elements. The second stage is multi-dimensional perception prediction: Based on the ResNet-50 deep residual network trained on the large-scale crowdsourced dataset MIT Place Pulse 2.0, the perception evaluation is constructed as a binary classification task, and the perception scores of street view images in the six dimensions of beauty, safety, vitality, wealth, depression, and boredom are obtained through transfer learning. And by means of visualization methods, it presents its spatial differentiation pattern. The third stage is the analysis of perceptual elements: Taking 19 types of visual elements as features, the six-dimensional perception score and the comprehensive perception score as target variables, the LightGBM model was constructed, and combined with the SHAP (Shapley Additive Explanations) interpretation framework based on game theory, Quantify the contribution degree and action direction of each visual element in different perception dimensions, thereby identifying the key visual features that affect urban perception.
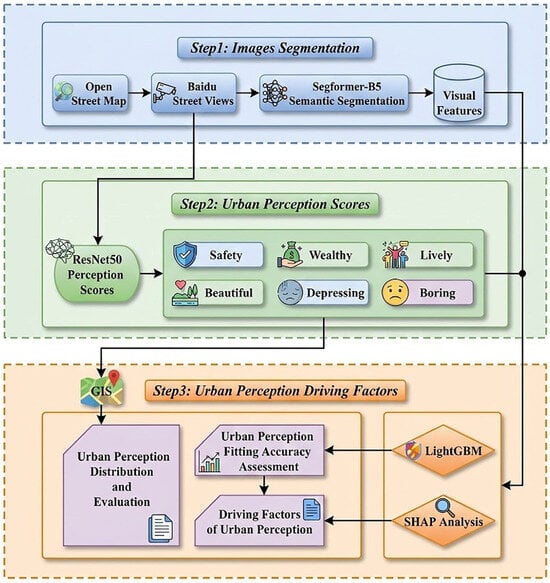
Figure 2.
Technology Roadmap.
4.1. Street View Image Semantic Segmentation
This study implemented the Pyramid Scene Parsing Network (PSPNet) architecture (Figure 3), trained on the MIT CSAIL-developed ADE20K dataset, to systematically quantify urban visual components. The ADE20K repository provides semantically rich annotations for 150 object categories spanning built environment features (e.g., buildings, infrastructure) and natural elements (e.g., sky, vegetation) [35]. PSPNet demonstrates particular efficacy in complex urban contexts, achieving 79.73% mean intersection-over-union (mIoU) segmentation accuracy, with its robustness for streetscape analysis empirically validated across multiple urban computing studies [36,37].
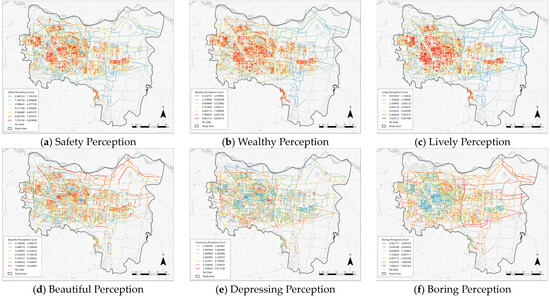
Figure 3.
Spatial distribution of different perception indicators.
Among them, is a multi-layer perceptron with 19 classes, and each ln is a pixel-by-pixel label mapping of in. CNN stands for Convolutional Neural Network. Each label map ln contains the pixel ratio of each object category in the street view image.
4.2. Perceptual Score Based on ResNet-50
This study adopts the ResNet-50 architecture, which is a 50-layer deep residual network proposed by He et al. [38] and uses a bottleneck design. Use its pre-trained form to take advantage of its proven effectiveness in capturing the hierarchical features of urban elements such as building facades and vegetation. To address the inherent uncertainties in perceptual evaluation, the established method is adjusted by reconstructing the task into a binary classification problem [39]. The implementation process consists of four consecutive components: data standardization, transfer learning, spatial quantification, and compound scoring. Our data standardization process involves strictly screening street view images with ≥5 annotations, using Q-score classification (mean ± standard deviation) to eliminate median values and enhance model robustness. Subsequent transfer learning is carried out through a 5:1 training-validation segmentation configuration, and the model performance is improved by iteratively optimizing the network parameters. In the spatial quantization stage, the classification probability is transformed into perception intensity indicators to achieve spatial mapping of subjective perception. The final output generates perception scores in six dimensions: beauty, boredom, depression, vitality, safety, and affluence. These scores are then aggregated into a composite score through weighted averaging. It is worth noting that score inversion is applied to the negative perception dimension to ensure that higher values always correspond to positive perception attributes and maintain the consistency of interpretation for all evaluation indicators.
4.3. Build an Environmental Perception Model Based on LightGBM
This study employs the LightGBM algorithm to model and analyze environmental perception and visual elements. LightGBM (Light Gradient Boosting Machine) is a Boosting method based on Gradient Boosting Decision Tree (GBDT) [40]. This algorithm effectively excludes most of the small Gradient samples by introducing gradient-based One-side Sampling (GOSS), and only retains the large gradient samples for information gain calculation. Thus, while ensuring the model accuracy, it reduces the amount of training data. In addition, LightGBM also adopts a leaf-wise strategy with depth constraints, that is, each time, the Leaf with the maximum splitting gain is found among all current leaf nodes for splitting, and this cycle continues. Under the condition of the same number of splits, the Leaf-wise strategy can reduce errors and improve accuracy. The restriction on the maximum tree depth further avoids the overfitting phenomenon.
To comprehensively evaluate the model’s performance, three quantitative indicators were implemented: Mean Absolute Error (MAE) quantifies the average prediction deviation, Root mean square error (RMSE) emphasizes larger prediction errors, and Coefficient of Determination (R2) assesses the explanatory power. The combination of these indicators provides a multi-dimensional assessment of the model’s accuracy in simulating human perceptual responses to urban visual stimuli. The calculation formula is as follows:
Among them, and respectively represent the predicted value and actual value of the RF model for the sample. represents the mean of the actual values of all samples. represents the total number of samples.
4.4. An Explanation Based on SHAP
SHAP (Shapley Additive Explanations) is an explainable machine learning framework based on the concept of Shapley values in cooperative game theory [41], providing model-independent explanations for feature contributions in predictive modeling. This game theory approach can operate without understanding the internal model architecture. Instead, it quantifies the positive and negative directional impacts of each variable on individual predictions by analyzing feature interactions and distribution patterns and through conditional expectation calculations. The obtained SHAP values not only reveal the intrinsic data distribution characteristics but also explain the model’s decision-making pattern.
In implementation, this interpretive framework assesses the differentiated impact of urban visual elements on different perception dimensions through the Shapley value decomposition system, and the calculation process is formalized in Formula (7) [42]. The magnitude and polarity of these values establish a quantified ranking of feature importance, thereby enabling systematic identification of the key visual determinants that shape human perception and response to the urban environment.
Here, represents the perceived predicted value of the visual element. represents the average value of environmental perception. represents the number of visual elements in the perception model. represents the SHAP value of the i-th visual element. i∈{0,1} indicates whether the i-th visual element participates in the model prediction. The calculation formula for the SHAP value [43] is as follows:
Here, represents the SHAP value of the -th visual element. represents the set of visual elements involved in the prediction. represents the collection of all visual elements.
In which the perceptual impact of urban visual elements is quantified as a weighted aggregation of score differences across different spatial configurations. This process is mechanically equivalent to calculating the weighted sum of the changes in perception scores under different combinations of visual element proportions, and ensures mathematical rigor through double validation: Formula (8) enforces algorithmic fairness through the principle of symmetrical distribution [44,45]. By processing the visual element dataset with the corresponding perception metrics through this SHAP framework, we have established a direct quantitative representation of the perception impact of environmental features. The obtained values exhibit magnitude dependent significance (absolute values indicate the intensity of influence) and pole-specific interpretation (positive/negative signs indicate directional effects), jointly forming an interpretable mapping between the visual characteristics of a city and its psychological impact. This method, through comparative analysis of their Shapley-derived contribution metrics, can systematically identify key design elements.
5. Results
5.1. Spatial Distribution of Different Perception Indicators
Based on the ArcGIS Pro 3.1.5 platform, the coordinate data of street view image collection points are spatially correlated with their perception scores. The natural breakpoint method is used to divide the scores of six types of perception indicators into seven grades, generating a spatial distribution map (Figure 3). The analysis results show that the four positive perception indicators of safety, prosperity, vitality and beauty present a spatial pattern of “Zhongzhou Avenue as the boundary” in the main urban area of Zhengzhou City. The area east of Zhongzhou Avenue generally shows a relatively high positive perception score, while the old urban area west of Zhongzhou Avenue shows the characteristics of obvious perception differentiation and concentration of local high values. The high-value zones for safety perception (high-value zone > 7.874736), prosperity perception (high-value zone > 8.467721), and vitality perception (high-value zone > 7.923512) have extremely high thresholds and are highly overlapping in space, mainly concentrated in areas such as the CBD of Zhengdong New District and the core business districts of Jinshui District. These places, with their well-developed infrastructure, high-quality building facades and vibrant business atmosphere, have jointly shaped a highly positive urban impression. In contrast, the high-value area of beauty perception (>7.626042) shows a different distribution pattern. Its distribution is not limited to the commercial core, but is more widely distributed along the waterfront green belts such as Jinshui River and Xiong ‘er River (>5.358731), as well as newly built landscape areas such as Beilong Lake and Longzi Lake, indicating that natural and artificial landscapes are the main driving forces of beauty perception.
In contrast to positive perception, the two negative perception indicators of suppression and boredom present a spatial pattern of “high in the periphery and specific areas”. The high depression perception areas (>7.529553) are mainly distributed in the traditional industrial areas in the west, around railway stations and construction sites on the outskirts of cities. These areas generally have the characteristics of dense buildings and chaotic environment. The high boredom perception area (>7.806227) is concentrated in large residential areas with a single architectural style and along the lackluster branch roads. The huge range of its values from the lowest 0.567777 to the highest 9.447562 reveals the extreme unevenness of the visual richness of the city’s streets. It is worth noting that the data analysis has revealed a special phenomenon: in the CBD of Zhengdong New District and some waterfront areas, there are regions with a high perception of beauty but also a relatively high perception of boredom. This indicates that although high-quality greening and modern architecture support a high beauty score, the single function of the street interface and the lack of diverse commercial and public activity Spaces have led to insufficient visual richness, thereby triggering a high sense of boredom. This proves that a single esthetic appeal is not enough to eliminate the negative perception brought about by the monotony of functions.
5.2. Spatial Distribution of Different Environmental Indicators
Based on the ArcGIS platform, the coordinate data of street view image collection points are spatially associated with nine types of environmental indicators. The natural breakpoint method is used to divide each indicator into seven levels, generating a spatial distribution map of environmental elements (Figure 4). The analysis results show that different types of built environmental elements present significant spatial differentiation characteristics in Zhengzhou City, and these environmental features provide a physical basis for understanding the spatial differences in urban perception.
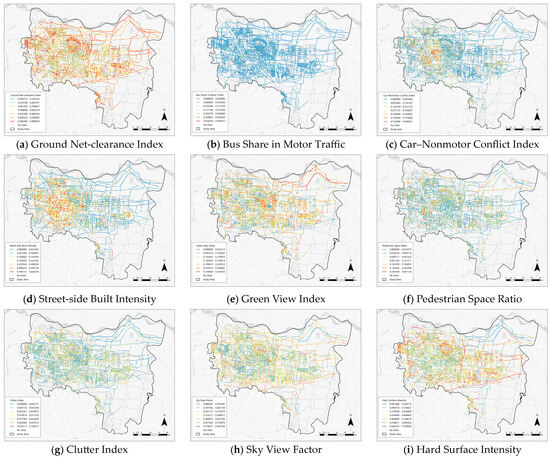
Figure 4.
Spatial distribution of different environmental indicators.
In the main urban area of Zhengzhou City, the positive elements characterizing environmental quality show spatial differentiation with Zhongzhou Avenue as the boundary. The high-value area (>0.329868) of the Green View Index is mainly distributed along the waterfront green belts such as Jinshui River and Xiong ‘er River, as well as the newly built landscape areas such as Beilong Lake and Longzi Lake in Zhengdong New District, which is highly consistent with the high-value area of beauty perception. The high-value areas of Pedestrian Space Ratio (>0.245400) and Ground Net-clearance index (>0.940466) are mainly concentrated in modern areas such as the CBD of Zhengdong New District and the core business district of Jinshui District. These areas provide material support for the perception of safety and affluence through spacious pedestrian Spaces and clean street interfaces. The high-value areas of the Sky View Factor (>0.579677) are also concentrated in the new urban areas with open architectural layouts, reflecting the sense of spatial openness in these areas. The old urban area west of Zhongzhou Avenue exhibits typical features such as high building density, rich but visually chaotic street interfaces, small block scales, and strong road connectivity, which form a sharp contrast with the newly built urban area.
In contrast, the indicators characterizing environmental pressure present different spatial patterns. The high-value areas of the Car–Nonmotor Conflict Index (>0.755909) are mainly concentrated around railway stations, traditional business districts and intersections of major roads. The traffic flow in these areas is complex and there are significant safety hazards. The high-value areas of Clutter Index (>0.035517) are mainly distributed in the traditional industrial areas in the west, the old urban areas and some urban fringe areas. These areas generally have problems such as disorderly street facilities and messy billboards, corresponding to the perception of poor environmental tidiness. The high-value areas of Hard Surface Intensity (>0.604325) are widely distributed along the core business districts and major traffic arteries of the city, reflecting the insufficiency of ecological regulation capacity in these areas. It is worth noting that, in some areas such as the CBD of Zhengdong New District, a special phenomenon emerged where the Green View Index was relatively high (0.252913–0.329867), but the Pedestrian Space Ratio was relatively low (0.150282–0.245399). Street view image analysis shows that although these areas have high-quality central greenery and modern buildings, the scale of the streets is large, and the convenience and humanization of walking are insufficient, resulting in a mismatch between visual esthetics and walking experience. This might be the environmental cause of the phenomenon where both the perception of beauty and boredom in this area are relatively high simultaneously.
5.3. Correlation Analysis of Different Perception Indicators
To explore the intrinsic connection between urban perception and built environmental elements, this study extracted nine environmental indicators based on street view images and conducted Pearson correlation analysis with six types of perception indicators (Figure 5). The results show that there is a significant correlation between different perception dimensions and specific environmental elements.
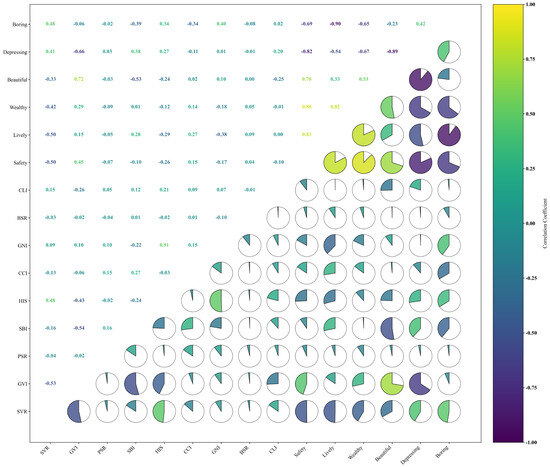
Figure 5.
Spatial distribution of different environmental.
The environmental drivers of negative perception are relatively concentrated. Boredom perception was significantly positively correlated with Hard Surface Intensity (r = 0.48) and Clutter Index (r = 0.40), and strongly negatively correlated with Green View Index (r = −0.69). Repressive perception is also highly negatively correlated with the Green View Index (r = −0.66), indicating that green scarcity and high-density built environments are prone to induce negative emotions.
The environmental basis for positive perception is more diverse. The Green View Index has the strongest positive correlation with beauty perception (r = 0.72), highlighting the shaping effect of green view landscapes on the esthetic appeal of the city. Affluent perception is highly correlated with the Pedestrian Space Ratio (r = 0.84) and the Ground Net-clearance Index (r = 0.83), indicating the key role of wide and clean streets in affluent perception. Vitality perception also depends on the Pedestrian Space Ratio (r = 0.83), while security perception is positively correlated with the Green View Index (r = 0.45) and the Sky View Factor (r = 0.51), reflecting the importance of an open and transparent visual environment for a sense of security.
Furthermore, CAR-nonmotor Conflict Inde is negatively correlated with safety perception (r = −0.26), while Clutter Index systematically weakens positive perception and enhances negative perception, becoming a key entry point for optimizing urban perception. Relevant analysis provides a clear path for precisely intervening in perceptual experience through environmental elements.
5.4. Regression Analysis of Zhengzhou City
This study conducted a regression analysis of street view images based on the LightGBM algorithm to evaluate the urban perception characteristics of Zhengzhou City in six perception dimensions: beauty, boredom, depression, vitality, safety and prosperity. Taking the perception score predicted by the ResNet-50 model as the dependent variable and nine street view visual elements as features, a regression model of six perception dimensions was constructed. During the training process, a 5-fold cross-validation method was adopted and repeated twice to optimize the model’s hyperparameters. The fitting degree and generalization ability of the model were evaluated through the mean square error (MSE) and the coefficient of determination (R2).
The model evaluation results show (Table 1) that there are differences in the prediction performance of each perception dimension. The esthetic perception model has the strongest explanatory power. The R2 of the test set reaches 0.6190, indicating that the model can capture the visual features related to esthetics in the image quite well. The model performances of boredom perception and vitality perception are also relatively stable, with R2 of the test sets being 0.6427 and 0.6434, respectively. In contrast, the models of repressive perception (test set R2 = 0.5699) and affluent perception (test set R2 = 0.4703) performed relatively weakly, possibly due to the higher subjectivity of these perception dimensions and the complexity of visual cues. The predictive performance of the safety perception model lies somewhere in between, with the test set R2 being 0.5001.

Table 1.
Regression Analysis Results.
Overall, this series of models has successfully revealed the connection between the street scene visual environment and multi-dimensional perception in Zhengzhou City. The perceptual features of beauty, boredom and vitality dimensions can be effectively captured by the model, while the modeling of suppression and abundance perception suggests that future research needs to incorporate more non-visual features such as socio-economic or functional mix degree to enhance the explanatory power.
5.5. LightGBM Regression Results
Based on the results of the feature importance analysis (Figure 6), the research found that the Green Visibility Index (GVI) is a core element in shaping the positive perception of a city. Its importance in the perception of beauty is as high as 70.53%, and it contributes 22.25% and 14.67%, respectively, in the perception of safety and prosperity, highlighting the fundamental role of greening in enhancing the multi-dimensional perception quality of a city. The Sky visibility factor (SVF) exhibits significant dual characteristics in different perception dimensions: on the one hand, it serves as a key element in the formation of a sense of security (39.79%), while on the other hand, it may exacerbate boredom by causing the absence of street interfaces (21.75%), revealing the complexity of the influence mechanism of built environmental elements. In addition, the proportion of pedestrian space (PSR) dominates in the perception of affability (31.15%), and the ground clearance index (GNI) contributes the most to the perception of vitality (34.67%), all pointing to the importance of humanized design and spatial tidiness for high-quality urban experiences. The research also identified building density (SBI) and traffic conflict (CCI) as the main sources of negative perception, having a significant impact on both boredom and depression perception. These findings indicate that the formation of urban perception depends on the synergistic effect of multiple elements. A single environmental element may play a completely different role in different perception dimensions, which provides a scientific basis for regulating urban perception through precise environmental design and suggests that future urban renewal should focus on the coordinated advancement of the construction of a green system, the control of spatial scale, and the optimization of functional layout.
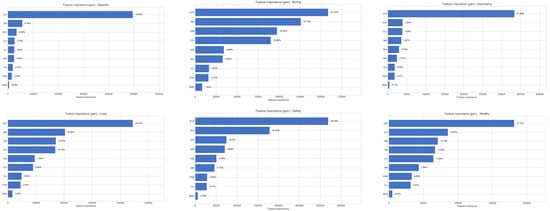
Figure 6.
LightGBM Feature Importance Ranking.
Multidimensional analysis based on SHAP values reveals the complex influence mechanisms and directions of different visual elements on urban perception (Figure 7). Research has found that the Green Visibility Index (GVI) has a significant positive driving effect on beauty perception. Its high value significantly enhances the evaluation of beauty, reflecting the core position of greening in shaping the esthetic appeal of a city. The Sky visibility factor (SVF) shows a clear positive impact on security perception, indicating that an open visual space helps enhance a sense of security. However, in the perception of boredom, a higher SVF value is associated with negative evaluations, revealing that the same element may play opposite roles in different perception dimensions. Further analysis indicates that the ground clearance Index (GNI), as a key positive element of vitality perception, significantly promotes the feeling of street vitality when its improvement is enhanced. However, building density (SBI) and vehicle conflict (CCI) exhibit a relatively strong negative impact in the perception of oppression. It is particularly worth noting that the contribution of the pedestrian space ratio (PSR) to the perception of affluence shows nonlinear characteristics, only generating positive effects within the appropriate range, and the promoting effect weakens after exceeding the threshold. The hard interface ratio (HIS) also shows a positive correlation in the perception of affordance, but a negative correlation with the perception of vitality, suggesting its dual role in different contexts.
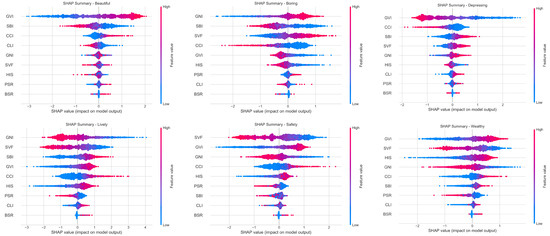
Figure 7.
Multidimensional Analysis of SHAP Values.
It is found that from the two dimensions of the direction and intensity of the elements’ effects, the understanding of the complex relationship between the urban visual environment and subjective perception has been deepened, providing a quantitative basis for precise urban design. It is suggested that in planning practice, attention should be paid to the coordinated allocation among elements, and differentiated strategies should be adopted for specific perception goals, so as to achieve a systematic improvement in the quality of urban space.
6. Discussion and Conclusions
6.1. Conclusions
This paper constructs a comprehensive analysis framework integrating street view images, deep learning and interpretable machine learning, and quantitatively measures and explains the mechanism of urban perception in Zhengzhou City. Unlike traditional research, this framework analyzes the contribution and direction of action of visual elements to subjective perception from within the model through the SHAP method, thereby transcending the description of phenomena and precisely revealing the spatial pattern of perception results and the deep environmental driving forces behind their formation.
(1) The urban perception of Zhengzhou City presents a spatial differentiation feature with Zhongzhou Avenue as the boundary. Positive perception (safety, prosperity, vitality, and beauty) has demonstrated a “high center” agglomeration pattern in modern areas such as the CBD of Zhengdong New District and the core business district of Jinshui District. Its high value is closely related to the high-quality environmental elements such as the open Sky View Factor, sufficient Green View Index and spacious pedestrian space in the newly built urban area. The old urban area west of Zhongzhou Avenue, on the other hand, is characterized by a rich variety of historical buildings, a dense flow of people, diverse but visually chaotic street interfaces, small block scales, and high building density. In some areas, due to the chaotic environment and single function, negative perception has accumulated.
(2) The influence of each visual element was quantified through the random forest model and SHAP analysis. The Green View Index was identified as a core element for shaping positive perception (with the importance of beauty perception features reaching 70.53%) and suppressing negative perception. The Sky View Factor and the Pedestrian Space Ratio together constitute the basis of the perception of safety, affability and vitality. The research also reveals the complexity of the role of environmental factors. In the newly built urban area east of Zhongzhou Avenue, due to the large street scale and single building interface, the SVF value is relatively high. Although it enhances the sense of openness, it intensifies the sense of boredom in specific situations, reflecting the nonlinear characteristics of the perceptual influence mechanism.
(3) It is suggested that, in the planning, the characteristics of the built environment on both the east and west sides of Zhongzhou Avenue should be combined to implement differentiated renewal strategies. The visual order and vitality of the old urban area on the west side should be enhanced through interface improvement, functional integration and micro-updates. The newly built urban area on the east side should enhance the details of the building interface, control the scale of the streets and increase the diversity of functions to alleviate the perceptual contradiction of “beautiful but boring”. The findings provide a scientific basis and precise entry points for urban design and renewal practices. It is suggested that in the planning, the characteristics of the built environment on both the east and west sides of Zhongzhou Avenue should be combined to implement differentiated renewal strategies.
6.2. Discussion
The perceptual spatial pattern of Zhengzhou City revealed in this study not only confirms the universal law of the “center-edge” gradient of urban perception, but also demonstrates the uniqueness of it as a regional central city. Compared with first-tier cities like Beijing and Shanghai, the high-value areas of beauty perception in Zhengzhou are more prominently distributed along the riverside green belts such as Jinshui River and Xiong ‘er River, which is closely related to its construction concept of “Beautiful City by Water”. This finding contrasts sharply with Zhang et al. [14]’s research on Beijing, where the perception of beauty is more associated with historical and cultural heritage areas and modern commercial centers. In contrast, Zhengzhou demonstrates the emphasis placed by an emerging inland central city on ecological landscape construction. Meanwhile, as a newly built urban area, Zhengdong New District, with its wide street scale, complete infrastructure and reasonable functional layout, has jointly contributed to the continuous high-value distribution of vitality perception. This feature is relatively rare in the research on Chinese cities by Wei et al. [18], reflecting the practical achievements of urban planning concepts in the new era.
The causes of negative perception are particularly worthy of in-depth exploration. The research finds that the perception of repression in Zhengzhou City presents a “dual-core” distribution feature, which not only occurs in the old urban area with dense buildings, but also exists in some newly built areas. The SHAP analysis results reveal the environmental causes of this phenomenon from the mechanism level: On the one hand, some new districts overly pursue visual effects, leading to an imbalance in spatial scale. Although an excessively high SVF value (>0.65) enhances the sense of openness, it also intensifies the sense of spatial coldness due to the lack of building enclosure. On the other hand, the lack of vertical greening and details on the building facade has prevented the positive effects of the GVI from being fully exerted, intensifying the sense of oppression in the space. The special phenomenon of “beautiful but boring” that has emerged in areas such as the CBD of Zhengdong New District reveals the common problem of “emphasizing landscape over function” in current urban construction. Simple visual beautification is not enough to create a vibrant urban space; it must be combined with diverse commercial facilities and public activity Spaces. This finding corroborates the research conclusion of Liu et al. [25] on the impact of functional mixing degree on vitality perception, further strengthening the key role of functional diversity in the formation of urban perception.
Based on the SHAP analysis results, this study proposes the following targeted optimization suggestions:
(1) In terms of vegetation configuration, it is recommended to adopt a composite greening system of trees, shrubs and ground covers to maintain the road green coverage rate within the optimized range of 25% to 35%. This range has been proven in the SHAP analysis to maximize the positive effects of GVI. At the same time, control the density of trees to maintain visual corridors, ensuring that the SVF remains within the ideal range of 0.4 to 0.6, taking into account both openness and spatial enclosure.
(2) In terms of architectural interface treatment, the visual richness should be enhanced by increasing the advance and retreat relationship, using harmonious material colors, and controlling the length of continuous interfaces (it is recommended not to exceed 50 m). SHAP analysis shows that appropriate changes in the architectural interface can reduce the negative impact of SBI on boredom perception by approximately 23%.
(3) In terms of the organization of street Spaces, emphasis should be placed on functional integration. Especially in waterfront areas where beauty perception is high but boredom is obvious, small-scale commercial functions such as coffee shops, bookstores, and convenience stores, as well as cultural and leisure functions such as exhibitions and performances, should be appropriately added. Research shows that when the functional blending degree is raised above 1.8, the perception of vitality can increase by approximately 35%, effectively alleviating the perceptual contradiction of “beautiful but boring”.
These design suggestions based on quantitative analysis provide specific and feasible technical paths for improving the spatial quality of Zhengzhou and other similar cities, and also offer practical examples for data-driven urban design methods.
6.3. Limitations and Future Research
Despite its contributions, this study has several limitations. Firstly, the reliance on Baidu Street View imagery inherently limited data coverage, excluding some back streets and renewal areas, which may affect the generalizability of the perceptual map. Secondly, while seasonal effects were controlled, the analysis captured a static visual snapshot and did not account for dynamic factors like weather, time of day, or pedestrian flow, which are integral to real-time urban experience. Thirdly, the perception model, though robust, is based on a globally trained dataset; its cultural specificity and adaptability to the inland Chinese context could be further enhanced with a localized training corpus. Additionally, the study primarily assessed the individual impact of visual elements, leaving the interaction effects between different environmental features (e.g., greenery and building interfaces) for future exploration. Finally, urban perception is a multi-sensory process, yet this research focused solely on visual cues, omitting the influences of sound, smell, and tactile experiences. Addressing these limitations in future work, through multi-source data integration, dynamic modeling, and cross-sensory investigation, will lead to a more holistic understanding of human perception in urban environments.
Author Contributions
M.Z., Conceptualization; Writing—original draft; Writing—review and editing. C.P., Writing—original draft; Validation; Investigation. X.H., Writing—review and editing; Visualization. L.Z., Writing—review; Supervision; Validation; Data curation; Resources. M.L., Writing—review and editing; Software. All authors have read and agreed to the published version of the manuscript.
Funding
This research was funded by (1) Zhejiang Provincial Educational Science Planning Project (2025SCG205); (2) 2025 Annual Guangdong Provincial Ordinary Higher Education Institutions Young Innovative Talent Project (2025SCG205); (3) University Scheme of Social Sciences Research Fund of Henan Province (No. 2025-ZZJH-354); (4) Projects of Talents Recruitment of GDUPT (2023rcyj2015); (5) Science and Technology Programme of Maoming of Guangdong Province of China (2025664); and (6) Guangdong Province Maoming City Philosophy and Social Sciences Planning Jointly Built Project (2025GJ10).
Data Availability Statement
The datasets used and/or analyzed during the current study are available from the corresponding author on reasonable request.
Conflicts of Interest
The authors declared no potential conflicts of interest with respect to the research, authorship, and/or publication of this article.
References
- Lynch, K. The Image of the City; MIT Press: Cambridge, MA, USA, 1960. [Google Scholar]
- Saleses, P.; Schechtner, K.; Hidalgo, C.A. The collaborative image of the city: Mapping the inequality of urban perception. PLoS ONE 2013, 8, e68400. [Google Scholar] [CrossRef]
- Dubey, A.; Naik, N.; Parikh, D.; Raskar, R.; Hidalgo, C.A. Deep learning the city: Quantifying urban perception at a global scale. In Proceedings of the European Conference on Computer Vision, Amsterdam, The Netherlands, 11–14 October 2016; Springer: Cham, Switzerland, 2016; pp. 196–212. [Google Scholar]
- Liu, X.; He, J.; Yao, Y.; Zhang, J.; Liang, H.; Wang, H.; Hong, Y. Classifying urban land use by integrating remote sensing and social media data. Int. J. Geogr. Inf. Sci. 2017, 31, 1675–1696. [Google Scholar] [CrossRef]
- Ge, Y.; Zhang, H.; Liu, X. Assessing sense of place in urban neighborhoods using social media data: A case study of Luoyang, China. Sustainability 2020, 12, 2134. [Google Scholar]
- Xie, L.; Zhang, H.; Wang, C. Identification of urban functional areas based on the multimodal deep learning fusion of high-resolution remote sensing images and social perception data. Buildings 2022, 12, 556. [Google Scholar] [CrossRef]
- Cheng, L.; Chu, S.; Zong, W.; Li, S.; Wu, J.; Li, M. Use of Tencent street view imagery for visual perception of streets. ISPRS Int. J. Geo-Inf. 2017, 6, 265. [Google Scholar] [CrossRef]
- Zhang, F.; Zhou, B.; Liu, L.; Liu, Y.; Fung, H.H.; Lin, H.; Ratti, C. Measuring human perceptions of a large-scale urban region using machine learning. Landsc. Urban Plan. 2018, 180, 148–160. [Google Scholar] [CrossRef]
- Wei, J.; Yue, W.; Li, M.; Gao, J. Mapping human perception of urban landscape from street-view images: A deep-learning approach. Int. J. Appl. Earth Obs. Geoinf. 2022, 112, 102886. [Google Scholar] [CrossRef]
- Lundberg, S.M.; Lee, S.I. A unified approach to interpreting model predictions. In Proceedings of the Advances in Neural Information Processing Systems, Long Beach, CA, USA, 4–9 December 2017; pp. 4765–4774. [Google Scholar]
- Liu, Y.; Chen, M.; Wang, M.; Huang, J.; Thomas, F.; Rahimi, K.; Mamouei, M. A Study on the Interpretable Urban Perception Model Based on Street View Images. J. Geo-Inf. Sci. 2022, 24, 2045–2057. [Google Scholar]
- Office of the Leading Group for the Seventh National Population Census of the State Council. Main Data of the Seventh National Population Census; China Statistics Press: Beijing, China, 2021.
- Yao, Y.; Liang, Z.; Yuan, Z.; Liu, P.; Bie, Y.; Zhang, J.; Wang, R.; Wang, J.; Guan, Q. A human-machine adversarial scoring framework for urban perception assessment using street-view images. Int. J. Geogr. Inf. Sci. 2019, 33, 2363–2384. [Google Scholar] [CrossRef]
- Ma, X.; Ma, C.; Wu, C.; Xi, Y.; Yang, R.; Peng, N.; Zhang, C. Measuring human perceptions of streetscapes to better inform urban renewal: A perspective of scene semantic parsing. Cities 2021, 110, 103086. [Google Scholar] [CrossRef]
- Tang, J.; Long, Y. Measuring visual quality of street space and its temporal variation: Methodology and its application in the Hutong area in Beijing. Landsc. Urban Plan. 2019, 191, 103436. [Google Scholar] [CrossRef]
- Liu, S.; Long, Y.; Zhang, L.; Yang, J.; Dong, W. Quantitative measurement of urban spatial vitality by integrating physical built environment and subjective perception dimensions. Environ. Plan. B Urban Anal. City Sci. 2024, 52, 131–149. [Google Scholar] [CrossRef]
- He, K.; Zhang, X.; Ren, S.; Sun, J. Deep residual learning for image recognition. In Proceedings of the IEEE Conference on Computer Vision and Pattern Recognition, Denver, CO, USA, 3–7 June 2016; pp. 770–778. [Google Scholar]
- Han, H.; Yang, K.; Yang, C.; Yang, G.; Xu, L. Influence and Mechanism of a Multi-Scale Built Environment on the Leisure Activities of the Elderly: Evidence from Hefei City in China. Int. J. Environ. Res. Public Health 2022, 19, 9237. [Google Scholar] [CrossRef]
- Pan, C.; Li, H.; Wang, L.; Wu, J.; Guo, J.; Qiu, N.; Liu, X. Data science basis and influencing factors for the evaluation of environmental safety perception in Macau parishes. Adv. Contin. Discret. Models 2024, 2024, 44. [Google Scholar] [CrossRef]
- Chen, C.; Li, H.; Luo, W.; Xie, J.; Yao, J.; Wu, L.; Xia, Y. Predicting the effect of street environment on residents’ mood states in large urban areas using machine learning and street view images. Sci. Total Environ. 2022, 816, 151605. [Google Scholar] [CrossRef] [PubMed]
- Hu, S.; Xing, H.; Luo, W.; Wu, L.; Xu, Y.; Huang, W.; Liu, W.; Li, T. Uncovering the association between traffic crashes and street-level built-environment features using street view images. Int. J. Geogr. Inf. Sci. 2023, 37, 2367–2391. [Google Scholar] [CrossRef]
- Ke, G.; Meng, Q.; Finley, T.; Wang, T.; Chen, W.; Ma, W.; Ye, Q.; Liu, T.Y. LightGBM: A Highly Efficient Gradient Boosting Decision Tree. In Proceedings of the Advances in Neural Information Processing Systems, Long Beach, CA, USA, 4–9 December 2017; pp. 3146–3154. [Google Scholar]
- Lundberg, S.M.; Erion, G.; Chen, H.; DeGrave, A.; Prutkin, J.M.; Nair, B.; Katz, R.; Himmelfarb, J.; Bansal, N.; Lee, S.I. From local explanations to global understanding with explainable AI for trees. Nat. Mach. Intell. 2020, 2, 56–67. [Google Scholar] [CrossRef]
- Yang, J.; Li, X.; Du, J.; Cheng, C. Exploring the relationship between urban street spatial patterns and street vitality: A case study of Guiyang, China. Int. J. Environ. Res. Public Health 2023, 20, 1646. [Google Scholar] [CrossRef]
- Li, X.; Zhang, C.; Li, W. Does the visibility of greenery increase perceived safety in urban areas? Evidence from the Place Pulse 1.0 dataset. ISPRS Int. J. Geo-Inf. 2015, 4, 1166–1183. [Google Scholar] [CrossRef]
- Biljecki, F.; Ito, K. Street view imagery in urban analytics and GIS: A review. Landsc. Urban Plan. 2021, 215, 104217. [Google Scholar] [CrossRef]
- Xu, G. Study on Spatial Heterogeneity of Urban Agglomeration Network Structure from the Perspective of Multidimensional Flow in Western Ethnic Minority Areas. Ph.D. Thesis, Southwest University, El Paso, TX, USA, 2022. [Google Scholar]
- Liu, Y.; Li, Z.; Tian, Y.; Gao, B.; Wang, S.; Qi, Y.; Zou, Z.; Li, X.; Wang, R. A study on identifying the spatial characteristic factors of traditional streets based on visitor perception: Yuanjia Village, Shaanxi Province. Buildings 2024, 14, 1815. [Google Scholar] [CrossRef]
- Quercia, D.; O’Hare, N.K.; Cramer, H. Aesthetic capital: What makes London look beautiful, quiet, and happy? In Proceedings of the 17th ACM Conference on Computer Supported Cooperative Work & Social Computing, Baltimore, MD, USA, 15–19 February 2014; pp. 945–955. [Google Scholar]
- Porzi, L.; Rota Bulò, S.; Lepri, B.; Ricci, E. Predicting and understanding urban perception with convolutional neural networks. In Proceedings of the 23rd ACM International Conference on Multimedia, Brisbane, Australia, 26–30 October 2015; pp. 139–148. [Google Scholar]
- Chen, B.; Feng, Q.; Niu, B.; Yan, F.; Gao, B.; Yang, J.; Gong, J.; Liu, J. Multi-modal fusion of satellite and street-view images for urban village classification based on a dual-branch deep neural network. Int. J. Appl. Earth Obs. Geoinf. 2022, 109, 102794.7. [Google Scholar] [CrossRef]
- Naik, N.; Philipoom, J.; Raskar, R.; Hidalgo, C. Streetscore-Predicting the Perceived Safety of One Million Streetscapes. In Proceedings of the IEEE Conference on Computer Vision and Pattern Recognition Workshops, Columbus, OH, USA, 23–28 June 2014; pp. 779–785. [Google Scholar]
- Liu, Y.; Chen, M.; Wang, M.; Huang, J.; Thomas, F.; Rahimi, K.; Mamouei, M. An interpretable machine learning framework for measuring urban perceptions from panoramic street view images. Iscience 2023, 26, 106132. [Google Scholar] [CrossRef]
- Huang, J.; Qing, L.; Han, L.; Liao, J.; Guo, L.; Peng, Y. A collaborative perception method of human-urban environment based on machine learning and its application to the case area. Eng. Appl. Artif. Intell. 2023, 119, 105746. [Google Scholar] [CrossRef]
- Suo, W.; Zhao, J. Exploring the Streetscape Perceptions from the Perspective of Salient Landscape Element Combination: An Interpretable Machine Learning Approach for Optimizing Visual Quality of Streetscapes. Land 2025, 14, 1408. [Google Scholar] [CrossRef]
- Lin, M.; Chau, C.K.; Hou, H.C.; Tang, S.K. Development of an interpretable machine-learning model for capturing nonlinear dynamics of multisensory interactions in public open spaces. Build. Environ. 2025, 280, 113072. [Google Scholar] [CrossRef]
- Kuang, B.; Yang, H.; Jung, T. The Impact of Visual Elements in Street View on Street Quality: A Quantitative Study Based on Deep Learning, Elastic Net Regression, and SHapley Additive exPlanations (SHAP). Sustainability 2025, 17, 3454. [Google Scholar] [CrossRef]
- Cao, H.; Weng, M.; Kang, M.; Su, S. Unraveling the relationship between coastal landscapes and sentiments: An integrated approach based on social media data and interpretable machine learning methods. Trans. GIS 2024, 28, 1065–1089. [Google Scholar] [CrossRef]
- Li, Y.; Lu, J.; Meng, Y.; Luo, Y.; Ren, J. Exploring Urban Spatial Quality Through Street View Imagery and Human Perception Analysis. Buildings 2025, 15, 3116. [Google Scholar] [CrossRef]
- Zhang, J.; Yu, Z.; Li, Y.; Wang, X. Uncovering bias in objective map** and subjective perception of urban building functionality: A machine learning approach to urban spatial perception. Land 2023, 12, 1322. [Google Scholar] [CrossRef]
- Zhao, X.; Lu, Y.; Lin, G. An integrated deep learning approach for assessing the visual qualities of built environments utilizing street view images. Eng. Appl. Artif. Intell. 2024, 130, 107805. [Google Scholar] [CrossRef]
- Zhong, W.; Wang, L.; Han, X.; Gao, Z. Spatiotemporal Analysis of Urban Perception Using Multi-Year Street View Images and Deep Learning. ISPRS Int. J. Geo-Inf. 2025, 14, 390. [Google Scholar] [CrossRef]
- Kang, W.; Kang, N.; Wang, P. Predicting Perceived Restorativeness of Urban Streetscapes Using Semantic Segmentation and Machine Learning: A Case Study of Liwan District, Guangzhou. Buildings 2025, 15, 3671. [Google Scholar] [CrossRef]
- Lee, S.; Cho, N.; Park, H. Exploring nonlinear and interactive associations between built environment features and subjective streetscape perceptions. NPJ Urban Sustain. 2025, 5, 104. [Google Scholar] [CrossRef]
- Yu, M.; Chen, X.; Zheng, X.; Cui, W.; Ji, Q.; Xing, H. Evaluation of spatial visual perception of streets based on deep learning and spatial syntax. Sci. Rep. 2025, 15, 18439. [Google Scholar] [CrossRef]


Disclaimer/Publisher’s Note: The statements, opinions and data contained in all publications are solely those of the individual author(s) and contributor(s) and not of MDPI and/or the editor(s). MDPI and/or the editor(s) disclaim responsibility for any injury to people or property resulting from any ideas, methods, instructions or products referred to in the content. |
© 2026 by the authors. Licensee MDPI, Basel, Switzerland. This article is an open access article distributed under the terms and conditions of the Creative Commons Attribution (CC BY) license.