Abstract
Damage to structural members or joints can change the load transfer path of the structure. Additionally, structures may experience severe damage or even collapse due to the impact of aftershocks. To investigate the effects of beam-column joint damage, link damage, and aftershocks on the seismic performance of K-shaped eccentrically braced steel frame (K-EBF) structures, incremental dynamic analysis, fragility analysis, and collapse resistance evaluation were conducted using examples of 12-story and 18-story K-EBF structures. The results showed that considering beam-column joint damage, link damage, and aftershocks compared to not considering them, and the maximum inter-story drift ratio (θmax) of the 12-story and 18-story K-EBF structures increased by 11.1% and 20.1%, respectively, under fortification earthquakes, and by 30.0% and 56.7%, respectively, under rare earthquakes. The failure probability of the severe damage limit state of the 12-story and 18-story K-EBF structures increased by 1.0% and 3.0%, respectively, under fortification earthquakes, and by 15.3% and 24.0%, respectively, under rare earthquakes. Additionally, the minimum collapse margin ratios (CMRP = 10%) of the two structures decrease by 27.8% and 32.3%, respectively. The influence of aftershocks on the structural seismic response tends to intensify as the intensity of ground motion increases, and the beam-column joint damage and link damage further increases the failure probability of different damage limit states, leading to a decrease in the minimum collapse resistance coefficient of the structure. Therefore, in the seismic performance analysis of K-EBF structures, the effects of beam-column joint damage, link damage, and aftershocks should be fully considered to accurately reflect the response of structures under seismic actions. Overall, the impact of link damage, as well as aftershocks, on the structural collapse resistance is greater than that of beam-column joint damage.
1. Introduction
Historical earthquake disasters have shown that a series of aftershocks often follow a strong mainshock, and a series of aftershocks will occur. These aftershocks can sometimes be even more destructive than the main shock, especially when the damage caused by the main shock is not promptly repaired [1]. For example, in 2024, a 7.6-magnitude earthquake occurred in Ishikawa Prefecture, Japan, with more than 1200 noticeable aftershocks subsequently occurring. The main shock and aftershocks resulted in the deaths of 129 people, with 111 of them dying from collapsed buildings, accounting for nearly 90% of the total fatalities.
The K-shaped eccentrically braced frame (K-EBF) structure is a commonly used layout form of eccentrically braced steel frame structures. Compared to traditional braced frames, the K-EBF has a higher lateral stiffness. The K-EBF can absorb and dissipate seismic energy through the inelastic deformation of the link under seismic action, thereby protecting other components from buckling. This design enables the structure to have good ductility and energy-dissipation capability.
In recent years, many scholars have conducted research on the seismic performance of K-EBF structures. Ramon et al. [2] conducted research on the seismic performance of K-EBF structures with short links, finding that the structures designed with high strength and stiffness exhibit a lower likelihood of collapse under rare earthquakes. Masood et al. [3] evaluated the influence of braced damage on the collapse probability of K-EBF structures by Incremental Dynamic Analysis (IDA) and fragility analysis, and found that under low-frequency spectral accelerations, the structural collapse probability would increase significantly due to braced damage. Mohsen et al. [4] found that the web thickness and yield strength of links have significant effects on the seismic performance of K-EBF structures. Omid et al. [5] studied the collapse losses, demolition losses, structural repair losses, and non-structural repair losses of the K-EBF structures under earthquakes. Elif et al. [6] investigated the effect of strain hardening rate on the seismic performance of K-EBF structures and found that, compared to parameters such as inter-story displacement, rotation angle of links, and floor acceleration, the residual inter-story displacement is more significantly affected by the strain hardening rate. Ye et al. [7] investigated the impact of the connection configuration between links and frame beams on the seismic performance of K-EBF structures, finding that the structure with extended end plate connection configuration exhibited higher bearing capacity and energy-dissipating capacity compared to the structure with flush end plate connection configuration. Yu et al. [8] investigated the seismic performance of K-EBF structures incorporating dog-bone weakened flexural links. The proposed dog-bone weakened design, along with the appropriate spacing of stiffeners within the links, can result in bending plastic deformation across a larger area of the link, thereby enhancing the structure’s energy-dissipating capacity. Yin et al. [9] found that after considering the influence of floor slabs, the seismic performance of K-EBF structures significantly improved. Additionally, they also investigated the seismic performance of structures when traditional braces were replaced with buckling-restrained braces.
Although a series of research studies has been carried out on the seismic performance of K-EBF structures, most existing studies only focus on the analysis of mainshocks or consider the damage of a single component (e.g., links or braces). Under mainshock-aftershock sequences, the coupled effect of link damage and beam-column joint damage on the performance of the entire structural system has not yet been quantitatively studied. To address this gap, this study established a numerical model that can simultaneously simulate the shear yielding and failure of links, the semi-rigidity of beam-column joints, and their damage evolution. Using this model, the influences of three factors, mainshock-aftershock sequences, link damage, and joint damage, and their interactions on the dynamic response, vulnerability, and collapse risk of K-EBF structures were quantified for the first time.
2. Structural Analysis Model
2.1. K-EBF Structure Model
Based on the Code for Seismic Design of Buildings GB 50011-2010 [10] and the Technical Specification for Steel Structures of Tall Buildings JGJ99-2015 [11], two K-EBF structural models were designed: a 12-story and an 18-story model, both utilizing beam-column connections with flush end-plates. Assuming that the seismic fortification intensity in the area where the building is located in the region with intensity VIII, the site category is Class III, and the earthquake design group is Group II. As shown in Figure 1, the eccentric braces are positioned in the middle lateral span, with each span measuring 7.8 m with a story height of 3.9 m. Shear-type links with e < 1.6 Mp/Vp (where Mp is the full plastic bending capacity and Vp is the plastic shear capacity) are utilized. The length of each link is 1.0 m (e/l = 0.128). The beam-column connections utilized semi-rigid connections featuring flush end-plates, while the brace-frame connections utilized hinged connections. In the design, according to the “General Code for Engineering Structures” GB55001-2021 [12], the standard values of dead load and live load for accessible roofs are 8.25 kN/m2 and 2 kN/m2, respectively. Likewise, for floors, the standard values for the dead load and live load are 7.8 kN/m2 and 2 kN/m2, respectively. All members are made of Q345 steel, with welded I-shaped cross-sections. The dimensions of the structural members are detailed in Table 1 and Table 2.
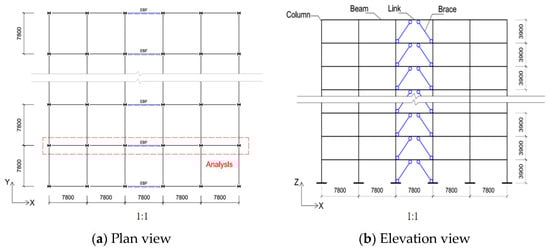
Figure 1.
Plan and elevation views of the buildings (unit: mm).

Table 1.
Member sizes for the 12-story K-EBF model (unit: mm; section notations: h × b × tw × tf).
Table 2.
Member sizes for the 18-story K-EBF model (unit: mm; section notations: h × b × tw × tf).
2.2. K-EBF Numerical Model
Taking the steel frame in the X-direction from Figure 1a as the analysis model, as shown in Figure 1b, a finite element model of the structure was established using ABAQUS 2020 software. The beam element B32 was used to model the structural members, such as the columns, beams, and braces. The vertical loads (dead loads and live loads) were simplified to mass blocks distributed on the beams, and these mass blocks were modeled using the mass element (MASS) in the ABAQUS software. The brace-to-frame were taken to be ideally pinned, modeled using the “Release” of the ABAQUS keyword. And the column bases were taken to be ideally fixed. The out-of-plane displacements of the columns and beams were restrained. The weak axis of the cross-section for the braces, beams, links, and columns lay in the plane of the structural model. The out-of-plane imperfections of the braces were considered as 1/500 multiplied by their lengths [13]. A bilinear hysteretic response with 1% strain hardening was assumed for the material in the nonlinear time history analysis.
2.2.1. Beam-Column Joint Model
When damage to the semi-rigid beam-column joint is not considered, the joint’s rotational capacity is represented by a single-linear moment-rotation curve, as illustrated in Figure 2a. The initial rotational stiffness of the joint, K0, is calculated according to the component method specified in the literature [14], which determines the macroscopic joint stiffness by considering the series stiffness of basic components such as the end-plate bending, bolt tension, and column panel zone shear. This stiffness reflects its connection behavior across the entire loading range. When damage to the semi-rigid beam-column joint is considered, the moment-rotation curve of the joint is illustrated in Figure 2b. The key parameters defining this curve (including the yield moment My, peak moment Mp, and residual strength Mr) are directly derived from cyclic load tests and numerical calibration conducted on similar flush end-plate connections by our research group, as presented in the literature [15]. The research [15] investigated the damage behavior of beam-column joints with flush end-plate connections, and obtained damage indices for such joints under different damage limit states, as shown in Table 3. Referring to the definition of strength loss in structural members provided by FEMA 356 [16], the residual strength is considered to be 0.2 Mp. In Figure 2 and Table 3, for beam-column joints with flush end-plate connections, Mp represents the bending capacity of the joint, θy represents the yield rotation, and Mr represents the residual strength of the joint after severe damage. The three-spring conceptual model shown in Figure 3 visually represents the mechanical mechanism by which these primary physical components (end-plate, bolts, panel zone) collectively provide the joint’s rotational stiffness.
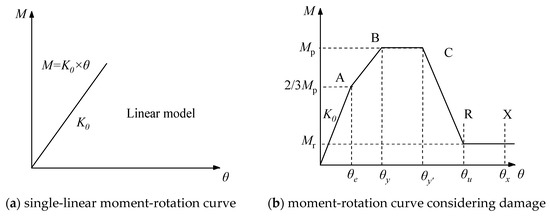
Figure 2.
Moment-rotation curves of beam-column joint model.
Table 3.
Damage state.
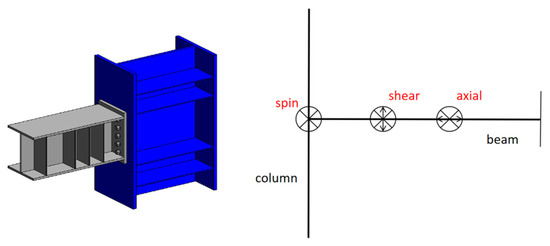
Figure 3.
Detailed setting of three-spring configuration at beam-column joint.
2.2.2. Link-Beam Connection Model
When the link damage is not considered, the connection between the link and the adjacent beam is assumed to be rigid. The literature [17] defines the link damage limit states using rotation as the demand parameter. It concludes that when the link rotation reaches 0.11 rad, severe buckling of the web and flange, or weld fracture may have occurred, indicating that the link is in a severely damaged state and has lost its bending resistance capacity, being able only to transmit axial forces [18]. Based on the test data of links from our research group [19] and the recommended values in the relevant codes [20], Finally, as shown in Table 4, when the link damage is considered, the link-beam connection is transitioned from rigid to hinged once the link rotation attains 0.098 rad. The transition behavior is shown in Figure 4. The setting of 0.098 rad corresponds to the critical plastic rotation at which significant shear buckling occurs in the link web and local buckling initiates in the flanges, signifying that the link, which acts as the primary energy-dissipating component, has been severely damaged and essentially lost its shear resistance capacity. This transition is facilitated through the activation and deactivation of elements in the ABAQUS software. Firstly, an overall structural model is established, and replacement link elements (hinged to the beam, not supporting any load before activation, and moving simultaneously with the beam) are created at the initial positions of the original link elements on each floor, all of which remain deactivated initially. During the analysis, when the plastic rotation of any links is monitored to reach the preset damage threshold (0.098 rad), the program performs two operations in a separate analysis step: First, activate the replacement element to enable it to start participating in structural force transfer; almost simultaneously, deactivate the original rigidly connected links element to make it cease working.
Table 4.
Damage state.
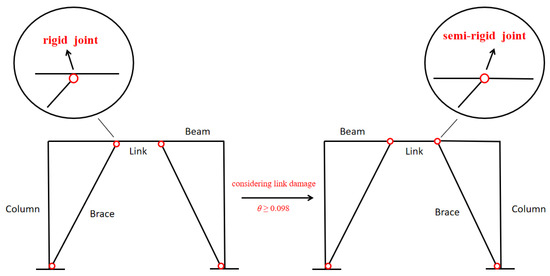
Figure 4.
Link transition behavior.
3. Model Validation
To verify the correctness of the model, the same numerical model was established using SAP2000 software. As a key indicator of structural dynamic characteristics, the consistency of the structural period reflects, to a certain extent, the reliability of the model in simulating the overall dynamic behavior of the structure [21]. Therefore, Table 5 presents the first three natural vibration periods of the model structures calculated using both SAP2000 and ABAQUS software. The structural periods calculated by the two software packages are basically consistent, which, to a certain extent, verifies the reliability of the model in simulating the overall dynamic behavior of the structure. In addition, the first ground motion record in Table 6 was used as input, with time-history analyses conducted using both the proposed ABAQUS model and the validated SAP2000 model. Figure 5 compares the maximum θmax from the two models. The good agreement in their variation trends and key peaks throughout the time history indicates the proposed ABAQUS model accurately simulates the structure’s overall force-displacement response under dynamic loads.
Table 5.
Vibration periods of the model structures.
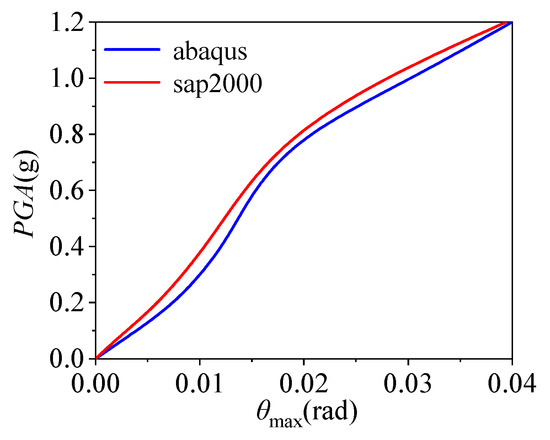
Figure 5.
Model validation.
To more accurately analyze the seismic performance of the structure, dynamic analyses using models with different mesh sizes (100 mm, 200 mm, 300 mm) are carried out as shown in Figure 6a. Taking a 12-story structure as an example and using the earthquake record numbered 1 in Table 6 as input, the maximum inter-story drift ratio under the rare earthquake is presented in Figure 6b. It can be observed that the average difference in the θmax between the 300 mm and 100 mm meshes is 2.3%. This indicates that when the mesh size is refined to 200 mm, the key engineering requirement parameters have basically converged. Comprehensively considering computational accuracy and efficiency, this study ultimately adopts the 200 mm mesh for all nonlinear analyses, which not only ensures result accuracy but also effectively controls computational cost.
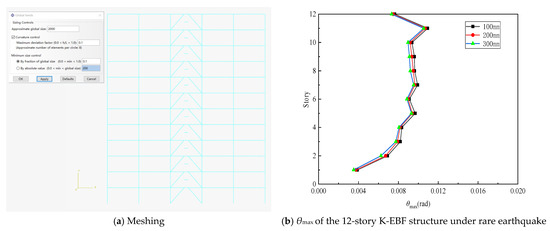
Figure 6.
Model discretization details.
4. Seismic Records
In this paper, fifteen natural far-site earthquake records, detailed in Table 6, were selected as the input earthquake records. The selection criteria for the input ground motion loads are as follows:
- The average seismic influence curve under the action of the ground motion should not differ by more than 20% from the seismic influence curve used in the modal decomposition response spectrum analysis at the main vibration mode period of the structure.
- The main and aftershock ground motion magnitudes should be greater than 5.0 MW, with a Peak Ground Acceleration (PGA) of not less than 0.04 g and a duration of not less than 10 s.
- The epicentral distance of the far-field ground motion records should be greater than 10 km.
- The shear wave velocity V30 of the ground motion should be greater than 180 m/s.
- The lowest frequency fz of the ground motion should be less than 1 Hz.
For the frames studied, which are located in a region with an intensity of VIII, the PGA of these records was adjusted to 0.7 m/s2, 2.0 m/s2, and 4.0 m/s2, respectively, when considering the structural responses under frequent earthquakes (63% probability of exceedance in 50 years), fortification earthquakes (10% probability of exceedance in 50 years), and rare earthquakes (2% probability of exceedance in 50 years). To ensure that the response spectra of the selected ground motions align as closely as possible with the target design spectra within critical period ranges, a method of matching major period points is employed to scale the ground motions. Moreover, the errors at the first three-order period points are controlled within 20%. The response spectra for these records, along with the design response spectrum generated with a damping ratio of 0.05, are depicted in Figure 7. To facilitate comparisons with code-designed spectra and adapt to subsequent IDA and vulnerability analysis, this study adopts PGA as the ground motion intensity measure (IM). For the construction of mainshock-aftershock sequences, the “repetition method” is used to synthesize the mainshock-aftershock ground motion sequences [22]. Specifically, first, the number of aftershock events is determined in accordance with the Gutenberg–Richter law; second, given the known aftershock magnitudes, the widely used Joyner–Boore ground motion prediction model (GMPM) is employed to calculate their PGA intensities, with the aftershock PGA specified as 0.8526 times the mainshock PGA [23]; finally, the aftershock records adjusted according to this intensity ratio are appended to the mainshock record, and a 60 s blank interval is inserted between each seismic event to ensure the complete attenuation of the structural dynamic response after the previous seismic event [24,25]. The schematic diagram of the constructed mainshock-aftershock sequences is shown in Figure 8.
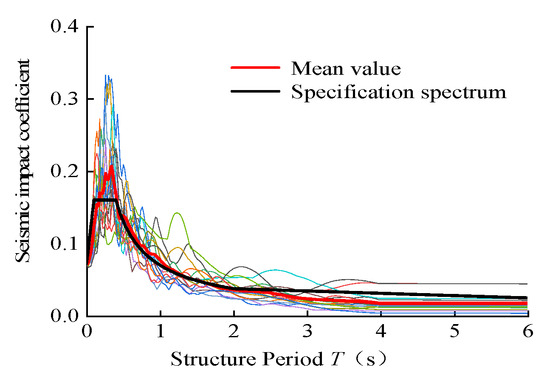
Figure 7.
Response spectra.
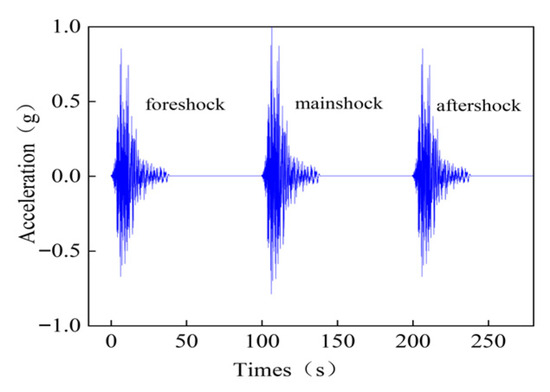
Figure 8.
Main-aftershock sequence.
Table 6.
Seismic records.
Table 6.
Seismic records.
| Serial Number | Earthquake Name | Recording Station | PGA (g) | Serial Number | Earthquake Name | Recording Station | PGA (g) |
|---|---|---|---|---|---|---|---|
| 1 | Chi-Chi, Taiwan | HWA033 | 0.165 | 2 | Chi-Chi, Taiwan | TCU122 | 0.212 |
| 3 | Chi-Chi, Taiwan | CHY087 | 0.135 | 4 | Northridge-01 | LA—Century City CC North | 0.256 |
| 5 | Northridge-01 | Moorpark—Fire Sta | 0.292 | 6 | Northridge-01 | Newhall—Fire Sta | 0.583 |
| 7 | Northridge-01 | Northridge-06 | 0.571 | 8 | Imperial Valley-06 | El Centro Array #5 | 0.529 |
| 9 | Imperial Valley-06 | El Centro Array #4 | 0.484 | 10 | Imperial Valley-06 | Bonds Corner | 0.203 |
| 11 | Imperial Valley-06 | El Centro Array #11 | 0.379 | 12 | Irpinia-01 and -02 | BAGNOLI IRPINO | 0.141 |
| 13 | Kocaeli & Duzce | DUZCE | 0.312 | 14 | Superstition Hills-01 and -02 | WILDLIFE LIQUEFACTION ARRAY | 0.135 |
| 15 | Managua-01 and -02 | Managua ESSO | 0.372 |
5. Incremental Dynamic Analysis
To estimate seismic demand and the capacity of structures, it has been suggested by researchers that Incremental Dynamic Analysis (IDA) is one of the most accurate methods [26]. The maximum inter-story ratio (θmax), which is related to the rotational capacity of the joints, the member damage, and the structural collapse resistance, can effectively reflect the damage state of the structure under different earthquakes [27]. Therefore, in this paper, the maximum inter-story ratio (θmax) of the structure is selected as the seismic demand parameter, and the peak ground acceleration (PGA) is used as the ground motion intensity parameter for IDA.
5.1. Effect of the Aftershocks
Figure 9, Figure 10, Figure 11 and Figure 12 compare, respectively, the effects of aftershocks on the IDA curves of K-EBF structures in different damage limit states under four conditions: (1) damage to links and beam-column joints not considered; (2) only beam-column joint damage considered; (3) only link damage considered; and (4) both damage types considered simultaneously. At the fortification earthquake level (PGA = 0.2 g), the aftershocks caused an increase in θmax of the 12-story and 18-story K-EBF structures by 2.6% and 8.2%, respectively, when neither link nor beam-column joint damage were considered, by 4.5% and 11.3%, respectively, when only beam-column joint damage was considered, by 6.5% and 10.7%, respectively, when only link damage was considered, and by 7.2% and 13.4%, respectively, when both were considered simultaneously. At the rare earthquake level (PGA = 0.4 g), the increases were 6.5% and 18.6%, respectively, when neither link nor beam-column joint damage were considered, 8.9% and 20.4%, respectively, when only beam-column joint damage was considered, 11.4% and 25.1%, respectively, when only link damage was considered, and 14.2% and 30.2%, respectively, when both were considered simultaneously. The aforementioned results indicate the following: (1) Under both the fortification and rare earthquake levels, the beam-column joints and links of the structures experienced a certain degree of damage. As a result, when considering only the damage of beam-column joints or links, the adverse effects of aftershocks on the structural seismic response are greater compared to the scenario where neither type of damage is considered. (2) Due to the coupling effect of damage, when both link and beam-column joint damage are considered simultaneously, the adverse influence of aftershocks on the structure is significantly higher than when only one type of damage is considered. (3) As the magnitude of earthquakes gradually increases, the adverse influence of aftershocks on the structural seismic response becomes increasingly significant. The underlying cause of the aforementioned phenomenon is that the mainshock induces component damage and stiffness degradation, thereby extending the fundamental period of the structure and rendering it prone to quasi-resonance with aftershocks. In addition, the cumulative damage from the mainshock impairs the structure’s energy dissipation capacity, which collectively leads to amplified aftershock responses.
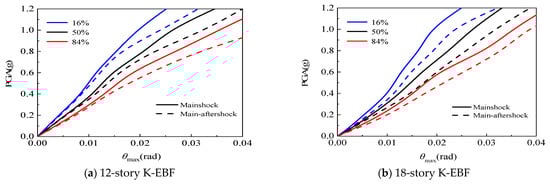
Figure 9.
Effect of aftershock on IDA curves without considering damage.
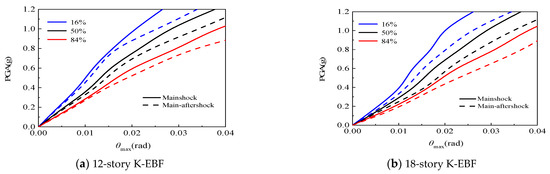
Figure 10.
Effect of aftershock on IDA curves considering beam-column joint damage.
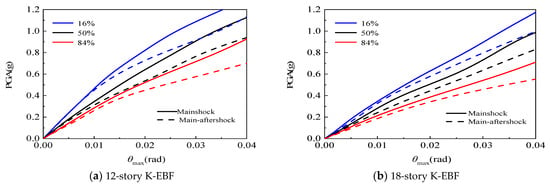
Figure 11.
Effect of aftershock on IDA curves considering link damage.
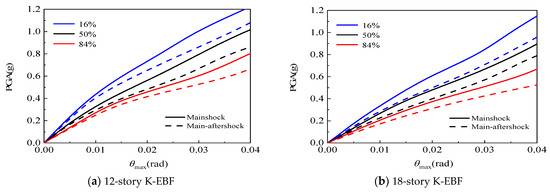
Figure 12.
Effect of aftershock on IDA curves considering both beam-column joint and link damage.
5.2. Effect of the Damage of Beam-Column Joints and Links
The effects of damage of beam-column joints and links on the IDA curves of K-EBF structures are shown in Figure 13. At the fortification earthquake level (PGA = 0.2 g), when compared to considering only beam-column joint damage, considering both beam-column joint and link damage caused an increase in θmax of the 12-story and 18-story structures by 1.8% and 2.7% (only main shocks), respectively, and by 2.6% and 4.7% (main and aftershocks), respectively. When compared to considering only link damage, the increases are 0.9% and 1.1% (only main shocks), and 1.6% and 3.6% (main and aftershocks). When neither type of damage is considered, the increases are 3.7% and 5.9% (only main shocks), and 8.2% and 10.9% (main and aftershocks). This indicates that during fortification earthquakes, both beam-column joint damage and link damage are relatively small, thus their adverse effects on the structure are also small. At the rare earthquake level (PGA = 0.4 g), when compared to considering only beam-column joint damage, considering both beam-column joint and link damage caused an increase in θmax of the 12-story and 18-story structures by 8.8% and 11.5% (only main shocks), respectively, and by 14.2% and 20.6% (main and aftershocks), respectively. When compared to considering only link damage, the increases are 6.5% and 9.4% (only main shocks), and 1.6% and 3.6% (main and aftershocks). When neither type of damage is considered, the increases are 13.8% and 20.4% (only main shocks), and 22.1% and 32.2% (main and aftershocks). Obviously, as the magnitude of earthquakes gradually increases, the adverse effects of beam-column joint and link damage on structural performance gradually increase. Notably, under rare earthquakes, compared with “both are damaged”, the increase in θmax for “beam-column joint damage only” is approximately 17% higher than that for “link damage only” (main and aftershock). This indicates that the contribution of link damage to performance degradation is much higher than that of joint damage, and it constitutes the dominant mechanism.
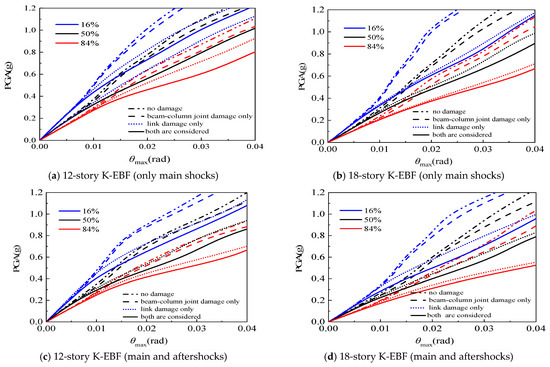
Figure 13.
Effect of beam-column joint and link damage on structural IDA curves.
5.3. Comprehensive Effect of the Damage of Beam-Column Joints and Links and Aftershocks
Figure 14 compares the IDA curves of 12-story and 18-story K-EBF structures that consider aftershocks, beam-column joint damage, and link damage with those of K-EBF structures that do not consider aftershocks or any type of damage. Compared to the scenarios where aftershocks, beam-column joint damage, and link damage are not considered, these factors resulted in an increase in θmax by 11.1% for the 12-story structure and 20.1% for the 18-story structure under the fortification earthquake level (PGA = 0.2 g). Similarly, under the rare earthquake level (PGA = 0.4 g), the increases were 30.0% and 56.7%, respectively. The essential reason for this phenomenon is the increase in structural height, which leads to the following effects: (1) The higher-order mode effects are significant. For instance, at the top of the 18-story structure, the sum of the contribution rates of the second and third mode shapes to the acceleration response exceeds 60%. (2) From the 18-story structure’s IDA curves, when PGA exceeds 0.4 g, the θmax reached 4%, whereas the 12-story structure maintains a steady upward trend. This indicates that for taller structures, the P-Δ effect induces significant additional bending moments, weakening effective stiffness and leading to earlier instability. (3) The overall flexibility of the structure increases, possibly leading to larger displacement demands. Among these factors, the nonlinear amplification of higher-order mode shapes is the primary factor contributing to the very proportional increase in θmax. Moreover, under fortification earthquakes, the deterioration of structural seismic performance is primarily caused by aftershocks. Under rare earthquakes, however, due to the coupling of multiple factors including aftershocks, beam-column joint damage, and link damage, the structure tends to develop towards a more unfavorable state.
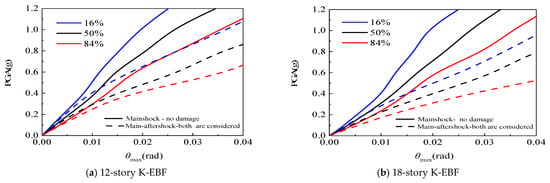
Figure 14.
Influence of aftershock, beam-column joint damage, and link damage on structural IDA curves.
6. Fragility Analysis
Fragility analysis can predict the probability of failure at all damage levels under different seismic intensities. The fragility curve is a valuable tool for estimating the vulnerability of structures to seismic loading, as it represents the conditional probability of the demand exceeding the capacity for a given intensity measure (IM) [28]. The demand is based on structural response, while the capacity indicates the pre-defined performance level. To derive the fragility curves, it is assumed that the demand (D) and capacity (C) follow a lognormal distribution. The resulting fragility curves can be obtained using the following relationship.
where Pf is the structural damage limit state failure probability; Φ[•] is the standard normal cumulative distribution function; SD/IM and SC are the median estimates of demand and capacity at a specific damage limit state, respectively; and βD and βC are the standard deviations of SD/IM and SC, respectively.
In this paper, the maximum inter-story drift ratio (θmax) of the structure is chosen as the index of demand, and the index of IM was defined as the peak ground acceleration (PGA). According to the literature [28], the index of demand θmax and the PGA exhibit a log-linear relationship, which is represented by Equation (2).
where a, b is the linear regression coefficient.
In this study, the inter-story drift ratio θmax is employed as the fundamental demand parameter, and the corresponding structural capacity (SC) values for various damage limit states are adopted from the Chinese seismic design code (GB50011-2016) [10]. Four damage limit states of a steel structure are defined, namely the LS1 (slight damage), LS2 (moderate damage), LS3 (Severe damage), and LS4 (collapse) limit states, based on differing levels of the inter-story drift ratio under seismic excitations, specifically 0.4%, 1%, 2%, and 4%, respectively [29]. These inter-story drift ratio limits are key quantitative indicators for defining different seismic performance levels of structures, such as “no damage under frequent earthquakes, repairable under fortification earthquakes, and no collapse under rare earthquakes”.
6.1. Probabilistic Seismic Demand Analysis
According to Equation (2), the relationship data between the maximum inter-layer drift ratio (θmax) and ground motion intensity (PGA) in IDA are analyzed by logarithmic linear regression analysis, and the probabilistic seismic demand equation of the K-EBF structure can be obtained. The corresponding probabilistic seismic demand linear regression curve is shown in Figure 15. The logarithmic standard deviation of the demand model (β_D|IM) under each analysis case is presented in Table 7.
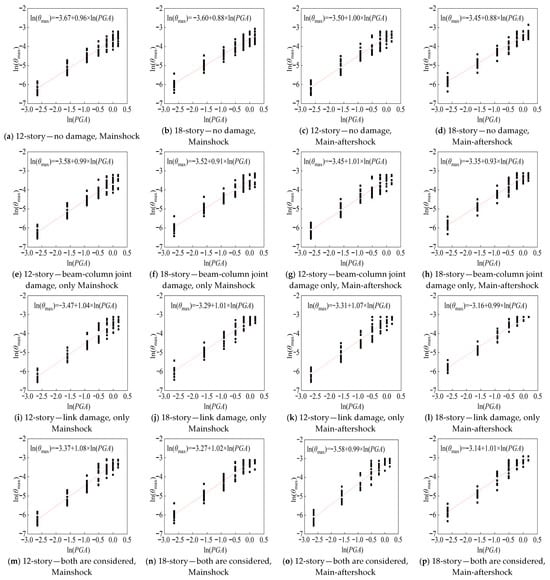
Figure 15.
Linear regression curve of probabilistic seismic demand.
Table 7.
Logarithmic Standard Deviation of the Demand Model (β_D|IM).
6.2. Effect of the Aftershocks
Figure 16, Figure 17, Figure 18 and Figure 19 compare, respectively, the effects of aftershocks on the failure probabilities of K-EBF structures in different damage limit states under four conditions: (1) damage to links and beam-column joints not considered; (2) only beam-column joint damage considered; (3) only link damage considered; and (4) both damage types considered simultaneously. Taking the probability of LS3 as an example, at the fortification earthquake level (PGA = 0.2 g), aftershocks increase the probability of LS3 for 12-story and 18-story structures by 0.4% and 1.1%, respectively, when neither link nor beam-column joint damage were considered; by 0.5% and 2.0%, respectively, when only beam-column joint damage was considered; by 0.6% and 1.2%, respectively, when only link damage was considered; and by 0.7% and 2.0%, respectively, when both were considered simultaneously. This is because at the fortification earthquake level, the peak ground acceleration is relatively low, and the probability of LS3 for the structures is comparatively small. Therefore, the effect of aftershocks is relatively small. At the rare earthquake level (PGA = 0.4 g), aftershocks increase the probability of LS3 for 12-story and 18-story structures by 5.5% and 7.2%, respectively, when neither link nor beam-column joint damage were considered; by 5.6% and 11.6%, respectively, when only beam-column joint damage was considered; by 6.1% and 7.5%, respectively, when only link damage was considered; and by 7.3% and 12.0%, respectively, when both were considered simultaneously.
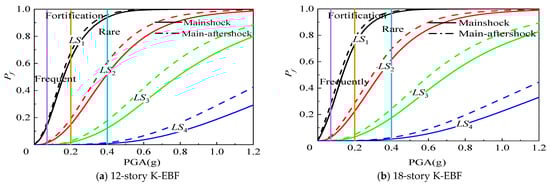
Figure 16.
Effect of aftershock on structural fragility curves without considering damage.
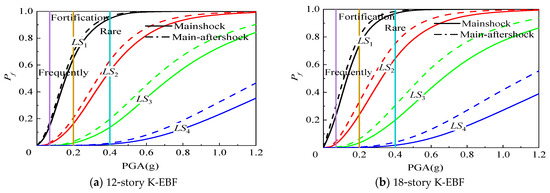
Figure 17.
Effect of aftershock on structural fragility curves considering beam-column joint damage.
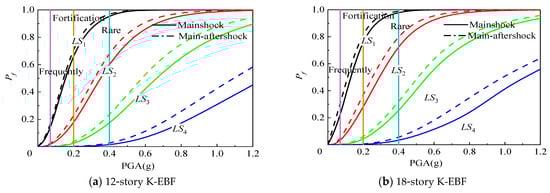
Figure 18.
Effect of aftershock on structural fragility curves considering the link damage.
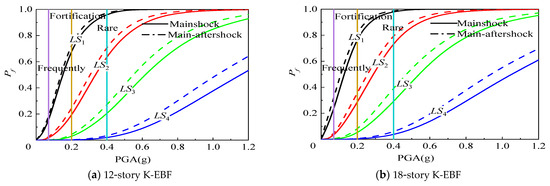
Figure 19.
Effect of aftershock on structural fragility curves considering both beam-column joint and link damage.
6.3. Effect of the Damage of Beam-Column Joints and Links
The effects of damage of beam-column joints and links on the failure probabilities of K-EBF structures in different limit damage states are shown in Figure 20. Still taking the probability of LS3 as an example, at the fortification earthquake level (PGA = 0.2 g), when compared to considering only beam-column joint damage, considering both beam-column joint and link damage caused an increase in the probability of LS3 for the 12-story and 18-story structures by 0.2% and 0.8% (only main shocks), respectively, and by 0.5% and 0.9% (main and aftershocks), respectively. When compared to considering only link damage, the increases are 0.1% and 0.5% (only main shocks), and 0.2% and 1.4% (main and aftershocks). When neither type of damage is considered, the increases are 0.3% and 1.0% (only main shocks), and 0.6% and 1.9% (main and aftershocks). The reason is that during fortification earthquakes, the seismic action is relatively small, resulting in minor damage and failure of both link and beam-column joints, which in turn has a relatively minor impact on the probability of severe damage failure. At the rare earthquake level (PGA = 0.4 g), when compared to considering only beam-column joint damage, considering both beam-column joint and link damage caused an increase the probability of LS3 for the 12-story and 18-story structures by 6.0% and 9.7% (only main shocks), respectively, and by 7.7% and 10.1% (main and aftershocks), respectively. When compared to considering only link damage, the increases are 3.0% and 5.0% (only main shocks), and 4.2% and 9.5% (main and aftershocks). When neither type of damage is considered, the increases are 8.0% and 12.0% (only main shocks), and 9.7% and 16.8% (main and aftershocks). Obviously, as the seismic action increases, considering both beam-column joint damage and link damage will significantly increase the failure probabilities of K-EBF structures in different damage limit states. If the effects of aftershocks are considered, this impact becomes even more pronounced.
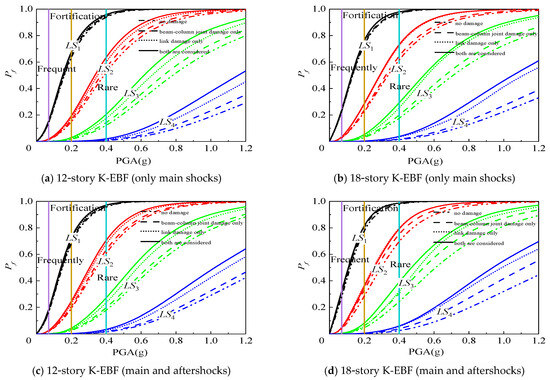
Figure 20.
Effect of beam-column joint and link damage on structural fragility curves.
6.4. Comprehensive Effect of the Damage of Beam-Column Joints and Links and Aftershocks
Figure 21 and Table 8 present a comparison of failure probabilities in different damage limit states for 12-story and 18-story K-EBF structures that consider aftershocks, beam-column joint damage, and link damage, with those of FK-EBF structures that do not consider aftershocks or any type of damage. When compared to scenarios where these factors (aftershocks, beam-column joint damage, and link damage) are not considered, the inclusion of these factors caused an increase in the probability of LS3 for the 12-story structures by 1.0% and for the 18-story structures by 3.0% under the fortification earthquake level (PGA = 0.2 g). Similarly, under the rare earthquake level (PGA = 0.4 g), the probabilities of LS3 increased by 15.3% and 24.0%, respectively, for the 12-story and 18-story structures. Notably, these increases in failure probability were all greater than the impact on structural failure probability observed when considering only one of these factors (aftershocks, link damage, or beam-column joint damage) individually.
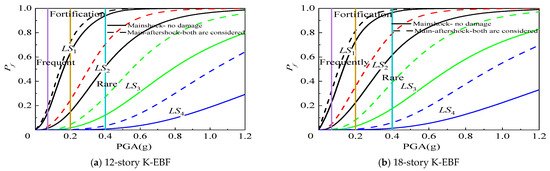
Figure 21.
Influence of aftershock, beam-column joint damage, and link damage on structural fragility curves.
Table 8.
Fragility matrix (unit: %).
Taking into account the combined adverse effects of aftershocks, link damage, and beam-column joint damage, during frequent earthquakes, the structures primarily remain in a state of being essentially intact or having slight damage. During fortification earthquakes, the structures mainly experience slight to moderate damage, while the probabilities of extensive damage and collapse are relatively low. During rare earthquakes, the probability of extensive damage to the structures increases, but the collapse probability remains at a low level. Based on these results, it is suggested that the K-EBF structures can meet the requirements of “no damage under frequent earthquakes”, “repairable level under fortification earthquakes”, and “no-collapse under rare earthquakes” provided by the GB50011 code [10]. This demonstrates that K-EBF structures, even when considering the combined adverse effects of aftershocks, link damage, and beam-column joint damage, still exhibit good seismic performance.
7. Evaluation of Structural Collapse Resistance
The minimum collapse-resistant reserve coefficient (CMRP = 10%) is capable of reflecting the safety margin of a structure against the requirement of non-collapse under rare earthquakes. The relevant calculation is shown in Equation (3) [30], which stipulates that the minimum collapse-resistant reserve coefficient (CMRP = 10%) should not be less than 1.0 [31].
where IMP = 10% represents the intensity measure (IM) corresponding to the earthquake ground motion when there is a 10% probability that the structure will be in a collapse limit state on the fragility curve. IMrare represents the intensity measure (IM) corresponding to the rare earthquake for the structure; the index of IM was defined as the peak ground acceleration (PGA) in this paper.
The CMRP = 10% is calculated in strict accordance with FEMA-P695 [31] guidelines. First, based on the collapse data obtained from all IDA analyses, the structural collapse vulnerability function is fitted using the maximum likelihood estimation method. Subsequently, the ground motion intensity IMP = 10% corresponding to a 10% collapse probability is determined from this function. Finally, CMRP = 10% is calculated using Equation (3).
This study adopts the following dual criteria to determine whether structural collapse occurs in the IDA: (1) The analysis fails to converge due to excessive deformation of the structure, indicating that the structure has lost the ability to maintain dynamic equilibrium. (2) When the analysis converges, collapse is also determined if the maximum inter-story drift ratio of the structure exceeds 4% (i.e., the LS4 limit value) and the lateral bearing capacity of the corresponding floor drops by more than 85% from its peak value. This criterion reflects that although the structure is not completely unstable under extreme deformation, it has entered a substantive collapse state.
The minimum collapse-resistant reserve coefficients for 12-story and 18-story K-EBF structures are shown in Table 9. When considering the adverse effects of aftershocks, link damage, and beam-column joint damage, the CMRP = 10% for the 12-story and 18-story structures decreases by 0.551 (27.8%) and 0.591 (32.3%), respectively, compared to the scenarios without considering these factors. It is evident that aftershock effects, link damage, and beam-column joint damage all increase the risk of structural collapse.
Table 9.
Minimum collapse-resistant reserve coefficient (CMRP = 10%) of K-EBF structure.
Overall, the effects of link damage and aftershocks on the collapse resistance of structures are similar and more significant than those of beam-column joint damage. The link, acting as the main “fuse”, undergoes inelastic deformation during earthquakes to protect other components. Once damaged, especially by aftershocks, it weakens the structure’s load-redistribution and anti-collapse capabilities more than beam-column joints, which have redundancy and multiple load-shedding paths.
However, even when considering all three factors simultaneously, the CMRP = 10% for the K-EBF structures remains above 1.0; both meet the minimum requirements of the code [29], indicating that the K-EBF structures have good collapse resistance performance.
8. Conclusions
(1) When comparing scenarios where 12-story and 18-story K-EBFs consider aftershocks, beam-column joint damage, and link damage, with those not considering these factors, under fortification earthquakes (PGA = 0.2 g), the maximum inter-story drift ratio (θmax) increases by 11.1% and 20.1%, respectively, and the probabilities of severe damage failure increase by 1.0% and 3.0%, respectively. The increase in θmax leads to a higher probability of structural failure, mainly due to aftershocks. Under rare earthquakes (PGA = 0.4 g), the θmax increases by 30.0% and 56.7%, respectively, and the probabilities of the severe damage limit state increase by 15.3% and 24.0%, respectively; meanwhile, the CMRP = 10% decreases by 0.551 (27.8%) and 0.591 (32.3%), respectively. This notable response amplification stems from the coupling of multiple damage mechanisms: beam-column joint degradation alters force distribution while link damage reduces energy dissipation capacity, with these effects being cumulative under sequential ground motions.
(2) Taking into account the combined adverse effects of aftershocks, link damage, and beam-column joint damage, the K-EBF structures can meet the requirements of “no damage under frequent earthquakes”, “repairable level under fortification earthquakes”, and “no-collapse under rare earthquakes” provided by the GB50011 code, and the CMRP = 10% for the K-EBF structures remains above 1.0, indicating that the K-EBF structures have good collapse resistance performance.
(3) Based on the quantitative findings of this study, link damage and aftershock effects demonstrate comparable and substantially greater impacts on structural collapse resistance than beam-column joint damage. This conclusion reinforces existing research on the critical role of energy-dissipating components in seismic performance while quantifying their particular vulnerability to sequential ground motions. These insights directly inform three specific design recommendations: (1) prioritizing ductile, replaceable link designs; (2) enhancing connection details using innovative materials like shape memory alloys; and (3) optimizing the structural system with improved bracing or isolation strategies. These measures collectively address the identified vulnerabilities and advance performance-based seismic design methodologies for mainshock-aftershock scenarios.
(4) When aftershocks elevate the collapse risk, the exacerbation of risk is more pronounced in models that take link damage into account (given the stronger energy-dissipation capacity of real structures), whereas the conclusions drawn from simplified models lean towards conservatism. And this study has some limitations. Factors such as residual stresses, fire effects, and non-structural damage were not considered in this research. Future studies could explore these aspects to gain a more comprehensive understanding of the structural behavior.
Author Contributions
Conceptualization, H.Y.; Methodology, H.Y.; Software, Z.M., H.Y. and Q.W.; Validation, Z.L.; Formal analysis, Y.Z.; Investigation, Z.M.; Resources, H.Y.; Writing—original draft, Z.M., Y.Z., Q.W., C.W., T.J. and H.Z.; Writing—review and editing, Z.M., Z.L., C.W., T.J. and H.Z.; Visualization, Z.L.; Funding acquisition, H.Y. All authors have read and agreed to the published version of the manuscript.
Funding
This research was funded by the Hebei Province Natural Science Foundation Project, No. E2025208016; Central Government Guide Local Science and Technology Development Fund Project, No. 236Z5408G; Hebei Province Higher Education Institutions Special Research Projects, CXY2024045.
Data Availability Statement
The original contributions presented in this study are included in the article. Further inquiries can be directed to the corresponding author.
Conflicts of Interest
The authors declare that they have no known competing financial interests or personal relationships that could have appeared to influence the work reported in this paper.
References
- Zhou, Z.; Yu, X.H.; Lv, D.G. Vulnerability analysis and safety evaluation of reinforced concrete frame structures subjected to major aftershock sequence. Eng. Mech. 2018, 35, 134–145. (In Chinese) [Google Scholar]
- Mata, R.; Nuñez, E.; Calo, B.; Herrera, R. Seismic Performance of Eccentrically Braced Frames with Short-links: IDA Approach Using Chilean Earthquakes. J. Build. Eng. 2023, 76, 107186. [Google Scholar] [CrossRef]
- Mojarad, M.; Daei, M. Effect of Brace Failure as Capacity-based Design Component on the EBF Collapse Safety. Structures 2023, 56, 104969. [Google Scholar] [CrossRef]
- Masoomzadeh, M.; Basim, M.C.; Chenaghlou, M.R.; Khajehsaeid, H. Probabilistic Performance Assessment of Eccentric Braced Frames Using Artificial Neural Networks Combined with Correlation Latin Hypercube Sampling. Structures 2023, 48, 226–240. [Google Scholar] [CrossRef]
- Moammer, O.; Madani, H.; Dolatshahi, K.; Ghyabi, M. Collapse Risk and Earthquake-induced Loss Assessment of Buildings with Eccentrically Braced Frames. J. Constr. Steel Res. 2020, 168, 105998. [Google Scholar] [CrossRef]
- Ün, E.M.; Topkaya, C. Effects of Cyclic Strain Hardening on Performance of Eccentrically Braced Frames. J. Constr. Steel Res. 2021, 187, 106948. [Google Scholar] [CrossRef]
- Ye, C.Y.; Wang, X.W.; Shi, Q.; Sun, H.S. The influence of the connection configuration of link segments on the seismic performance of eccentrically braced steel frames. Ind. Build. 2019, 53, 58–64. (In Chinese) [Google Scholar]
- Yu, H.F.; Wang, W.; Wu, Y.Z.; Ma, K.; Wang, Y. Research on seismic performance of K-shaped eccentric braced frame with weakened and bent energy-dissipating beams with bone. J. Hebei Univ. Sci. Technol. 2023, 44, 286–296. (In Chinese) [Google Scholar]
- Yin, Z.; Yang, B.; Zhang, X. Design of An Eccentrically Buckling-restrained Braced Steel Frame with Web-Bolted Replaceable Links. J. Constr. Steel Res. 2022, 192, 107250. [Google Scholar] [CrossRef]
- GB 50011-2010; Code for Seismic Design of Buildings (2016 Edition). China Building and Construction Press: Beijing, China, 2016. (In Chinese)
- JGJ99-2015; Technical Regulations for Steel Structures in High-Rise Civil Buildings. China Architecture and Construction Press: Beijing, China, 2016. (In Chinese)
- GB 50009-2012; Code for Load on Building Structures. China Architecture and Construction Press: Beijing, China, 2012. (In Chinese)
- Yu, H.F.; Li, J.Q.; Jin, T.J.; Wang, C. Seismic Performance Evaluation of Eccentric Braced Steel Frame Structures with Vertical Connecting Rod. Seism. Reinf. Eng. 2024, 46, 45–54. (In Chinese) [Google Scholar]
- Cassiano, D.; D’ANiello, M.; Rebelo, C. Parametric finite element analyses on flush end-plate joints under column removal. J. Constr. Steel Res. 2017, 137, 77–92. [Google Scholar] [CrossRef]
- Su, J.; Zhou, J.; Liu, W.; Li, Y.; Yu, H.; Li, Q. Study on Damage Index for Beam–Column Joints with Flush End-Plate Connections. Buildings 2024, 14, 3637. [Google Scholar] [CrossRef]
- FEMA. Prestandard and Commentary for the Seismic Rehabilitation of Buildings; FEMA 356; Federal Emergency Management Agency: Washington, DC, USA, 2000.
- Ji, X.; Wang, Y.; Zhang, J.; Okazaki, T. Seismic Behavior and Fragility Curves of Replaceable Steel Coupling Beams with Slabs. Eng. Struct. 2017, 150, 622–635. [Google Scholar] [CrossRef]
- Askariani, S.S.; Garivani, S.; Aghakouchak, A.A. Application of Slit Link Beam in Eccentrically Braced Frames. J. Constr. Steel Res. 2020, 170, 106094. [Google Scholar] [CrossRef]
- Yu, H.F.; Cao, K.; Su, J.Z.; Zhang, H.J.; Fang, B. Damage identification of energy-dissipating beams based on improved EB-YOLO-v8n. J. Hebei Univ. Sci. Technol. 2025, 46, 542–552. [Google Scholar]
- FEMA. Seismic Performance Assessment of Buildings, Volume 1—Methodology, and Volume 2—Implementation Guide; Federal Emergency Management Agency: Washington, DC, USA, 2012.
- Yang, L.Y.; Ye, M.; Wu, Z.K.; Dong, J.K. Seismic performance of steel frame structures equipped with novel displacement-amplified friction dampers. Structures 2024, 68, 107041. [Google Scholar] [CrossRef]
- Yu, X.H.; Lv, D.G.; Xiao, H. Study on incremental damage spectrum of major aftershock sequence type ground motion. Eng. Mech. 2017, 34, 47–53. (In Chinese) [Google Scholar]
- Hatzigeorgiou, G.D.; Beskos, D.E. Inelastic displacement ratios for SDOF structures subjected to repeated earthquakes. Eng. Struct. 2009, 31, 2744–2755. [Google Scholar] [CrossRef]
- Yang, X.L.; Jia, M.M.; Lü, D.G. Multivariate probabilistic seismic demand analysis of RC frame-shear wall structures under mainshock-aftershock sequences. J. Build Struct. 2020, 41, 36–43. (In Chinese) [Google Scholar]
- Yu, X.H.; Qiao, Y.M.; Dai, K.Y.; Tao, J.; Lv, D.G. Incremental damage analysis of nonlinear SDOF systems under mainshock-aftershock sequences. Eng. Mech. 2019, 36, 121–130. (In Chinese) [Google Scholar]
- Ahmadi, H.R.; Mahdavi, N.; Bayat, M. Applying adaptive pushover analysis to estimate incremental dynamic analysis curve. J. Earthq. Tsunami 2020, 14, 2050016. [Google Scholar] [CrossRef]
- Zhu, K.M.; Guo, Y.R. Vulnerability analysis of buckling constrained support frame under main aftershock sequence. Struct. Eng. 2019, 35, 109–115. (In Chinese) [Google Scholar]
- Anand, T.P.; Pandikkadavath, M.S.; Mangalathu, S. Near-field seismic response assessment of buckling-restrained braced frames for different engineering demand parameters. J. Constr. Steel Res. 2024, 216, 108583. [Google Scholar] [CrossRef]
- Jin, T.J.; Yu, H.F.; Li, J.Q.; Hao, G.Q.; Li, Z.Q. Design and Seismic Performance of Tied Braced Frames. Buildings 2023, 13, 1652. [Google Scholar] [CrossRef]
- Shan, W.C. Seismic Design and Automatic Optimization Method of Supporting Giant Frame-Core Tube Structure System. Ph.D. Thesis, Chongqing University, Chongqing, China, 2021. (In Chinese). [Google Scholar]
- FEMA. Quantification of Building Seismic Performance Factors; ATC-63 Project Report, FEMA P695/April 2008; FEMA: Washington, DC, USA, 2008.
Disclaimer/Publisher’s Note: The statements, opinions and data contained in all publications are solely those of the individual author(s) and contributor(s) and not of MDPI and/or the editor(s). MDPI and/or the editor(s) disclaim responsibility for any injury to people or property resulting from any ideas, methods, instructions or products referred to in the content. |
© 2025 by the authors. Licensee MDPI, Basel, Switzerland. This article is an open access article distributed under the terms and conditions of the Creative Commons Attribution (CC BY) license (https://creativecommons.org/licenses/by/4.0/).