You are currently viewing a new version of our website. To view the old version click .
Buildings
  • Article
  • Open Access

24 November 2025

Experimental Analysis of Seismic Behavior of Squat Shear Walls with Different Axial Load Ratios

,
,
,
and
1
School of Civil Engineering, Harbin Institute of Technology, Harbin 150090, China
2
Key Lab of Structures Dynamic Behavior and Control of the Ministry of Education, Harbin Institute of Technology, Harbin 150090, China
3
Key Lab of Smart Prevention and Mitigation of Civil Engineering Disasters of the Ministry of Industry and Information Technology, Harbin Institute of Technology, Harbin 150090, China
4
China Nuclear Power Engineering Co., Ltd., Beijing 100840, China
This article belongs to the Section Building Structures

Abstract

The majority of existing experimental studies on the seismic performance of squat shear walls have primarily focused on small-scale specimens with low axial load ratios. To investigate the seismic behavior of squat reinforced concrete shear walls subjected to high axial load ratios, quasi-static tests were conducted on six large-scale squat shear walls with varying axial load ratios. The failure modes, hysteresis curves, skeleton curves, energy dissipation characteristics, stiffness degradation, and crack widths of these specimens were thoroughly analyzed. A numerical simulation of the experimental process was carried out using ABAQUS, and the validity of the finite element model and the accuracy of the numerical analysis results were verified through comparison with the experimental measurements. From the experimental results, it is determined that the axial load ratio is an important parameter affecting the specimens and that the squat shear walls show obvious shear slip failure. Furthermore, the axial load ratio is inversely proportional to the horizontal bearing capacity, stiffness, and ductility. ABAQUS is shown to simulate the stress state of the squat shear wall well, providing a reasonable theoretical analysis model and calculation parameters.

1. Introduction

A shear wall is a reinforced concrete element that provides substantial strength and stiffness, as well as the deformation capacity needed to resist the forces generated by earthquakes. In engineering, shear walls are usually applied in an independent [], independent with openings [], or coupled [,] form. Shear walls with a shear–span ratio less than 2.0 are generally classified as squat shear walls, which have higher shear strength, stiffness, and bearing capacity compared with normal shear walls []. Many industrial buildings and nuclear power plants have large openings and depths, in which case squat shear walls are generally suitable. Therefore, research on the structural and seismic behaviors of squat shear walls has important practical significance.
Previous studies have shown that the shear–span ratio [,,], reinforcement ratio [,,,], axial load ratio [,], concrete strength [,,,], and other factors have significant effects on the seismic performance of shear walls. The FEMA-356 [] and ACI 318-14 [] guidelines provide different evaluation methods for the shear strength of squat shear walls; in particular, as the shear–span ratio decreases, their recommended evaluation methods become more conservative. Flanges can increase their ultimate strength significantly but reduce deformation capacity []. Strengthening the plastic hinge region of the component can improve its ductility, shear capacity, and stiffness []. FEMA273 [] stipulates that when the axial load ratio of a shear wall exceeds 0.35, it will not be able to resist earthquake forces effectively. JGJ3-2010 [] points out that in seismic design, the axial load ratio of a shear wall should not exceed 0.55, and the axial load ratio of a shear wall without a flange or end column should be reduced by 0.1. When the axial load ratio is within a certain range, the seismic performance will be optimal []. The axial load ratio has great influence on ductility, and it has been found that while axial load reduces both vertical and horizontal displacement, it also causes an increase in horizontal load-carrying capacity and secant stiffness characteristics []. In addition, existing research has demonstrated a significant size effect in reinforced concrete shear walls. For example, Rasoolinejad et al. [] observed that as the shear wall length increased from 590 to 4720 mm, the nominal shear strength decreased by 26% to 40%. Similarly, Jin et al. [] observed that when the wall length increased from 600 to 1800 mm, the nominal cracking, yield, and shear strength decreased by 57%, 64%, and 18%, and the energy dissipation capacity and deformation capacity decreased obviously. It is evident that the load-bearing and deformation capacities derived from tests using larger-scale specimens are lower and more representative of actual engineering conditions.
In general, existing research has focused on the failure mechanisms and seismic performance of squat shear walls, with the axial load ratio being one of the key factors influencing the seismic performance of squat shear walls. Thus, studying the effect of the axial load ratio on the seismic performance of shear walls is crucial for seismic design and warrants further investigation. Additionally, most studies on squat shear walls have utilized small-scale specimens and, due to scale effects, their results may differ from those of large-scale squat shear walls used in actual engineering. Therefore, experimental research on large-scale squat shear wall specimens is necessary.

2. Experimental Program

2.1. Specimens

In this study, six squat-reinforced concrete shear wall specimens with a low shear–span ratio of 0.5 were designed and constructed to investigate the influence of the axial load ratio on their seismic performance. All six squat shear walls were reinforced with vertical and horizontal reinforcement in a dual-layer layout, with a reinforcement ratio of 1.6% in both directions. The specimens were designated using the symbols H, L, and A, where H denotes high squat shear walls with a height of 1200 mm and a shear–span ratio λ = 0.4; L represents a height of 900 mm and a shear–span ratio λ = 0.3; and A represents the axial load ratio. The three axial load ratios of 0.1, 0.2, and 0.3 were designed, labeled as A01, A02, and A03, respectively.
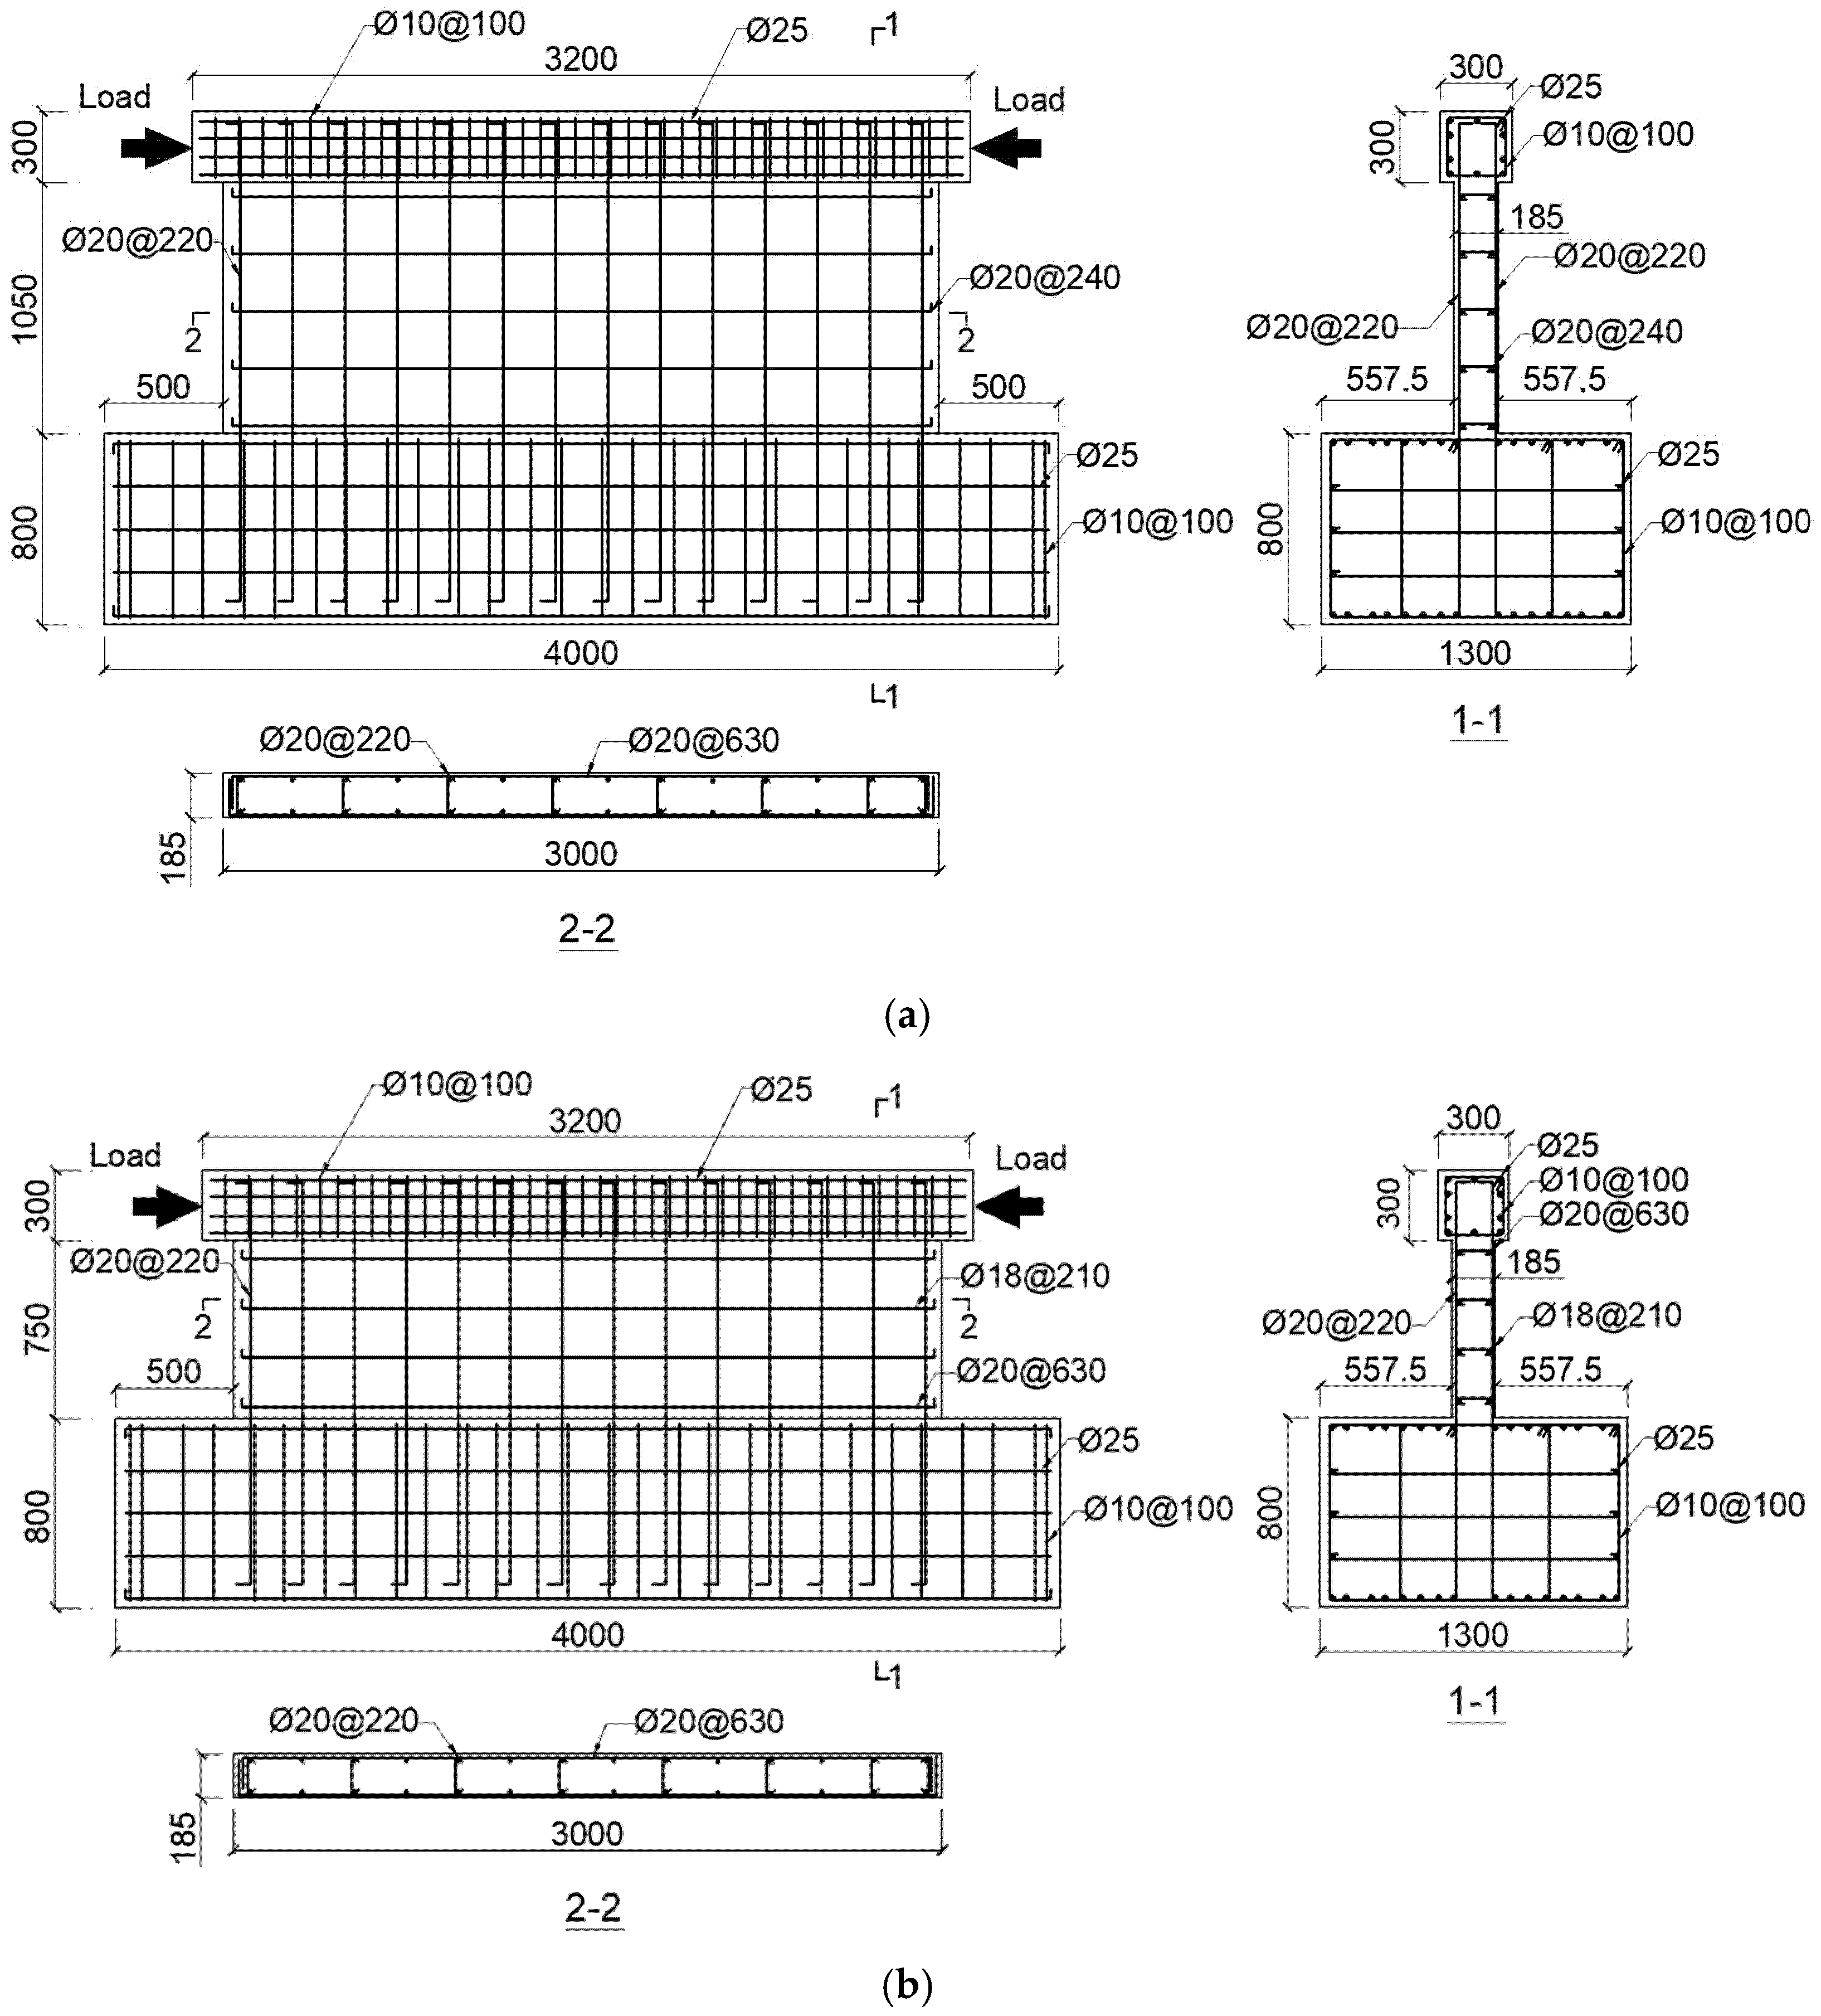
To facilitate the loading and fixation of the squat shear wall specimens, top and bottom beams were, respectively, installed at the top and bottom of the squat shear wall. The top beam was designed with dimensions of 3200 × 300 × 300 mm, 10C25 reinforcement (Ansteel Group Co., Ltd., Shenyang, China), and A10@100 stirrups. The lateral load was applied at a distance of 150 mm below the top edge of the beam. The bottom beam had dimensions of 1300 × 800 × 4000 mm, 32C25 reinforcement, 6C10 waist steel, and A10@50/100 stirrups. The bottom beam was equipped with bolt holes to securely anchor it to the ground. The design specifications of the specimens are illustrated in Figure 1.
Figure 1. The design details of the specimens. (a) Specimen details of H; (b) Specimen details of L.

2.2. Materials

The specimens were constructed with grade 40 MPa, and three cubes with dimensions of 150 × 150 × 150 mm and another three cubes with dimensions 150 × 150 × 300 mm were cast for each specimen during the placing of the concrete to evaluate the compressive strength of concrete. Steel with diameter of 18 and 20 mm was used as reinforcement in the shear wall, while 25 mm reinforcement was used in the top and bottom beams and 10 mm used in stirrups. Table 1 and Table 2 detail the mechanical properties of the concrete and steel rebar, where fcu is the cubic compressive strength of concrete, fc is the axial compressive strength of concrete, Ec is the elastic modulus of concrete, fy is the yield strength of steel, and fu is the ultimate strength of steel.
Table 1. The mechanical properties of the concrete.
Table 2. The mechanical properties of the steel.

2.3. Loading Procedure and Test Setup

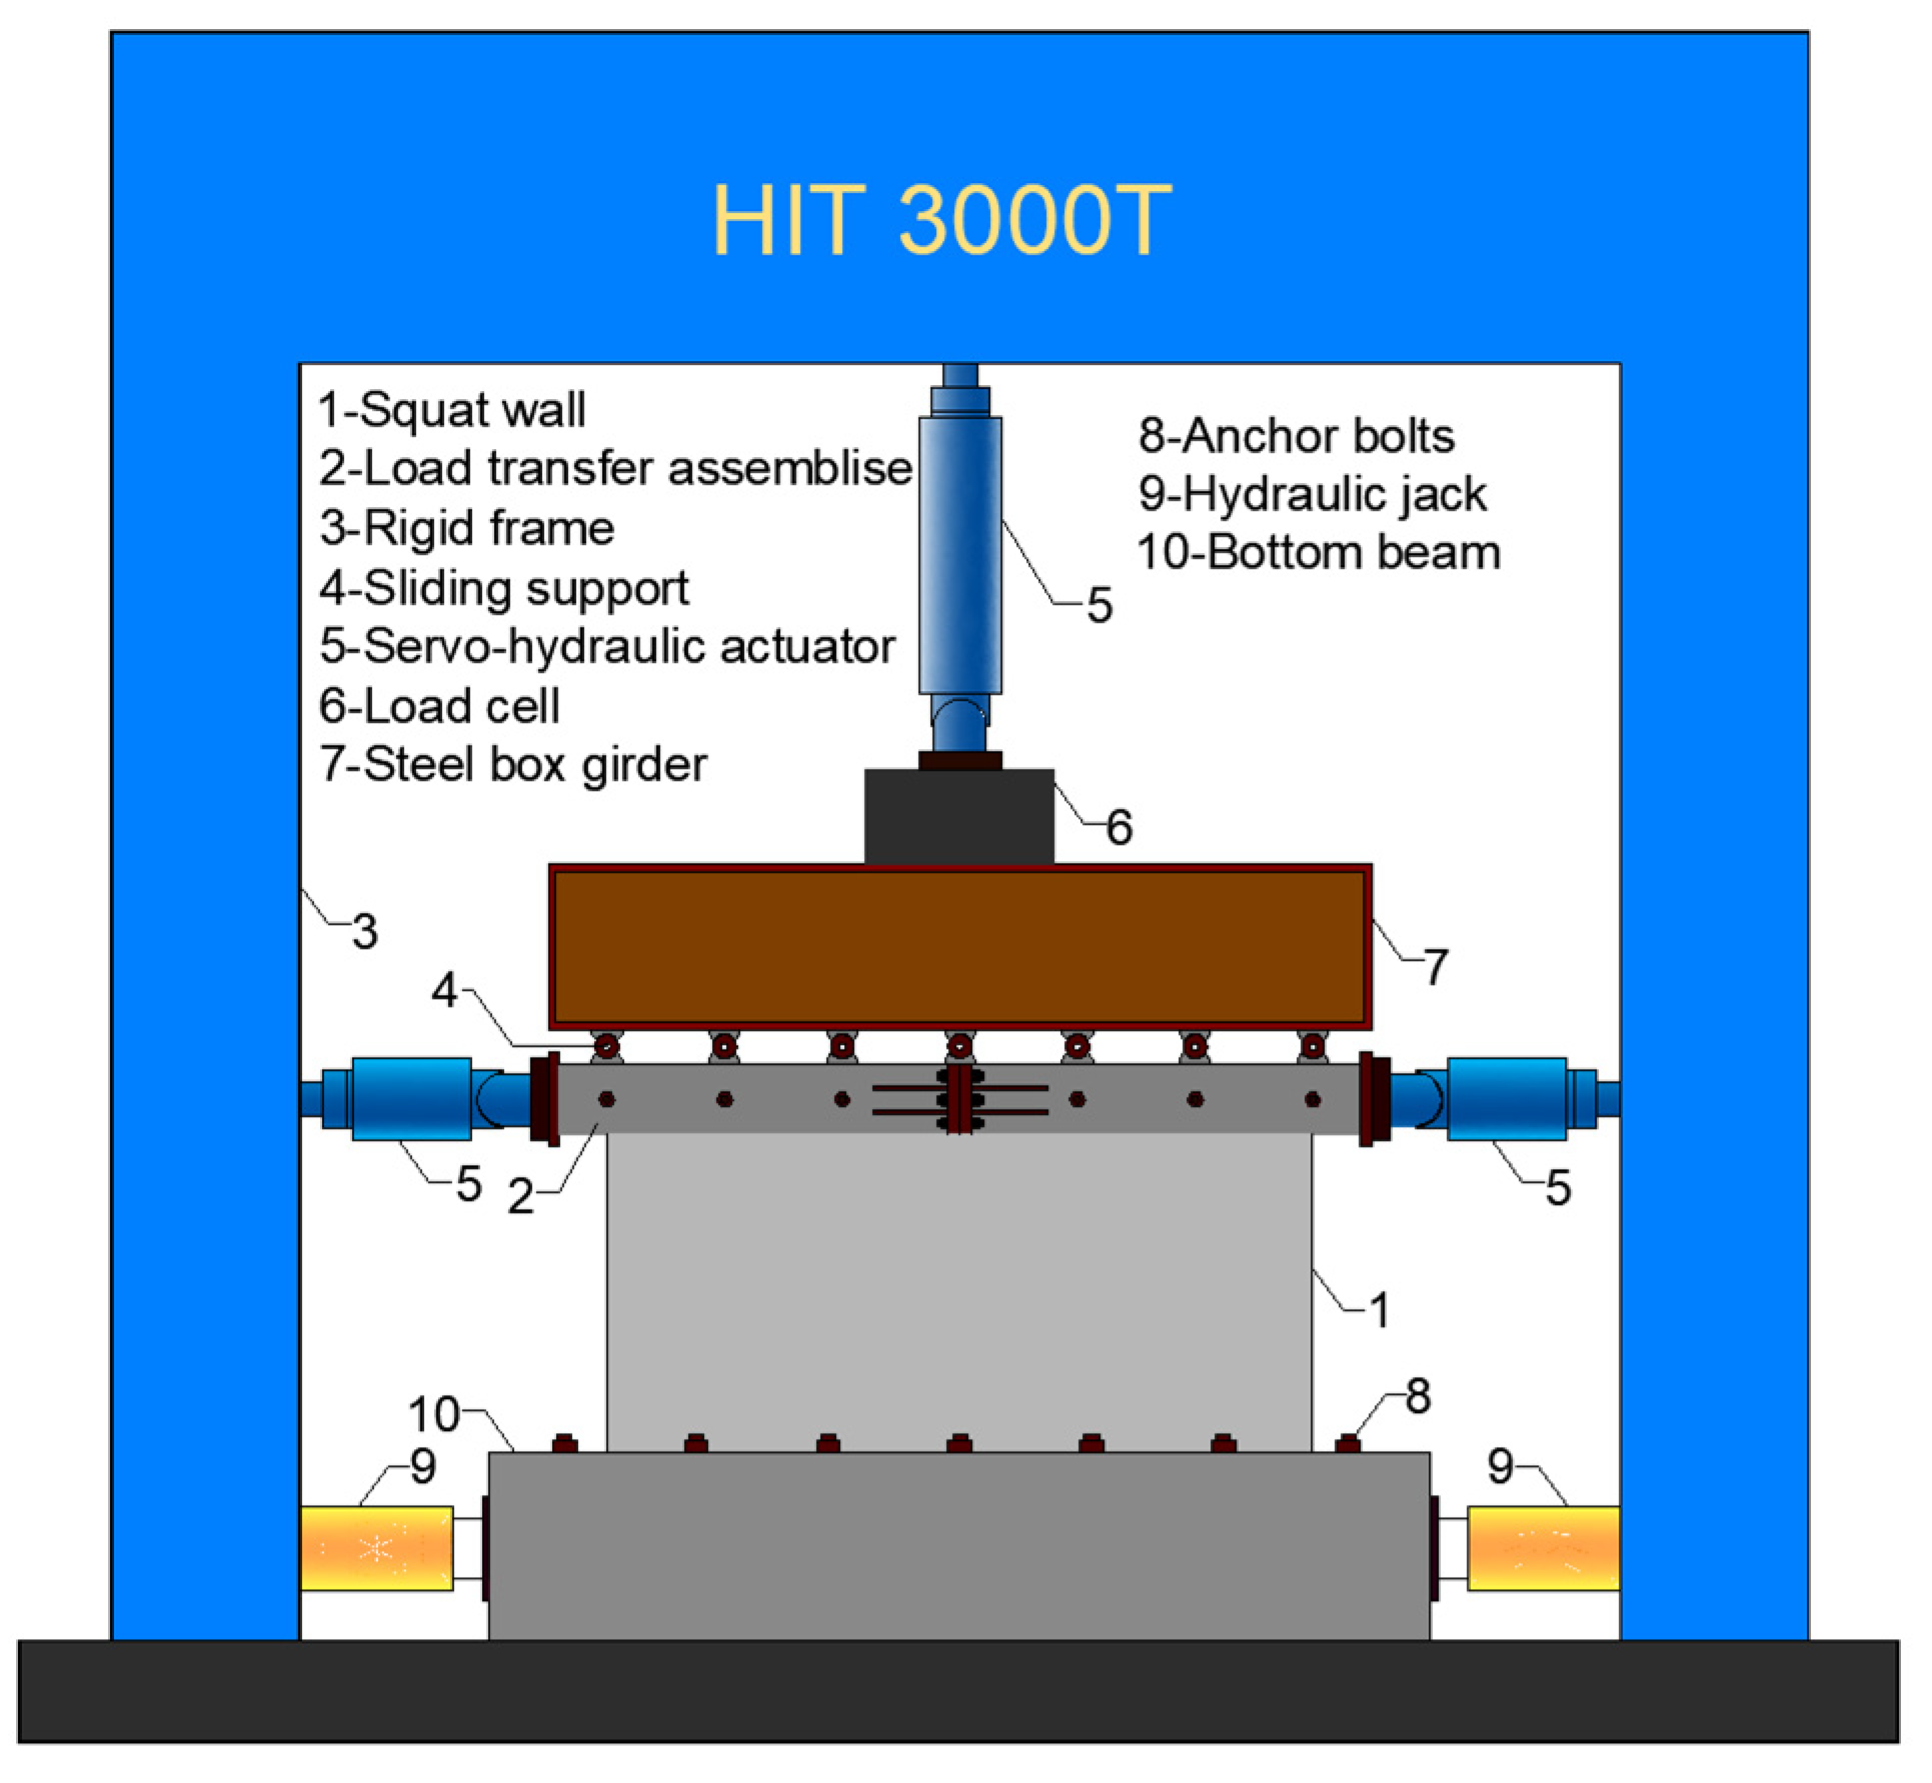
Pseudo-static tests were conducted using a 30,000 kN testing system (Harbin Institute of Technology, Harbin, China). The testing system comprised a vertical counterforce frame, two electro-hydraulic servo actuators to apply horizontal force, a ground anchor device, and an electro-hydraulic servo actuator to apply vertical loading. The vertical loading device featured a horizontal sliding function to ensure that the vertical load remained aligned during horizontal displacement. The vertical servo-hydraulic actuator had a loading capacity of 30,000 kN and a stroke of ±300 mm, while the horizontal actuator had a loading capacity of ±3000 kN and a stroke of ±300 mm. The specimen was fixed at the bottom using ground anchor bolts. The test setup is shown in Figure 2.
Figure 2. The test setup.
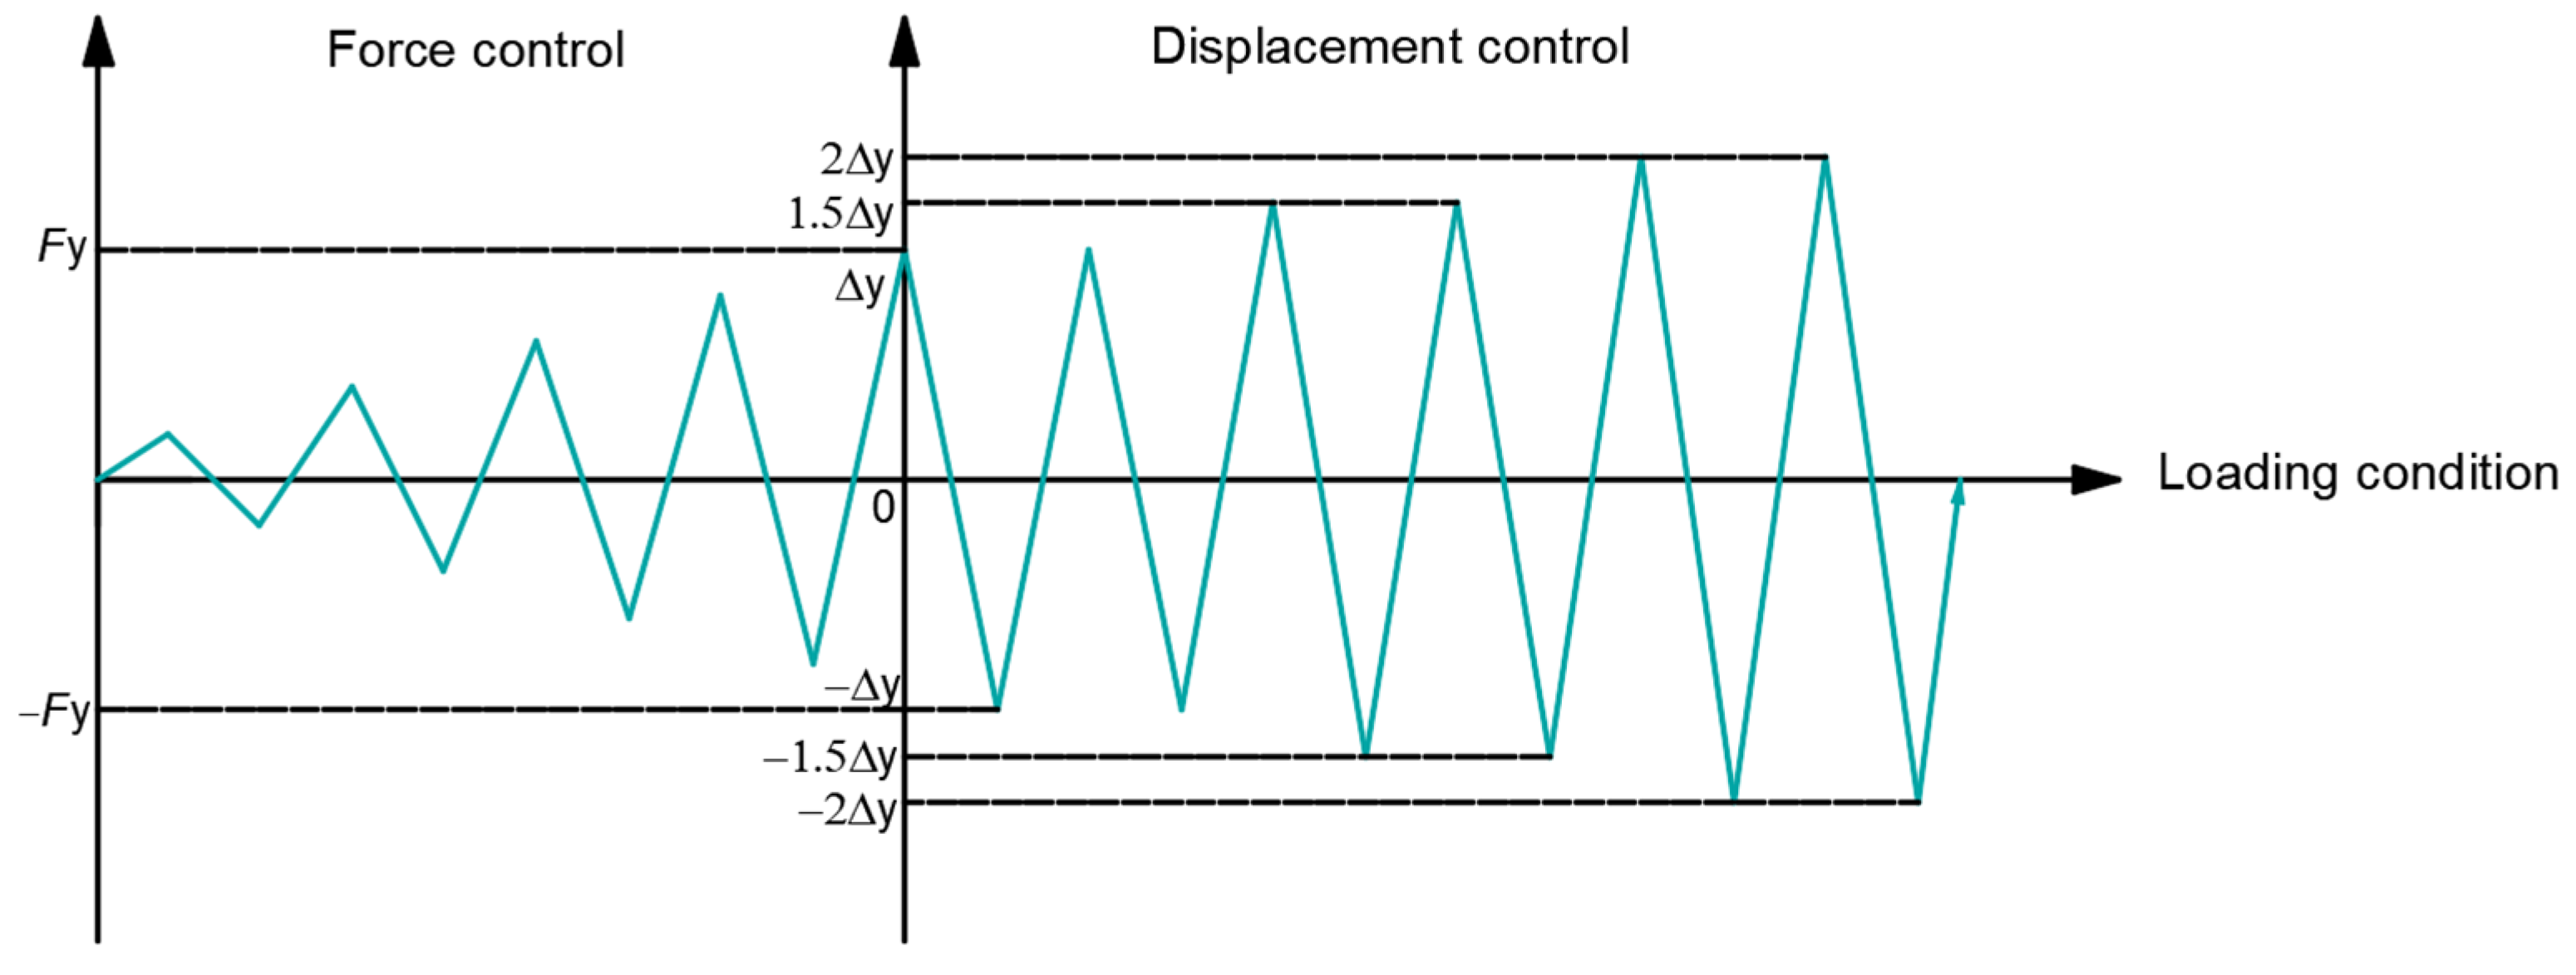
The axial load was applied and maintained using the vertical actuator until the end of the tests, ensuring axial load ratios of 0.1, 0.2, and 0.3 for the six specimens. The quasi-static testing followed a low-cycle loading pattern, adopting a mixed loading method that combines force and displacement control. Force-controlled loading was used before cracking, with one cycle per loading amplitude. Displacement-controlled loading was adopted after cracking, with two cycles repeated for each loading amplitude (Figure 3). Loading was terminated when the specimens were damaged or when the peak load dropped below 85% of the maximum load.
Figure 3. The loading procedure.

3. Failure Mode

3.1. Experimental Observations

3.1.1. HA01 Specimen

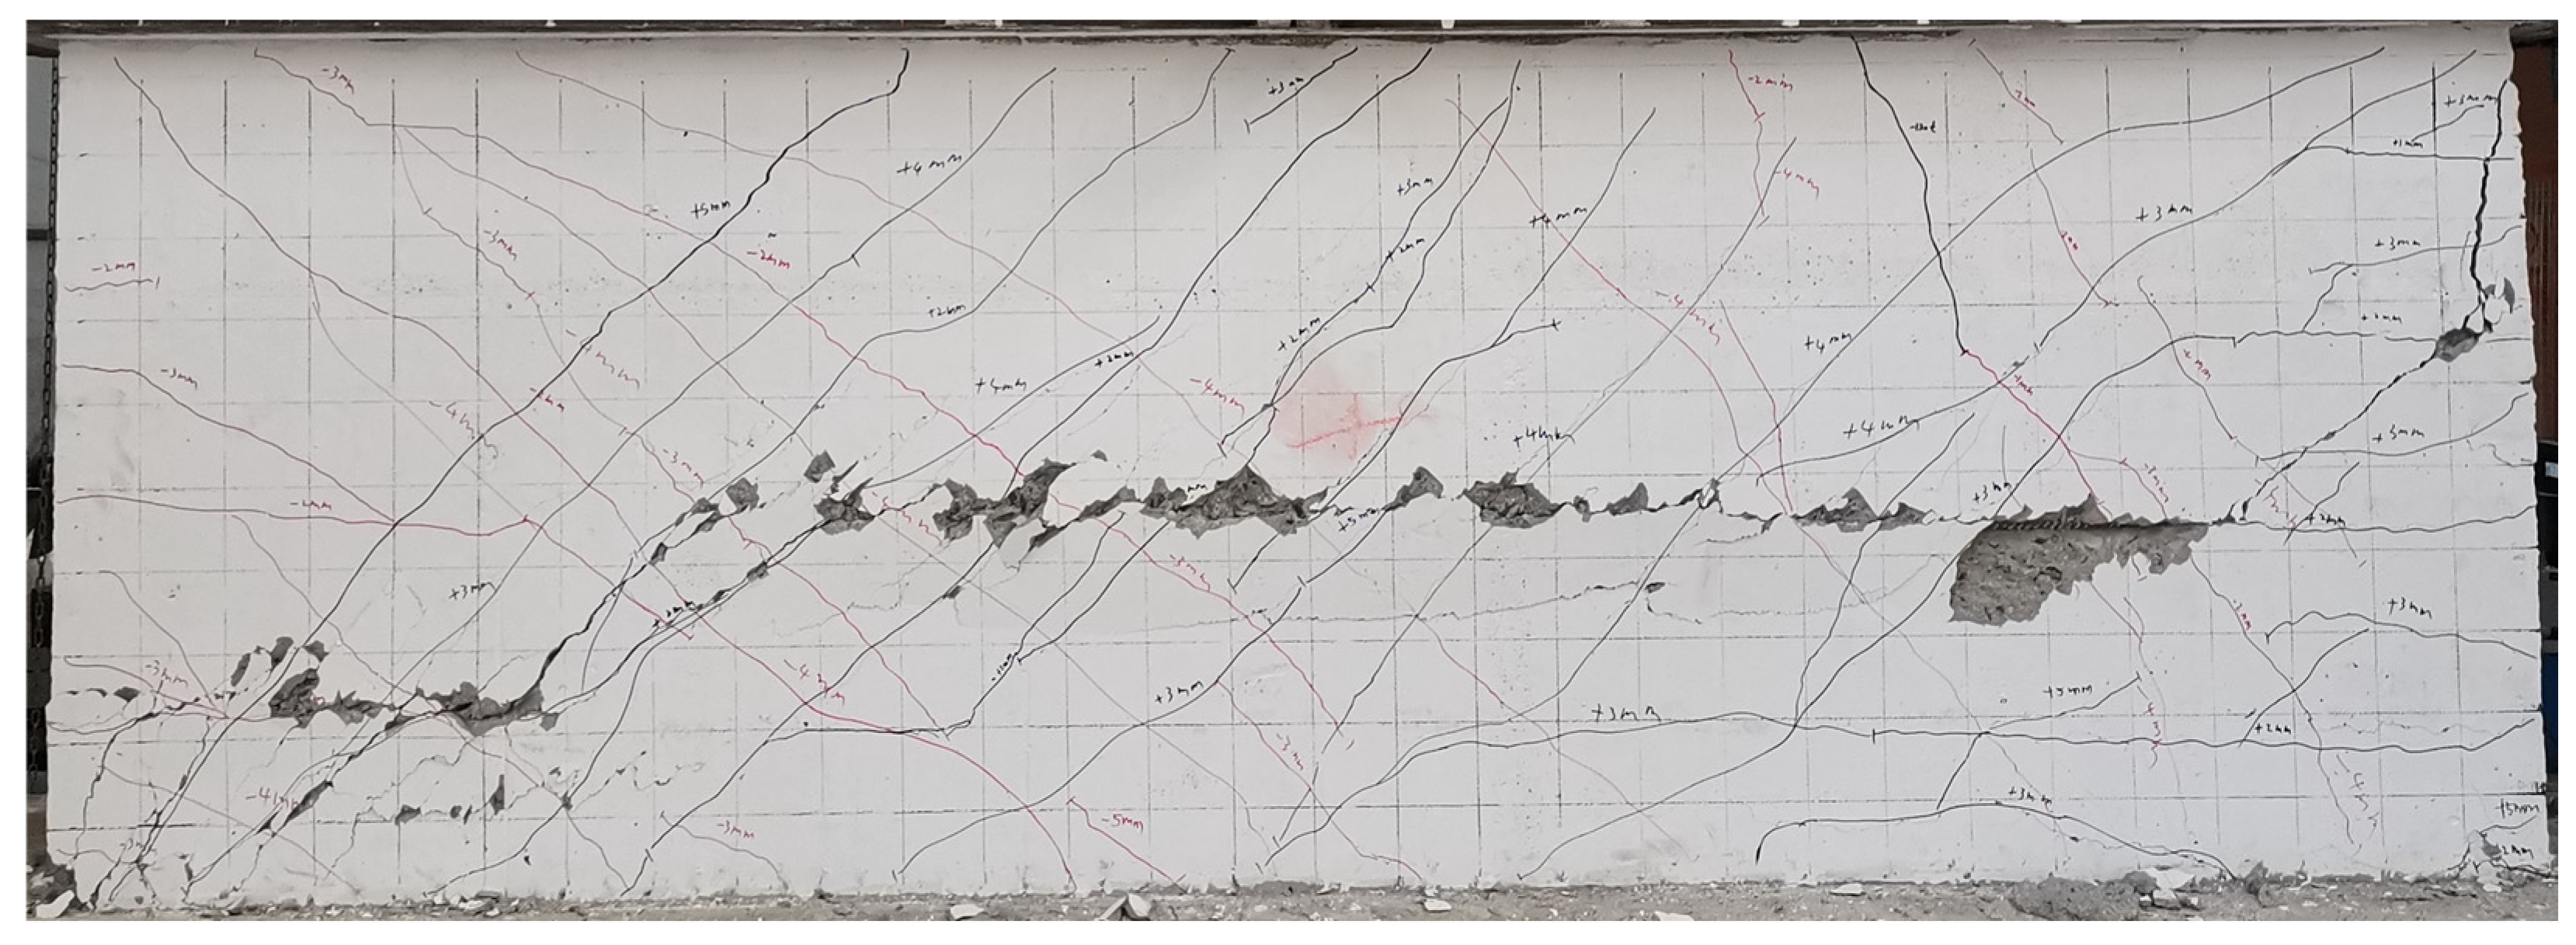
An axial load of 840 kN was applied before the test and maintained until the end of the test to ensure an axial load ratio of 0.1. Load control was applied for horizontal loading until it reached 850 kN with a drift ratio of 0.03% (0.36 mm), following which the loading was switched to displacement control. At this point, two oblique cracks appeared in the upper part of the wall. When the drift ratio ranged from 0.5% (6 mm) to 0.67% (8 mm), the number of cracks stabilized with no new crack formation; however, the width of existing cracks continued to increase, with intensified cracking at the bottom of both sides of the wall. When the drift ratio reached 0.75% (9 mm), the concrete at the bottom right side of the wall crushed and a large amount of concrete spalled off; the concrete in the middle of the wall also spalled, exposing the horizontal steel bar; and the concrete at the top of the north side of the wall crushed, with the wall exhibiting obvious brittle failure. The ultimate state of the HA01 specimen is shown in Figure 4.
Figure 4. Ultimate state of HA01 specimen.

3.1.2. HA02 Specimen

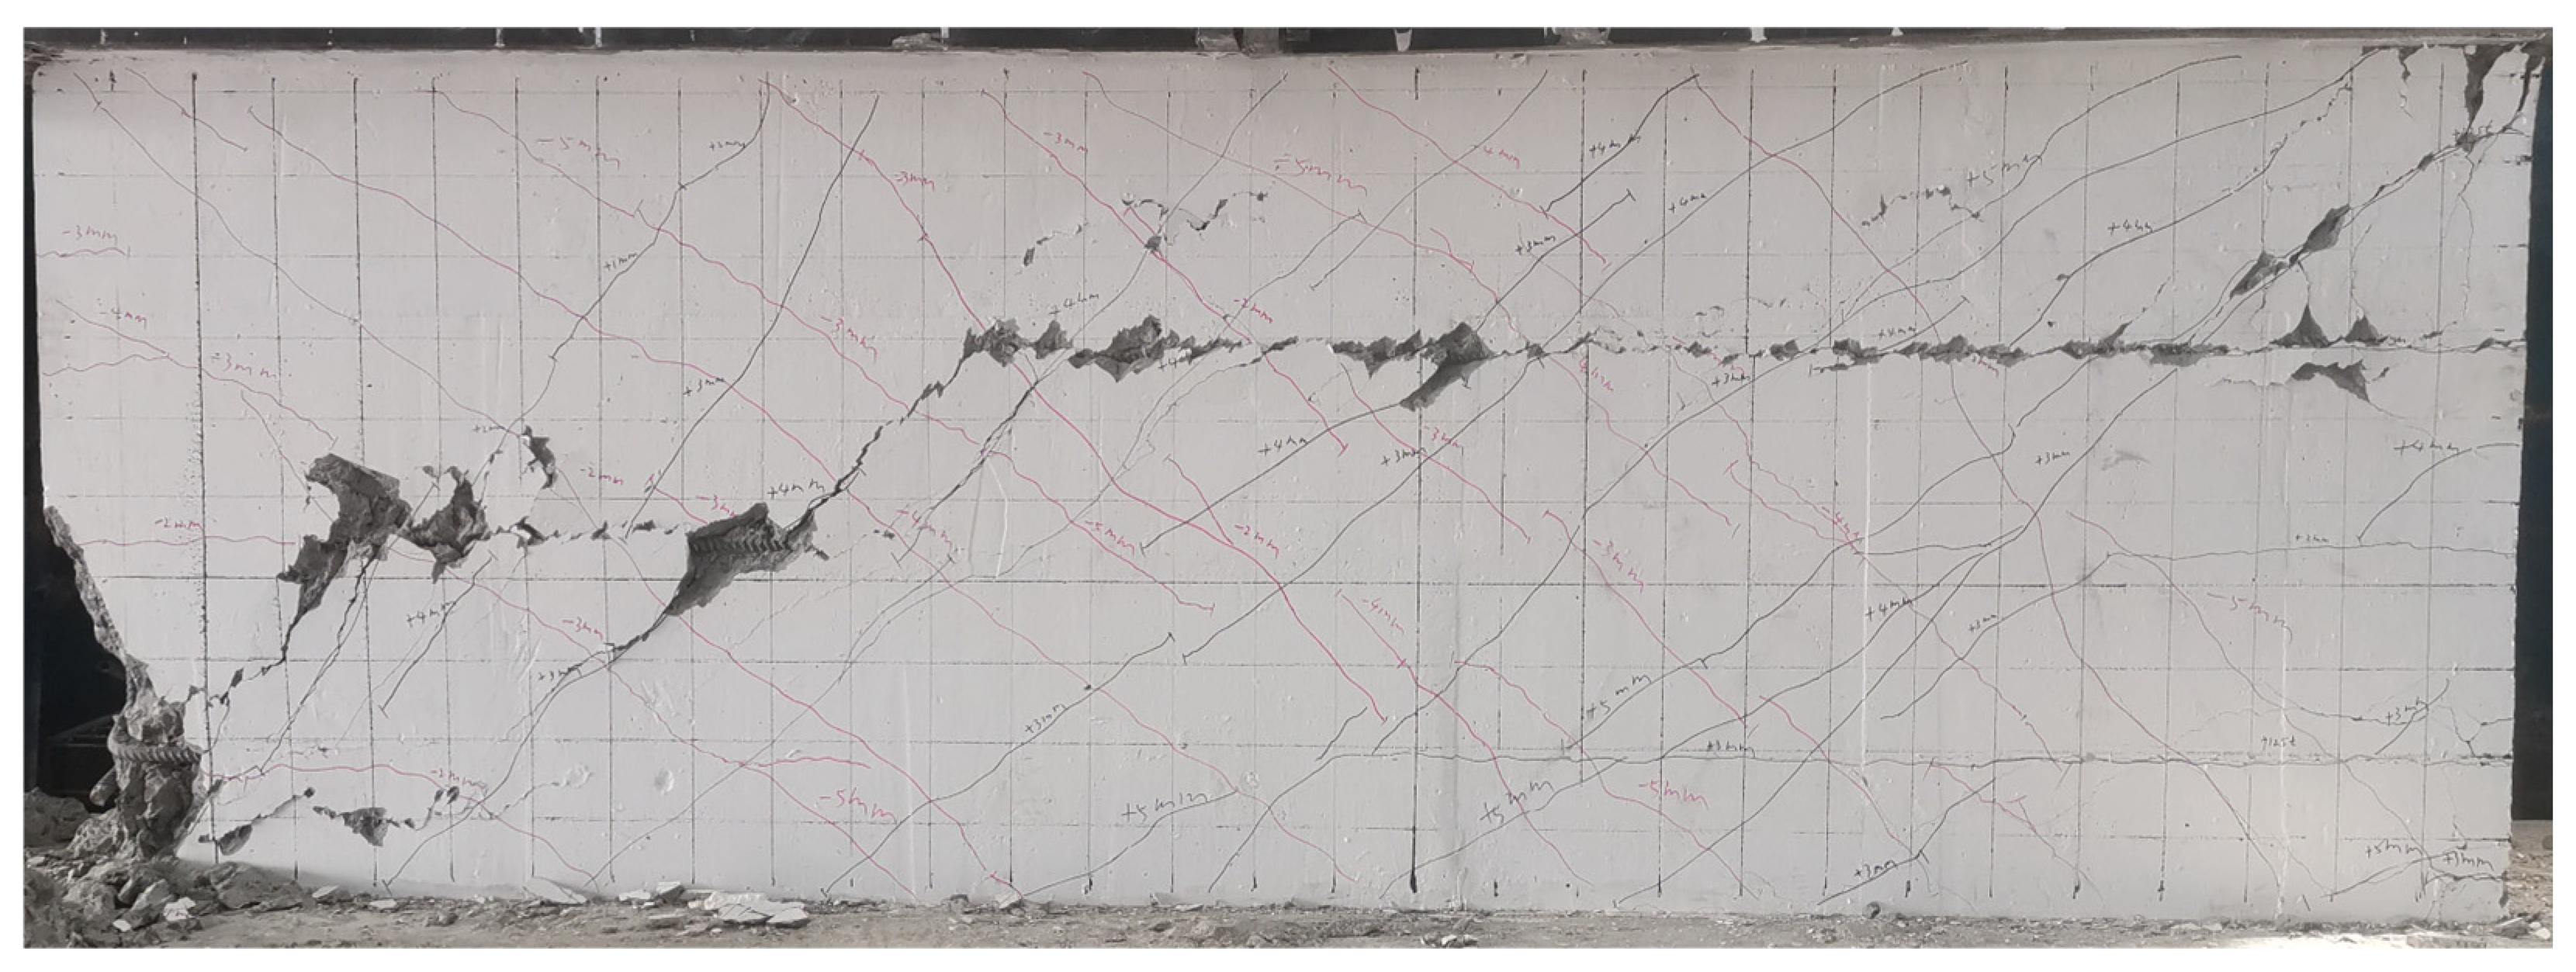
An axial load of 1680 kN was applied before the test and maintained until the end of the test to ensure an axial load ratio of 0.2. Force-controlled loading was applied until cracks appeared at the bottom of the wall at a load of 1250 kN and the drift ratio of 0.07% (0.81 mm), following which the loading switched to displacement control. When the drift ratio exceeded 0.5% (6 mm), the cracks were considered fully developed, and their widths continued to expand. When the drift ratio reached 0.58% (7 mm), failure occurred suddenly after the first cycle of positive loading. Upon failure, a large amount of concrete crushed at the left corner, part of the steel bar was exposed, concrete spalled off in the middle of the right side of the wall, and a small amount of concrete spalled off at the top of the left side. Damage at the corners was more severe, with cracks gradually developing from diagonal to horizontal cracks, leading to a shear slip plane and horizontal sliding of the wall. The ultimate state of the HA02 specimen is shown in Figure 5.
Figure 5. Ultimate state of HA02 specimen.

3.1.3. HA03 Specimen

An axial load of 2520 kN was applied and maintained constant to ensure an axial load ratio of 0.3 throughout the test. Horizontal loading was initiated thereafter. At a horizontal load of 1300 kN and a drift ratio of 0.08% (0.96 mm), a diagonal crack appeared above the northern side of the specimen, prompting a switch to displacement control. The diagonal and horizontal cracks gradually increased, among which four diagonal cracks developed through the shear wall. When the drift ratio exceeded 0.42% (5 mm), no new cracks formed. Symmetrical pre-existing cracks were fully developed, and their widths continued to expand. When the drift ratio reached 0.58% (7 mm), brittle failure occurred simultaneously: the concrete at the base of the wall crushed, causing detachment of the middle and upper portions; diagonal cracks evolved into shear slip planes; concrete on these surfaces disintegrated; and corner areas experienced crushing, leading to horizontal sliding. The ultimate state of the HA03 specimen is shown in Figure 6.
Figure 6. Ultimate state of HA03 specimen.

3.1.4. LA01

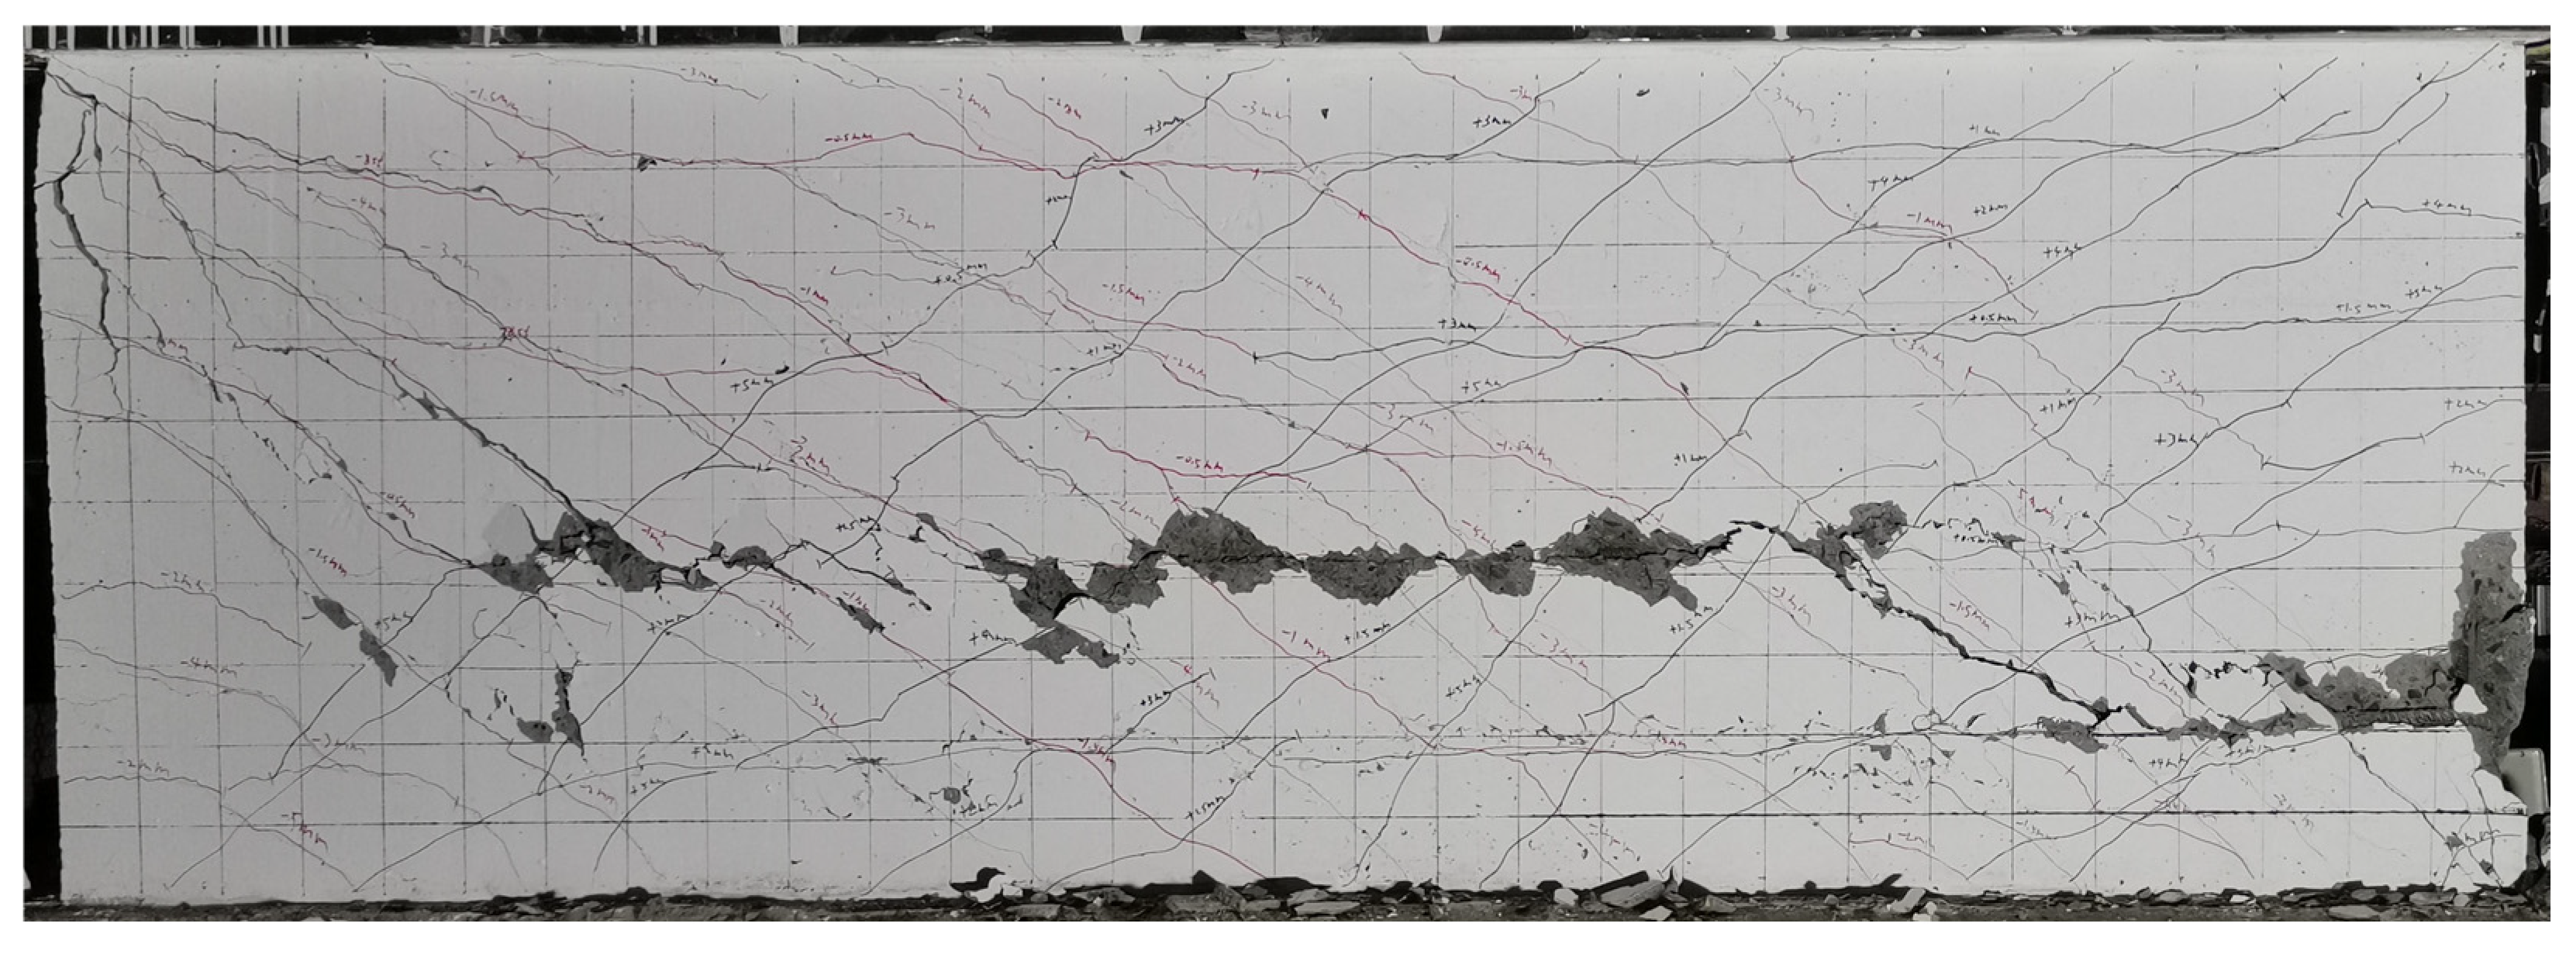
An axial load of 840 kN was applied before the horizontal loading and maintained constant throughout the test to ensure a stable axial load ratio of 0.1. When the horizontal load was 900 kN and the corresponding drift ratio was 0.03% (0.23 mm), a horizontal crack emerged on the left side of the wall. At this time, the control mode was switched to displacement control. At a drift ratio of 0.33% (3 mm) and a load of 4230 kN, cracks were fully developed and the diagonal cracks gradually developed. Subsequently, horizontal cracks caused by the initial bending moment gradually extend obliquely, and new oblique cracks kept emerging. Several oblique cracks developed into through cracks. When the drift ratio reached 0.67% (6 mm), the concrete at the bottom and middle of the right side of the wall was destroyed, and loading was terminated. The left side exhibited a conspicuous diagonal shear crack aligned with the principal stress direction. A short diagonal shear crack at the bottom right evolved into a horizontal crack. The ultimate state of the LA01 specimen is shown in Figure 7.
Figure 7. Ultimate state of LA01 specimen.

3.1.5. LA02

An axial load of 1680 kN was applied before the test and maintained until the end of the test to ensure an axial load ratio of 0.2. Controlled loading was applied until cracks appeared at the bottom of the wall at a load of 1150 kN and a drift ratio of 0.03% (0.27 mm), following which the loading switched to displacement control. Five diagonal through cracks appeared when the displacement loading reached the 1 mm level. As the loading displacement increased, the shear force of the shear wall kept growing, diagonal cracks continued to emerge, and the initial horizontal cracks also extended diagonally and developed. The cracks gradually developed and ran through the shear wall. After the drift ratio reached 0.44% (4 mm), the concrete on the top beam of the north side of the shear wall was crushed and fell off. The failure of the top beam led to loss of the shear wall specimen’s ability to continue loading. The ultimate state of the LA02 specimen is shown in Figure 8.
Figure 8. Ultimate state of LA02 specimen.

3.1.6. LA03

An axial load of 2520 kN was applied to achieve an axial load ratio of 0.3, then formal loading commenced. At a horizontal load of 1550 kN and a drift ratio of 0.07% (0.64 mm), two horizontal crack emerged at the middle of the wall. At this time, the load control mode was switched to displacement control. As the drift ratio increased, horizontal cracks caused by bending moment and diagonal cracks caused by shear force kept emerging. Among them, the diagonal cracks developed more rapidly and, gradually, ten of them evolved into cracks that ran through the wall. After the drift ratio reached 0.44% (4 mm), a small amount of concrete fell off the upper left corner. When the drift ratio reached 0.56% (5 mm), the concrete at the top of the north side of the wall was crushed and a large amount of concrete fell off, exposing the steel bars. The specimen lost its ability to continue loading and the loading was ended. The ultimate failure mode was determined as localized shear failure. The ultimate state of the LA03 specimen is shown in Figure 9.
Figure 9. Ultimate state of LA03 specimen.

3.2. Failure Mode

Based on the experimental process and results, the final failure modes of the specimens were classified as shear sliding failure, bending-shear failure, and local failure.
Specimens HA02 and HA03, with high axial load ratios, exhibited predominantly shear sliding failure. Before peak load, diagonal cracks appeared and gradually widened while remaining relatively narrow. Upon reaching the peak load, significant growth of root cracks occurred. The concrete was crushed at one corner at the base of the wall, while concrete spalled off at another corner at the top. Damage cracks were primarily diagonal, extending from the top of one side to the bottom of the opposite side, forming diagonal shear cracks. Under cyclic loading, the inclined shear cracks intersected, degrading the strength of the concrete between them. Fractured concrete propagated along the length of the wall, creating a weakened horizontal plane near the base. Substantial concrete spalled off this surface, with corner concrete crushing, causing horizontal sliding and ultimate failure.
Bending-shear failure was observed in specimens HA01 and LA01 at a low axial load ratio (0.1), indicating that squat shear walls with lower axial load ratios exhibit better ductility. Initial cracks were predominantly oblique, occasionally accompanied by horizontal cracks. Before peak load, the diagonal cracks expanded and multiple horizontal cracks formed symmetrically. Upon peak load, cracking initiated at the corners, leading to shear oblique cracks that evolved into horizontal bending cracks until failure.
Local shear failure occurred in specimens LA02 and LA03, which exhibited the highest bearing capacity, significant stiffness, and minimal ultimate displacement. Before the limit state, cracks initiated on both sides and in the center of the wall, progressively extending into through cracks. Due to their high ultimate bearing capacity, when these walls reached the ultimate limit state, substantial concrete spalled off at the top corners, exposing the horizontal reinforcement. The top region experienced initial damage due to large shear forces, causing failure of the top beam and a loss of load-bearing capacity.

4. Discussion

4.1. Bearing Capacity and Ductility

The load and displacement at each characteristic point of the specimens in the quasi-static test are shown in Table 3 and Table 4, where Fcr is the cracking load, Δcr is the cracking displacement, Fy is the yield load, Δy is the yield displacement, Fp is the peak load, Δp is the peak displacement, Fu is the ultimate load, and Δu is the ultimate displacement, μ is the ductility factor (μ = Δyu).
Table 3. The load at each feature point on the specimens.
Table 4. The displacement and ductility factor values for the specimens.
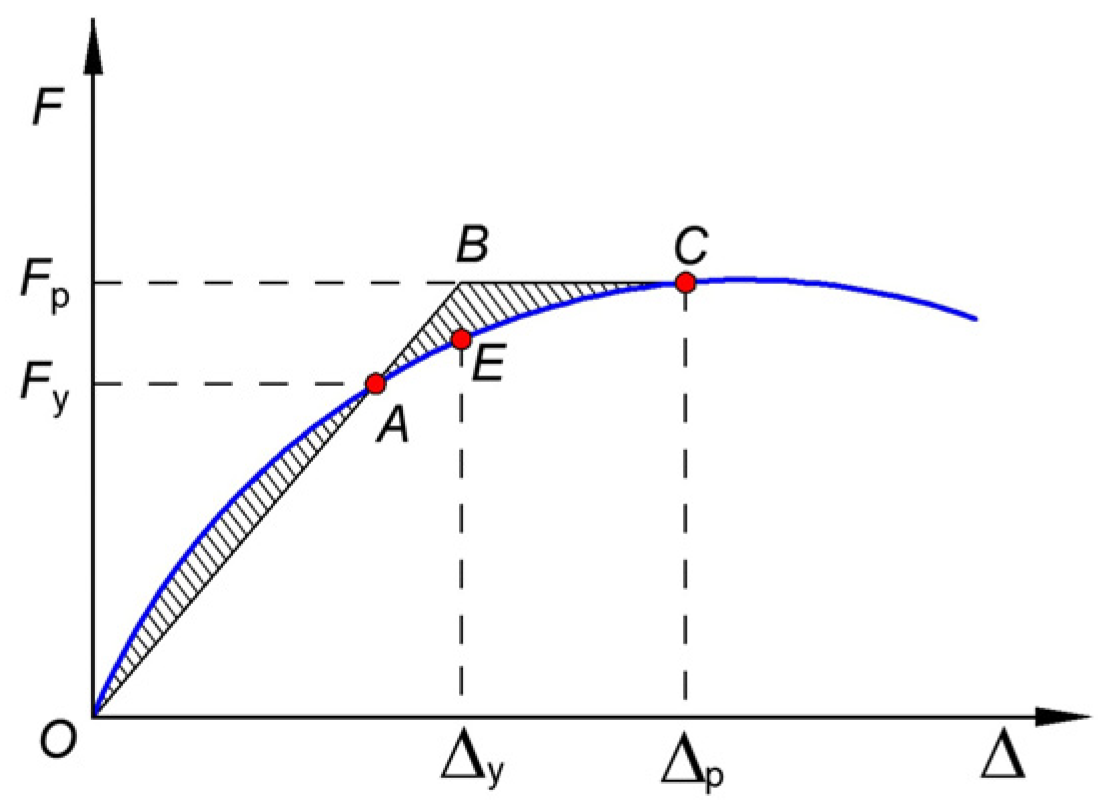
The energy method was used to determine the equivalent yield load and yield displacement []. Figure 10 shows that the energy generated by the two curves should be equal, ensuring that the two shaded areas are equal. The point E is defined as the yield point, with corresponding load Fy and yield displacement Δy.
Figure 10. Schematic diagram of energy method.
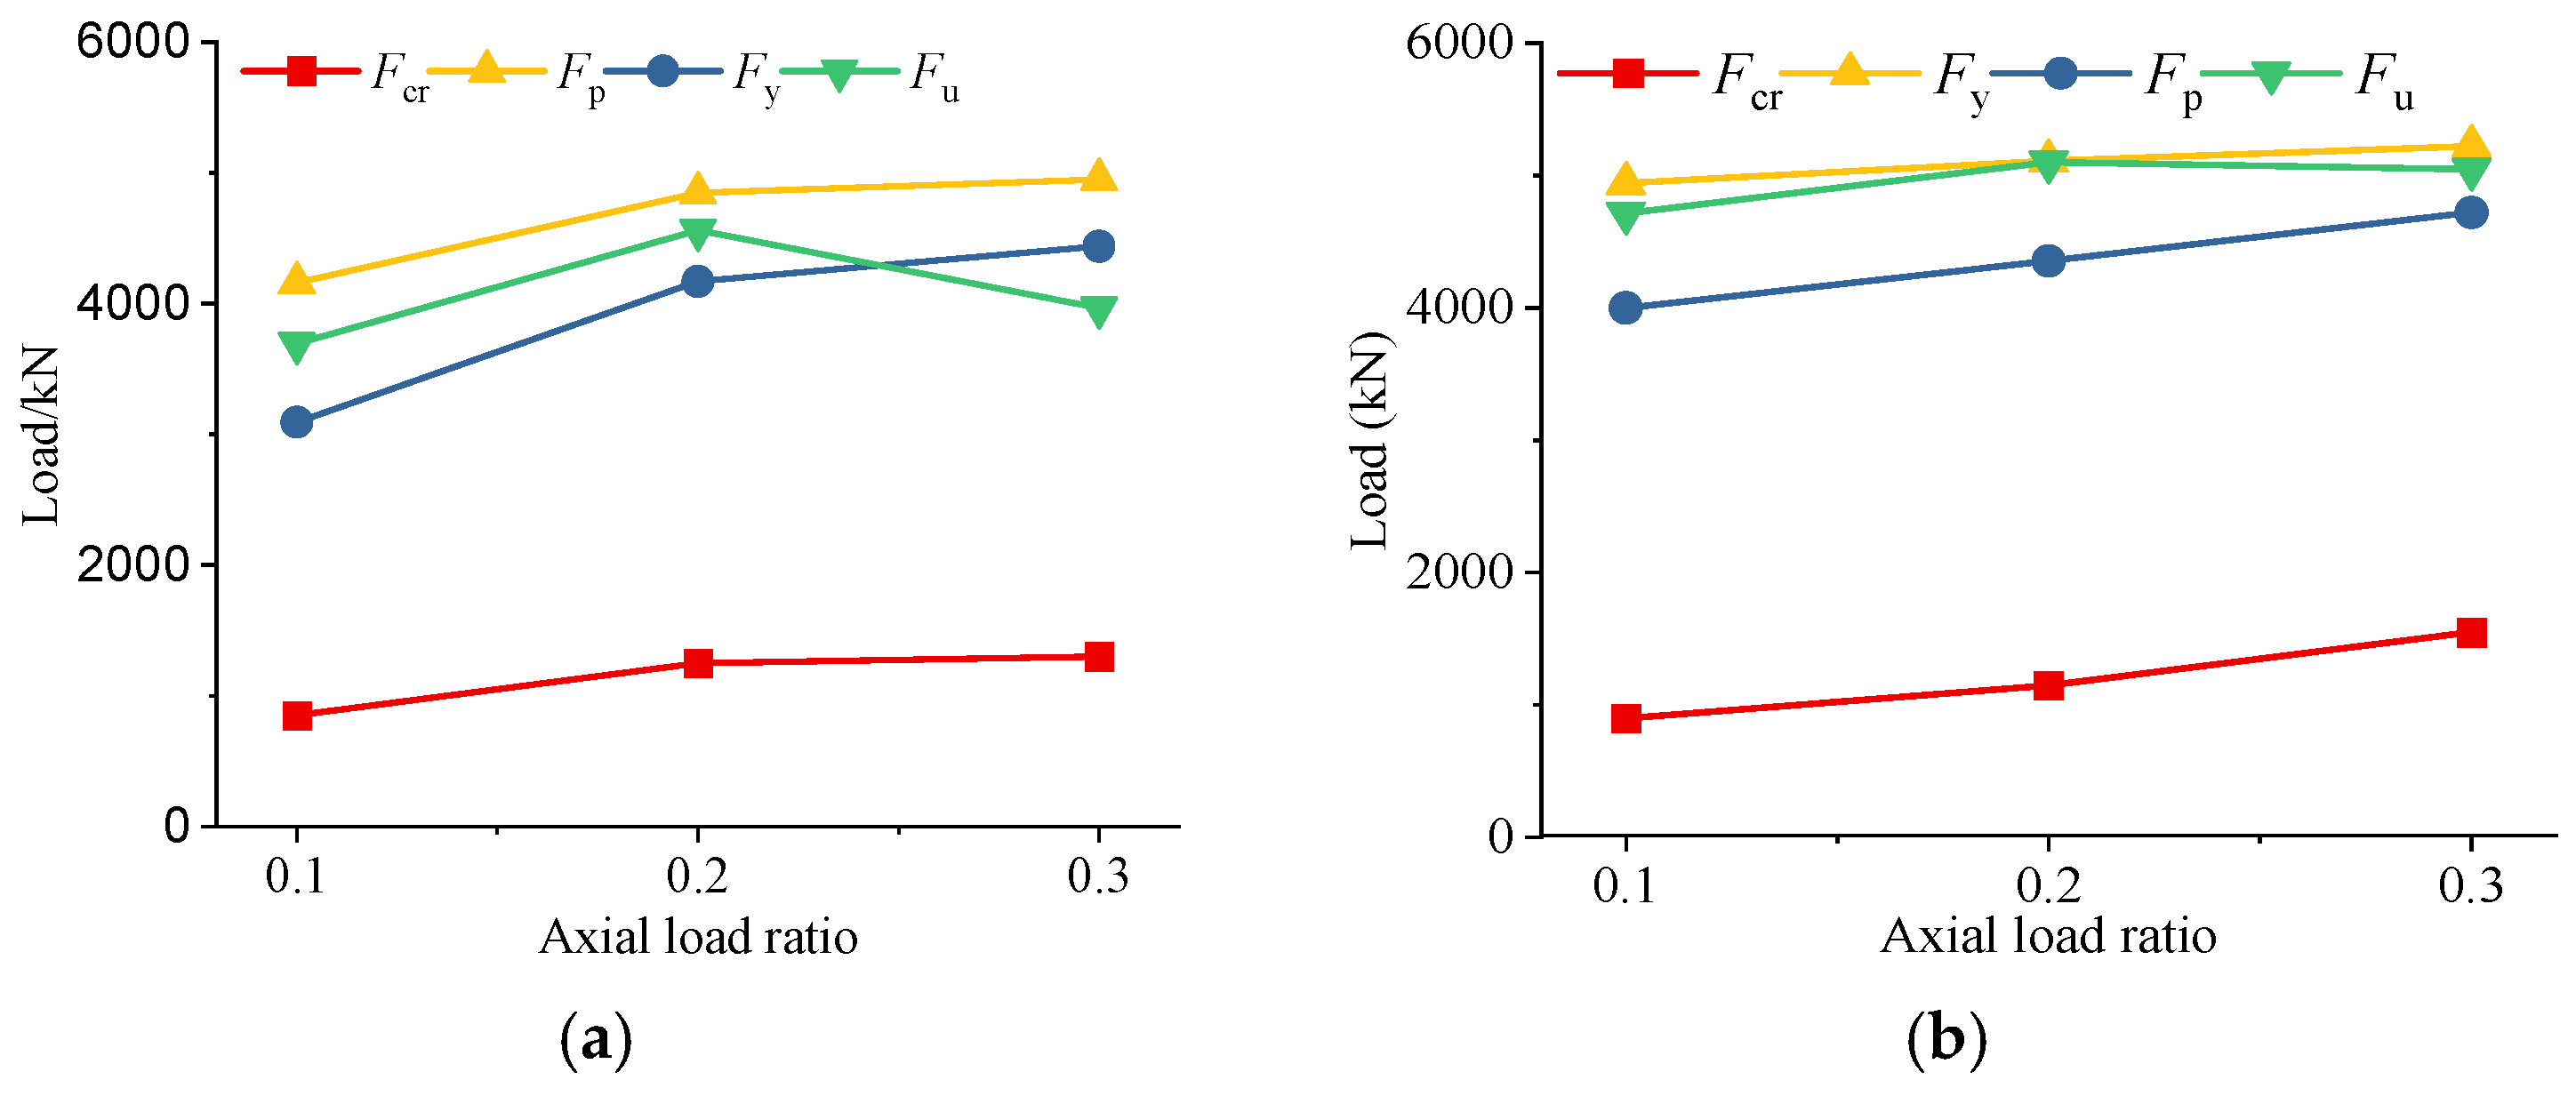
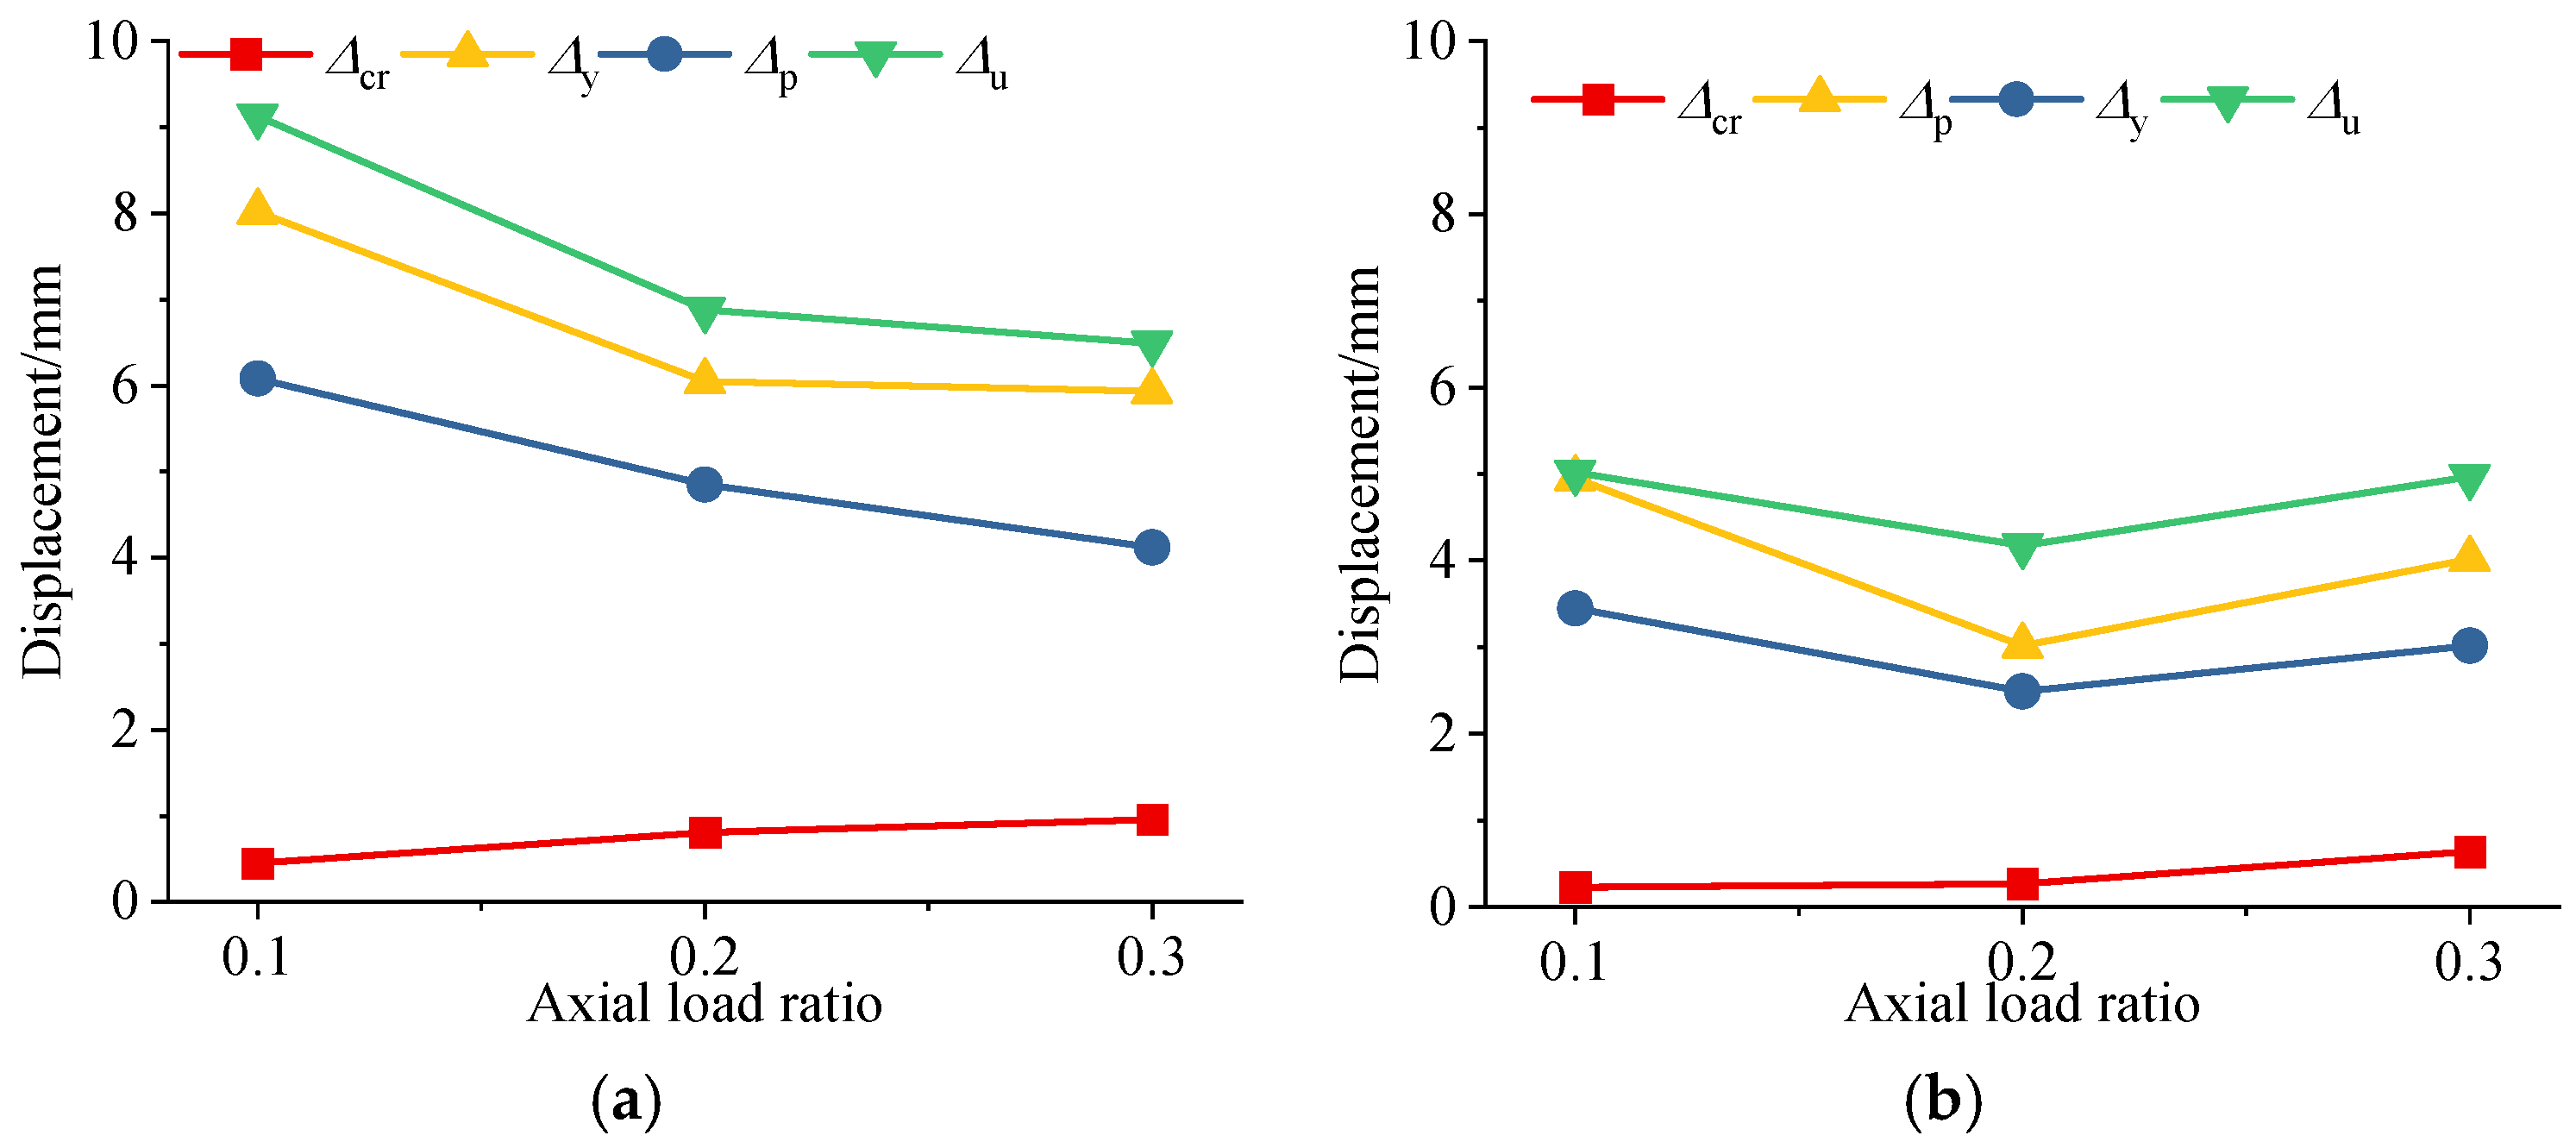
From Table 3 and Table 4, the relationships between the axial load ratio and the load and displacement at characteristic points were obtained (Figure 11 and Figure 12).
Figure 11. The relationship between the axial load ratio and the load at feature points: (a) H specimens; (b) L specimens.
Figure 12. The relation between the axial load ratio and the displacement at feature points: (a) H specimens; (b) L specimens.
Figure 11 shows that the bearing capacity at each characteristic point of the squat shear walls (excluding HA03) increased with the axial load ratio. This indicates that increasing the vertical load enhances the horizontal load-bearing capacity of squat shear walls, thus delaying cracking and yielding. The yield ratio of each specimen in the two groups is proportional to the axial load ratio, indicating that increasing the axial load reduces the energy dissipation capacity. The yield ratios exceed those of general reinforced concrete shear walls, suggesting failure upon reaching peak load without a significant drop—consistent with the observed brittle failure.
Figure 12 shows that the ductility factor of the specimens does not follow a clear trend. As the axial load ratio increases, the cracking, yield, peak, and ultimate displacements all decrease. This indicates that increasing the axial load ratio limits displacement and reduces ductility. The ductility factors of the squat shear walls are lower than those of general shear walls, reflecting their characteristics of high stiffness, small deformation, and poor ductility.

4.2. Hysteretic Behavior

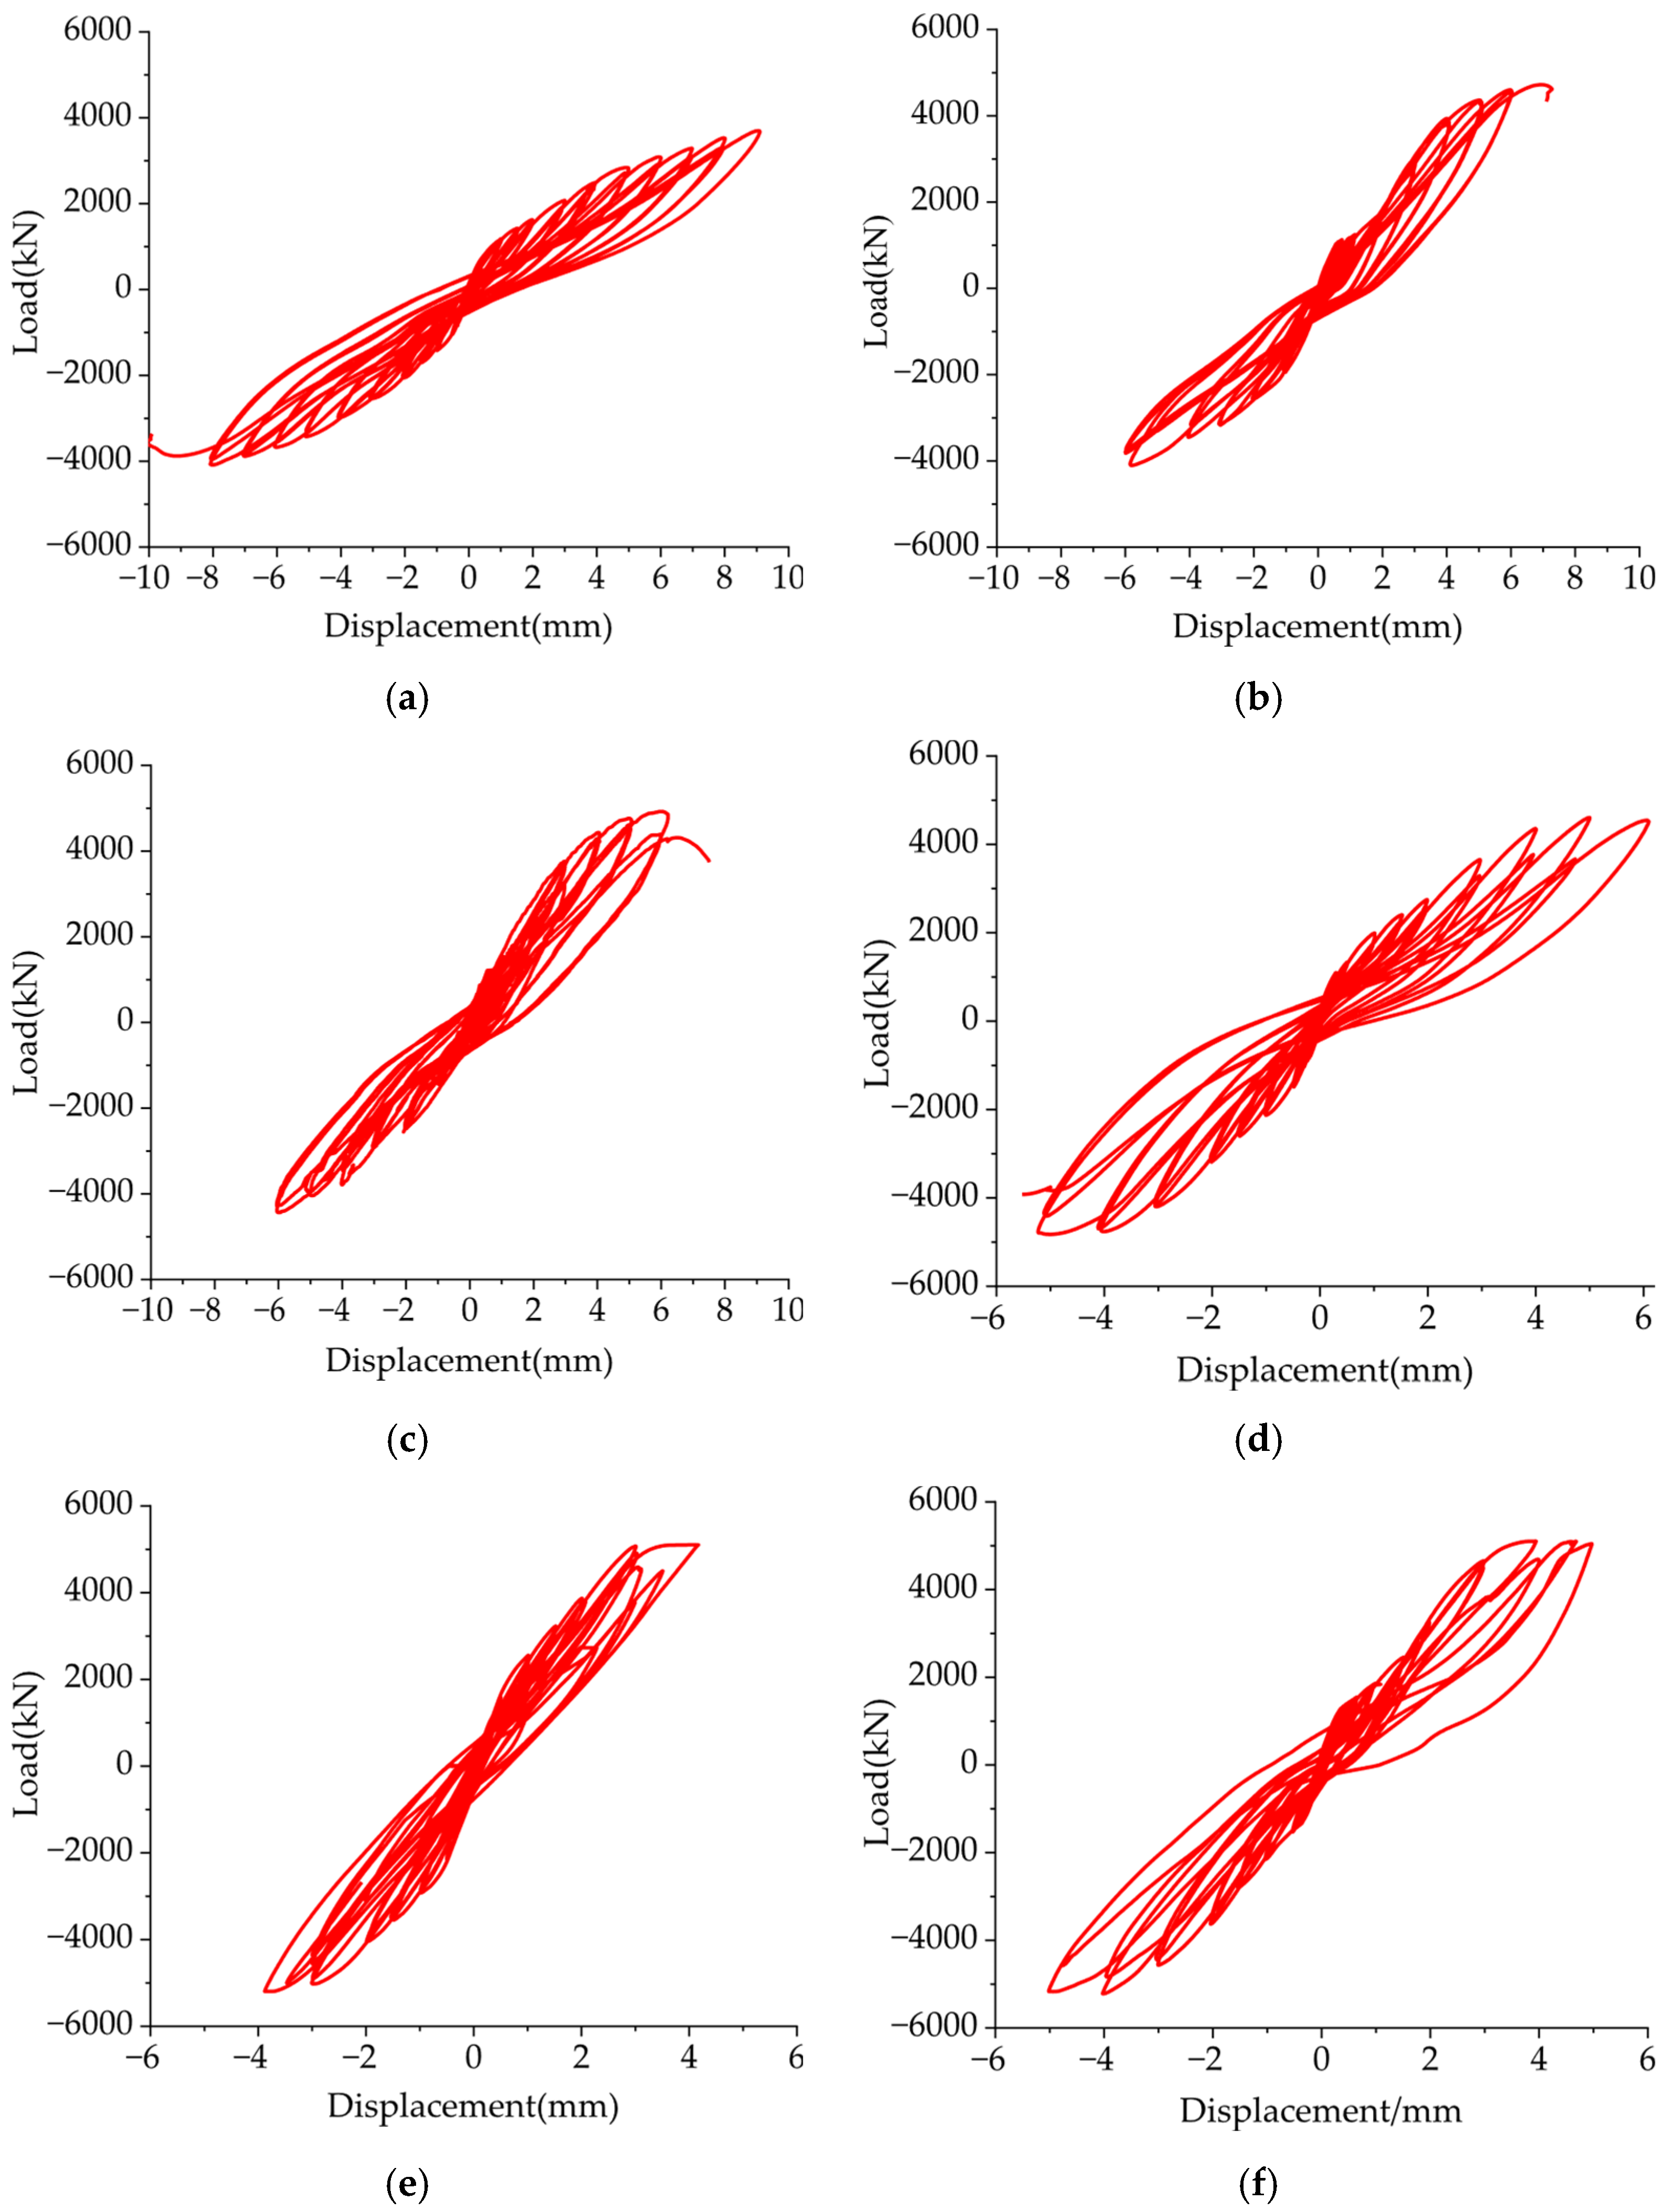
The hysteretic curve represents the relationship between load and displacement under cyclic loading. The measured hysteretic curves of the specimens are shown in Figure 12.
Figure 13 shows that all specimens exhibited similar hysteretic characteristics: during initial loading, the walls behaved elastically, with hysteretic curves approximating straight lines and negligible enclosed area. After cracking, the curves become nonlinear, residual deformation appears, and the area of the hysteretic loops gradually increases. With increasing plastic deformation, the loop areas increase and the slope decreases significantly. After the peak load, the curves show varying degrees of pinching. The pinching degree is inversely proportional to the axial load ratio; that is, lower axial load results in more pronounced pinching. However, due to axial load, crack propagation and bond-slip between reinforcement and concrete show less pinching when compared with that, in general, shear walls. Specimens with lower axial load ratios exhibit fuller hysteretic curves, indicating better energy dissipation capacity. Upon reaching peak load, the specimen exhibited a progressive degradation in bearing capacity. Residual deformations accumulated proportionally with increasing displacement, accompanied by the development of full-width cracks and a significant reduction in structural stiffness.
Figure 13. The relation between the axial load ratio and the displacement at feature points: (a) HA01; (b) HA02; (c) HA03; (d) LA01; (e) LA02; (f) LA03.

4.3. Skeleton Curve

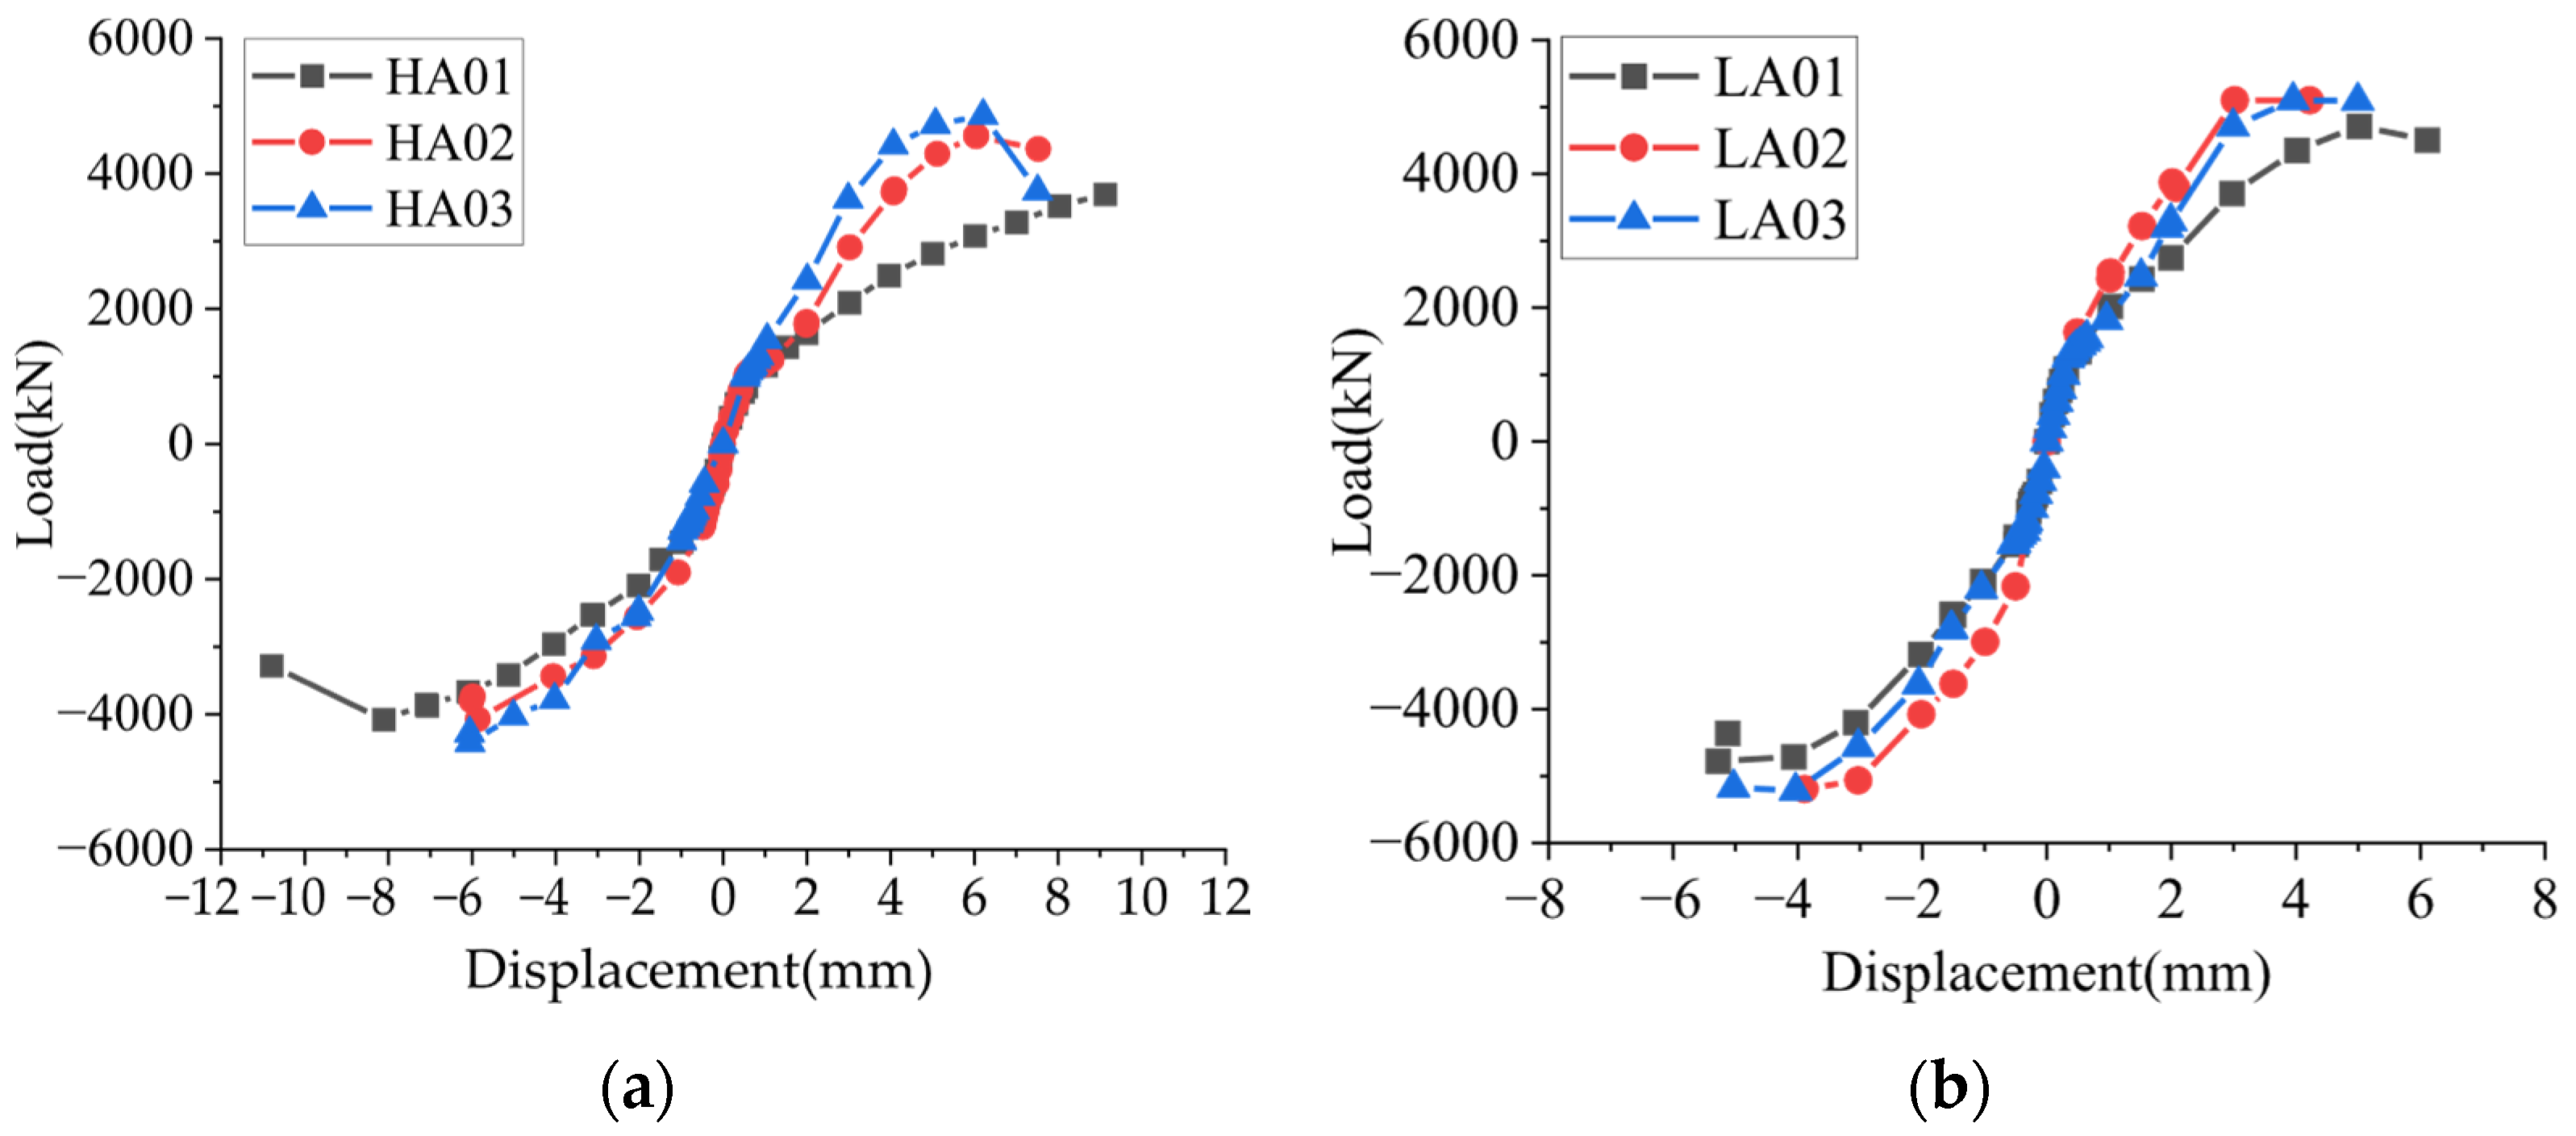
The skeleton curves of squat shear wall specimens with various axial load ratios are depicted in Figure 14.
Figure 14. Skeleton curves of the specimens: (a) H specimens; (b) L specimens.
Figure 14 shows that no distinct yield point was observed for any specimen. The curves transition from linear to curved behavior, coinciding before yielding without a clear inflection point. After cracking, the curve begins to bend. After yielding, an inflection point emerges and the curvature progressively decreases until peak load. Except for HA03, the other five specimens showed no significant descending branch, with peak and ultimate loads closely aligned. This indicates that squat shear walls have inferior ductility compared with conventional shear walls, consistent with the observed brittle failure. The results demonstrate that increasing the axial load ratio improves the load-bearing capacity but reduces ductility. The bearing capacity of the specimens in both groups exhibited a consistent trend: it increased with the axial load ratio, and the rate of this enhancement became more pronounced at higher ratios.

4.4. Energy Dissipations

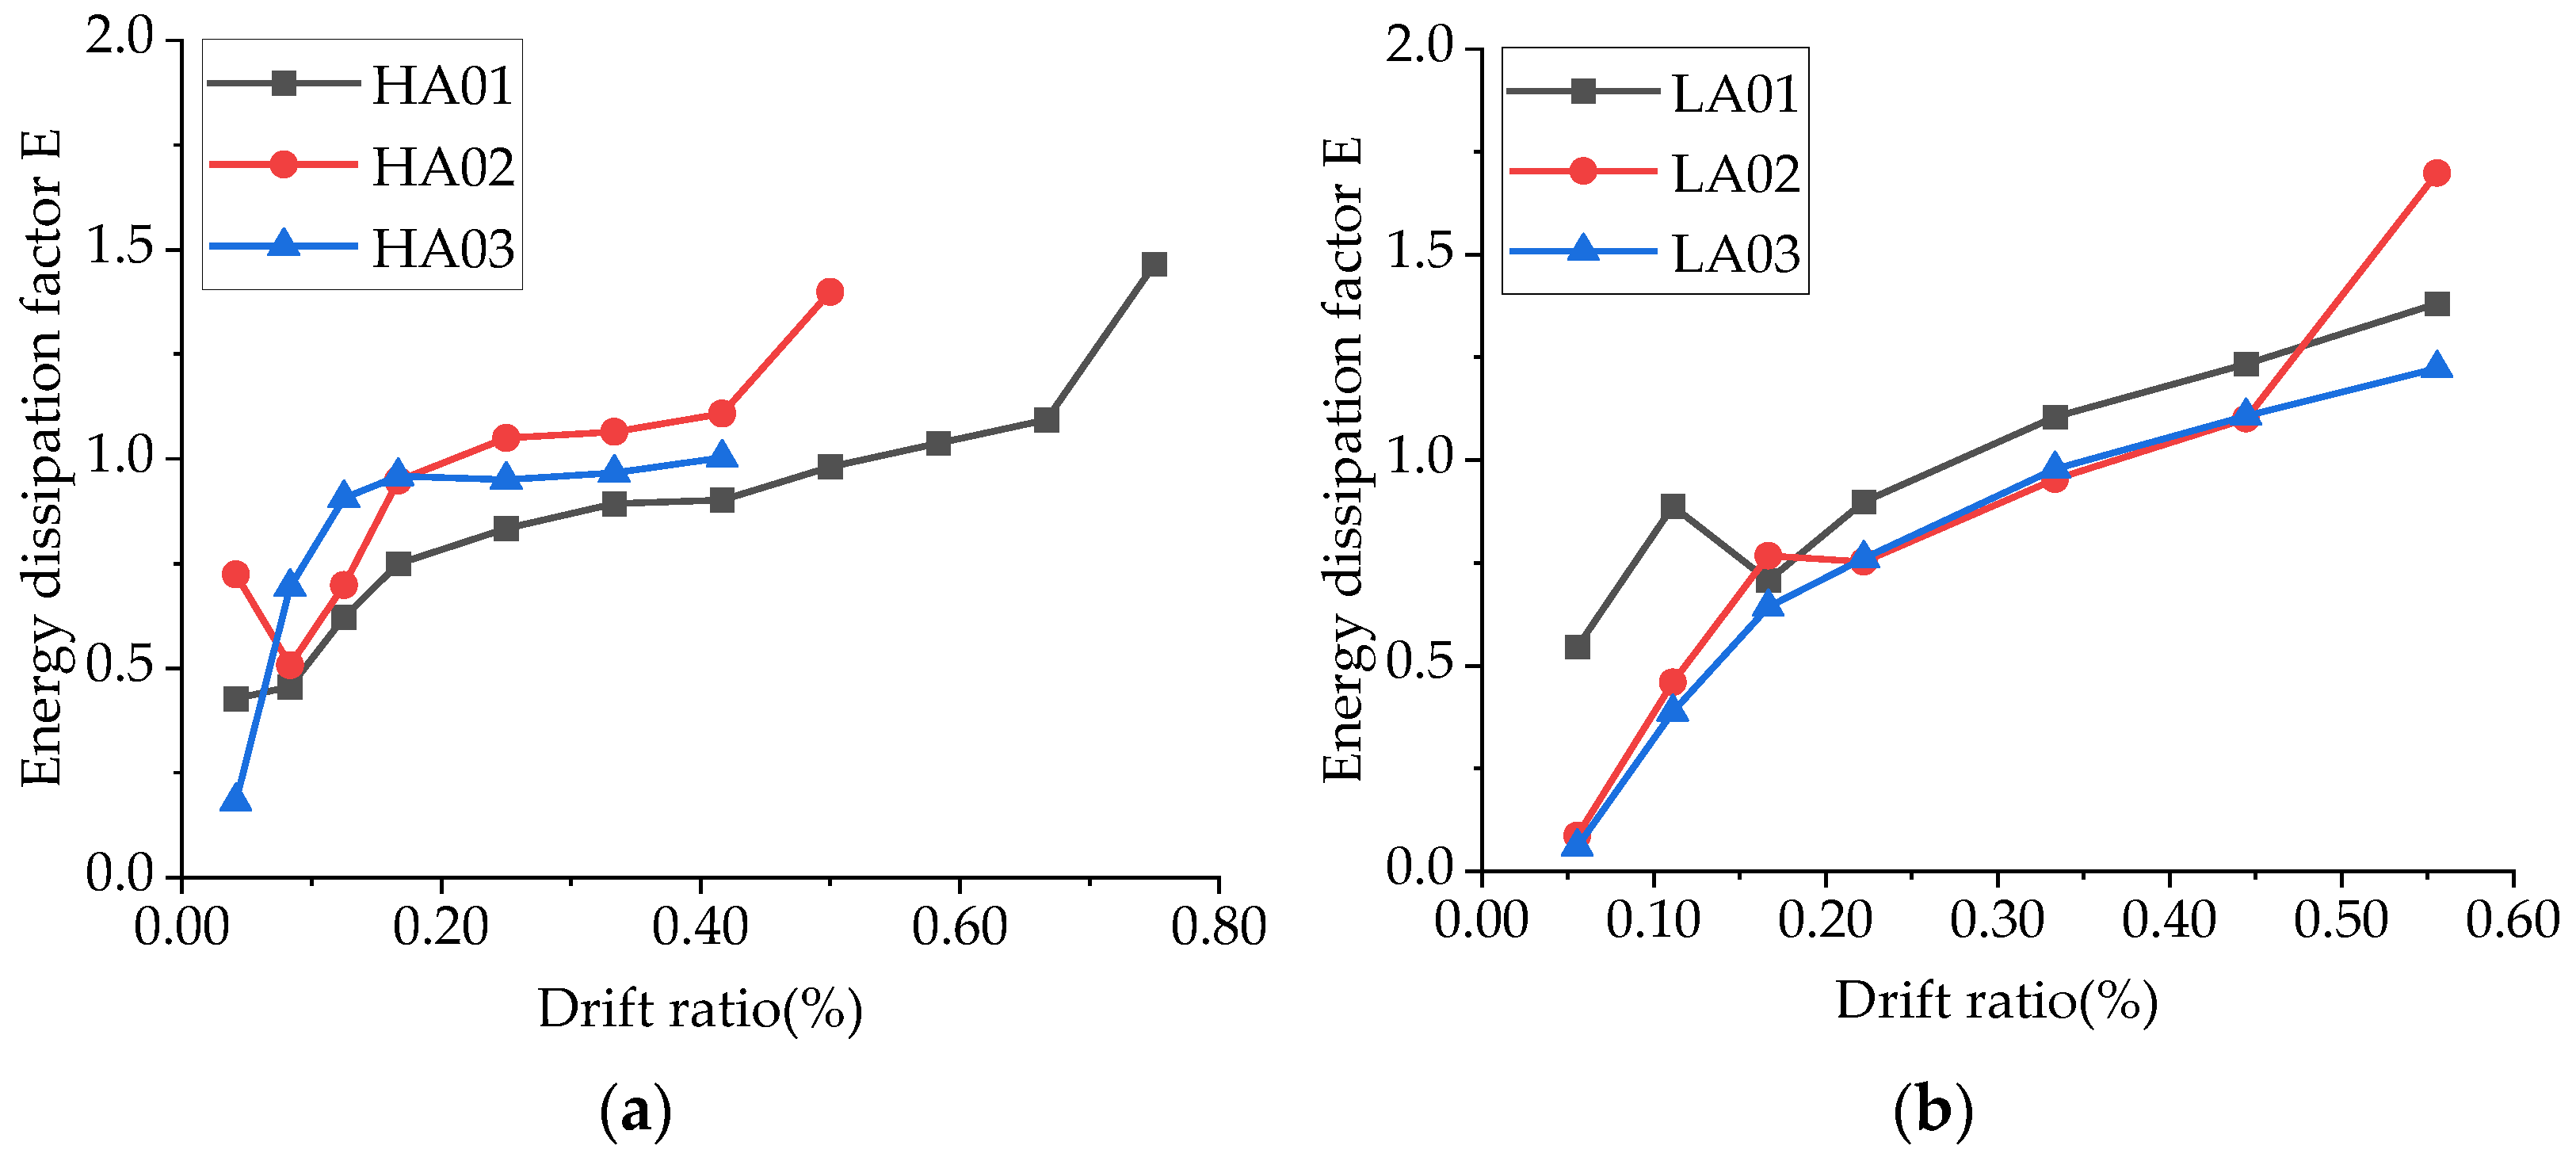
In this paper, the energy dissipation performance of squat shear wall specimens is quantified using the energy dissipation coefficient E, which is calculated by “Speciffcation for Seismic Test of Buildings” [] and plotted in Figure 15.
Figure 15. Comparison curve of energy dissipation factor for each specimen: (a) H specimens; (b) L specimens.
At the initial loading stage, the energy dissipation factor E increases rapidly. As the horizontal displacement increases, when the drift ratio exceeds 0.2%, each specimen yields successively and enters the plastic stage. In this stage, the energy dissipation factor maintains an increasing trend, but the curve slope decreases and the growth rate slows down. The energy dissipation capacity of H specimens is inversely proportional to the axial load ratio, while that of L specimens is relatively consistent. However, in the elastic stage, the energy dissipation capacity is inversely proportional to the axial load ratio. In the plastic stage, no regularity related to the axial load ratio was observed; this is because specimens LA02 and LA03 had defects in design and construction, resulting in their energy dissipation capacity not being fully demonstrated.
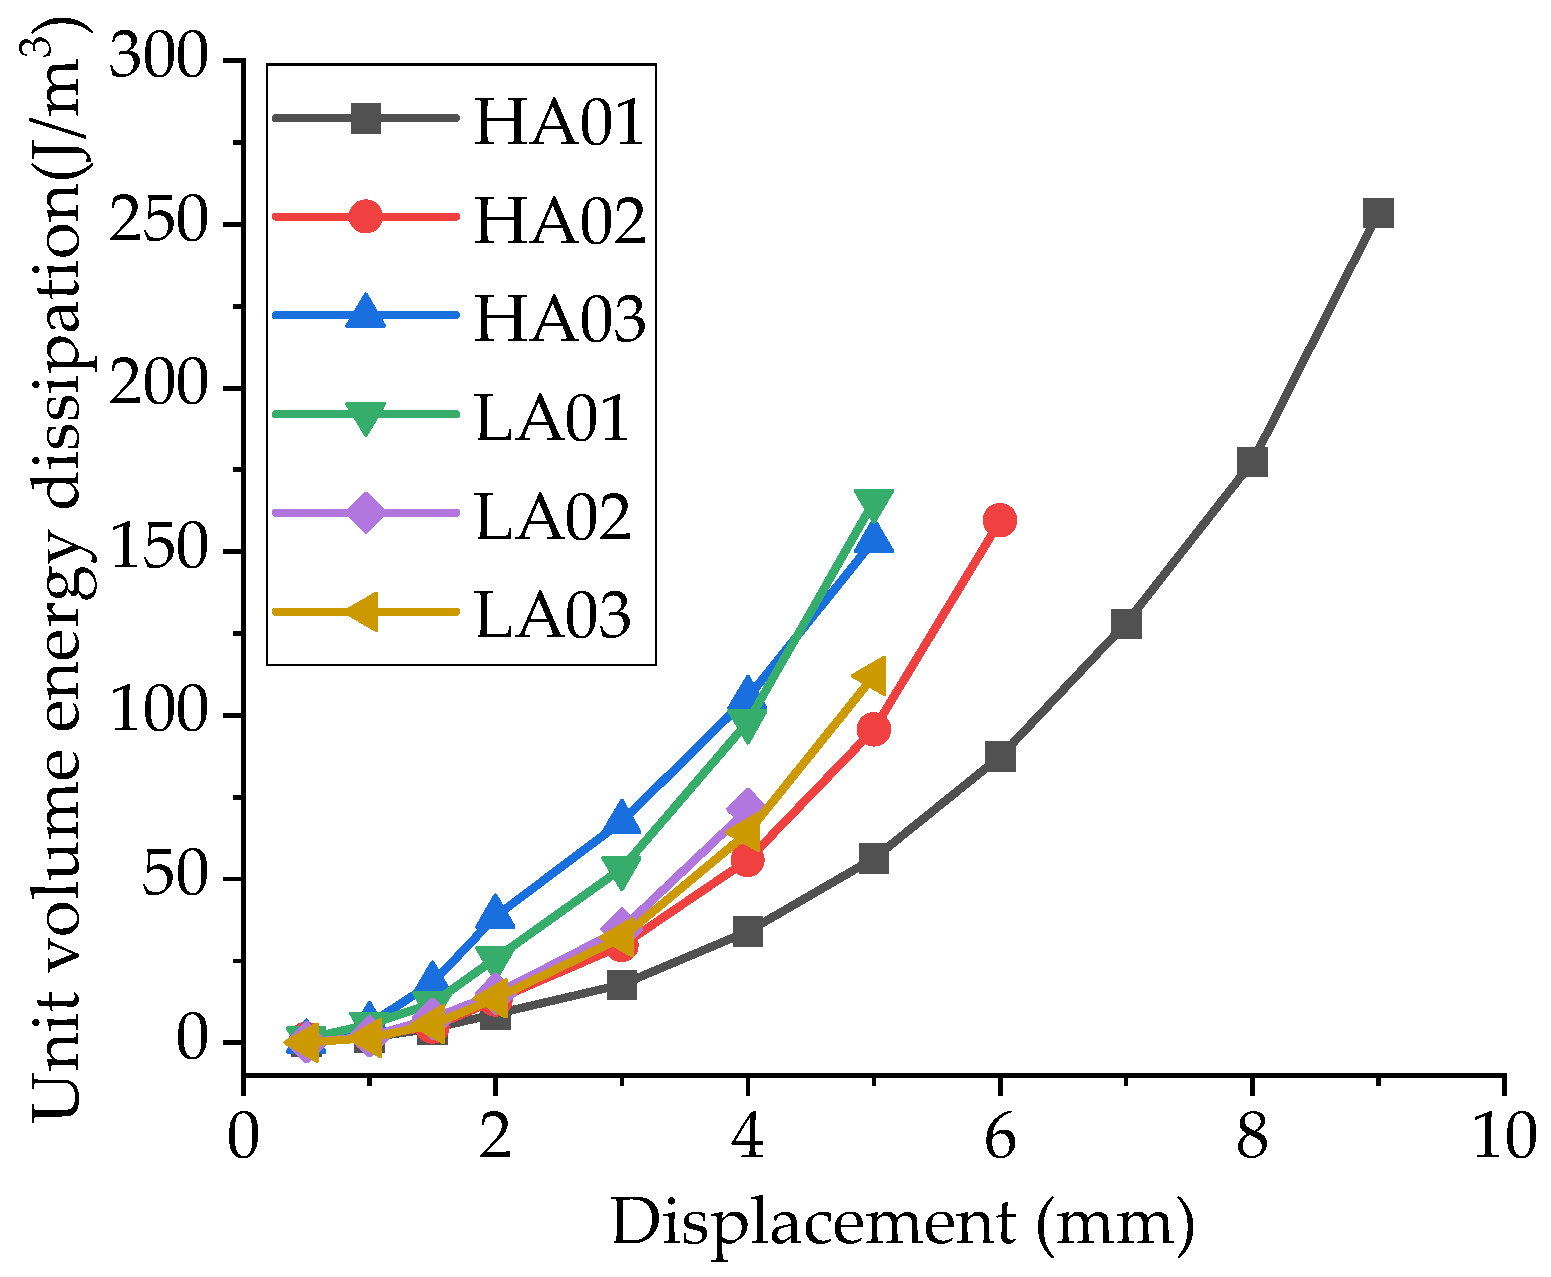
Cumulative energy dissipation is the total energy absorbed by the specimens under cyclic loading, which is calculated by summing the areas of the hysteretic loops. To facilitate a comparative analysis of the energy dissipation between specimens with differing dimensions, the cumulative energy dissipation needs to be normalized with respect to the volume of each specimen. Specifically, the cumulative energy dissipation is divided by the corresponding wall volume to obtain the unit volume energy dissipation (Equation (1)):
Ev = Ec/v
where Ev is the unit volume energy dissipation, Ec is the cumulated energy dissipation, and v is the volume of the shear wall. The unit volume energy dissipation of each specimen is shown in Figure 16.
Figure 16. Comparison of unit volume energy dissipation for each specimen.
As illustrated in Figure 16, the curves of each specimen exhibited similar behavioral trends. The HA01 and LA01 specimens, with the lowest axial load ratio (0.1), demonstrated greater unit volume energy dissipation, whereas the HA03 and LA03 specimens, with the highest axial load ratio (0.3), exhibited lower unit volume energy dissipation. This indicates that an increase in the axial load ratio enhances the energy dissipation capacity of squat shear walls. The final cumulative energy dissipation of the H specimens was higher than that of L specimens, indicating that at the same axial load ratio, a larger shear–span ratio in squat shear walls is associated with enhanced energy dissipation capacity. The energy dissipation behavior of the three H specimens exhibited a distinct pattern. As the top beams were not reinforced during construction, premature failure occurred in the top beams in specimens LA02 and LA03 prior to that in the walls, which hindered the accurate measurement of energy dissipation in the L specimens. As a result, no consistent trend was observed in their energy dissipation performance. Therefore, further experimental studies are required to fully understand the energy dissipation characteristics of large-scale squat shear walls with a shear–span ratio of 0.3.

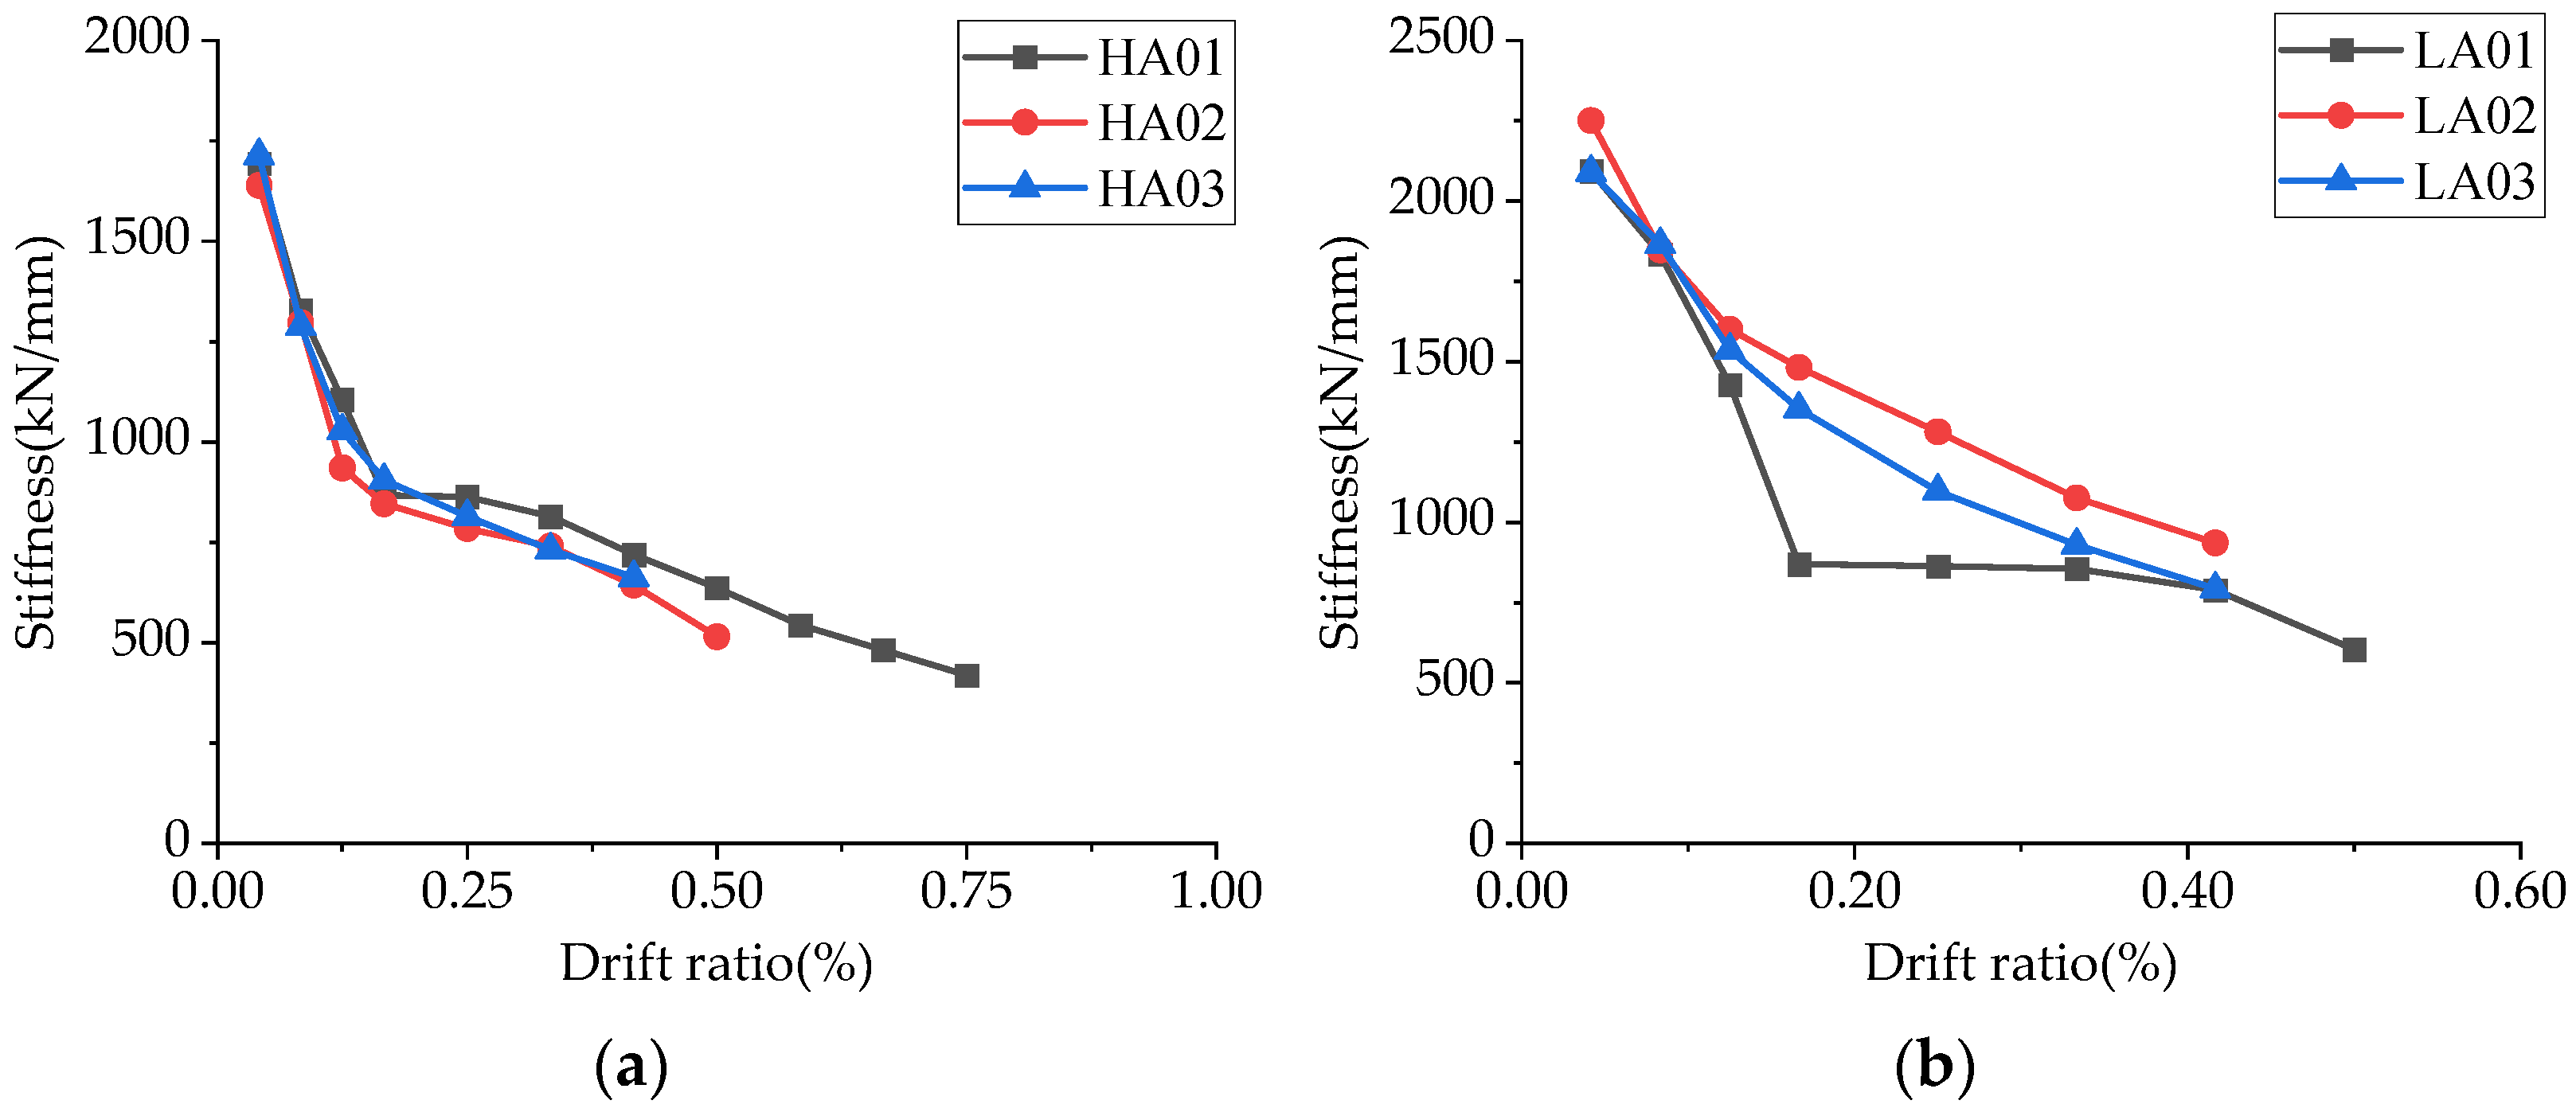
4.5. Stiffness Degeneration

To analyze the stiffness degradation in the squat shear wall specimens, the secant rigidity of specimens was assessed. The secant stiffness is the slope generated by the line between the origin and a point on the skeleton curve. The calculation formula for secant stiffness can be expressed as
K i = + P i + P i + i + i
where Ki is the secant stiffness during the first cyclic loading; +Pi and −Pi are the peak loads in the positive and negative directions during the i-th loading cyclic; and +∆i and −∆i are the displacements corresponding to the peak loads in the positive and negative directions during the i-th loading cycle. The stiffness degradation of each specimen, calculated according to Equation (2), is shown in Figure 17.
Figure 17. Comparison of stiffness degradation of the specimens: (a) H specimens; (b) L specimens.
Figure 17 shows that the squat shear wall specimens exhibited significant stiffness degradation under quasi-static loading, with the stiffness decreasing progressively under increasing displacement. During initial loading, the specimens were in the elastic stage, and stiffness degradation was minimal. After cracking, the degradation rate accelerated. After yielding, the rate decelerated, as evidenced by the decreasing slope of the stiffness degradation curve. The axial load ratio is positively correlated with stiffness.

4.6. Crack Width

During the test, cracks were directly observed, and their development under each displacement-controlled loading level was recorded from the cracking stage. The crack widths for the specimens are listed in Table 5.
Table 5. Maximum crack width at each loading level.
The results in Table 5 indicate that a higher axial load ratio delays the appearance of cracks, limits crack development, and reduces the crack width before failure. This highlights the significant influence of axial load ratio on cracking. The crack width in the six squat shear walls before failure was approximately 0.6 mm—notably smaller than that of conventional shear walls, indicating lower energy dissipation capacity. Thus, the axial load ratio plays a crucial role in determining the energy dissipation capacity of shear walls.

4.7. Size Effect Analysis

The results of this study were compared with those of some recently published studies involving small-scale squat shear wall specimens (Table 6).
Table 6. Parameters of the test specimens.
LiteratureSpecimenHeight
H (mm)
Width
L (mm)
Thickness
B (mm)
ALRθcrθyμEv
(J/m3)
Wei. et al. []W150010001500.30.10%-3.40260
W250010001500.30.06%--42
W550010001500.50.11%-3.66213
W650010001500.50.07%---
W950010001500.30.05%-3.07140
W1050010001500.30.05%-3.24287
W1250010001500.50.13%-3.41512
W1450010001500.50.22%-3.52975
Gao. et al. []RCW1-03A100013001500.3-0.62%3.24-
RCW2-05A100013001500.5-0.38%2.91-
RCW3-03S100013001500.3-0.50%2.87-
RCW4-05S100013001500.5-0.39%2.90-
Miao et al. []0.25%-S60060080-0.16%0.81%2.12-
0.50%-S60060080-0.21%1.16%2.28-
0.25%-M12001200160-0.12%1.06%1.95-
0.50%-M12001200160-0.16%1.27%2.13-
0.25%-L18001800240-0.07%0.93%1.71-
0.50%-L18001800240-0.08%1.14%1.78-
This paperHA01120030001850.10.04%0.42%2.05254
HA02120030001850.20.07%0.38%1.72160
HA03120030001850.30.08%0.34%1.59153
LA0190030001850.10.03%0.36%1.88165
LA0290030001850.20.03%0.24%1.8171
LA0390030001850.30.07%0.32%1.76112
Note: ALR is the axial load ratio; θcr = Δcr/H; θy = Δy/H; μ = Δyu.
Table 6 shows that the scale ratios of the specimens in the three comparative studies increased progressively, with the specimen scale ratio in this study being the largest. The average crack displacement ratio, ductility coefficient, and energy dissipation per unit volume in the study of Wei et al. were 85%, 87%, and 127% higher than those observed in this study, respectively. In Gao et al.’s experiments, the average yield displacement ratio and ductility coefficient were 38% and 65% greater than those of the specimens in this study, respectively. Similarly, the crack displacement ratio, yield displacement ratio, and ductility coefficient reported by Miao et al. were 150%, 209%, and 11% higher than those obtained in this study, respectively. Under comparable loading conditions, the ductility and energy dissipation capacity of the specimens in the aforementioned studies were significantly superior to those in this study, which supports Jin’s conclusion [] that the reduced deformation capacity observed in larger-scale specimens better reflects actual engineering behaviors. Consequently, the findings of this study provide a more realistic representation of practical engineering scenarios compared with results derived from small-scale specimens, thus offering greater reference value for subsequent theoretical investigations.

5. Numerical Simulation and Parameter Analysis

5.1. Finite Element Model

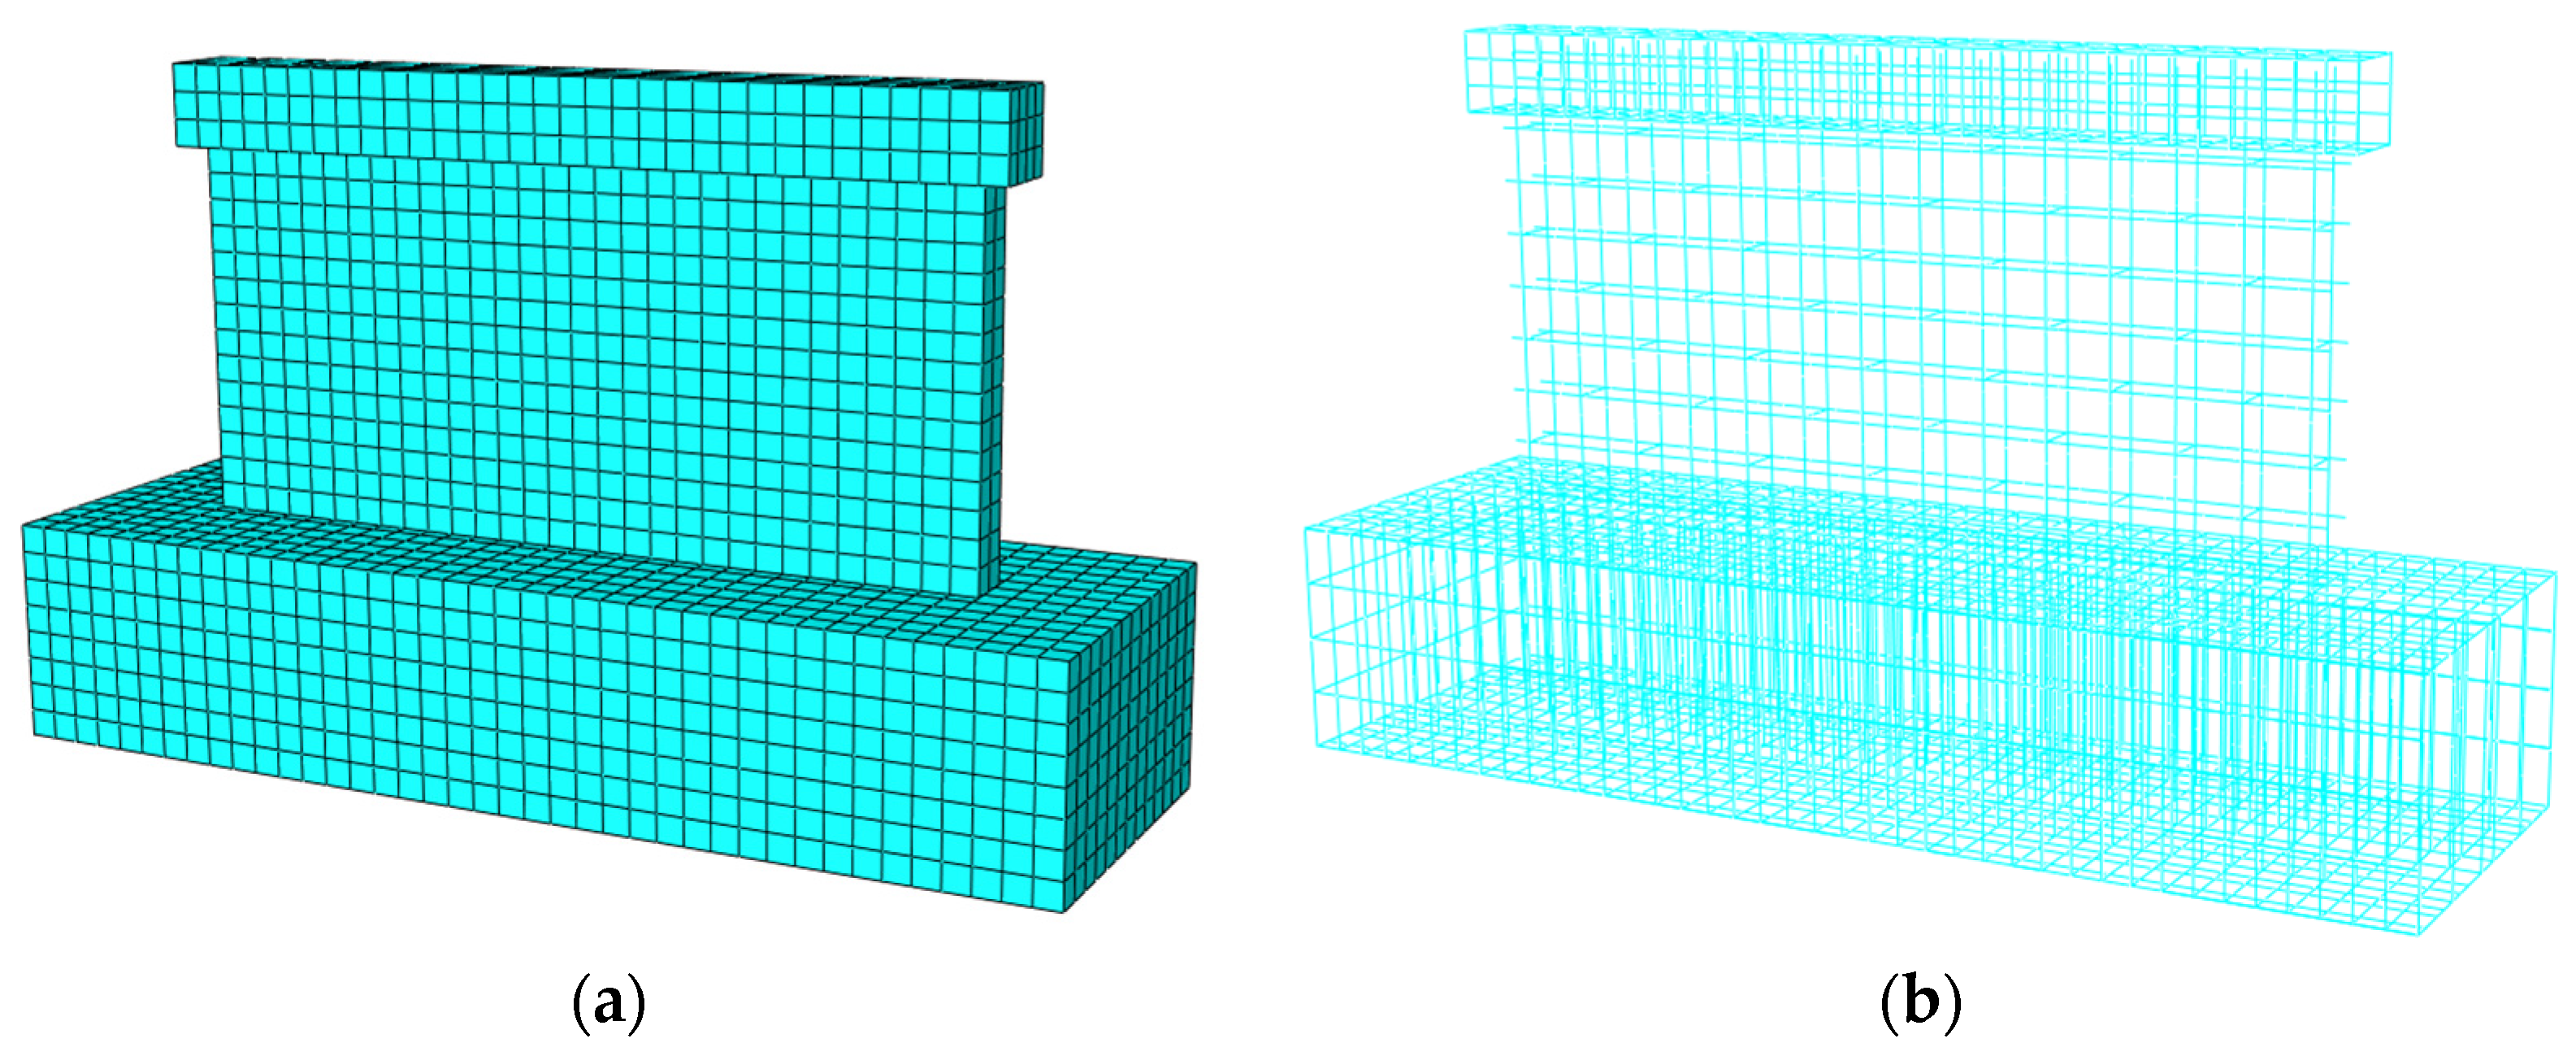
The ABAQUS (6.14) software was used to conduct numerical simulations of the mechanical behaviors of double-sided composite shear wall specimens. Concrete and steel bars were modeled separately, with bond-slip between them neglected; the steel bars were embedded in concrete. Figure 18 shows the finite element model. A rigid pad was added at the loading point to prevent stress concentration and excessive deformation. The ground beam and ground were set as fixed constraints, and displacement loading was applied at the loading point.
Figure 18. The mesh division of the model: (a) mesh division of concrete; (b) mesh division of steels.
C3D8R solid elements were used for concrete and rigid pads, while T3D2 truss elements were used for the reinforcement. The reinforcement followed a bilinear elastic–plastic model with a slope of 0.01Es (where Es is the elastic modulus of steel). The yield strength, tensile strength, and elastic modulus of reinforcement were taken as measured values, with the von Mises yield criterion and a Poisson’s ratio of 0.3. Concrete was modeled using the damage plasticity model in ABAQUS, with mechanical properties based on measured values.

5.2. Analysis of the Results of Finite Element Simulation

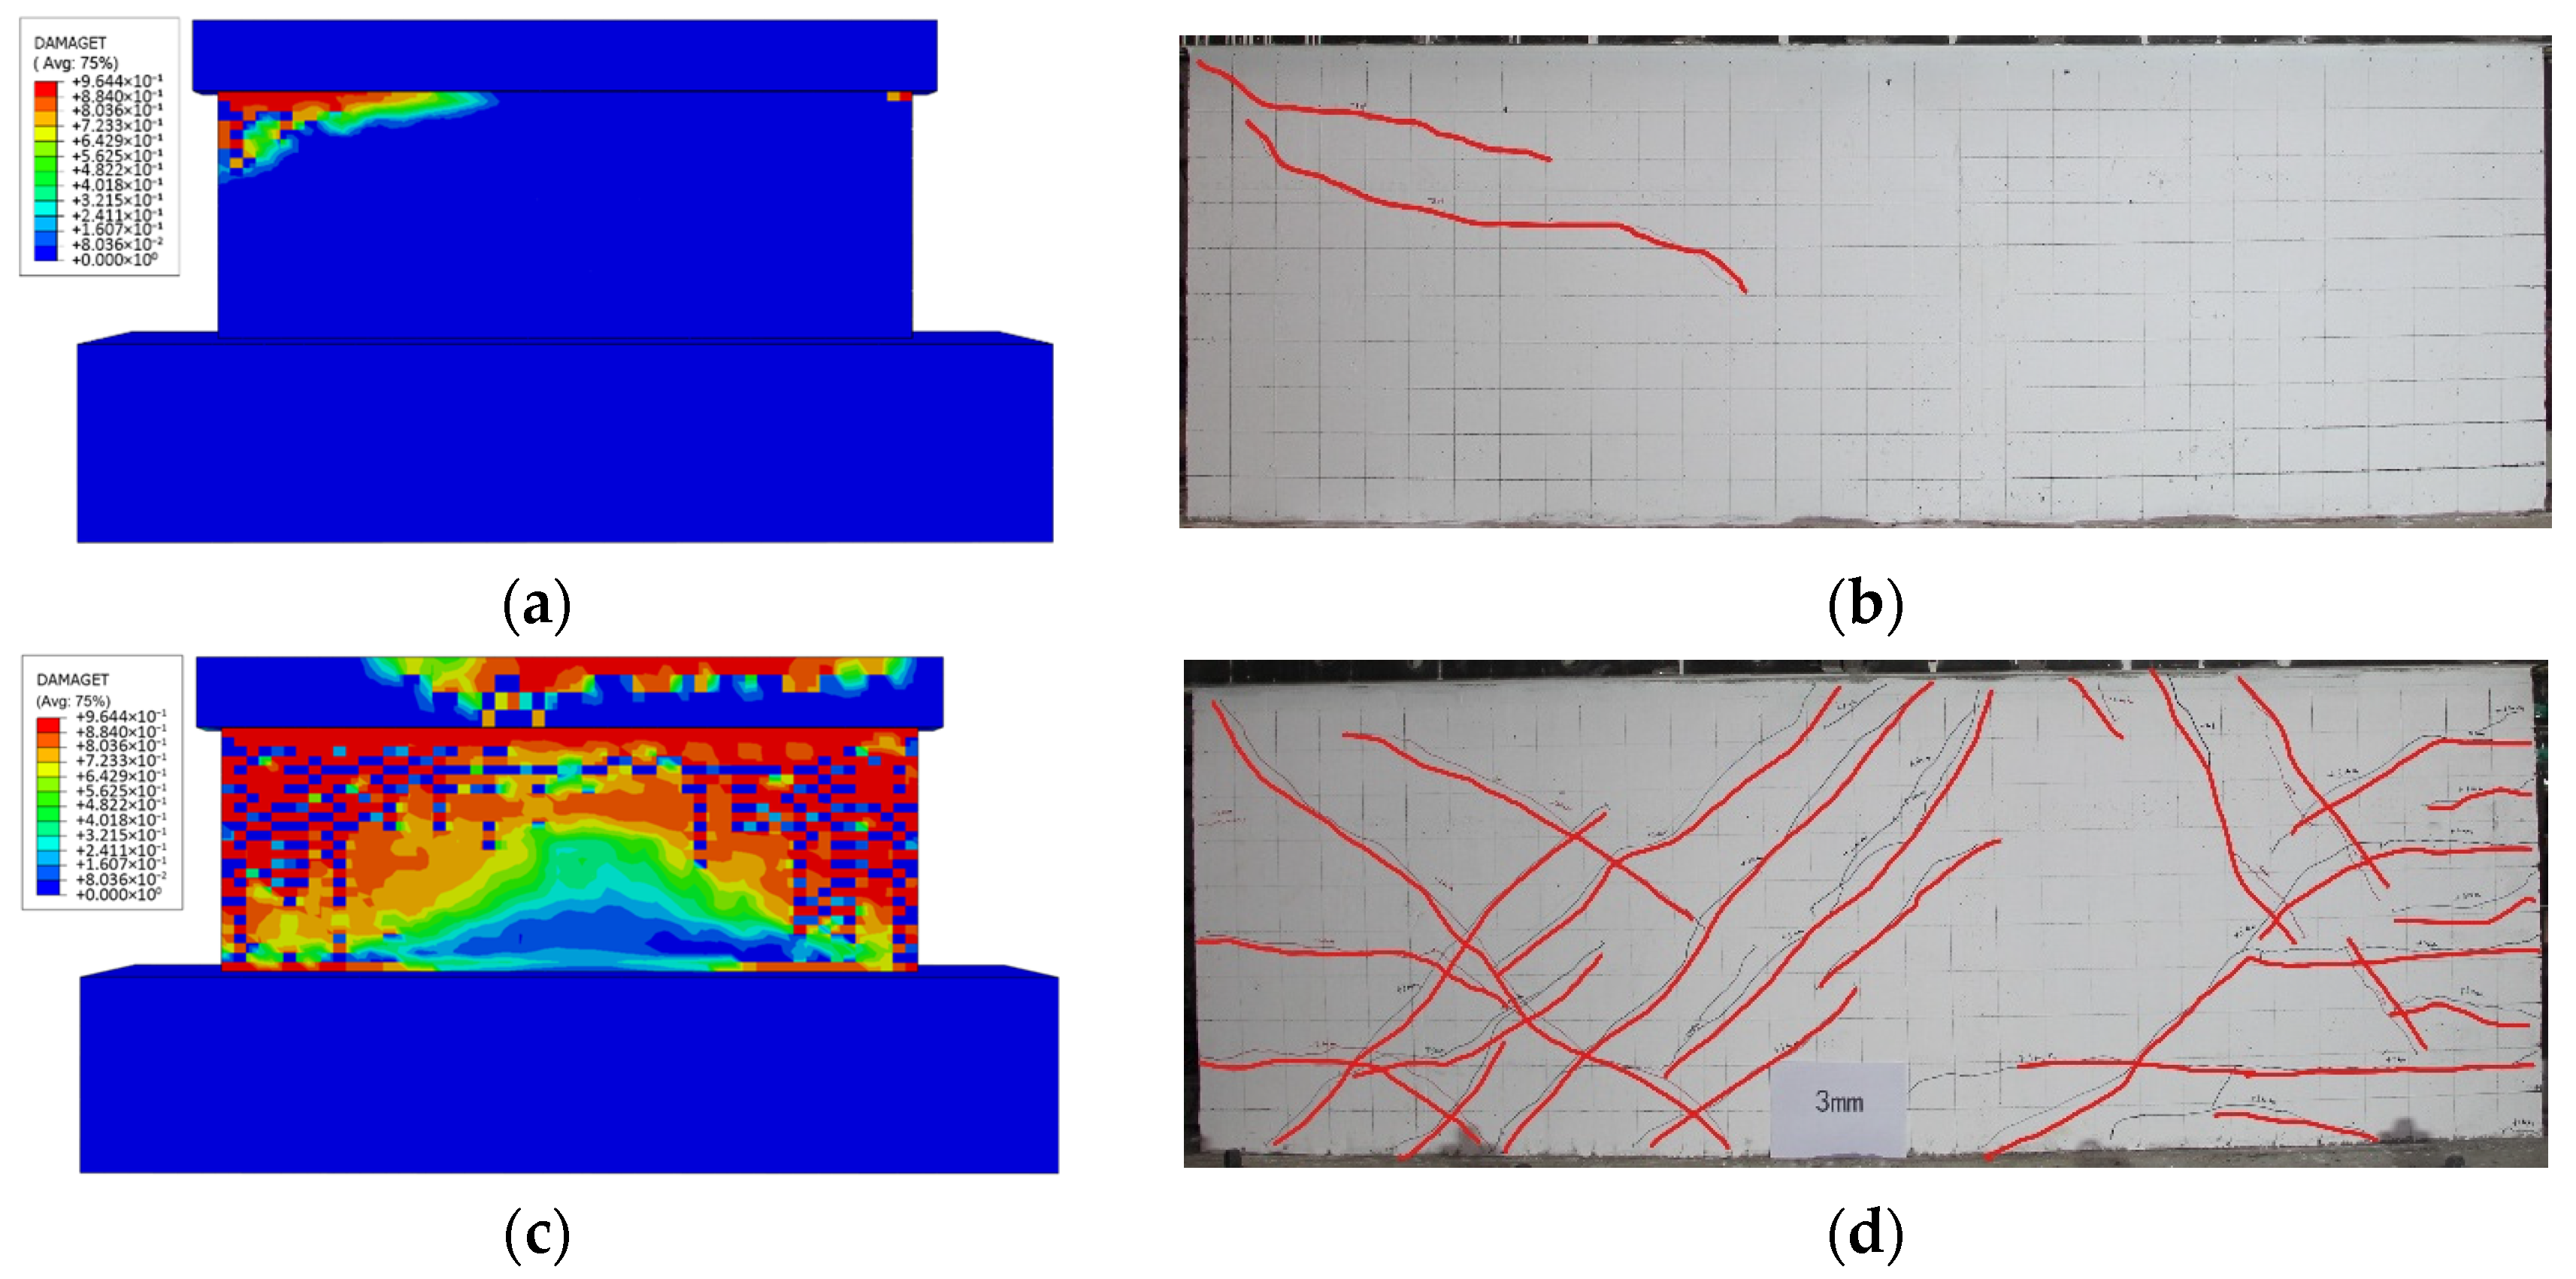
Taking specimen HA01 as an example, the crack propagation in the finite element model was compared with experimental observations (Figure 19).
Figure 19. Finite element simulation contour plot and comparison of HA01 specimen: (a) tensile damage at the cracking moment; (b) initial cracks in squat shear wall; (c) tensile damage at the drift ratio of 0.25% (3 mm); (d) crack distribution at the drift ratio of 0.25% (3 mm); (e) compressive damage at the limit state; (f) stress in the reinforcement at the ultimate state.
It can be observed from the above figure that the initial crack position and crack distribution at the drift ratio of 0.25% (3 mm) were consistent with the tensile damage distribution in the finite element model. The compressive damage in the model was concentrated at the end in the ultimate state, matching the concrete’s compressive failure observed in the test. The stress distribution in the steel bars aligns with the main crack trend (extending from upper right to lower left). Thus, the finite element model accurately simulates the behavior of squat shear walls under in-plane reciprocating loads.
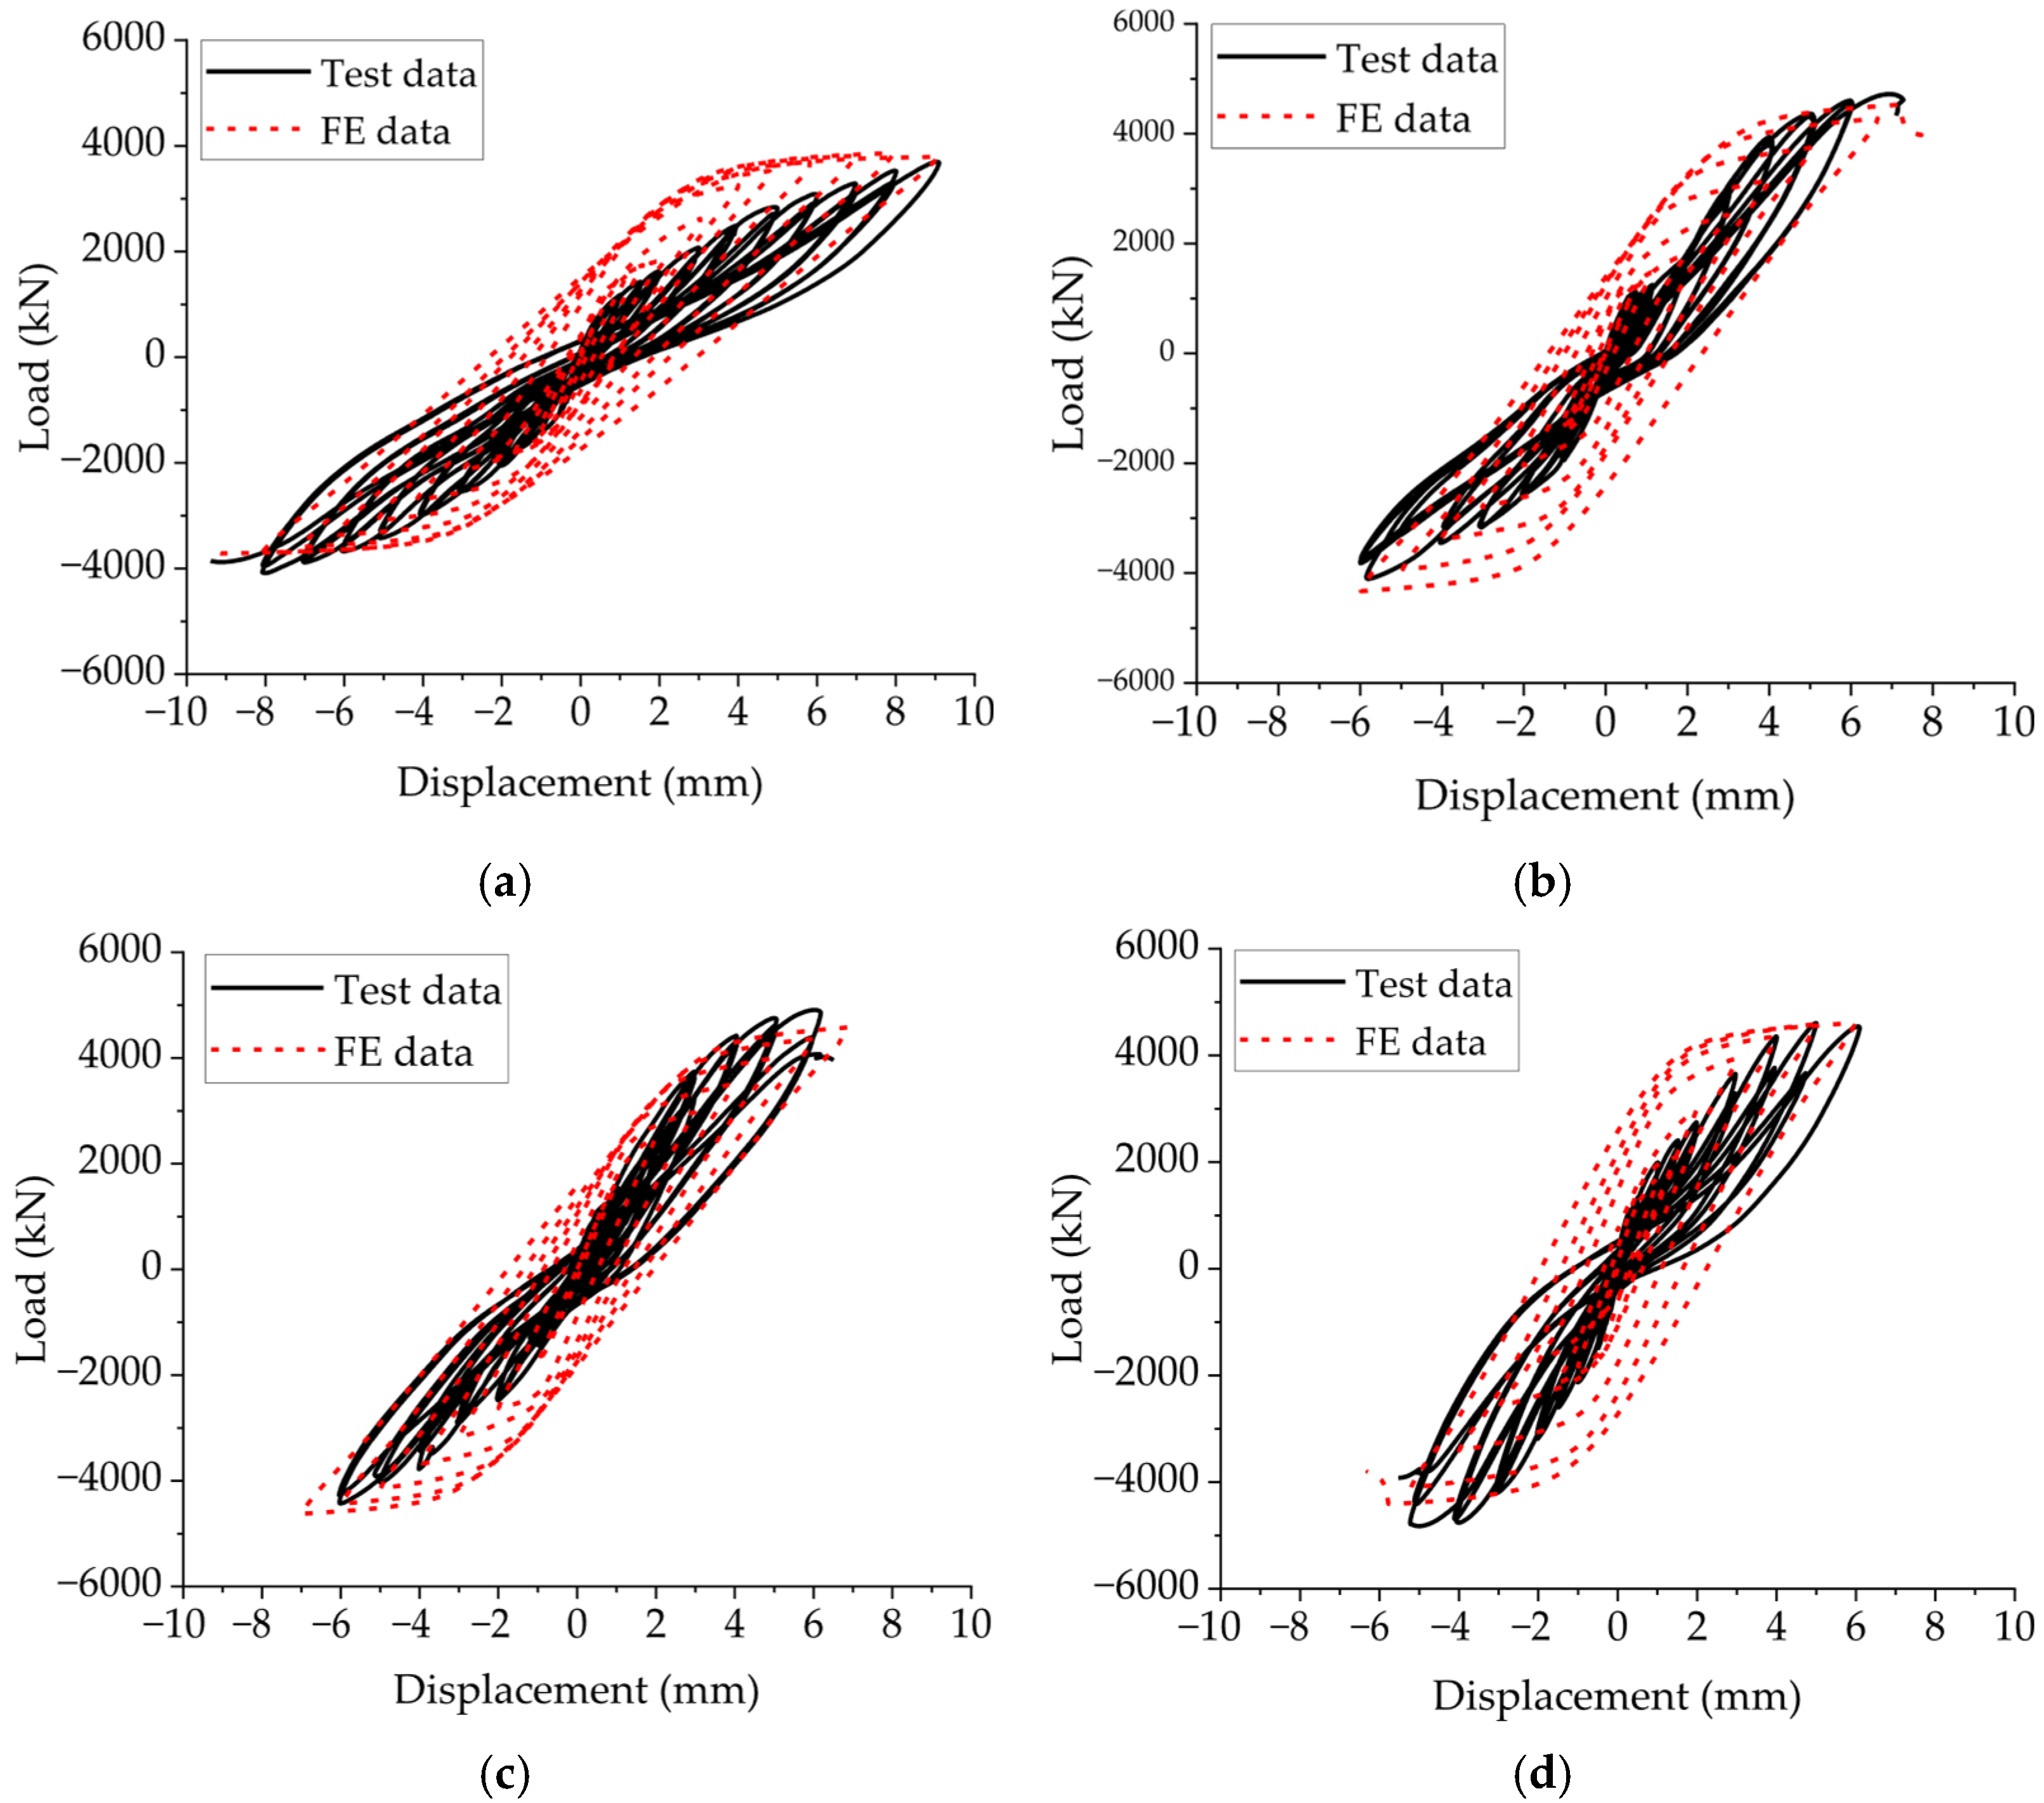
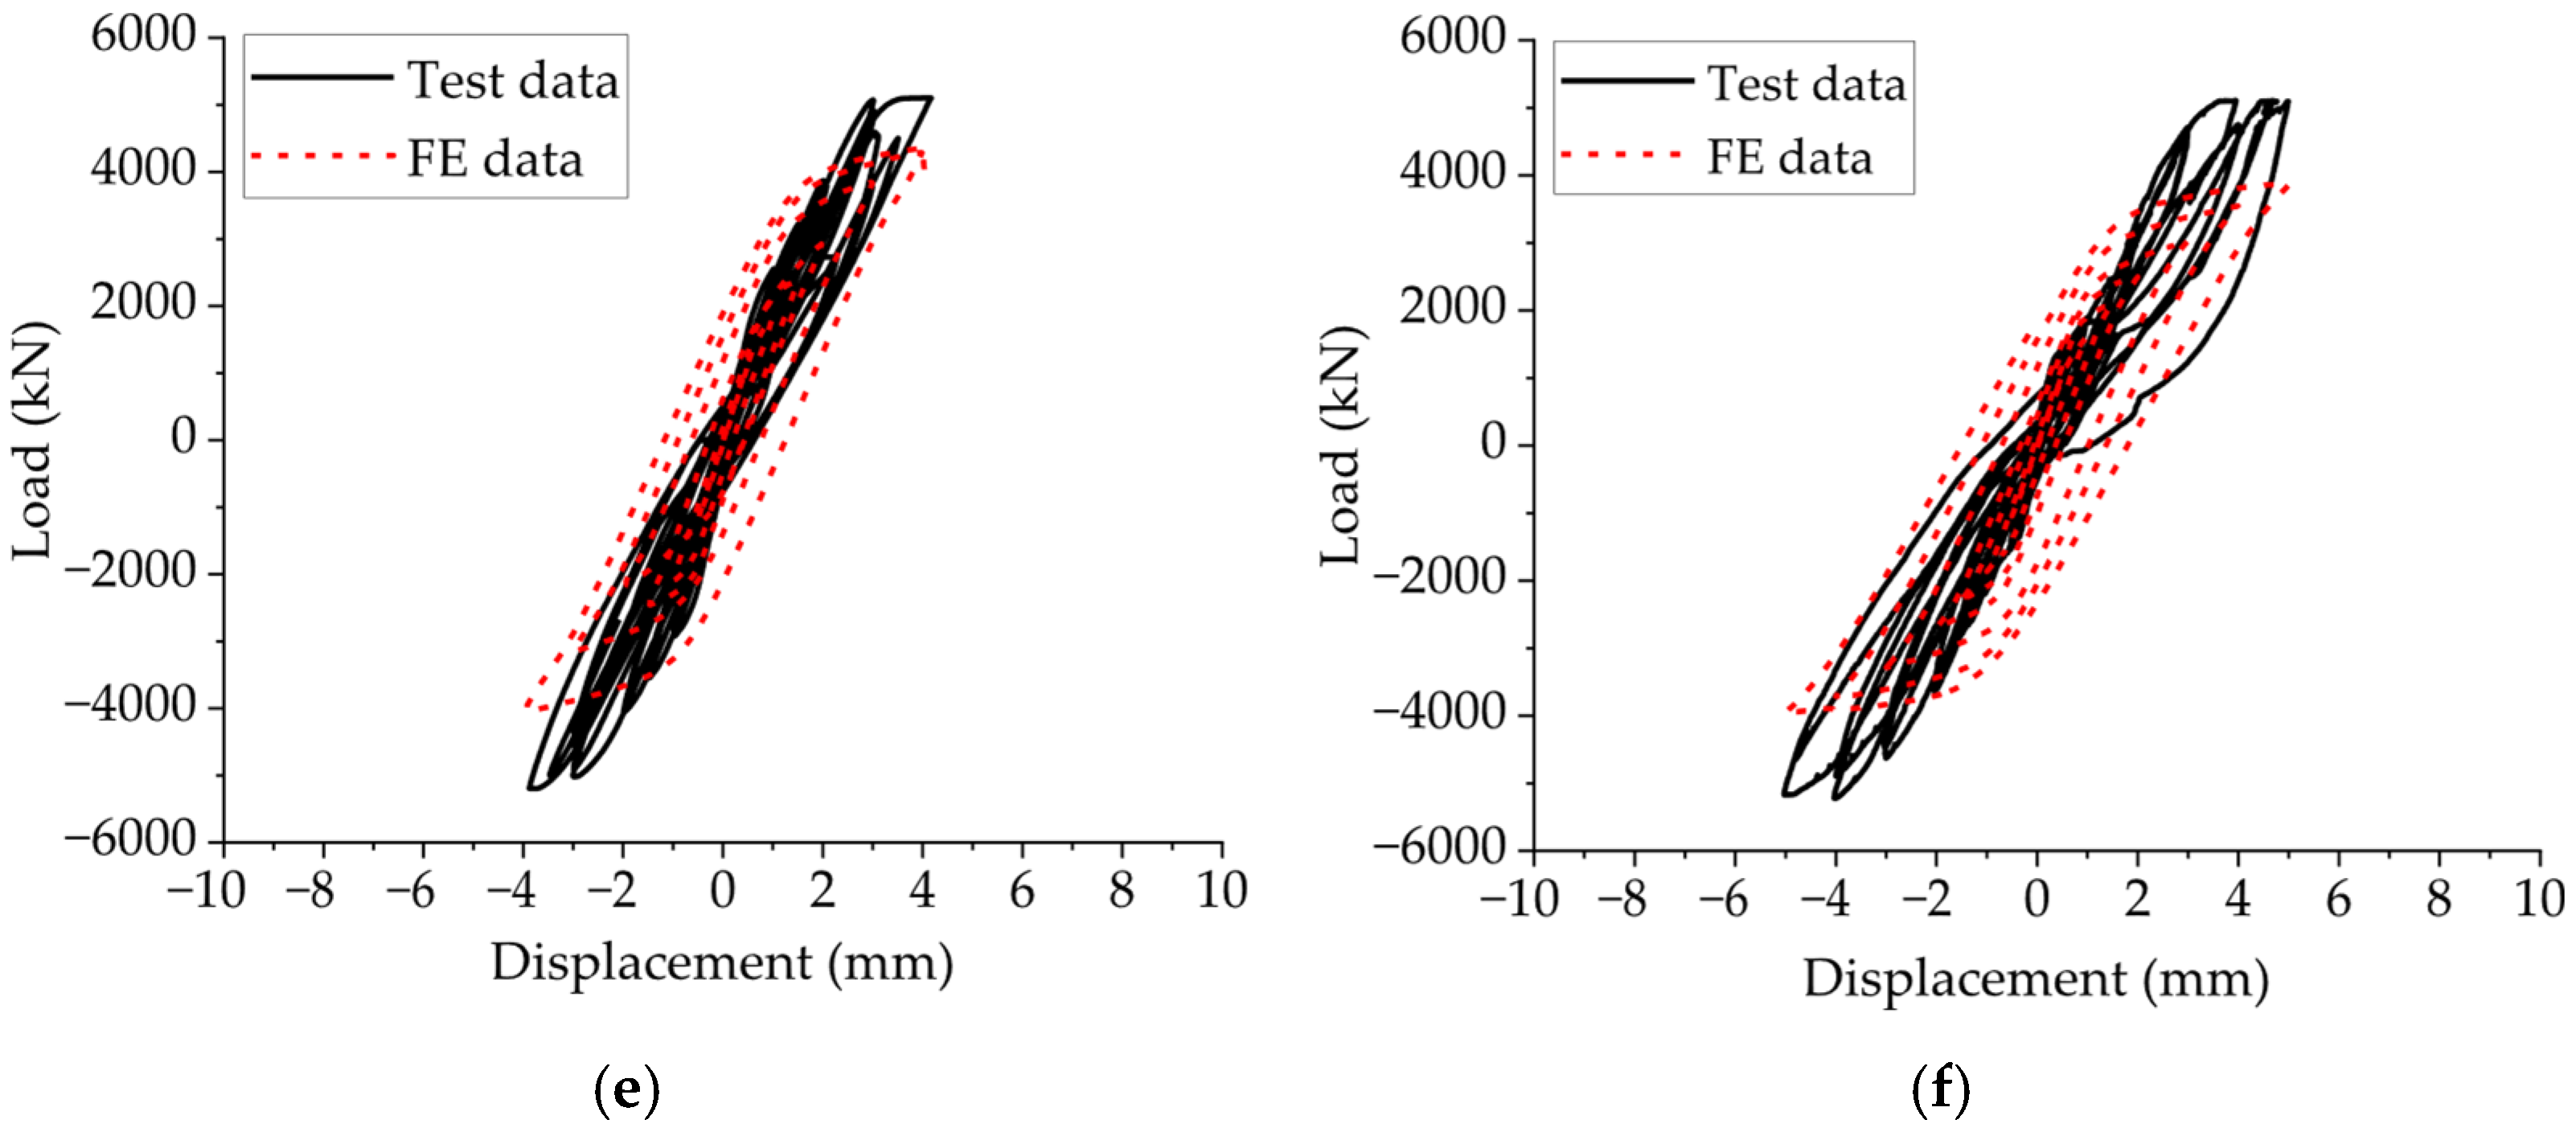
A comparison of the load–displacement curves obtained from the finite element simulation of the specimens and the test curves is shown in Figure 20, while the comparison of characteristic parameters between experimental and finite element simulation results is presented in Table 6.
Figure 20. Comparison of the load–displacement curves. (a) HA01; (b) HA02; (c) HA03; (d) LA01; (e) LA02; (f) LA03.
Figure 20 shows that the hysteretic curves obtained from the finite element simulation closely matched the experimental hysteretic curves with a high degree of consistency. Table 7 shows that the ductility coefficient errors between the finite element simulation data and the experimental data for each specimen were relatively small. The load errors for all specimens (except LA03) were relatively small, and the errors decreased with a reduction in the axial load ratio. This indicates that the finite element model used in this study can simulate the loading process of the squat shear wall well. Thus, the next step of finite element parametric analysis can be carried out on this basis, with its credibility increasing as the axial load ratio decreases. Overall, while the finite element model used in this paper can effectively simulate the loading process of squat shear walls, it is more accurate and has a higher degree confidence when modeling squat shear walls with an axial load ratio less than 0.2.
Table 7. Comparison between test and finite element simulation result.

5.3. Analysis of Parameters

5.3.1. The Shear–Span Ratio

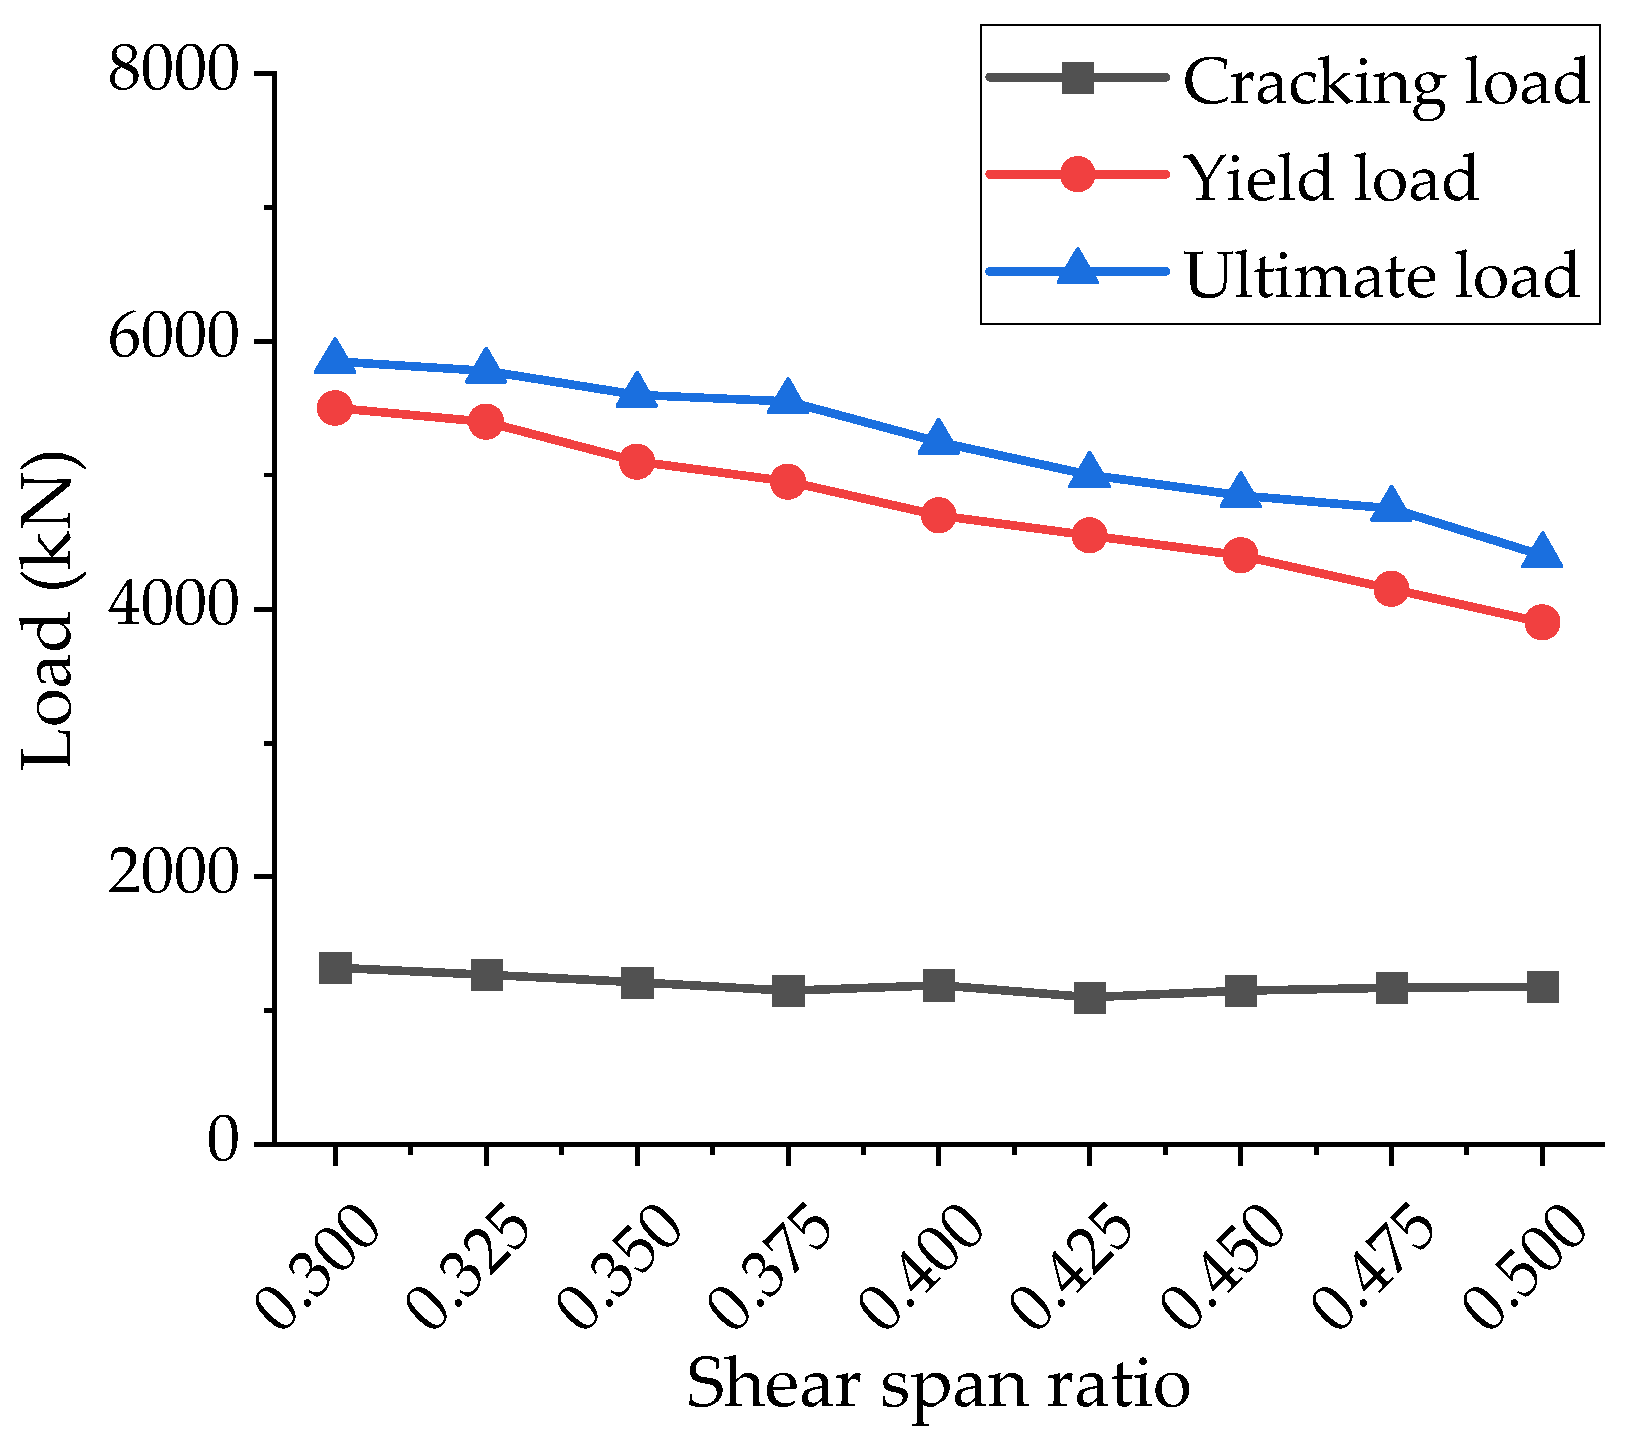
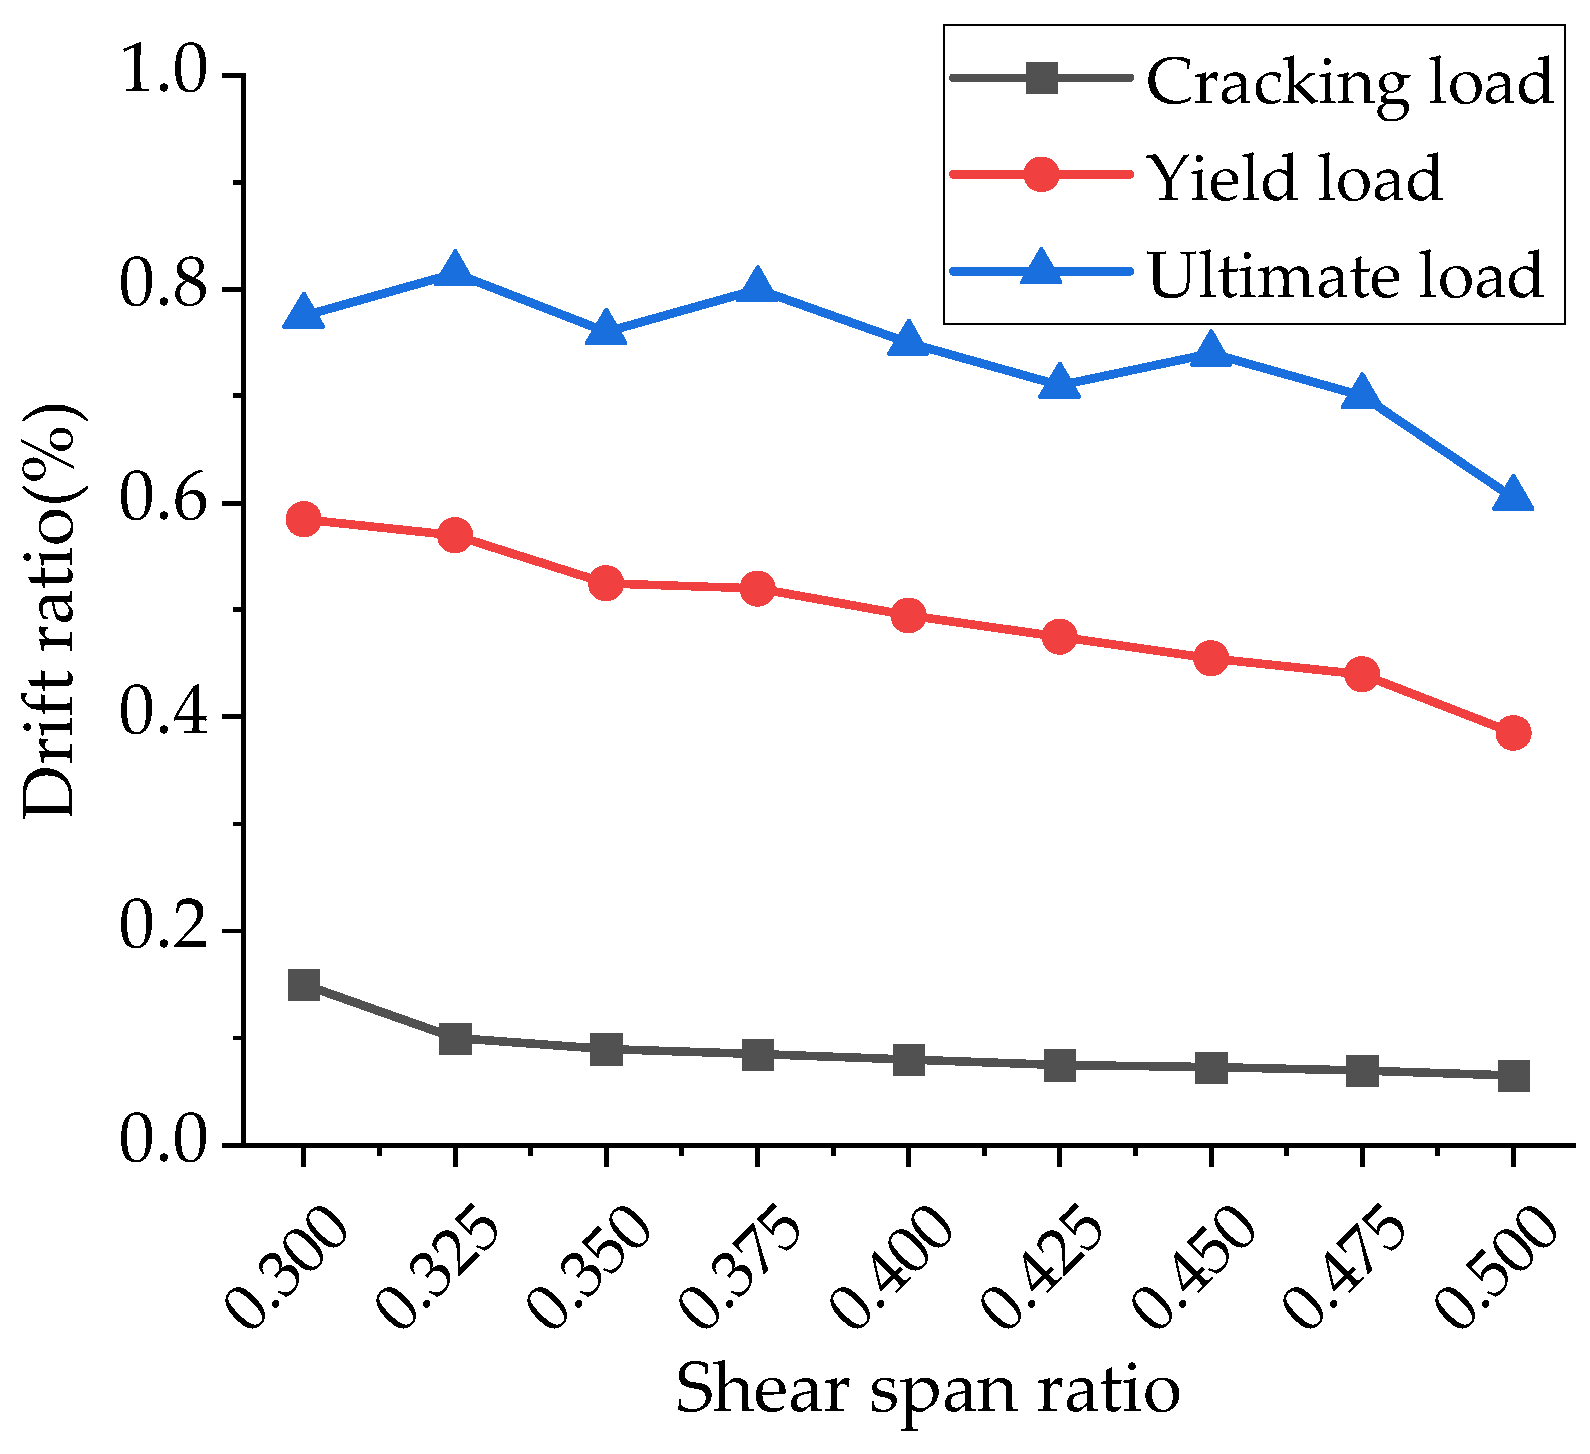
In this section, based on the finite element model of the specimen with an axial load ratio of 0.2, nine finite element models of shear wall with different shear–span ratios were established to analyze the influence of the shear–span ratio on the load and drift angle of the walls (Figure 21 and Figure 22).
Figure 21. The influence of the shear-span ratio on the failure load.
Figure 22. The influence of the shear-span ratio on the drift ratio at the failure load.
It can be seen from Figure 21 that, as the shear–span ratio increases, the cracking load shows no significant change, while the yield and ultimate loads decrease linearly. Figure 22 indicates that the shear–span ratio has a relatively minor effect on the cracking drift ratio, whereas both the yield drift ratio and the ultimate drift ratio decrease with increasing shear–span ratio.

5.3.2. The Reinforcement Ratio

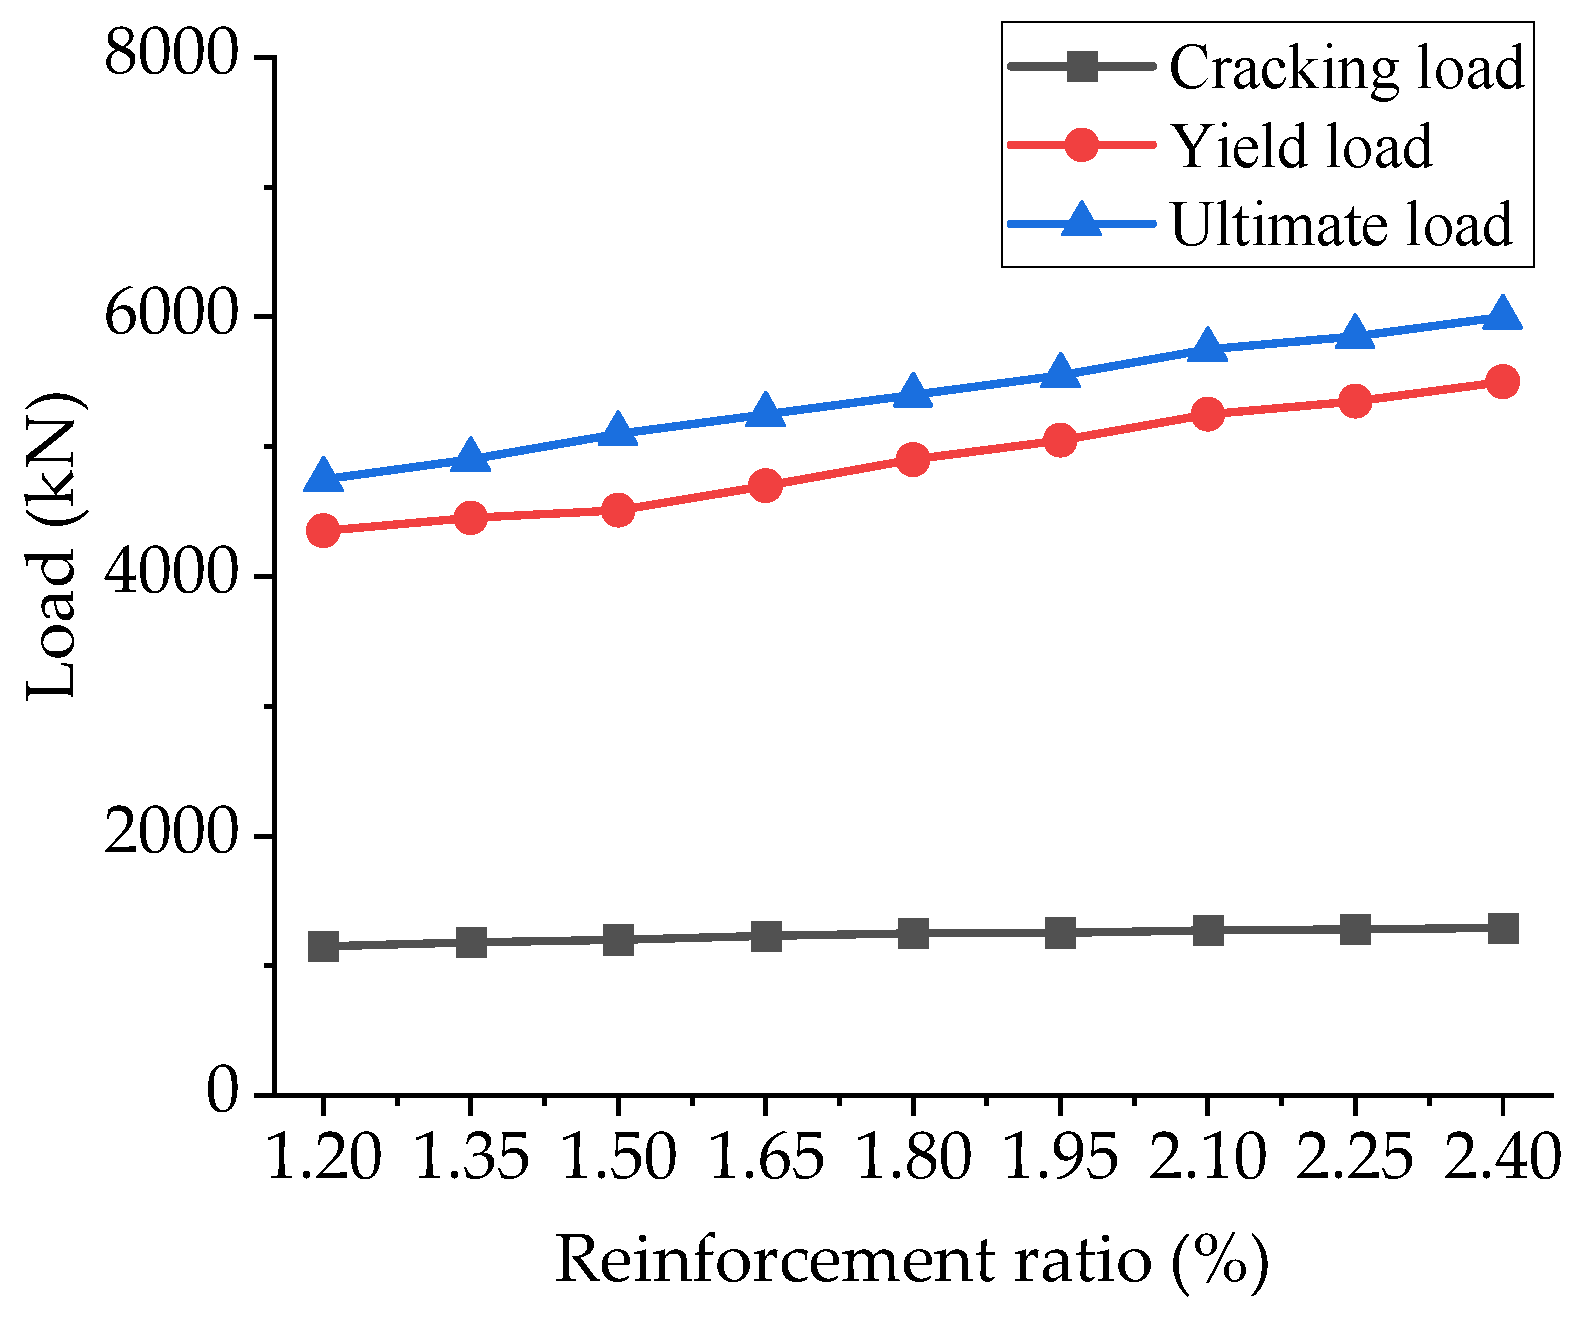
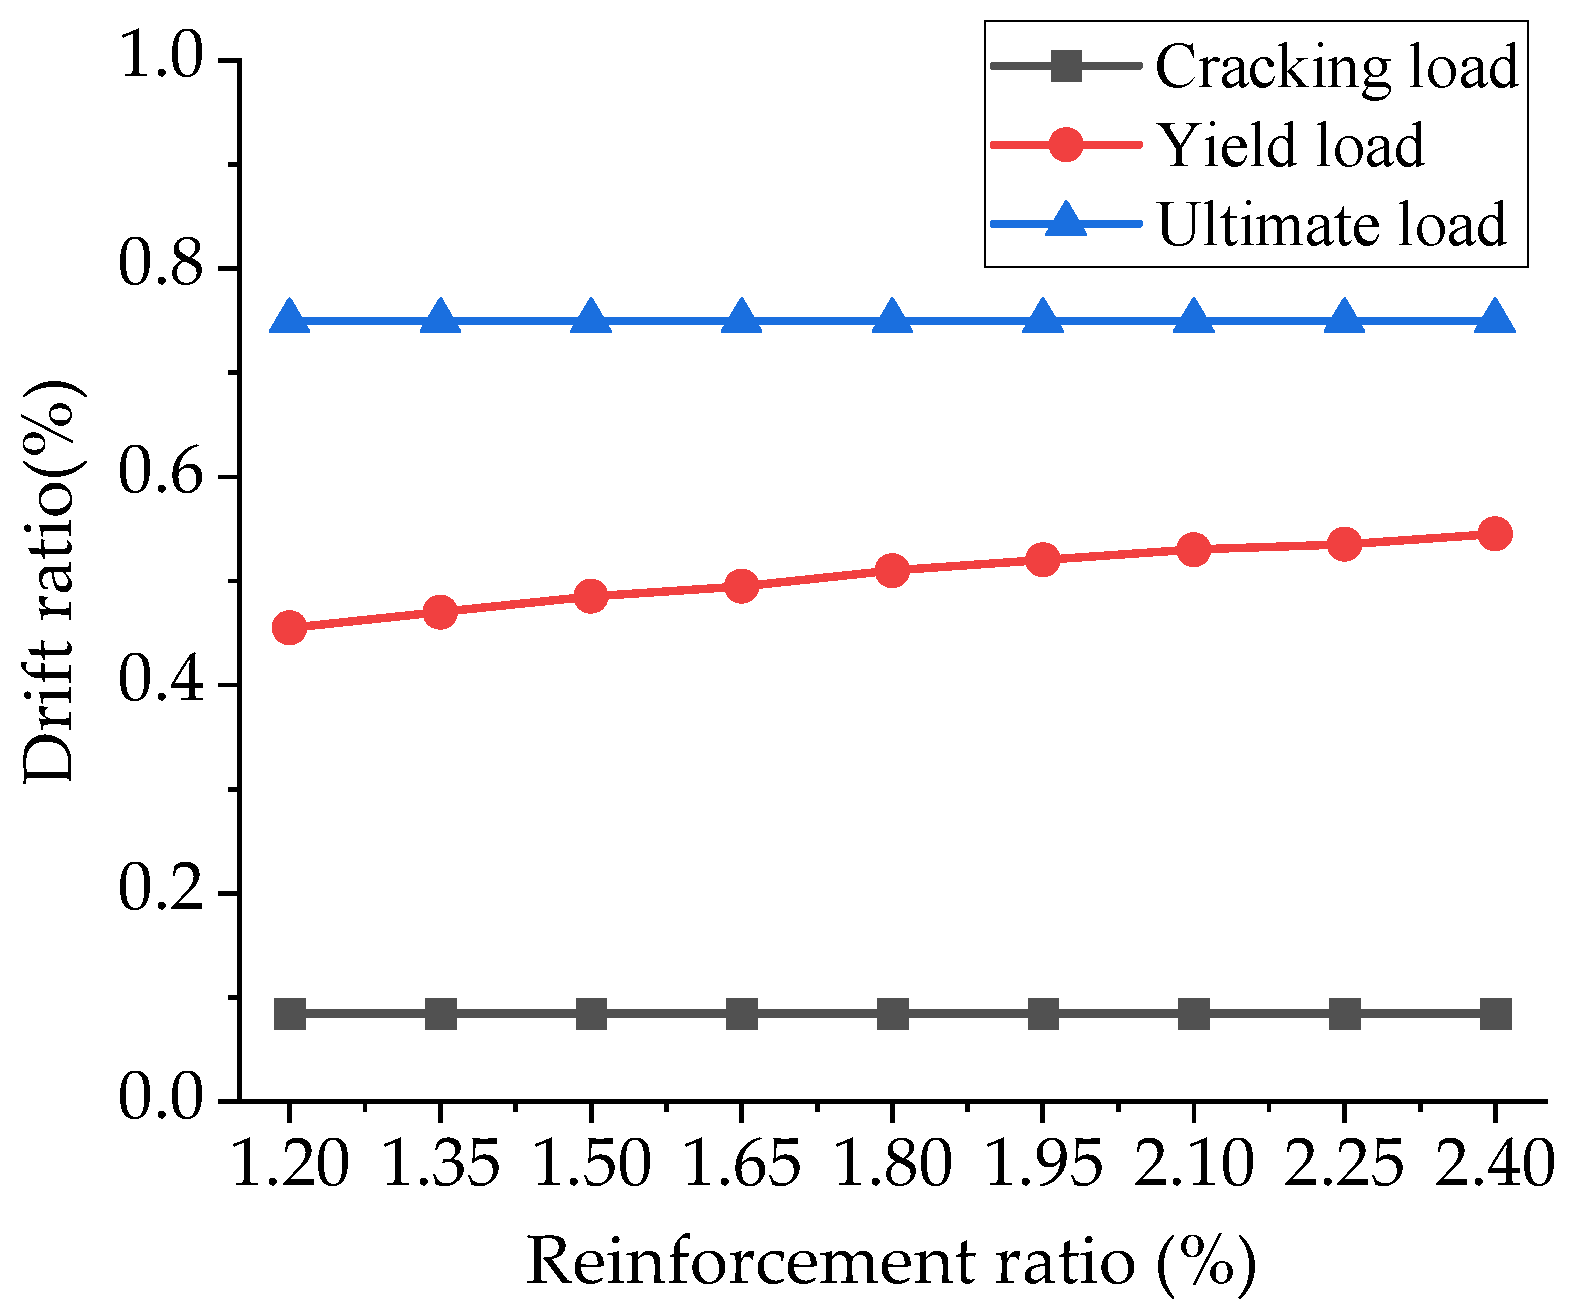
Next, the finite element model was used to establish nine finite element simulation models of shear walls with different reinforcement ratios, where the vertical and horizontal reinforcement ratios of each specimen were equal. The influence law of the shear–span ratio on the load and drift ratio of squat shear walls is shown in Figure 23 and Figure 24.
Figure 23. The influence of the reinforcement ratio on the failure load.
Figure 24. The influence of the reinforcement ratio on the drift ratio at the failure load.
Figure 23 shows that as the reinforcement ratio increases, the cracking load remains essentially unchanged, whereas both the yield load and ultimate load increase linearly at a consistent rate. Figure 24 shows that the drift ratios corresponding to the cracking load and ultimate load exhibit negligible variation, while the drift ratio at yield load increases slightly with the reinforcement ratio; however, this effect is relatively minor.

6. Conclusions

This study investigated the seismic behaviors of large-scale squat shear walls with low shear–span ratios and evaluated the effect of the axial load ratio on their performance. In particular, six squat shear wall specimens were tested under axial load ratios of 0.1, 0.2, and 0.3. The main conclusions are as follows:
  • A comparative analysis of recent studies involving squat shear walls under similar conditions demonstrated that the size significantly influences the deformation behavior and energy dissipation capacity of squat shear wall specimens. The large-scale squat shear wall specimens used in this study exhibited test outcomes that more closely reflect engineering scenarios, thereby offering greater theoretical and practical reference value.
  • The failure modes of the six squat shear wall specimens included bending-shear failure, shear slip failure, and localized failure. The specimens with lower axial load ratios exhibited bending-shear failure, while the squat shear walls characterized by higher axial load ratios and large shear–span ratios demonstrated shear slip failure. Specimens with higher axial load ratio and low shear–span ratio failed earlier than general shear walls.
  • The axial load ratio has a significant influence on the horizontal bearing capacity and seismic performance of squat shear walls. Increasing the axial load ratio can improve the horizontal bearing capacity and the stiffness of the squat shear wall, delaying its yield and cracking. The higher the axial load ratio, the higher the horizontal bearing capacity, cracking load, and yield load, and the greater its stiffness. A higher axial load ratio can delay the appearance of cracks, limit the development of cracks, and reduce the width of cracks before failure.
  • The axial load ratio also has a significant impact on the seismic performance of the squat shear wall: an increase in the axial load ratio can reduce the cracking, yield, and ultimate displacement of the squat shear wall, while also reducing its ductility and energy dissipation capacity. The higher the axial load ratio, the worse the seismic performance of the squat shear wall.
  • The load–displacement curve obtained through finite element analysis of a squat shear wall specimen model was relatively close to that of the test curve, and the failure mode was basically consistent with the test result. The parametric analysis results for the squat shear wall’s shear–span ratio and reinforcement ratio on the load and drift ratio can be considered as an effective supplement to experimental test results.
  • Although extensive research has been conducted on squat shear walls, there are still some areas that require further study. To avoid the influence of size effects, it is crucial to use large-scale specimens to test and study the impact of the shear–span and reinforcement ratios on the seismic performance of squat shear walls. A more accurate force analysis model should be developed to effectively predict the force performance of squat shear walls and provide references for the design and wider application of squat shear walls. Numerical simulations may be further improved using machine learning and neural network technologies, thus providing more accurate predictions. However, it should be noted that such models will need to be verified based on extensive experimental data to ensure their reliability and applicability.

Author Contributions

Conceptualization, W.Z. and C.Z.; methodology, W.Z.; software, H.C.; experiment, H.C.; investigation, Z.B.; data curation, H.C.; writing—original draft preparation, H.C.; writing—review and editing, H.C.; supervision, D.W. project administration, W.Z.; funding acquisition, C.Z. All authors have read and agreed to the published version of the manuscript.

Funding

This research was funded by National Natural Science Foundation of China (NSFC), grant number 52178126.

Data Availability Statement

The original contributions presented in this study are included in the article. Further inquiries can be directed to the corresponding authors.

Acknowledgments

During the preparation of this study, the authors used [ABAQUS 6.14] for the purposes of [finite element simulation]. The authors have reviewed and edited the output and take full responsibility for the content of this publication.

Conflicts of Interest

Author Dongmei Wang was employed by the company China Nuclear Power Engineering Co., Ltd. The remaining authors declare that the research was conducted in the absence of any commercial or financial relationships that could be construed as a potential conflict of interest.

References

  1. Habib, A.; Al-Sadoon, Z.A.; Saatcioglu, M.; al Houri, A.; Maalej, M.; Al-Toubat, S.; Shrif, M. Seismic Behavior of Squat Reinforced Concrete Shear Walls: A State-of-the-Art Review. Struct. Durab. Health Monit. 2025, 19, 417–439. [Google Scholar] [CrossRef]
  2. Xu, G.; Zheng, L.; Zhou, W.; Zhai, C.; Wang, D. Quasi-static tests of squat reinforced concrete shear walls with openings. Eng. Struct. 2023, 293, 116666. [Google Scholar] [CrossRef]
  3. Jafari, A.; Beheshti, M.; Shahmansouri, A.A.; Bengar, H.A. Plastic hinge length for coupled and hybrid-coupled shear walls. Steel Compos. Struct. 2023, 48, 367–383. [Google Scholar] [CrossRef]
  4. Jafari, A.; Beheshti, M.; Shahmansouri, A.A.; Bengar, H.A. Cyclic response and damage status of coupled and hybrid-coupled shear walls. Structures 2024, 61, 106010. [Google Scholar] [CrossRef]
  5. Wei, F.; Chen, H.; Xie, Y. Experimental study on seismic behavior of reinforced concrete shear walls with low shear span ratio. J. Build. Eng. 2021, 45, 103602. [Google Scholar] [CrossRef]
  6. Benjamin, J.R.; Williams, H.A. The Behavior of One-Story Reinforced Concrete Shear Walls. J. Struct. Div. 1957, 83, 1254. [Google Scholar] [CrossRef]
  7. Ganesan, N.; Indira, P.v.; Seena, P. Reverse Cyclic Tests on High Performance Cement Concrete Shear Walls with Barbells. In Advances in Structural Engineering; Springer: New Delhi, India, 2015; pp. 2309–2321. [Google Scholar] [CrossRef]
  8. Baek, J.-W.; Park, H.-G.; Shin, H.-M.; Yim, S.-J. Cyclic Loading Tests for Reinforced Concrete Walls (Aspect Ratio 2.0) with Grade 550 MPa (80 ksi) Shear Reinforcing Bars. ACI Struct. J. 2017, 114, 673. [Google Scholar] [CrossRef]
  9. Barda, F. Shear Strength of Low-Rise Walls with Boundary Elements; Lehigh University: Bethlehem, PA, USA, 1972. [Google Scholar]
  10. Terzioglu, T.; Orakcal, K.; Massone, L.M. Cyclic lateral load behavior of squat reinforced concrete walls. Eng. Struct. 2018, 160, 147–160. [Google Scholar] [CrossRef]
  11. Baek, J.W.; Park, H.G.; Lee, B.S.; Shin, H.M. Shear-Friction Strength of Low-Rise Walls with 550 MPa (80 ksi) Reinforcing Bars under Cyclic Loading. ACI Struct. J. 2018, 115. [Google Scholar] [CrossRef]
  12. Zhang, N.; Wu, Y.; Gu, Q.; Huang, S.; Sun, B.; Du, R.; Chang, R. Refined three-dimensional simulation of ribbed bar pull-out tests based on an enhanced peridynamic model. Eng. Struct. 2023, 278, 115519. [Google Scholar] [CrossRef]
  13. Looi, D.T.W.; Su, R.K.L.; Cheng, B.; Tsang, H.H. Effects of axial load on seismic performance of reinforced concrete walls with short shear span. Eng. Struct. 2017, 151, 312–326. [Google Scholar] [CrossRef]
  14. Zhang, J.-W.; Zheng, W.-B.; Cao, W.-L.; Dong, H.-Y.; Li, W.-D. Seismic Behavior of Low-rise Concrete Shear Wall with Single Layer of Web Reinforcement and Inclined Rebars: Restoring Force Model. KSCE J. Civ. Eng. 2019, 23, 1302–1319. [Google Scholar] [CrossRef]
  15. Hung, C.-C.; Hsieh, P.-L. Comparative study on shear failure behavior of squat high-strength steel reinforced concrete shear walls with various high-strength concrete materials. Structures 2020, 23, 56–68. [Google Scholar] [CrossRef]
  16. Robazza, B.R.; Brzev, S.; Yang, T.Y.; Elwood, K.J.; Anderson, D.L.; McEwen, B. Seismic behaviour and design code provisions for predicting the capacity of ductile slender reinforced masonry shear walls. Eng. Struct. 2020, 222, 110992. [Google Scholar] [CrossRef]
  17. Ye, B.; Pan, P.; Xiao, G.; Han, J.; Zhang, Y. Comparative study of reinforced-engineered cementitious composites and reinforced-concrete slab–column connections under a vertical monotonic load. Eng. Struct. 2021, 244, 112740. [Google Scholar] [CrossRef]
  18. Li, Y.Y.; Ding, R.; Nie, J.-G. Experiment study on seismic behavior of squat UHPC shear walls subjected to tension-shear combined cyclic load. Eng. Struct. 2023, 280, 115700. [Google Scholar] [CrossRef]
  19. FEMA356; Prestandard and Commentary for the Seismic Rehabilitation of Buildings. Federal Emergency Management Agency: Washington, DC, USA, 2000.
  20. ACI Committee 318; Building Code Requirements for Structural Concrete (ACI 318-14) and Commentary. American Concrete Institute: Farmington Hills, MI, USA, 2014.
  21. Li, B.; Qian, K.; Wu, H. Flange effects on seismic performance of reinforced concrete squat walls with irregular or regular openings. Eng. Struct. 2015, 110, 127–144. [Google Scholar] [CrossRef]
  22. John, S.K.; Cascardi, A.; Verre, S.; Nadir, Y. RC-columns subjected to lateral cyclic force with different FRCM-strengthening schemes: Experimental and numerical investigation. Bull. Earthq. Eng. 2025, 23, 1561–1590. [Google Scholar] [CrossRef]
  23. FEMA273; NEHRP Guidelines for the Seismic Rehabilitation of Buildings. Federal Emergency Management Agency: Washington, DC, USA, 1997.
  24. JGJ3-2010; Technical Specification for Concrete Structures of Tall Building. China Architecture and Building Press: Beijing, China, 2010. (In Chinese)
  25. Lefas, L.D.; Kotsovos, M.K.; Ambraseys, N.N. Behavior of Reinforced Concrete Structural Walls: Strength, Deformation Characteristics, and Failure Mechanism. ACI Struct. J. 1990, 87, 23–31. [Google Scholar] [CrossRef]
  26. Feng, P.; Qiang, H.; Ye, L. Discussion and definition on yield points of materials, members and structures. Eng. Mech. 2019, 39, 143–150. [Google Scholar] [CrossRef]
  27. Rasoolinejad, M.; Bažant, Z.P. Size effect of squat shear walls extrapolated by microplane model M7. ACI Struct. J. 2019, 116, 75–84. [Google Scholar] [CrossRef]
  28. Jin, L.; Miao, L.; Chen, F.; Li, D.; Du, X. A Comparative Study on Shear Size Effect of Steel-And BFRP-RC Shear Walls Under Cyclic Lateral Loads. J. Earthq. Eng. 2024, 28, 3363–3386. [Google Scholar] [CrossRef]
  29. JGJ/T101-2015; Specification for Seismic Test of Buildings. China Architecture and Building Press: Beijing, China, 2015. (In Chinese)
  30. Gao, X.L.; Xu, Z.P.; Ren, X.D.; Li, J. Experimental analysis of RC and SPRC squat shear walls. J. Build. Eng. 2024, 93, 109861. [Google Scholar] [CrossRef]
  31. Miao, L.; Jin, L.; Chen, F.; Du, X. Experiment study on seismic performance and size effect in BFRP-RC squat shear walls with different horizontal reinforcement ratios. Eng. Struct. 2023, 295. [Google Scholar] [CrossRef]
Disclaimer/Publisher’s Note: The statements, opinions and data contained in all publications are solely those of the individual author(s) and contributor(s) and not of MDPI and/or the editor(s). MDPI and/or the editor(s) disclaim responsibility for any injury to people or property resulting from any ideas, methods, instructions or products referred to in the content.

Article Metrics

Citations

Article Access Statistics

Multiple requests from the same IP address are counted as one view.