Article

BIM-Based Life Cycle Carbon Assessment and PV Strategies for Residential Buildings in Central China

1
School of Automotive and Traffic Engineering, Hubei University of Arts and Science, Xiangyang 441053, China
2
Hubei Key Laboratory of Vehicle-Infrastructure Collaboration and Traffic Control, Xiangyang 441053, China
3
Hubei Gongjian Hanjiang Engineering Co., Ltd., Xiangyang 441021, China
*
Author to whom correspondence should be addressed.
Buildings 2025, 15(23), 4232; https://doi.org/10.3390/buildings15234232
Submission received: 22 October 2025 / Revised: 10 November 2025 / Accepted: 17 November 2025 / Published: 24 November 2025

Abstract

Aligned with China’s “Dual Carbon” goals, this study addresses carbon emissions in the building sector. Existing research predominantly focuses on single-stage carbon emission assessment or separately examines the benefits of BIM applications and photovoltaic (PV) technology. There is a notable lack of studies that deeply integrate the BIM platform with dynamic assessment of building life cycle carbon emissions and PV carbon reduction strategies, particularly under the specific context of the hot-summer/cold-winter climate in Central China and a regional grid primarily reliant on thermal power. Moreover, localized and in-depth analyses targeting residential buildings in this region remain scarce. To address this gap, this study takes a residential building in Central China as a case study and establishes a BIM-based life cycle carbon emission assessment model to systematically quantify the carbon footprint across all stages. Results show total life cycle carbon emissions of 12600 tCO2, with embodied carbon (4590 tCO2, 36.6%) and the operational phase identified as the main emission sources. Through PV system integration and multi-scenario simulations, the study demonstrates significant carbon reduction potential: systems with 40–80 kW capacity can achieve annual carbon reductions ranging from 26 to 52 tCO2. The 60 kW system shows the optimal balance with an annual reduction of 38.7 tCO2 and a payback period of 3.53 years. The primary novelty of this work lies in its development of a dynamic BIM-LCA framework that enables real-time carbon footprint tracking, and the establishment of a first-of-its-kind quantitative model for PV strategy optimization under the specific climatic and grid conditions of Central China, providing a replicable pathway for region-specific decarbonization.

1. Introduction

Global climate change poses a significant challenge to the world today, and the building sector—as one of the major sources of energy consumption and carbon emissions—plays a critical role in achieving global climate targets due to its substantial potential for emission reduction. According to the latest 2025 report from the International Energy Agency (IEA), the building sector accounts for as much as 34% of global energy consumption and energy-related CO2 emissions and contributes to 50% of global material extraction [1]. In China, this situation is particularly acute. According to the China Building Energy Consumption and Carbon Emissions Research Report (2024) [2], The total carbon emissions from the entire building process in China—including building material production, construction, and building operation—account for approximately 51.2% of the nation’s total carbon emissions. Promoting the transition to low-carbon practices in the building sector is of decisive importance for achieving China’s national strategic goals of reaching carbon peak by 2030 and carbon neutrality by 2060.
In recent years, governments at all levels in China have introduced multiple policies to promote green and low-carbon development in the building sector. For example, Hubei Province [3] has also set similar targets, emphasizing that by 2025, green buildings should account for 100% of new urban civil buildings, while prefabricated buildings [4] should make up more than 30% of new construction area. These policies not only reflect the government’s commitment to reducing carbon emissions in construction but also provide strong policy support for the assessment of carbon emissions throughout the building life cycle and the application of renewable energy.
However, traditional building carbon emission assessment methods [5] often focus on a single stage (such as operational energy consumption or building material production), lacking a systematic consideration of the entire “cradle-to-grave” life cycle of buildings—i.e., from material production and construction through operation and final demolition and disposal. This fragmented approach fails to accurately capture the true carbon footprint of buildings and is unable to provide a reliable basis for decision-making regarding the most effective carbon reduction interventions.
The development of BIM technology [6] offers a powerful tool to address the challenges mentioned above. As an information-rich parametric model, BIM enables the integration of comprehensive data—including architectural geometry, materials, structures, and equipment—thereby making precise, visualized carbon emission calculation and analysis feasible. By integrating BIM with LCA methodology [7], it becomes possible to conduct dynamic and multi-scenario carbon emission simulations and comparisons from the early design stages throughout the entire project lifecycle, thereby guiding decision-making toward lower-carbon alternatives.
Among various carbon reduction strategies for buildings, photovoltaic (PV) systems [8], which generate clean electricity from solar energy, serve as one of the most direct and effective technological pathways to reduce carbon emissions during the operational phase of buildings. China’s PV industry holds a globally leading position, providing a solid foundation for large-scale application. Recent engineering practices demonstrate that innovative applications such as building-integrated photovoltaics [9] (BIPV, PV-GR) and photovoltaic-integrated energy storage, direct current, and flexible systems can significantly enhance a building’s energy self-sufficiency and carbon reduction performance. However, the assessment of the carbon reduction benefits of PV systems must also be conducted within a full life-cycle framework—that is, by balancing the “embodied carbon” from their production, transportation, and installation against the “operational carbon” offset by the electricity generated during operation, in order to determine their true net carbon reduction [10].
Currently, although existing studies have separately investigated the application of BIM in carbon emission management and the benefits of photovoltaic technology [11], research that employs BIM as a core platform to seamlessly integrate building life-cycle carbon assessment with dynamic analysis of PV-based carbon reduction strategies remains relatively underdeveloped. This is particularly true under the specific climatic context of hot summers and cold winters in Central China, combined with a regional electricity grid heavily dependent on fossil fuels—conditions under which the carbon reduction performance of such integrated approaches requires more localized and precise quantification.
This study is therefore designed to address these identified research gaps through two principal innovations that distinguish it from the current state of the art:
1.
A dynamic, closed-loop BIM-LCA data workflow. Unlike traditional static or segmented assessments, our framework leverages the seamless integration of multiple software platforms (e.g., Glodon GTJ 2025, PKPM-CES20250530) to establish a coherent digital thread from BIM-based design and quantity takeoff directly to carbon accounting. This integration enables dynamic, real-time carbon footprint updates and multi-scenario comparisons during the design phase, effectively overcoming the critical issue of data fragmentation.
2.
A context-aware PV strategy optimization model for targeted regional application. We move beyond generic PV benefit analysis by developing a quantitative model that explicitly incorporates the defining regional constraints of Central China—namely the hot-summer/cold-winter climate and a grid heavily reliant on thermal power. This model not only evaluates the carbon reduction potential but also performs a holistic life-cycle economic analysis, incorporating sensitivity analyses on key parameters (e.g., module degradation, self-consumption rate). The outcome is a set of practical, scalable implementation pathways (40–80 kW systems) with clear carbon-economic trade-offs, providing a previously lacking decision-making framework for achieving cost-effective decarbonization in this specific context.

2. Literature Review

2.1. Development and Application of BIM in the Construction Field

BIM constitutes a suite of information technologies [12]. The term itself dates back to 1992 and embodies the concept of creating an intelligent virtual model that systematically supports the entire asset life cycle, spanning design, construction, operation, and maintenance. This process is enabled by cloud-based shared digital platforms that standardize data exchange, facilitating multi-party collaboration through unified data formats. The resulting integrated data management system is known as the “Common Data Environment” (CDE).
A key advantage of BIM lies in its capacity to leverage computer-based pre-construction simulation, which provides guidance for actual construction operations. It also offers lightweight modeling tools that assist designers in rapidly developing physical engineering models and generating model-based animation simulations of the construction process. As such, BIM [13] represents the integrated application of a series of technological solutions aimed at enhancing cross-organizational and interdisciplinary collaboration within the construction industry, thereby improving productivity and quality across architectural design, construction, and maintenance.
In recent years, with the advancement of BIM technology, its integrated application with other new digital tools—such as the Internet of Things (IoT), big data, and artificial intelligence (AI)—has demonstrated significant advantages. Compared to conventional methods, these integrated approaches greatly optimize resource allocation and enhance efficiency throughout the entire building life cycle. Each of these technological integrations contributes distinctly to reducing carbon emissions across the building’s lifespan.
Y Jia [14] indicates that the integration of BIM and IoT technologies serves as a driving force for the digital transformation of the construction industry, with analysis showing a steady annual increase in the research literature in this field. Peiming Qiao [15] discusses specific applications of BIM technology across various stages of the construction process, including model integration, design optimization, construction schedule control, site navigation and walkthroughs, as well as on-site management in smart construction. These applications not only improve the precision of construction activities but also enhance the intellectualization of project management. Wei Cui [16] and colleagues integrated real-time dynamic data from environmental monitoring sensors with building information models to simulate, monitor, and manage environmental changes on construction sites. In addition, the combined use with IoT technology helps leverage the strengths of both approaches, offering a more efficient and intelligent management platform for engineering projects.
Liang Zhao et al. [17] point out that although BIM technology has been widely adopted in numerous projects, its application in energy-efficient retrofitting of existing buildings often faces challenges due to difficulties in acquiring relevant data. By utilizing a scan-to-BIM approach, which involves creating a BIM model through approximate and boundary matching with point cloud data within modeling tools, the completeness and accuracy of data acquisition can be significantly improved.
While the integration of new technologies such as the Internet of Things (IoT), big data, and artificial intelligence (AI) with BIM is gradually becoming a key driver of innovation in the construction industry, most current studies have only demonstrated the utility of BIM for specific purposes or processes, overlooking the importance of enhancing BIM’s intelligence throughout entire projects. Moreover, the inherently fragmented nature of the construction industry itself constitutes another critical barrier hindering the widespread adoption of intelligent technologies in the field [18].

2.2. Life Cycle Carbon Emissions of Buildings

Most studies categorize the calculation of life cycle carbon emissions from buildings into distinct phases: embodied carbon, construction, operation, and demolition. Based on the theory of building life cycle, researchers have developed various methods to construct carbon emission calculation models for conducting comprehensive assessments of carbon footprints over the entire lifespan of buildings.
Yubing Zhang [19] proposed a BIM-based methodology to integrate life cycle carbon emissions with life cycle cost, aiming to assess the carbon emission intensity (CEI) of buildings. Using a case study of a public building in China, the feasibility of this approach was validated. Through CEI analysis, key stages contributing to carbon emissions were identified, and strategies for transitioning from high-carbon to low-carbon materials were explored.
Farah Adilah Binti Jamaludin [20] employed a LCA approach to calculate the carbon emissions of buildings by integrating relevant indicators, conducting a comprehensive multi-dimensional evaluation of the low-carbon performance of green buildings. The research conducted quantitative analysis across five stages of the building construction process and five evaluation dimensions, establishing a conceptual model for low-carbon assessment of green buildings. Gray relational analysis and the analytic hierarchy process (AHP) were applied to rank and evaluate the projects.
Feifei CHEN [21] proposed a method for calculating and evaluating building thermal energy consumption and carbon emissions. The study first emphasized the important value and application potential of BIM technology in the energy consumption evaluation of green buildings. Taking a stadium as an example, a carbon emission accounting system for the building construction and installation processes was established based on BIM technology, through which the carbon emissions during these phases were calculated and analyzed. Yong Yang [22] developed a rapid calculation and analysis system for bridge carbon emissions based on BIM and LCA. This system, centered around a bridge information model, integrates data on material consumption, mechanical equipment, transportation, and energy use to compute carbon emissions at each stage of the bridge’s life cycle.
Due to differences in the selected research objects, objectives, methodologies, and platforms, studies on building carbon emissions vary in their focus. Some research [23,24] concentrates on building materials and construction methods. For instance, Jiawei Zhang [25] proposed a metamaterial-inspired controllable steel structure, which integrates periodically arranged local resonance substructures within the main system, overcoming the traditional limitation of requiring extensive additional mass for effective local resonance. Xiaojuan Li [26], targeting the embodied stage of precast concrete composite panel (PCC) projects, integrated LCA, BIM, and Geographic Information System (GIS) technologies to develop a carbon footprint accounting model covering the production, transportation, and installation stages, enabling a quantitative analysis of carbon emission distribution. Case studies revealed a significant negative correlation between the prefabrication rate and carbon emissions per unit area and cost, indicating that increased application of PCC can reduce the carbon footprint by decreasing material consumption.
Other studies [27,28] focus primarily on reducing operational energy consumption in buildings to achieve carbon emission reduction. For example, Mahmoud Ouria [29] optimized residential building design by incorporating phase change materials (PCMs) and high-efficiency HVAC systems, aiming to control thermal discomfort to below 1%, achieve negative carbon emissions, and reduce costs. Most significantly, Yang et al., (2025) developed a comprehensive spatial LCA framework that systematically integrates GIS, BIM, and LCA methodologies for urban-scale building assessment [30]. This framework, compliant with ISO 14040/14044 standards [31,32], demonstrates that Urban Net Zero Energy Building strategies can achieve 40% reduction in life-cycle carbon emissions. The research highlights the importance of identifying impact hotspots (e.g., low-rise apartments) and addresses burden-shifting across life-cycle phases. This macro-level urban assessment approach complements our focused study on residential buildings in Central China, together advancing BIM-LCA applications in building carbon management.
Recent methodological advances show the growing sophistication of LCA applications. Payandeh et al., (2025) combined LCA with Data Envelopment Analysis to optimize environmental efficiency in production systems, demonstrating how operational benchmarks can guide environmental improvements [33]. This approach offers valuable insights for optimizing building operational carbon management. Furthermore, Aruta et al., (2025) developed a multi-objective optimization framework that balances private economic interests with public policy goals in building energy retrofit [34]. Their methodology, which identifies optimal trade-offs between cost savings and energy benefits, provides important implications for designing effective incentive policies to promote PV integration in building retrofit projects.
Regarding photovoltaic carbon accounting, Guo et al., established a comprehensive carbon emission model for China’s PV supply chain, demonstrating significant emission reduction potential [35]. Yu et al., conducted a comprehensive energy-economy-environment evaluation of BIPV across Chinese climate zones, revealing that combined rooftop and facade systems can reduce urban CO2 emissions by 35.50% [36]. From an international perspective with relevant climatic conditions, Lodhi et al. proposed a novel framework combining deep learning and atmospheric modeling for urban PV assessment in Lahore, Pakistan, demonstrating substantial carbon reduction potential [37]. Buyak et al., evaluated low-carbon regeneration strategies in Eastern Europe, emphasizing the synergistic role of PV systems in building modernization [38].
In summary, although current research on life-cycle carbon emission assessment in buildings has established fundamental methodologies, significant limitations remain: most assessment models fail to deeply integrate dynamic building information flows, resulting in fragmented data and insufficient accuracy. At the same time, quantitative analysis of the benefits of renewable energy carbon reduction strategies—such as photovoltaic (PV) systems—particularly in the context of regionally optimized applications for residential buildings, remains relatively underdeveloped. BIM technology, with its capability for digital integration and simulation across the entire process of planning, design, construction, and operation, provides core support to overcome these challenges. Therefore, this study focuses on residential buildings in Central China and innovatively develops a BIM-based life-cycle assessment framework. Specifically, BIM-enabled parametric modeling and data linkages are utilized to achieve accurate quantification of carbon emissions throughout stages such as embodied carbon, construction, operational energy consumption, and demolition and recycling. Furthermore, PV systems are incorporated as a key carbon reduction variable to simulate their power generation performance, carbon reduction potential, and life-cycle economic performance under the climatic conditions of Central China. Finally, multi-scenario analysis is conducted to propose cost-effective PV integration strategies, offering empirical support and technical pathways for the low-carbon design and retrofitting of residential architecture in the region.
3. Materials and Methods

3.1. Research Framework

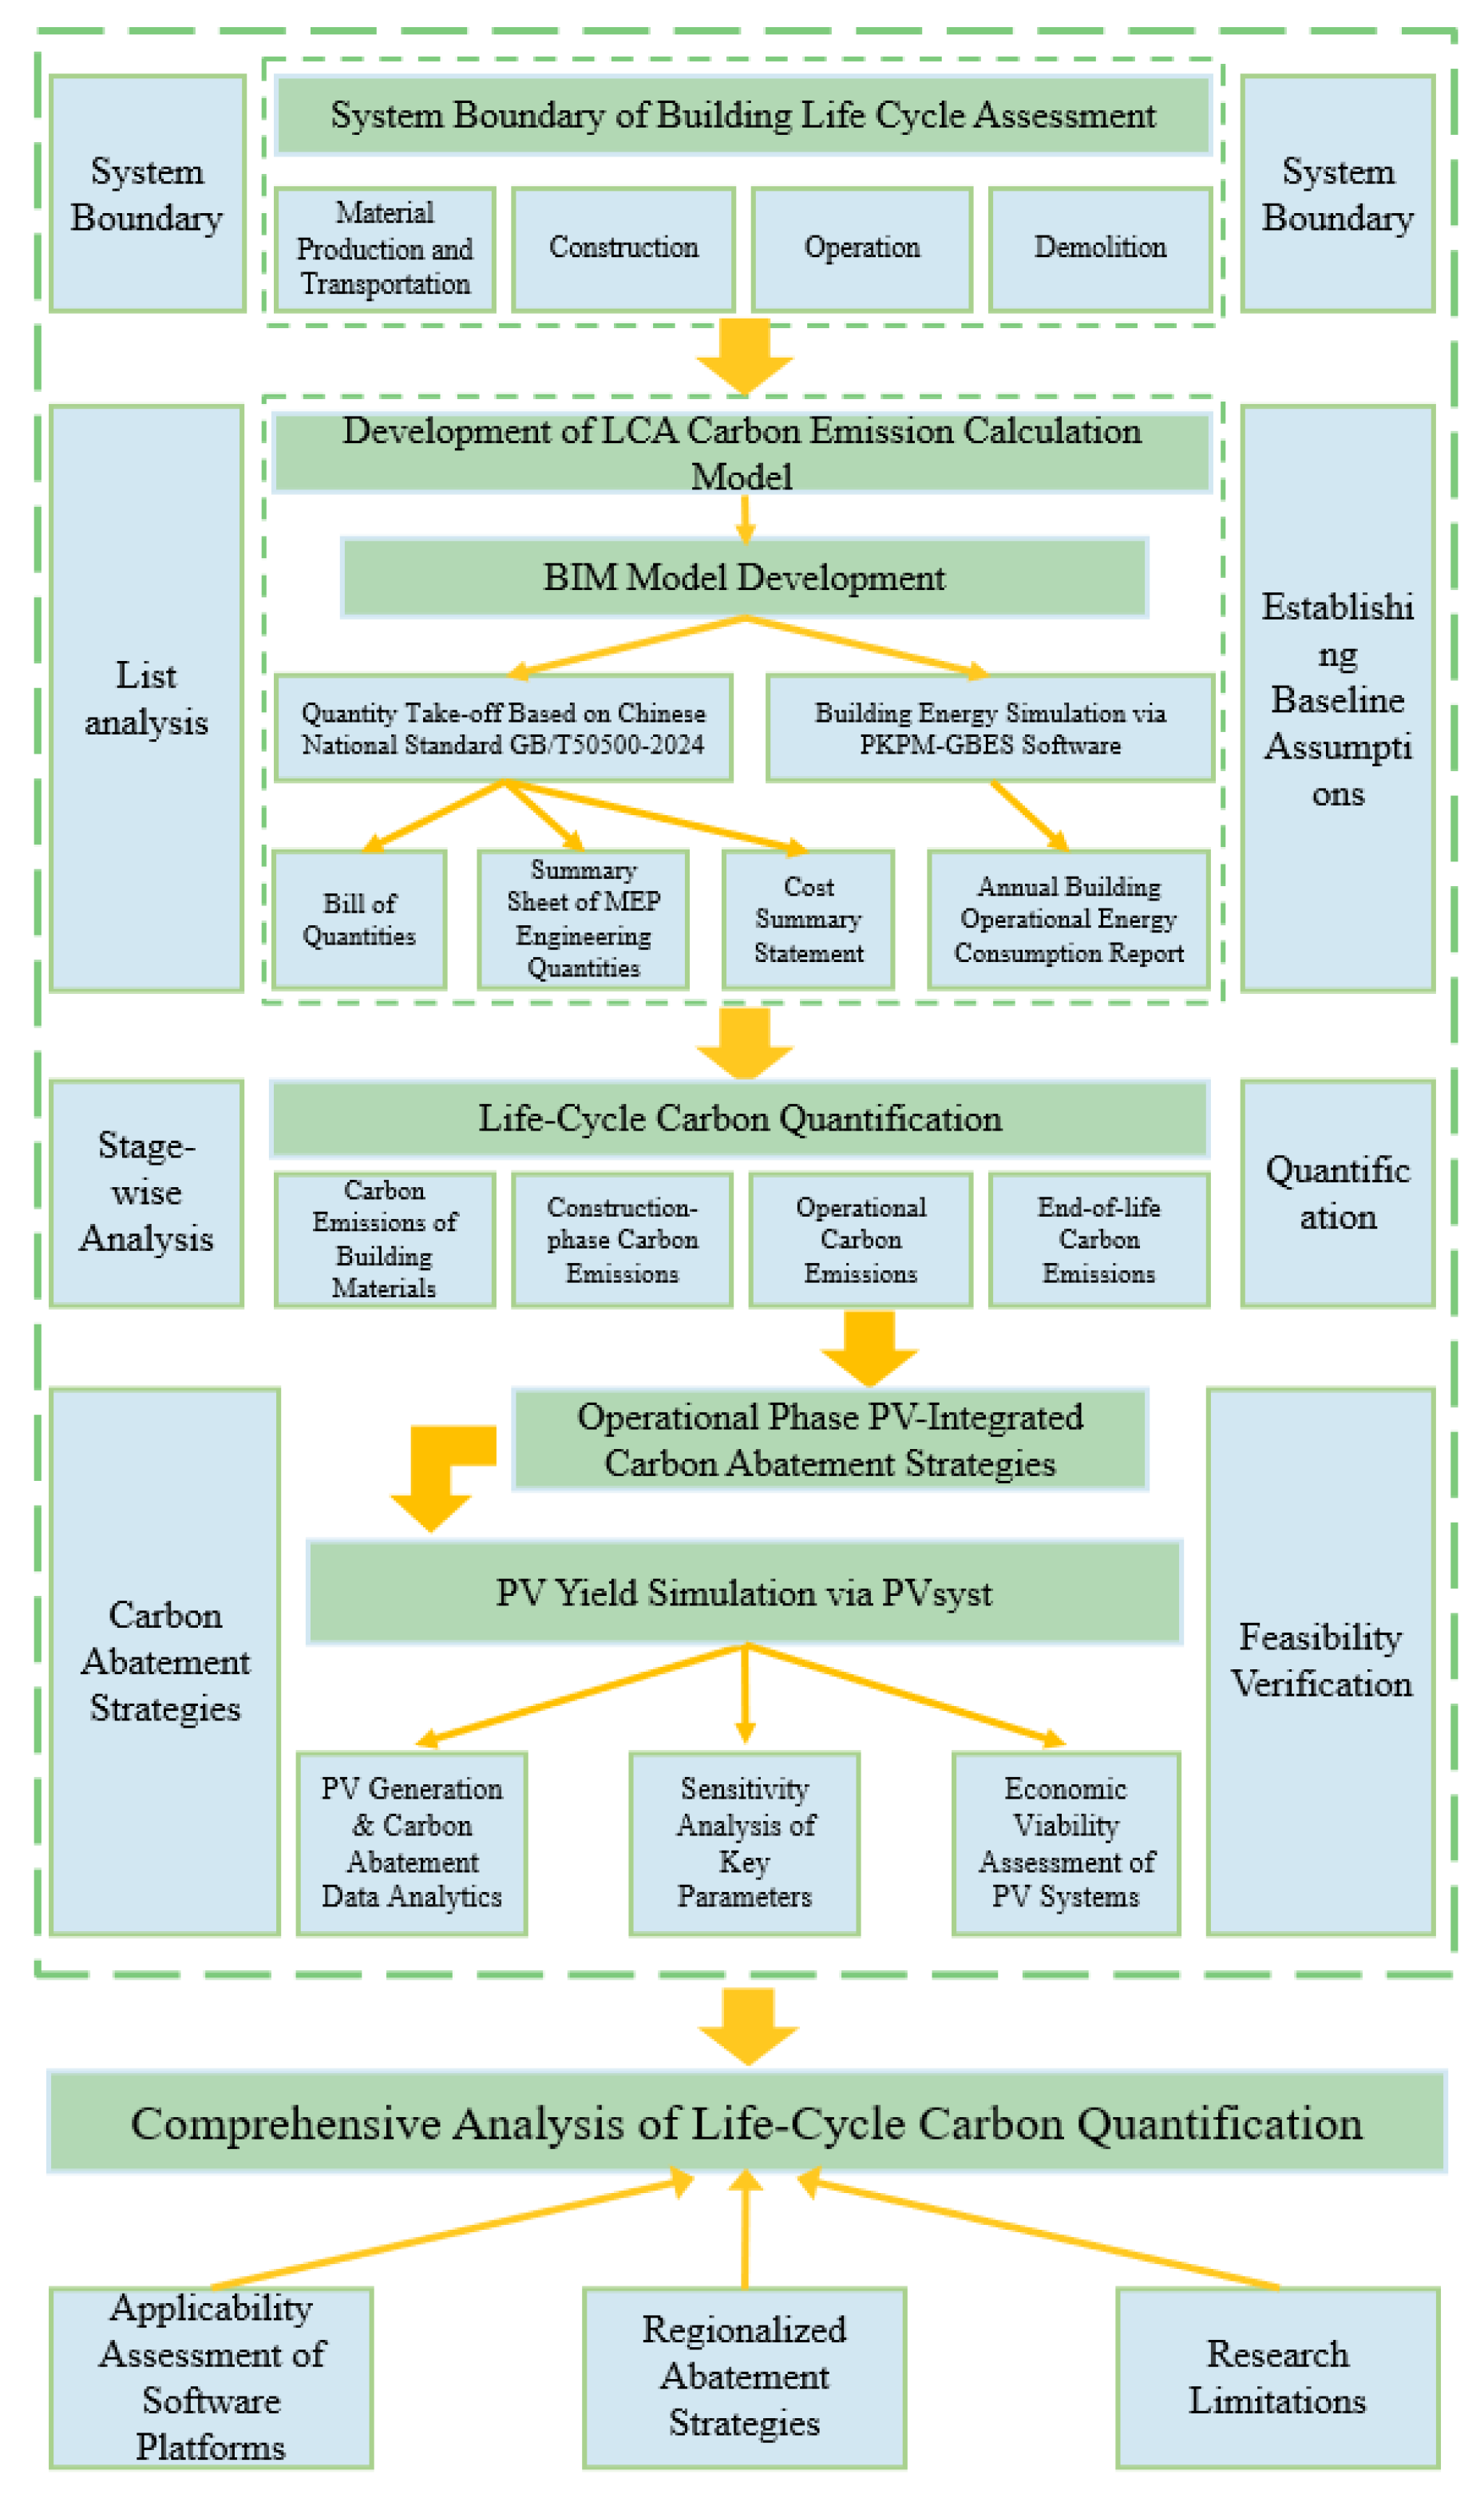
This study’s assessment of building life cycle carbon emissions follows the LCA framework established by ISO 14040 and ISO 14044, including the four fundamental steps: goal and scope definition, inventory analysis, impact assessment, and interpretation, ensuring the systematic, transparent, and reproducible nature of the assessment process, as detailed in Figure 1.
Unlike generic BIM-LCA applications, this study establishes a region-specific quantitative framework calibrated for Central China’s unique context, incorporating local climatic patterns, grid emission factors (0.58 kgCO2eq/kWh from the 2022 China Regional Grid Baseline Emission Factors Report), and regional material supply chains to provide accurate carbon assessment tailored to local conditions.

3.2. BIM Modeling and Data Output of the Case Building

3.2.1. Case Building Description

This study focuses on a newly constructed apartment building for a school in Xiangyang City, Hubei Province. Xiangyang is located in the northern subtropical monsoon climate zone, characterized by distinct seasonal variations with cold winters and hot summers, making the building representative under such climatic conditions. The apartment building adopts a reinforced concrete frame structural system, with a total floor area of 8500 m2, a base area of 1436 m2, six above-ground floors, and a building height of 18.7 m. It is designed for a service life of 50 years. Subsequent validation and analysis of the methods presented in this study will be conducted based on comprehensive data covering the entire life cycle of this building.

3.2.2. Research Tools Introduction

First, Glodon BIM Civil Engineering Quantification Platform GTJ 2025 and Installation Quantification Software GQI 2021 were employed to create civil and installation models, with quantification rules configured and engineering quantities calculated. Second, based on the civil and installation model files, the Glodon Cloud Costing Platform GCCP V6.0 was used to compile the bill of quantities and tender control price documents for the unit project. Finally, summaries of engineering material and machinery consumption were extracted and exported. By integrating the bill of quantities with quota-based pricing (via the GCCP platform), material and machinery consumption was accurately quantified. The seamless integration between the BIM model and quantity data helps avoid inaccuracies inherent in traditional 2D drawing-based calculations, thereby significantly improving data reliability. A detailed introduction to the software mentioned above is provided in Table 1.

3.2.3. Data Integration Process

A structured multi-platform workflow was implemented to ensure effective data interoperability from architectural design to carbon emission calculation. The process progresses through specialized software tools, with each stage generating standardized output formats that serve as inputs for subsequent analysis phases, as detailed in Table 2.

3.3. Life Cycle Carbon Accounting

3.3.1. Defining the System Boundary

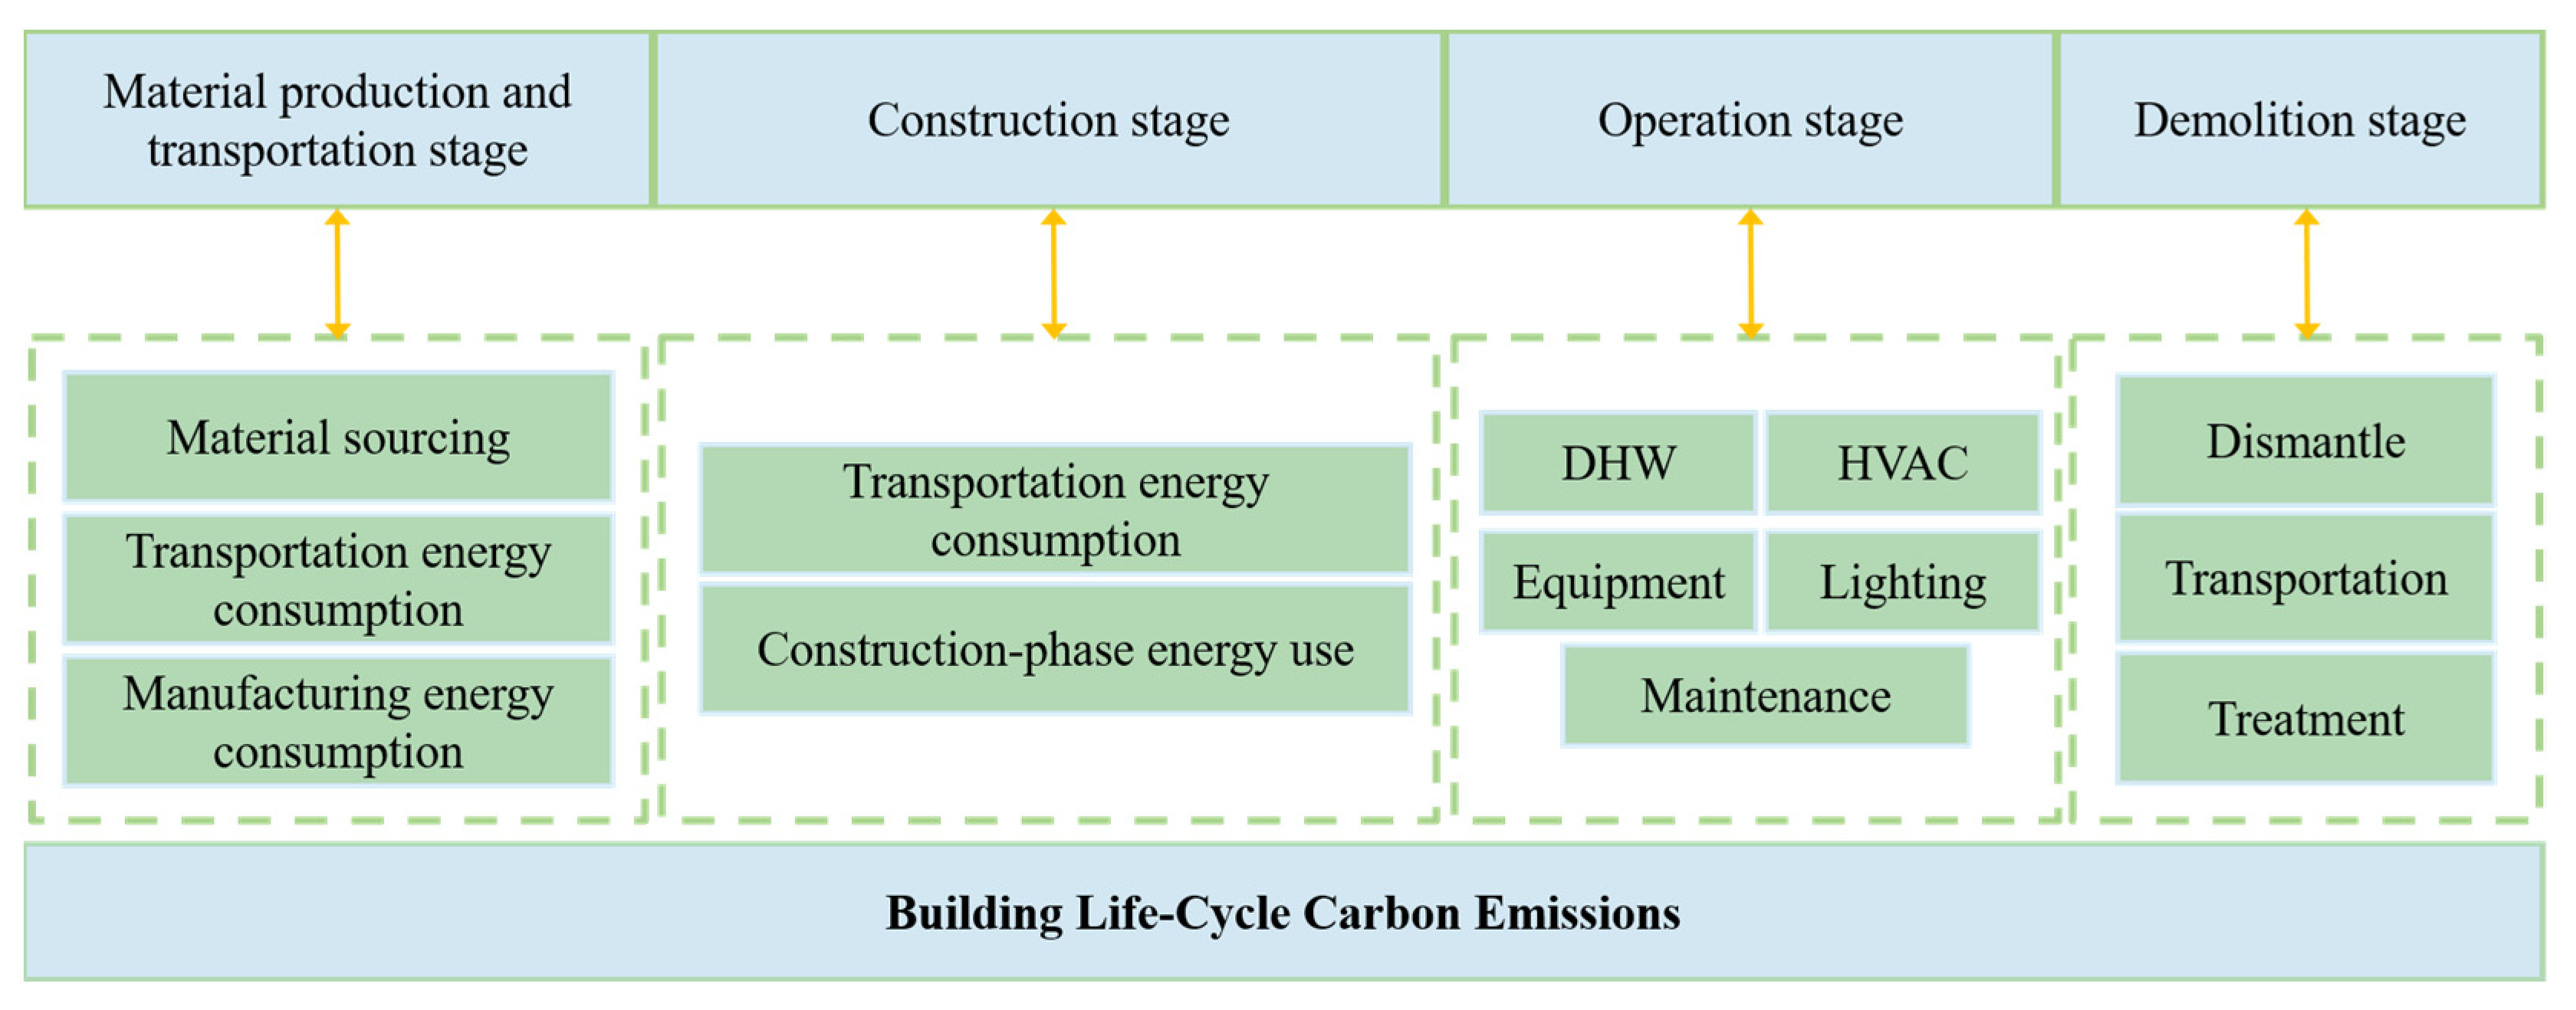
The definition of the accounting boundary strictly adheres to the ISO 14044 standard, encompassing four typical stages: building material production and transportation, construction, operation and maintenance (based on a 50-year design service life), and demolition and recycling. This constitutes a relatively comprehensive system boundary, as illustrated in Figure 2.

3.3.2. Carbon Accounting Tools

PKPM-CES, developed through a collaboration between Beijing Goli Technology Co., Ltd. and the Institute of Building Environment and Energy (CABR), is a dedicated software tool for calculating carbon emissions across the entire building life cycle. It supports both detailed and estimation-based models for various building types and climate zones. Beyond basic carbon accounting, the software enables evaluation of carbon reduction and neutrality strategies, including renewable energy integration and green landscaping. With applications spanning engineering consulting, design, construction, and real estate management, it provides dynamic carbon emission tracking and supports intelligent decision-making for carbon reduction planning.

3.3.3. Carbon Emission Calculation for Each Stage

Based on the aforementioned analysis, the calculation of carbon emissions over the building life cycle is divided into four stages: building material production and transportation, construction, operation and maintenance, and demolition and recycling [19] The total life cycle carbon emission is calculated as follows:
C t   = C m c   + C c   + C o   + C d
where C m c denotes the carbon emissions from the embodied carbon, C c represents the carbon emissions generated during the construction phase, C o indicates the carbon emissions resulting from building operation and maintenance, C d refers to the carbon emissions associated with the demolition stage.
  • Building Material Production and Transportation Stage
The carbon emission calculation for the building material production stage primarily involves emissions generated during the extraction, processing, and manufacturing of main building materials (such as steel, cement, glass, etc.). The transportation stage focuses on calculating carbon emissions resulting from transporting these materials from their production origins to the construction site [39]. The total carbon emissions for the entire building material phase is calculated by
C m c   = i = 1 a   Q m , i   E F m , i   + j = 1 b   Q t , i   D t , j   E F t , j   
Here, i   =   1 a Q m , i · E F m , i represents the carbon emissions from the material production stage, Q m , i indicates the consumption of the i-th type of building material, E F m , i denotes the carbon emission factor for the production of that material, a represents the number of material types; j   =   1 b Q t , i · D t , j · E F t , j refers to the carbon emissions from material transportation, Q t , i indicates the load capacity of the j-th type of transport vehicle, D t , j denotes the transportation distance E F t , j represents the carbon emission factor of the transportation mode, b indicates the number of transportation modes.
  • Construction Stage
Carbon emissions during the construction stage originate from energy consumption by construction machinery and equipment (such as cranes, excavators, etc.),as well as energy use associated with the construction and operation of temporary facilities (site offices and dormitories) [21]. The carbon emissions in this stage are calculated by
C c   = K = 1 c F C k   E F f , k   + l = 1 d   E C l   E F e  
Here, k   =   1 c F C k · E F f , k represents carbon emissions from fossil fuel consumption, F C k denotes the consumption of the k-th type of fossil fuel, E F f , k is the combustion emission factor of the k-th fuel type, c indicates the number of fossil fuel types; l   =   1 d E C l · E F e refers to carbon emissions from electricity usage, E C l represents the electricity consumption of the l-th type of equipment, E F e is the carbon emission factor of grid electricity, and d denotes the number of categories of electricity-consuming equipment.
  • Operation Stage
Carbon emission calculation during the operation stage primarily refers to the carbon emissions generated by energy consumption for heating, air conditioning, lighting, and other operational needs over the building’s designed service life [40]. This stage employed operational energy simulation parameters based on the Chinese standard GB 55015-2021 [41] and local building data, including: occupancy density of 0.05 persons/m2 with academic schedules; equipment power density of 15 W/m2 (10 h/day); lighting power density of 6 W/m2 with automatic controls; HVAC schedules aligned with teaching periods; and domestic hot water consumption of 30 L/person/day.
The carbon emissions in this stage are calculated by
C o   = y = 1 n   ( m = 1 p   E y , m   E F y , m   )
Here, E y , m represents the consumption of the m-th type of energy in the y-th year, E F y , m denotes the dynamic emission factor of the m-th energy type in the y-th year, n indicates the designed service life of the building, and p represents the number of energy types.
  • Demolition Stage
The calculation of carbon emissions during the demolition stage includes carbon emissions from energy consumption of demolition machinery, as well as carbon emissions or reductions associated with waste transportation. It is calculated by
C d   = E d e m   E F e   + F d e m   E F f   + W D w   E F t  
Here, E d e m · E F e + F d e m · E F f represents the carbon emissions from energy consumption of demolition machinery, E d e m denotes the electricity consumption of demolition equipment, E F e is the carbon emission factor of grid electricity, F d e m indicates the fuel consumption of demolition equipment, E F f represents the combustion emission factor of the fuel; W · D w · E F t refers to the carbon emissions from waste transportation, W denotes the total amount of construction waste, D w indicates the average transportation distance of the waste, E F t is the carbon emission factor of the transportation mode.

3.4. Photovoltaic System Design and Carbon Reduction Calculation

3.4.1. Scheme Design

PVsyst V7.4.0 photovoltaic simulation software was employed to simulate the power generation performance of photovoltaic modules with different installed capacities (30 kW, 40 kW, 50 kW, 60 kW, 70 kW, and 80 kW) on the building rooftop in the target region [42]. Additionally, based on local meteorological data and electricity price information (Table 3), detailed parameter settings were optimized during the PVsyst simulation process. For instance, the tilt angle was adjusted to 22° to adapt to the solar irradiation conditions in Central China [43]. The carbon reduction potential and economic benefits of photovoltaic systems with varying installed capacities were estimated and evaluated accordingly.

3.4.2. Carbon Reduction Accounting Process

This stage requires compiling the embodied carbon of photovoltaics (PV) based on information provided by the PV module manufacturers [44]. The electricity generation simulated by PVsyst software is then used to calculate the displaced grid carbon emissions, thereby determining the net carbon reduction. The calculation is performed as follows:
C a   = E p v   E F g  
Here, C a represents the carbon emissions displaced from the grid by PV power generation; E p v indicates the annual electricity generation of the PV system; E F g denotes the dynamic grid carbon emission factor, with values for the Central China regional grid dynamically ranging within 0.58 ± 0.03 kgCO2eq/kWh.
Δ C n e t   = C a   C p v
Here, C n e t represents the net carbon reduction achieved by the PV system; C p v indicates the embodied carbon of the PV system, which includes emissions from the module production stage, logistics and transportation, installation and construction, and demolition.

3.4.3. Economic Evaluation

  • Economic Evaluation of the PV System
The economic assessment of the photovoltaic (PV) system can be more intuitively perceived by quantifying its investment payback period [45]. The payback period of the system is calculated as follows:
T p b   = M i R a    
M i   = P p v   M u n  
R a   = E p v   [ α P g   + ( 1 α ) P e   ] β M i  
Here, T p b represents the payback period of the PV system; M i denotes the total initial investment cost, P p v indicates the installed capacity of the system, M u n represents the unit installed cost; R a indicates the annual net income, E p v · α · P g + 1 α · P e represents the total annual revenue, α denotes the self-consumption rate, P e represents the feed-in tariff including government subsidies (equal to P f e + S s u , where P f e is the grid purchase price and S s u is the government subsidy); β · M i indicates the annual operation and maintenance cost (taken as 1% of the total initial investment of the PV system), β represents the O&M coefficient with a value of 1%.

3.4.4. Sensitivity Parameter Analysis

  • Self-Consumption Rate
The self-consumption rate, defined as the proportion of PV-generated electricity consumed in real time by the building itself, serves as a core economic indicator for photovoltaic systems. Recognizing its significant impact on both investment payback period and carbon reduction benefits, we conducted a sensitivity analysis using three distinct rate levels (70%, 80%, and 90%) to evaluate their effects on systems with varying installed capacities. This parameter selection was based on the characteristic electricity load profile of the case building—a school apartment with substantial daytime energy demand. The 90% scenario represents an optimized case assuming implementation of an energy management system for intelligent load scheduling aligned with PV generation patterns. The 70% and 80% scenarios correspond to conventional operation with progressively better load matching. This systematic variation enables comprehensive assessment of how self-consumption rates influence economic returns across different operational conditions.
  • PV Module Degradation Rate
PV module degradation refers to the phenomenon where the output power of the modules gradually decreases over time. During the PVsyst simulation, while keeping other conditions unchanged, the annual degradation rate was set to 0.4%, 0.6%, and 0.8%, respectively, respectively to simulate the effects of different types of PV modules. The corresponding PV power generation output was exported, and a comparative analysis of the results was conducted to determine the impact of different degradation rates on the power generation performance of the PV system.

4. Result Analysis

4.1. BIM Model and Data Output

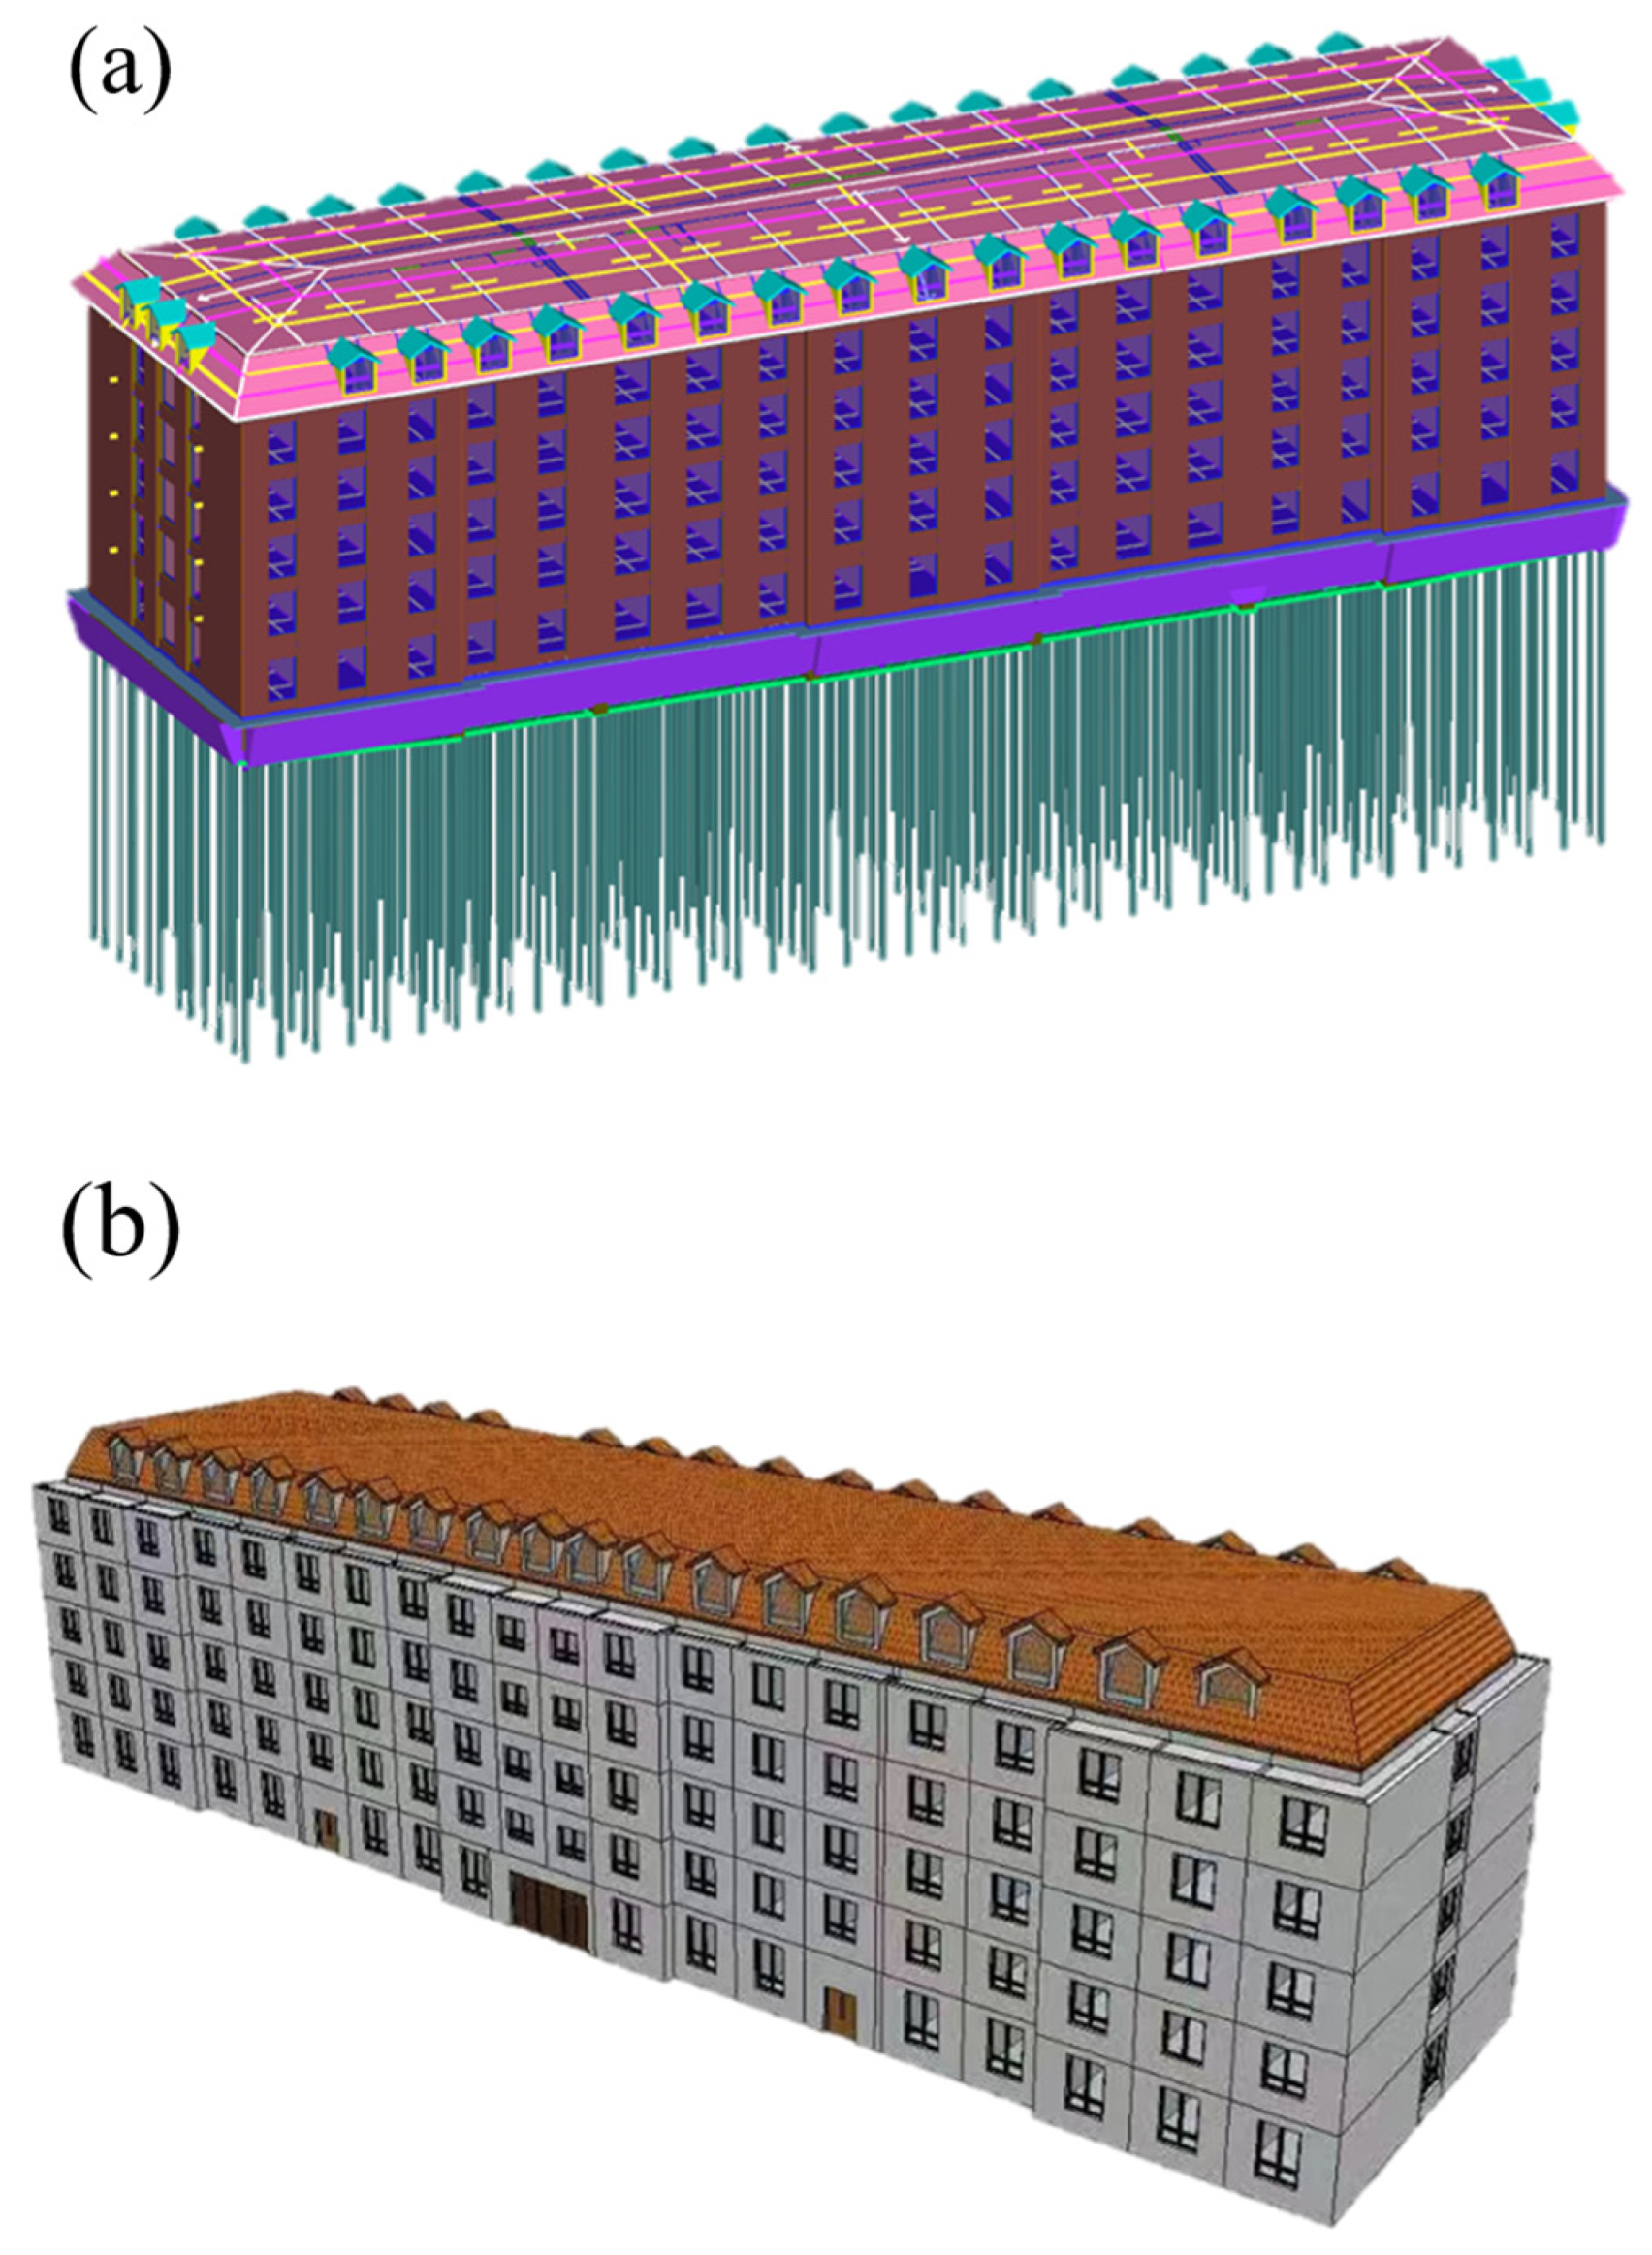
To validate the aforementioned methodology, BIM models for the civil and installation components, as well as a building energy consumption model, were created based on the architectural drawings of the case project (see Figure 3). Following the BIM modeling process, data on engineering material consumption and machinery usage were extracted and outputted to support subsequent carbon emission calculations.

4.2. Life Cycle Carbon Emission Accounting of the Building

The total carbon emissions over the building’s life cycle were calculated as 12,600 tCO2eq. The carbon emissions for each stage, carbon emissions per unit area, annual carbon emissions per unit area, and the proportion of emissions from each stage are presented in Table 4.
The data indicate that the embodied carbon and the building operation stage are the main contributors to the total life cycle carbon emissions. These stages are also the primary targets for implementing carbon reduction optimization measures. When compared with the public building case study by Zhang et al. [19], which reported total emissions of 40,103 tCO2, the carbon emission intensity of the present case (1568 kgCO2/m2) aligns with the typical range for reinforced concrete residential buildings in China (1200–2000 kgCO2/m2). The distribution pattern shows expected variations: the embodied carbon proportion (36.58% versus 7.84%) reflects the material-intensive nature of residential construction, while the lower operational carbon proportion (62.54% versus 91.27%) indicates reduced energy demand compared to energy-intensive public facilities. This comparative analysis validates that the results fall within reasonable ranges for similar building types.

4.2.1. Carbon Emissions from Material Production & Transportation

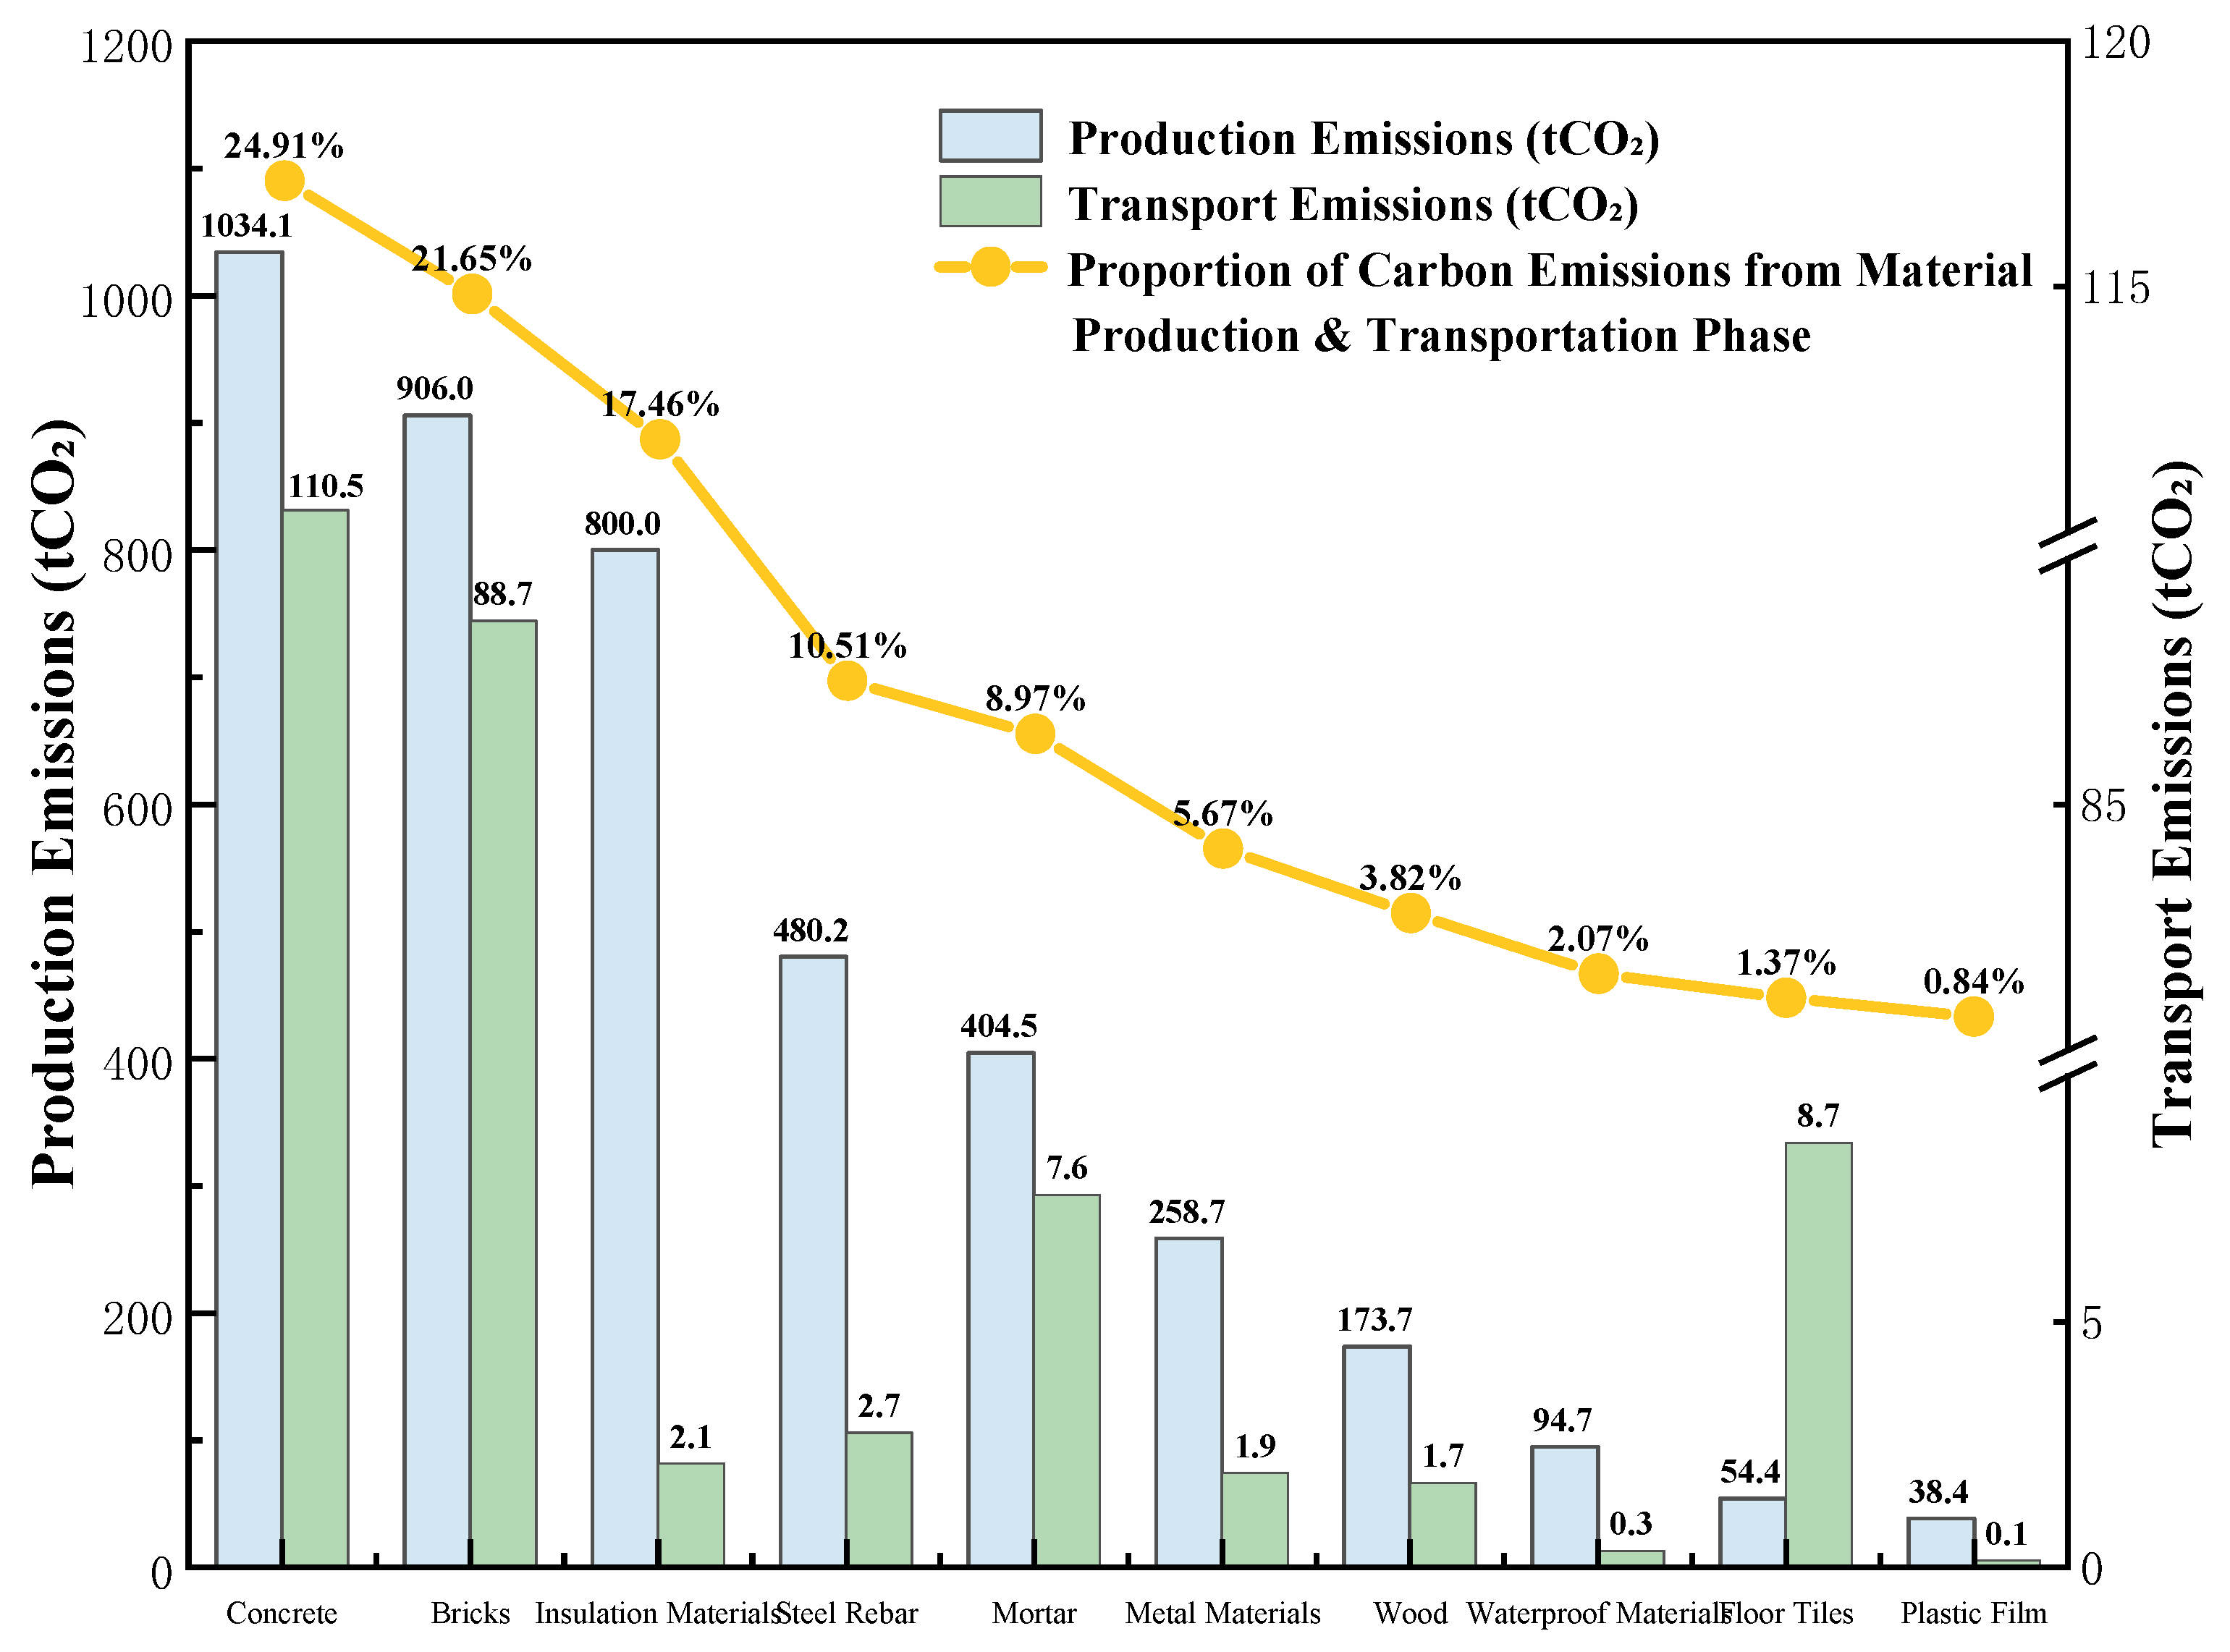
Within the building’s life cycle carbon emission system, the total carbon emissions from the embodied carbon amounted to 4590 tCO2. Analysis (Figure 4, Table 5) indicates that the emissions predominantly originated from the material production process, contributing 4340 tCO2, accounting for 94.4% of the stage’s total, while transportation accounted for 255 tCO2, representing 5.56%.
In the material production phase, the top 10 emission sources were responsible for 96.60% (4190 tCO2) of the emissions. Among these, concrete, bricks, and insulation materials were the dominant contributors, collectively accounting for 63.2% of the total emissions in this phase. The remaining emission sources constituted 3.40%.
For the transportation phase, the top 10 materials contributed 87.8% (224 tCO2) of the emissions. Concrete and brick materials were the primary sources, with their combined emissions (110 tCO2 + 88.7 tCO2) representing 78.0% of the total transportation emissions. The remaining sources accounted for 12.2%.
Materials with high carbon emission rankings are major contributors in each phase due to their large consumption volumes and high carbon emission factors. To reduce carbon emissions, the following measures can be implemented: In the production phase, adopt low-carbon cementitious material systems for concrete (e.g., increasing the content of slag powder and fly ash to reduce clinker usage); utilize energy-efficient kilns and waste heat recovery technologies for brick production; and select new green insulation materials (such as aerogel insulation felts). For the transportation phase, prioritize low-carbon modes such as railway and waterway transport, and optimize route planning and vehicle loading rates.

4.2.2. Analysis of Operational Carbon Emissions

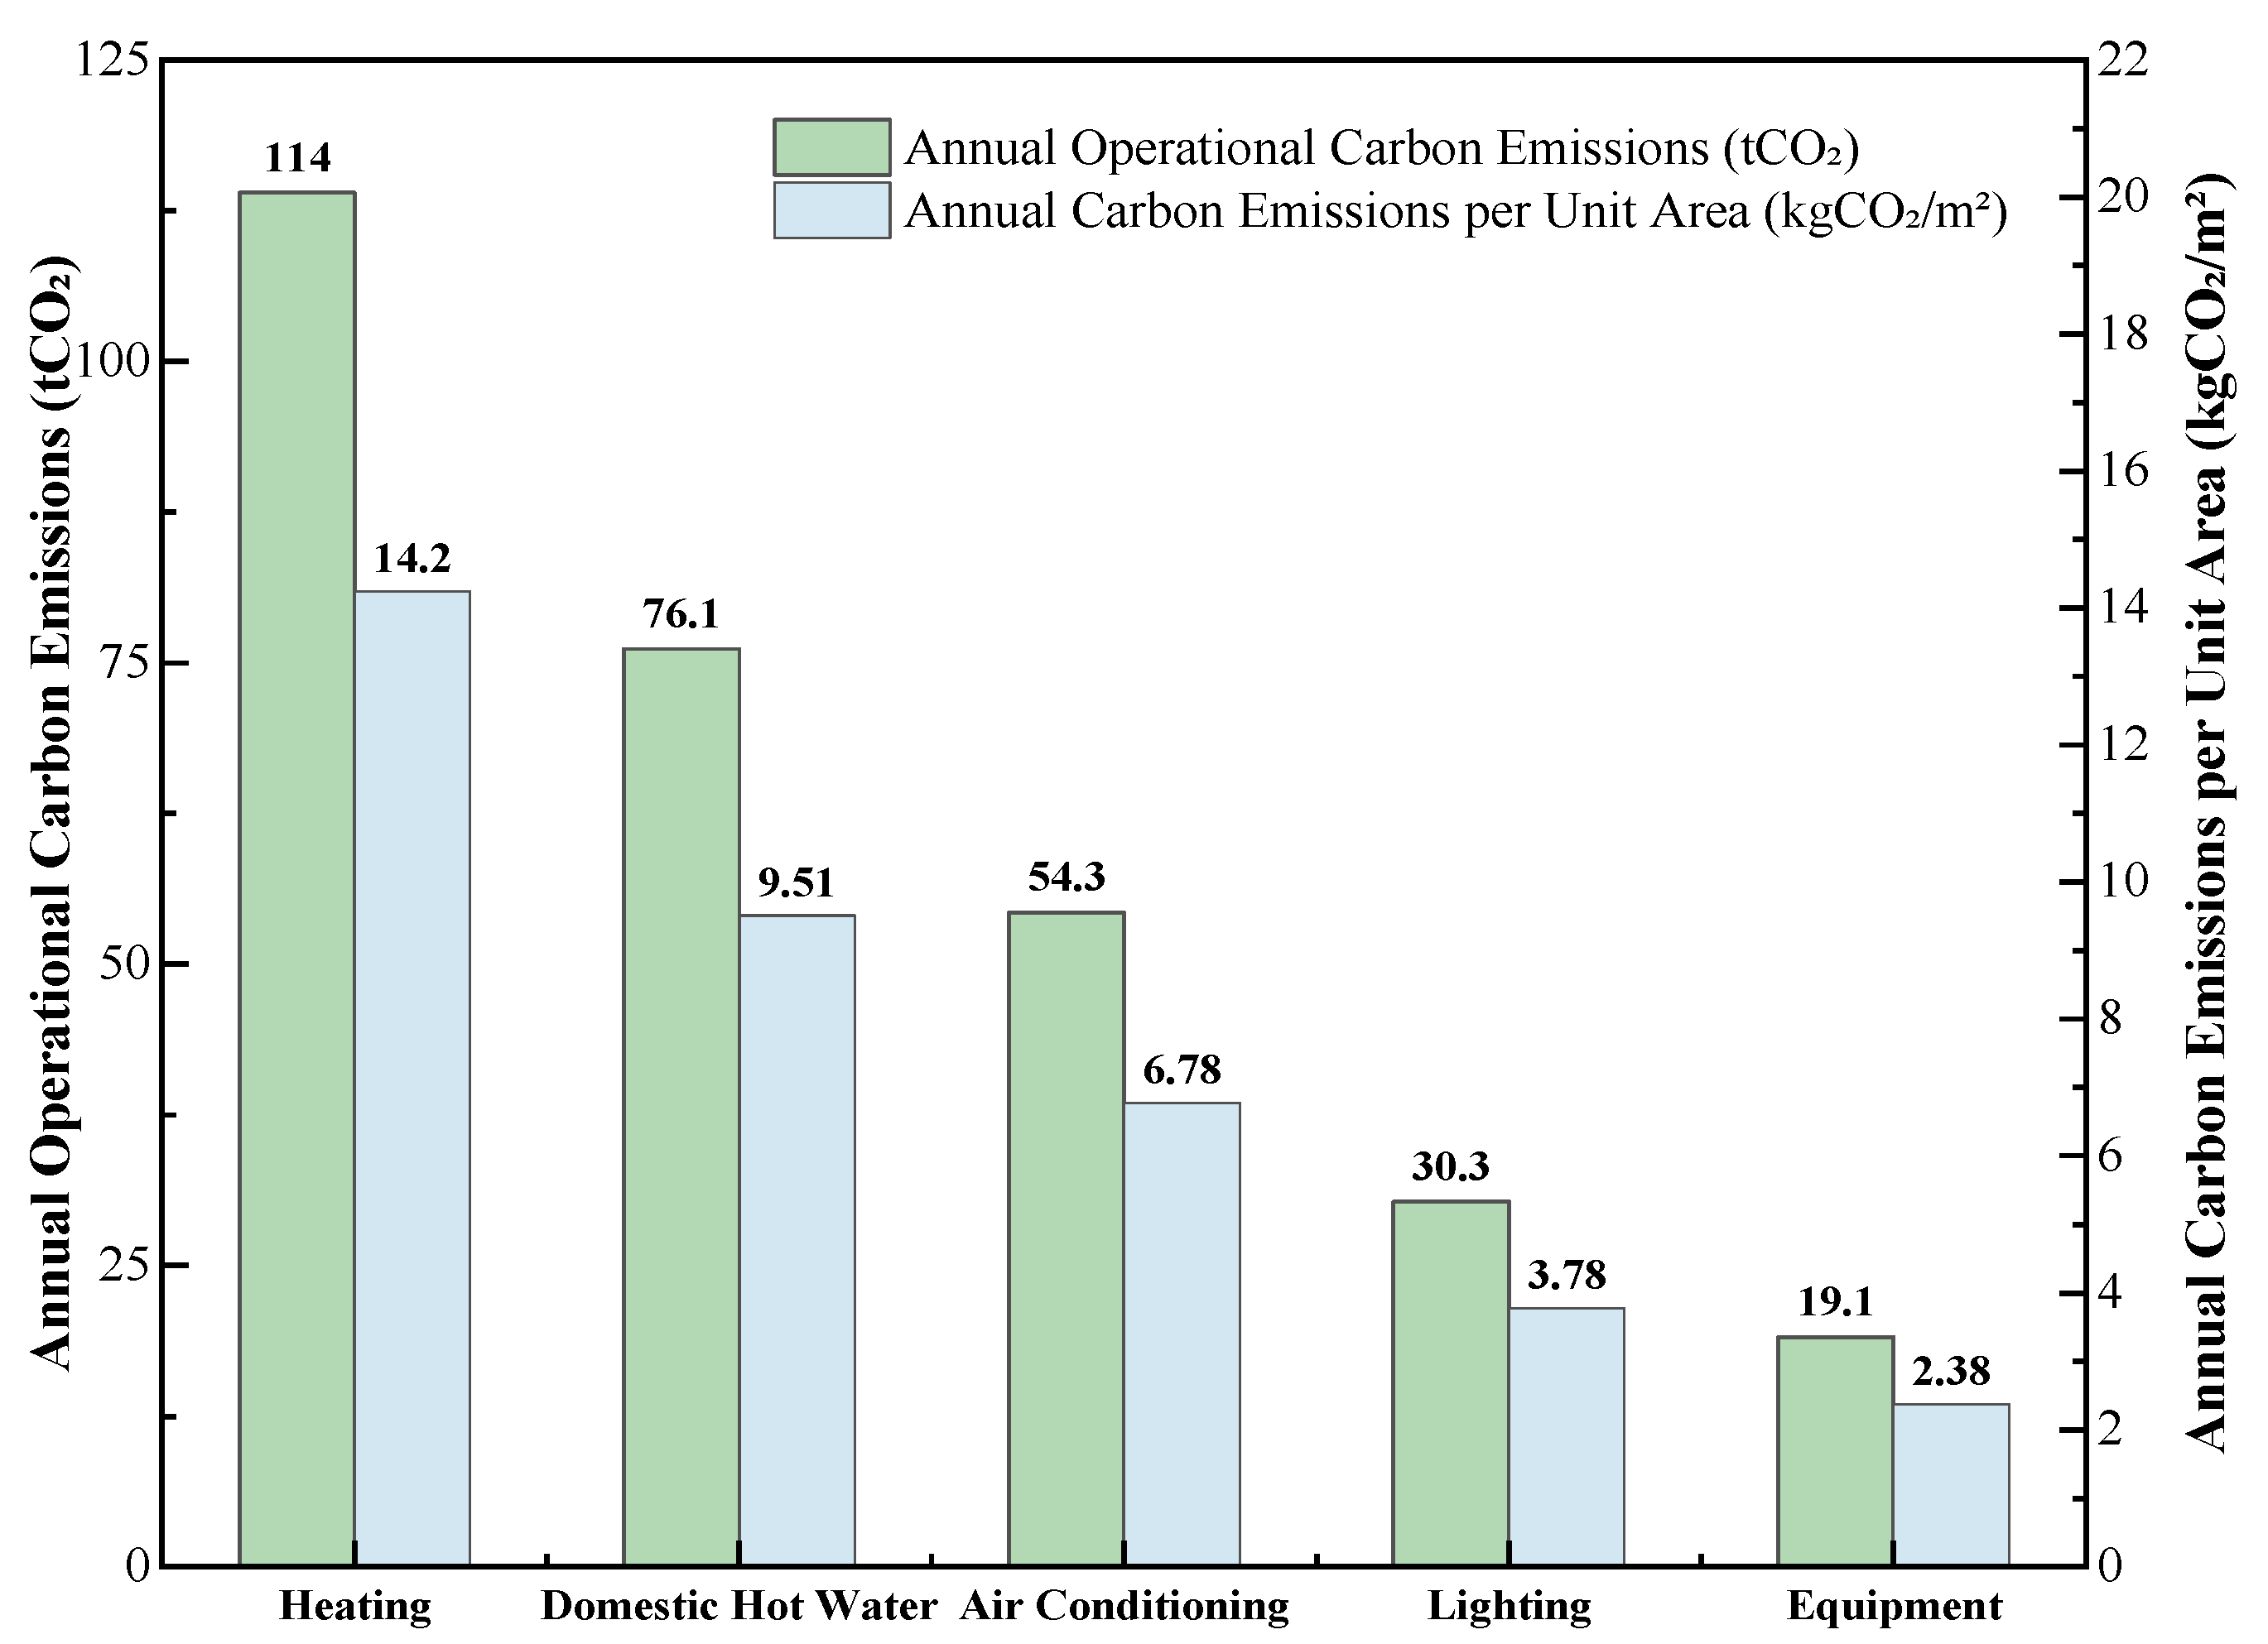
Analysis of energy consumption and carbon emission data from various building operational systems (Figure 5, Table 6) shows that heating, air conditioning, and domestic hot water collectively consumed 401,000 kWh, accounting for 68.9% of the building’s total operational energy use. The corresponding carbon emissions reached 244 tCO2, representing 80.5% of total operational emissions. The carbon emission intensity of heating was 0.61 kgCO2/kWh, consistent with that of air conditioning and domestic hot water. The lighting energy consumption was calculated following the latest Chinese building lighting design standard GB 55015-2021, using room-specific lighting power densities that account for natural lighting availability and usage patterns. The specific design parameters are summarized in Table 7 below. The calculated annual lighting energy consumption of 49,662.38 kWh falls within the expected range for LED lighting systems in residential buildings and aligns with the standard’s requirements.
The dual-peak pattern of energy demand in Central China, with year-round energy requirements, is closely linked to the region’s cold, humid winters and hot summers. Some studies suggest that implementing an integrated “PV + heat pump” system during the operational phase can prioritize the use of solar power for air conditioning in summer and utilize surplus electricity to drive heat pumps for heating in winter.

4.3. PV System Evaluation

This study proposes a PV-based carbon reduction strategy to optimize operational phase carbon emissions and provides a detailed assessment of its carbon reduction potential and economic benefits.

4.3.1. PV Capacity: Output & Carbon Reduction

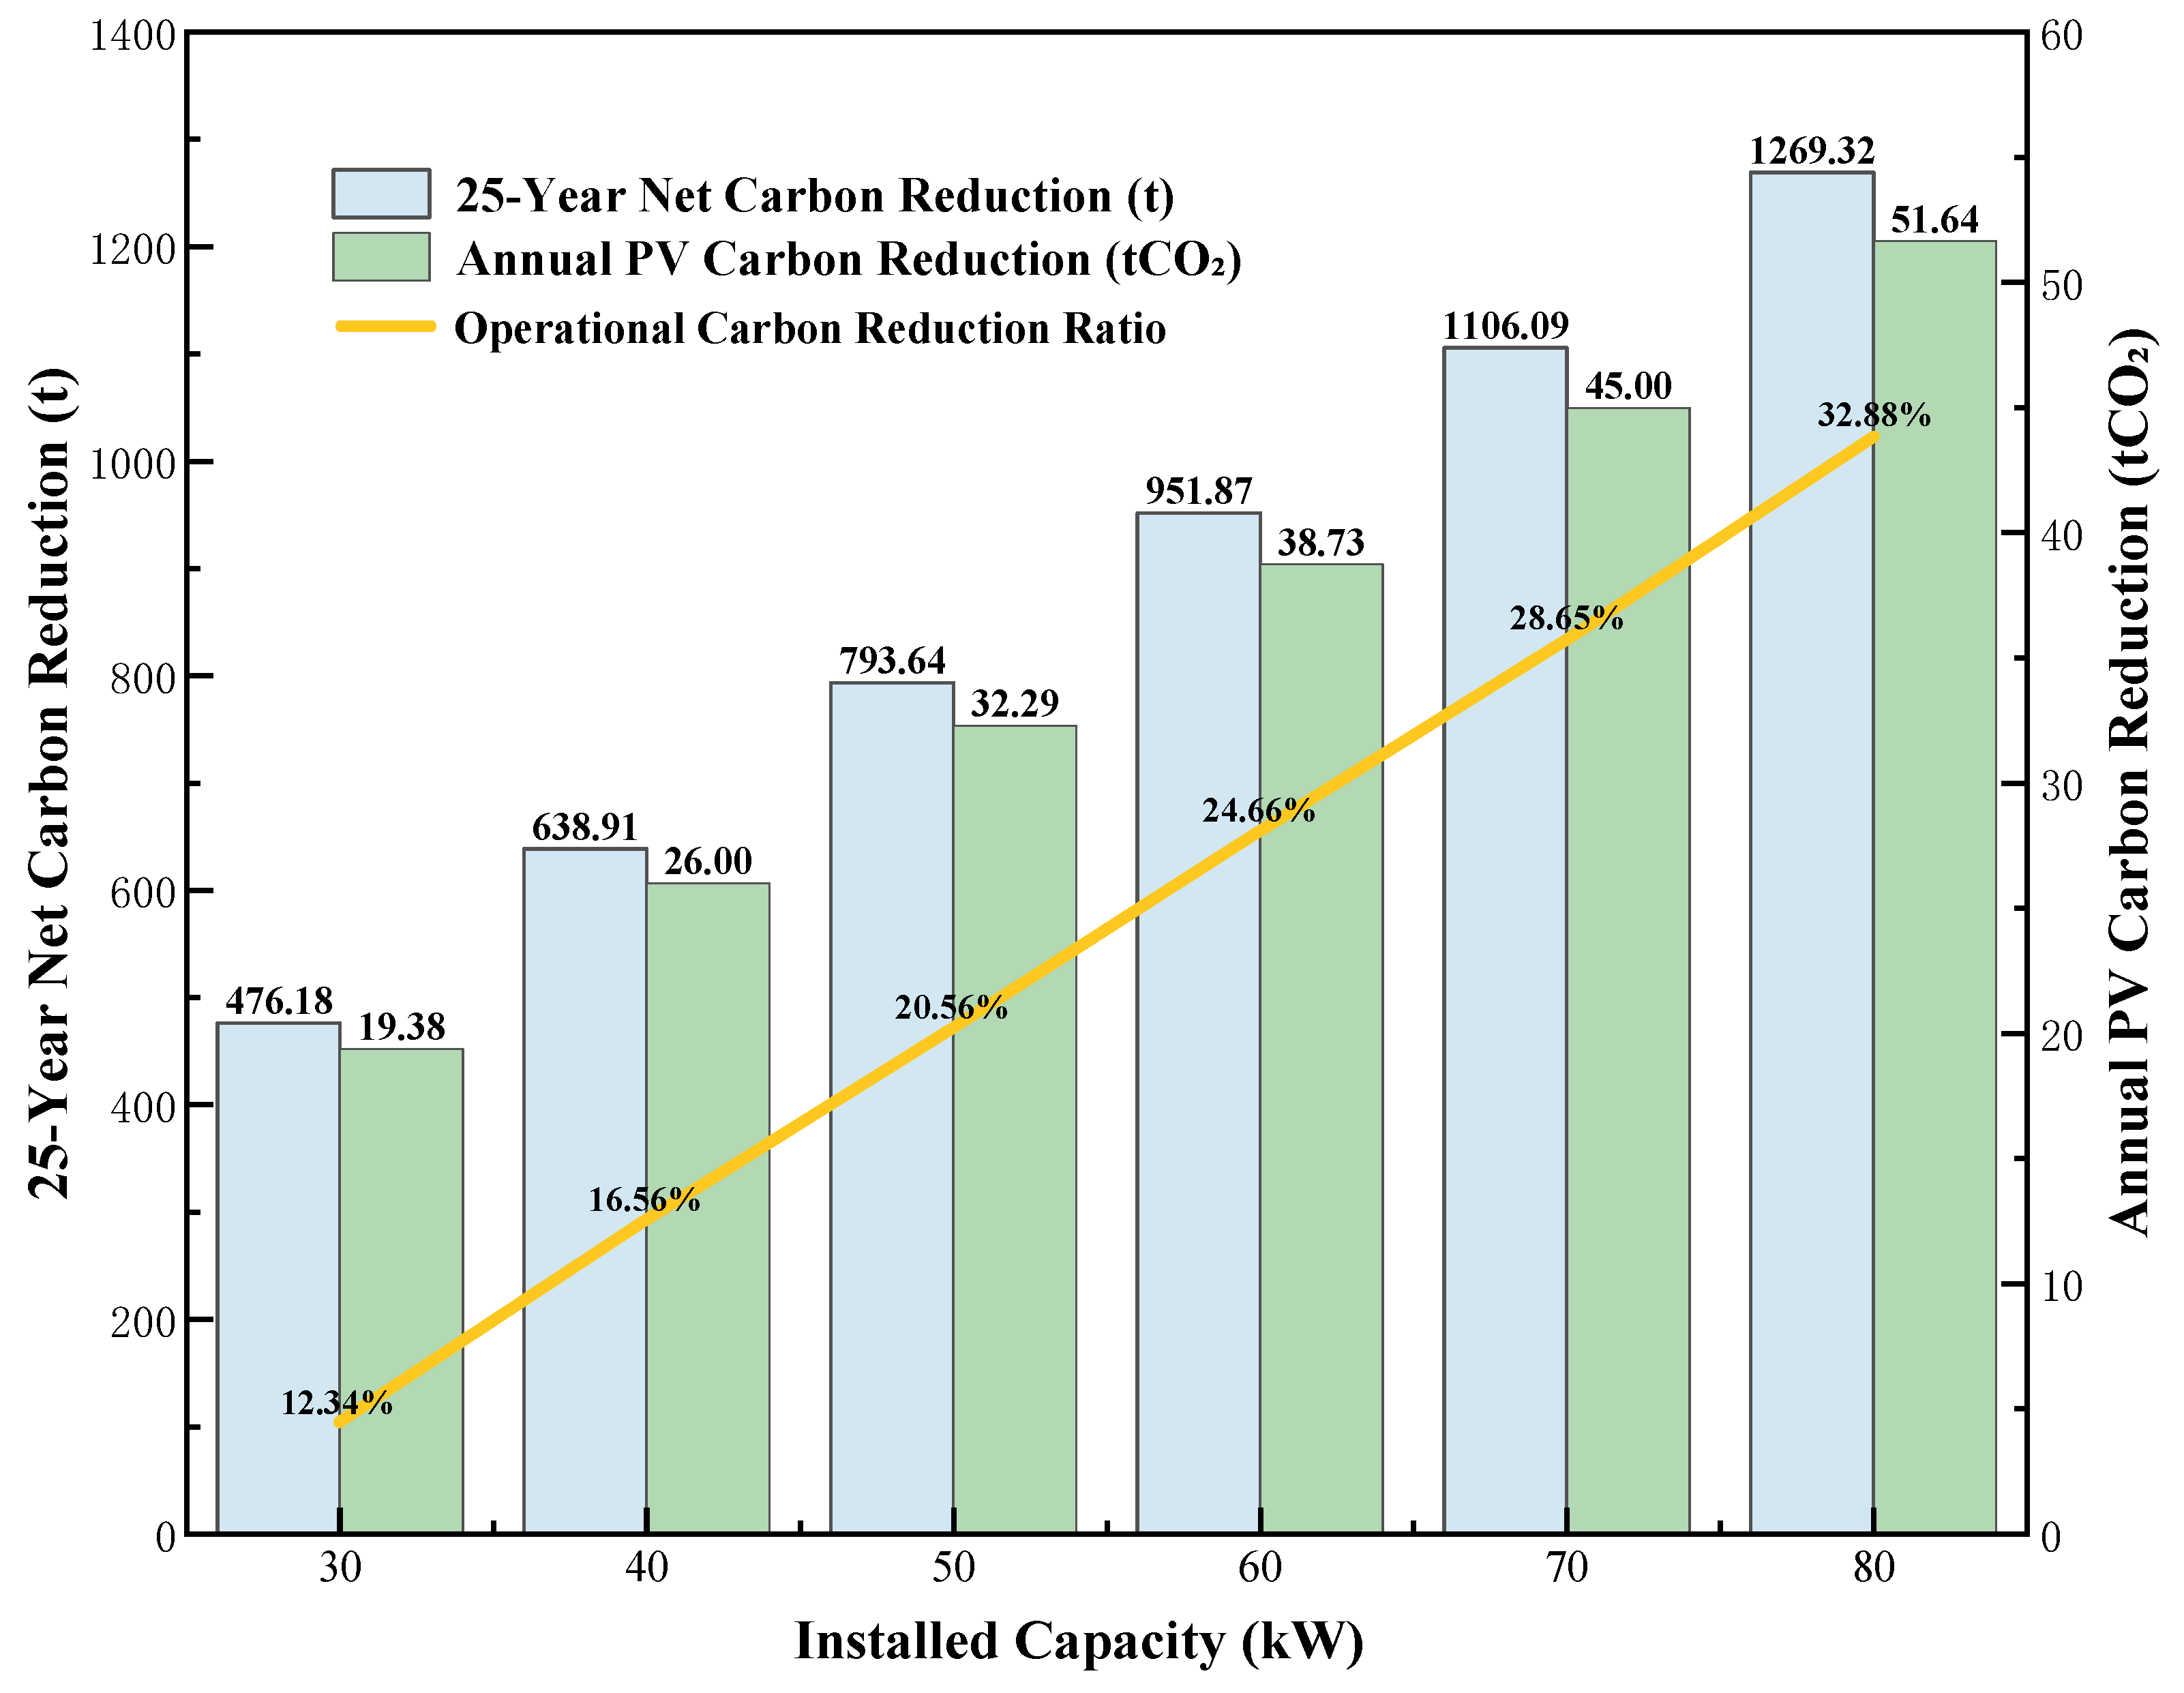
Data analysis (Figure 6, Table 8) shows that the net carbon reduction ranges from 410 tCO2 to 1090 tCO2 across different installed capacities, with a range of 682 tCO2. The data showed an increasing trend; for every 10 kW increase in capacity, the net carbon reduction increased by an average of 137 t, reflecting a linear growth characteristic under economies of scale.
The net carbon reduction in an 80 kW system was 2.66 times that of a 30 kW system. This increase was entirely due to a proportional 2.67 times growth in displaced carbon emissions, while the net carbon reduction intensity per unit capacity remained constant at 13.7 t/kW. This indicates that: (1) the extreme values of carbon reduction are directly determined by the installed capacity scale; and (2) the expansion of scale does not dilute the carbon reduction efficiency per unit capacity, confirming the scalability sustainability of such projects.

4.3.2. Degradation Rate and PV Power Generation

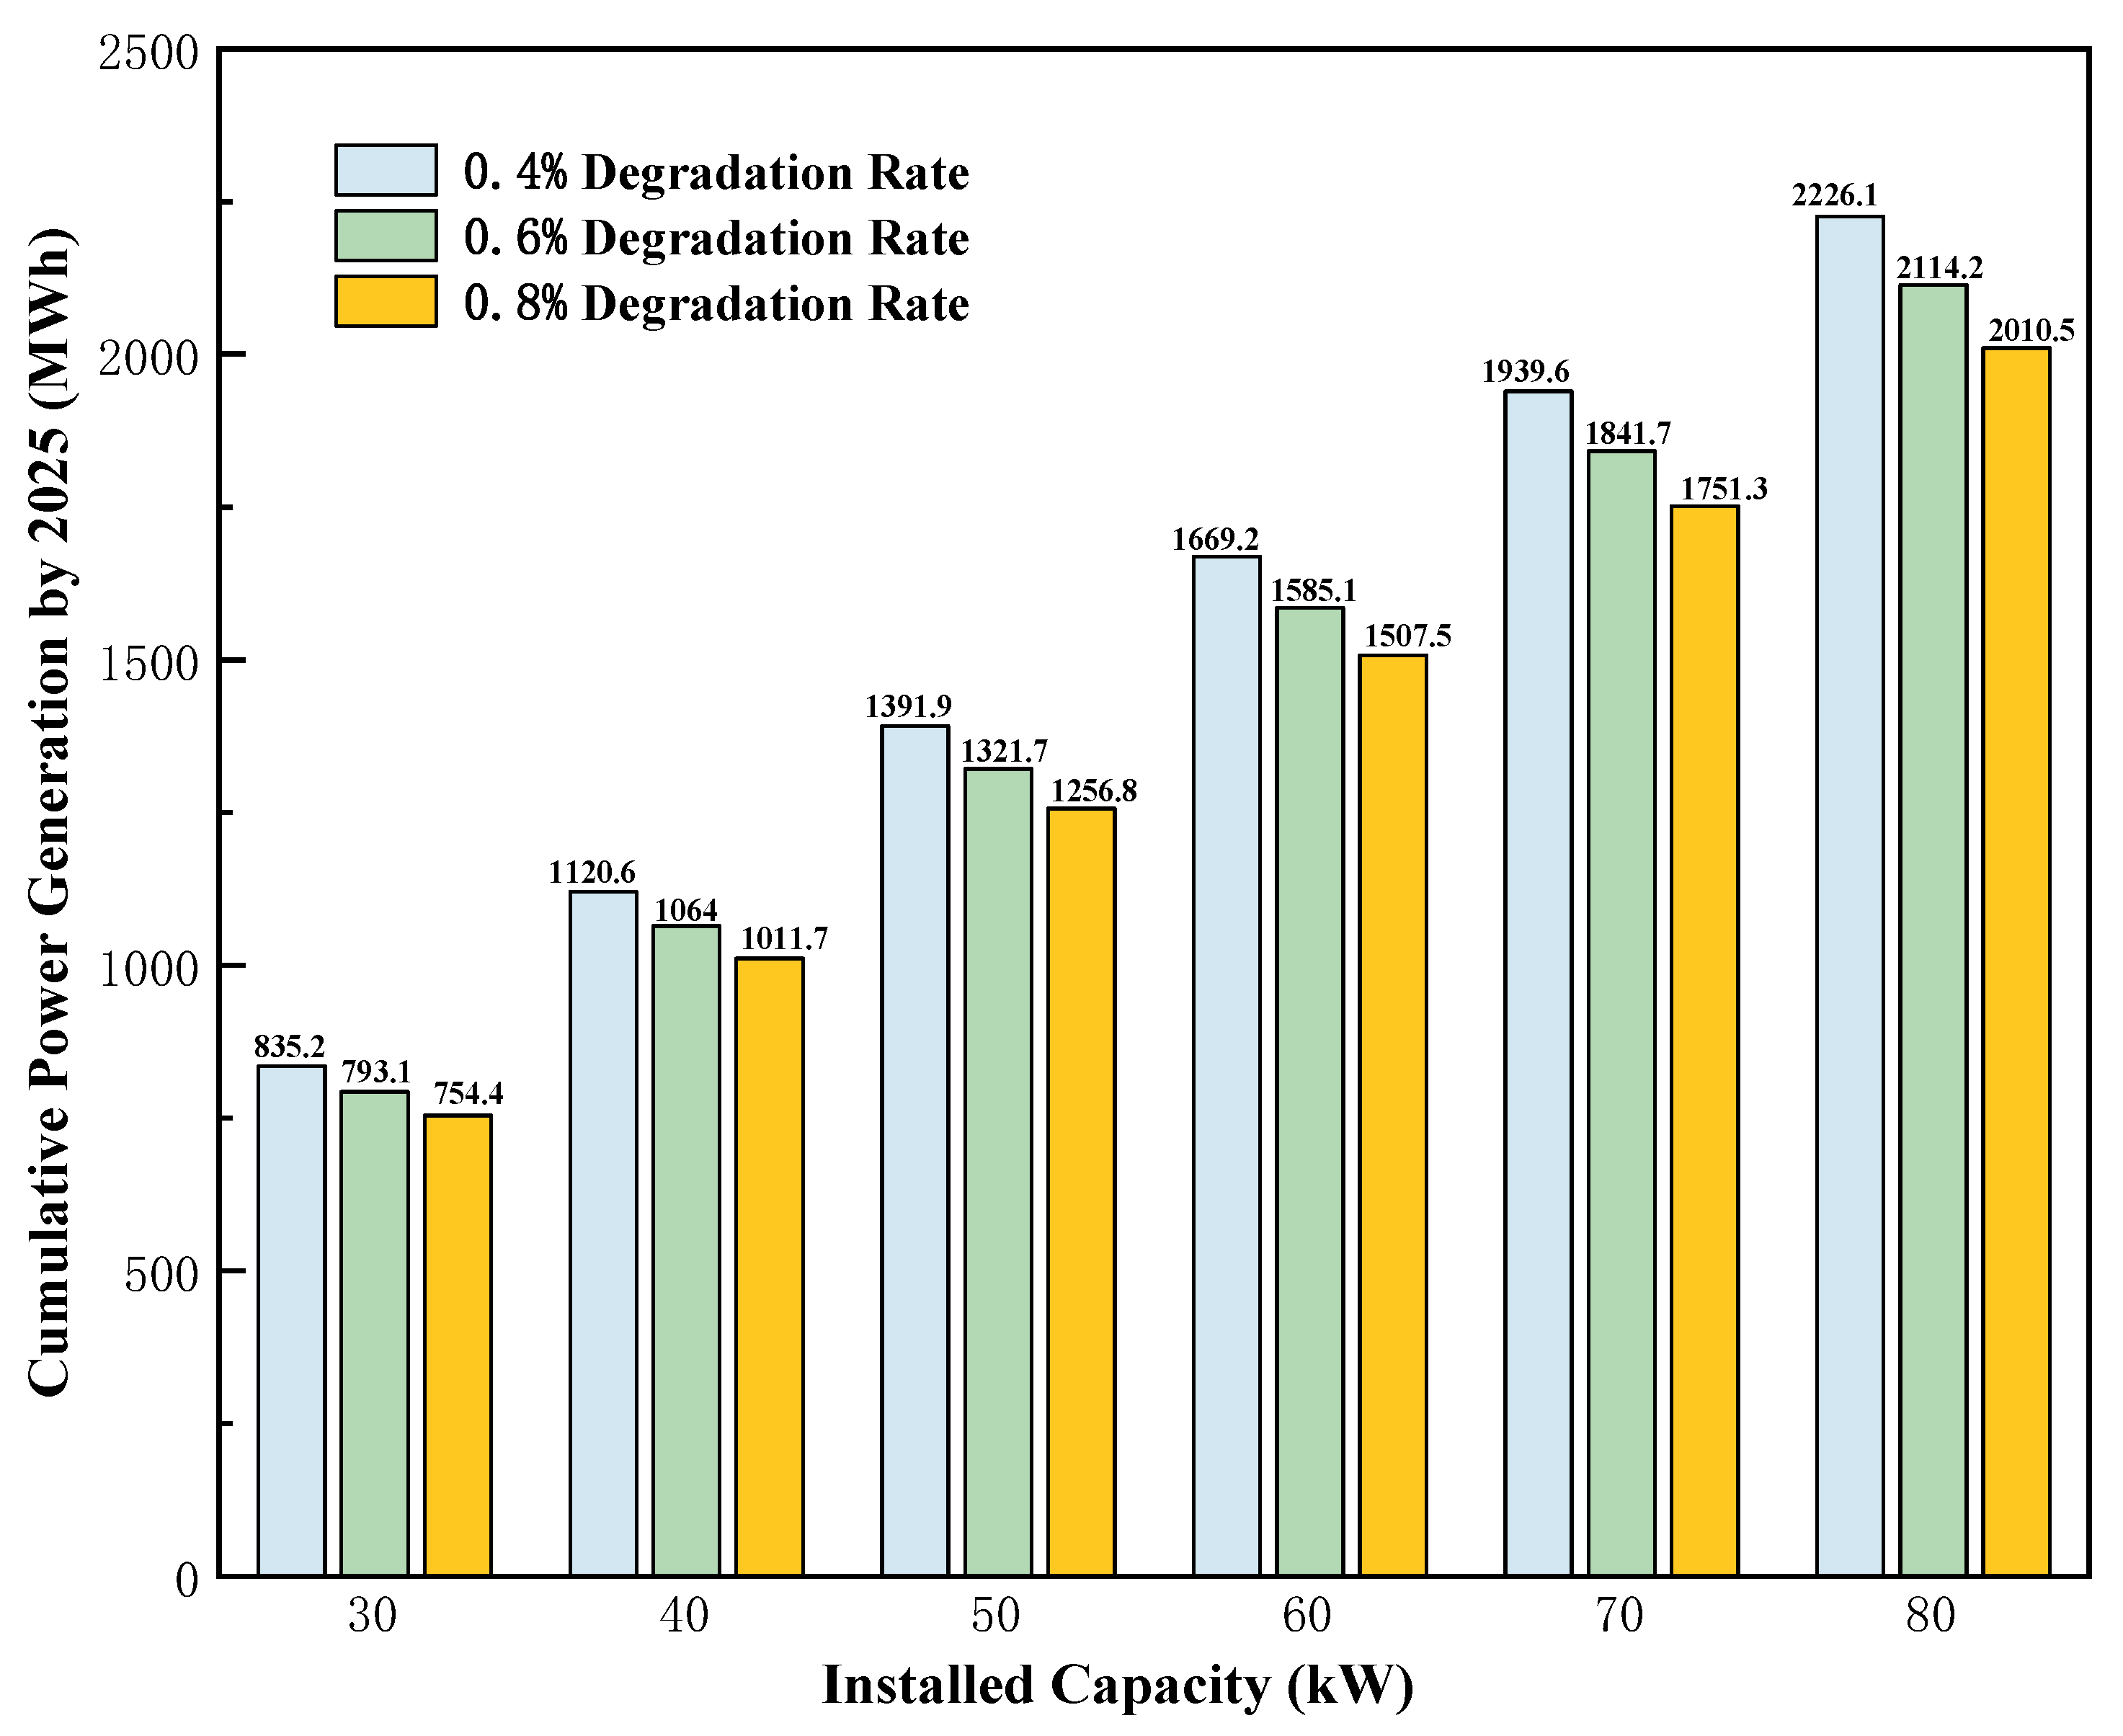
The degradation rate of PV modules directly affects their power output, and the relationship between the two is shown in Figure 7. When the degradation rate increased from 0.40% to 0.60%, the power generation of each capacity system decreased by approximately 5.04–5.05%. For example, the output of the 30 kW system decreased from 835 MWh to 793 MWh, a reduction of 5.04%. When the degradation rate further increased to 0.80%, the power generation reduction expanded to 9.68–9.72%. For instance, the 40 kW system dropped from 1120 MWh to 1010 MWh, a decrease of 9.72%.
Reducing the degradation rate from 0.80% back to 0.40% could recover 9.71% of power generation, equivalent to an additional 135 MWh of electricity, shortening the investment payback period by approximately 1.2 years. Therefore, it is recommended to prioritize PV modules with a degradation rate ≤0.5%. For systems above 50 kW, each 0.1% reduction in the degradation rate can yield an additional ~7 MWh of electricity per 10 kW of capacity.

4.3.3. Self-Consumption Rate and Economic Projection

As shown in Table 9, the installation cost increases linearly with capacity growth from 30 kW to 80 kW: the 30 kW system corresponds to a cost of 101,000 CNY, and each 10 kW increase adds an average of 36,000 CNY, reaching 282,000 CNY at 80 kW. This trend indicates that the marginal installation cost remains relatively stable, consistent with the economies of scale in industrial production.
When the self-consumption rate increases from 70% to 90%, the payback period shortens significantly for all capacity levels. Each 10-percentage-point increase in the self-consumption rate reduces the payback period by approximately 0.54 years on average, demonstrating that the self-use ratio is a core factor influencing investment returns.
The data provide a quantitative basis for PV investment decisions: if the user-side electricity price is high (e.g., ≥0.8 CNY/kWh), efforts should be made to increase the self-consumption rate to over 90%; if the electricity price is relatively low, a balance should be sought between installed capacity and self-consumption rate, with a 50 kW system and 80% self-consumption generally offering optimal comprehensive benefits.

4.3.4. Strategy Analysis

Based on a comprehensive analysis of the aforementioned data and Table 10, the following three schemes have been evaluated. The carbon reduction and economic benefits in each scheme are based on PV modules with a degradation rate of 0.4% and a self-consumption rate of 90%.
  • Optimal Comprehensive Benefits Scheme: 60 kW System
This capacity strikes a balance between carbon reduction efficiency and economic performance, achieving an annual operational carbon reduction of 38.7 tCO2 (24.7% reduction) with a static payback period of 3.53 years. It is suitable for installation on building rooftops with an area of approximately 1436 m2 (equivalent to the building’s base area) and can offset 25% of the building’s annual carbon emissions. This scheme is ideal for public or industrial/commercial projects pursuing long-term cost-effectiveness and carbon reduction goals.
2.
Deep Decarbonization Core Scheme: 80 kW System
As the preferred option for maximizing carbon reduction, this system delivers an annual carbon reduction of 51.6 tCO2, accounting for 32.9% of the building’s operational carbon emissions. Over a 25-year lifecycle, it can accumulate a reduction of 1290 tCO2, equivalent to 16.4% of the building’s operational carbon emissions. The system requires supporting components such as a 72 kWh energy storage system (incremental investment of 64,000 CNY) and lightweight support technology, which can reduce the embodied carbon of materials by 18%. This capacity was determined based on the specific function of providing short-term energy shifting for peak shaving and ensuring critical load coverage during brief grid interruptions. For an 80 kW PV system in Central China’s climate with average peak sun hours of 4.2 h/day, this storage capacity represents approximately 2–3 h of operation at rated power for the critical loads, which aligns with typical design practices for commercial-scale PV-plus-storage systems focused on energy arbitrage and power quality management rather than long-term energy autonomy. It is suitable for industrial parks or large commercial complexes with clear carbon neutrality targets.
3.
Cost-Effective Adaptation Scheme: 40 kW System
Designed for partial retrofits or budget-constrained scenarios, the 40 kW system offers a quick return on investment, with a payback period of approximately 3.49 years and an annual carbon reduction rate of 16.6%. Its advantage lies in its adaptability to non-continuous rooftops, such as podium structures, and its ability to achieve rapid emission reductions through modular deployment. It is well-suited as a demonstration unit for building energy efficiency retrofits.

5. Discussion

This study addresses the issues of fragmented dynamic information flow and insufficient data accuracy in building life-cycle carbon emission assessment by innovatively integrating BIM-based parametric modeling with a collaborative data flow from multiple engineering software tools, including AutoCAD, GTJ 2025, GQI 2021, GCCP V6.0, and PKPM-CES. Several breakthroughs have been achieved:
  • A full-chain data pathway has been established connecting design, quantity takeoff, cost estimation, and carbon accounting, eliminating dynamic information silos.
  • Based on real-time linked data, carbon emissions at each stage—building materials, construction, operation, and demolition—have been accurately quantified.
  • The system is endowed with dynamic responsiveness, enabling immediate updates of the carbon footprint during design changes and solution optimizations.
The research constructs a new paradigm for carbon emission assessment characterized by “BIM-driven, multi-software collaboration, and closed-loop data,” significantly improving the systematicness, accuracy, and practical applicability of the evaluation.
Current promotion of building-integrated photovoltaics faces three major contradictions: the challenge of balancing carbon reduction needs with economic feasibility, the insufficient adaptation of building physical constraints to existing technical solutions, and the conflict between short-term investment returns and long-term deep decarbonization goals. In response, this study innovatively incorporates PV systems as dynamic carbon reduction variables into regional building carbon neutrality pathways. Through a comprehensive evaluation of the “power generation performance–carbon reduction–economic efficiency” of PV systems in Central China, a quantitative response model linking installed PV capacity with carbon reduction efficiency and economic cost has been established for the first time in this region, providing a life-cycle technology integration paradigm for carbon neutrality-oriented projects. Beyond theoretical assessment, this study develops practical implementation pathways (40/60/80 kW systems) with detailed carbon-economic tradeoffs, providing stakeholders with quantitatively supported decision frameworks for PV integration in Central China’s residential buildings based on specific investment capacities and emission reduction targets.
When compared with previous studies on building-integrated PV systems, our results demonstrate distinct advantages in carbon reduction efficiency. The consistent net carbon reduction intensity of 13.7 tCO2/kW established in this study provides a more reliable benchmark for the Central China region compared to the wider variability (10–15 tCO2/kW) reported in broader national studies [8]. Furthermore, our integrated approach yields significantly shorter payback periods (3.5–4.2 years) than the 5–7 year range reported in earlier research 44, demonstrating the combined benefits of optimized tilt angles, regional grid factors, and self-consumption strategies. These improvements highlight the value of our context-specific modeling approach for enhancing both environmental and economic outcomes in regional PV applications.
These findings support region-specific incentive programs that consider local climate and grid conditions. For design practice, the carbon reduction intensity of 13.7 tCO2/kW offers a reliable metric for low-carbon building planning in Central China, while the demonstrated economic viability enhances the argument for integrating PV systems as standard building components, given their competitive payback periods.

6. Conclusions

This study developed a BIM-based integrated framework for life-cycle carbon emission assessment and photovoltaic (PV) carbon reduction strategy optimization, applied to a typical residential building in Central China. The main findings and contributions are summarized as follows:
  • A systematic and accurate approach for quantifying carbon emissions across the building life cycle was established, overcoming the limitations of traditional segmented evaluation methods. The proposed framework integrates design, quantity takeoff, cost estimation, and carbon accounting into a cohesive digital workflow, significantly improving evaluation transparency and reliability.
  • PV systems were introduced as a dynamic carbon reduction variable, and their carbon reduction potential and economic benefits under Central China’s climatic and energy grid conditions were quantitatively analyzed. Multi-scenario simulation results demonstrate that PV integration can effectively reduce operational carbon emissions by 16.56% to 32.88%, depending on system capacity and self-consumption rate.
  • Three practical implementation schemes were proposed—40 kW, 60 kW, and 80 kW systems—to accommodate different investment capacities and emission reduction goals. Among these, the 60 kW system achieved the best balance between cost and carbon reduction performance, with a payback period of 3.53 years and an annual carbon reduction of 38.73 tCO2.
  • The research provides a technically and economically feasible pathway for supporting the low-carbon transition of residential buildings in the region, offering both theoretical and practical references for similar projects.
However, several limitations remain in the current approach. These include static assumptions for PV system operation that neglect dynamic elements such as smart load scheduling and real-time electricity pricing, as well as the exclusion of socio-behavioral factors. Additionally, energy consumption profiles, though based on standardized schedules, may diverge from actual usage, and transportation distances were estimated using regional averages. The discussion of the inherent limitations of the BIM-LCA integration—such as data granularity and model interoperability—also requires further critical depth. Moreover, as this study is based on a single residential case in Xiangyang, the generalizability of the findings is limited and region-specific factors should be explicitly acknowledged. Future work will focus on integrating reinforcement learning for dynamic energy management and incorporating behavioral factors to enhance model accuracy and applicability.

Author Contributions

Methodology, Y.G.; Validation, W.M.; Formal analysis, Y.G.; Investigation, S.X.; Resources, X.C.; Data curation, S.X.; Writing—original draft, Y.G.; Writing—review and editing, W.M. and X.C.; Visualization, Y.G. and S.X.; Supervision, Y.L. and S.X.; Project administration, Y.L.; Funding acquisition, Y.L. All authors have read and agreed to the published version of the manuscript.

Funding

This research was funded by the Key Project of Joint Fund of the Hubei Provincial Natural Science Foundation for Innovation and Development (2022CFD009), and the Project on Scientific Innovation in Solid Waste Recycling and Reuse (2023pytd01).

Data Availability Statement

The datasets are available upon reasonable request from the corresponding author.

Acknowledgments

The authors gratefully acknowledge the financial support provided by the Project on Scientific Innovation in Solid Waste Recycling and Reuse (2023pytd01) and the Key Project of Joint Fund for Innovation and Development of Hubei Provincial Natural Science Foundation (Grant No. 2022CFD009).

Conflicts of Interest

Authors Yexue Li and Shanshan Xie employed by the company Hubei Key Laboratory of Vehicle-Infrastructure Collaboration and Traffic Control. Author Xuzhi Chen employed by the company Hubei Gongjian Hanjiang Engineering Co., Ltd. The remaining authors declare that the research was conducted in the absence of any commercial or financial relationships that could be construed as a potential conflict of interest.

References

  1. Marzouk, O.A. Summary of the 2023 report of TCEP (tracking clean energy progress) by the International Energy Agency (IEA), and proposed process for computing a single aggregate rating. In E3S Web of Conferences; EDP Sciences: Les Ulis, France, 2025; Volume 601, p. 00048. [Google Scholar]
  2. China Association of Building Energy Efficiency. China Building Energy Consumption and Carbon Emissions Research Report (2024). 2024. Available online: https://www.cabee.org/ (accessed on 8 September 2025).
  3. Hubei Province Department of Housing and Urban-Rural Development; Hubei Province Development and Reform Commission. Hubei Province Urban and Rural Construction Carbon Peak Implementation Plan. 2023. Available online: http://dzb.jzsbs.com/epaper/jzsb/pc/content/202308/24/content_22371.html (accessed on 8 September 2025).
  4. Zhao, S.; Qu, X.; Zhao, X. The carbon emissions of prefabricated building in urban renewal: Assessment and emission reduction path. Energy Build. 2025, 341, 115830. [Google Scholar] [CrossRef]
  5. Kee, T.; Fu, F. Applying information gap decision theory for uncertainty management in building lifecycle assessment. Buildings 2024, 14, 3729. [Google Scholar] [CrossRef]
  6. Borkowski, A.S. Evolution of BIM: Epistemology, genesis and division into periods. J. Inf. Technol. Constr. 2023, 28, 646–661. [Google Scholar] [CrossRef]
  7. Aziminezhad, M.; Taherkhani, R. BIM for deconstruction: A review and bibliometric analysis. J. Build. Eng. 2023, 73, 106683. [Google Scholar] [CrossRef]
  8. Wang, L.; Qiu, T.; Zhang, M.; Cao, Q.; Qin, W.; Wang, S.; Wang, L.; Chen, D.; Wild, M. Carbon emissions and reduction performance of photovoltaic systems in China. Renew. Sustain. Energy Rev. 2024, 200, 114603. [Google Scholar] [CrossRef]
  9. Chen, T.; Zhang, N.; Ye, Z.; Jiang, K.; Lin, Z.; Zhang, H.; Xu, Y.; Liu, Q.; Huang, H. Carbon reduction benefits of photovoltaic-green roofs and their climate change mitigation potential: A case study of Xiamen city. Sustain. Cities Soc. 2024, 114, 105760. [Google Scholar] [CrossRef]
  10. Deng, Y.; Wu, J.; Yang, Q.; Chen, W.; Li, P.; Huang, C.; Deng, J.; Ji, B.; Xie, L. Life cycle-based carbon emission reduction benefit assessment of centralized photovoltaic power plants in China. Sustainability 2023, 15, 16323. [Google Scholar] [CrossRef]
  11. Lee, S.; Jung, C.; Ahn, Y. Economic Viability of Photovoltaic Systems Based on the Number of Floors in Modular Multi-Family Housing in Korea. Energies 2024, 17, 6281. [Google Scholar] [CrossRef]
  12. Asif, M.; Naeem, G.; Khalid, M. Digitalization for sustainable buildings: Technologies, applications, potential, and challenges. J. Clean. Prod. 2024, 450, 141814. [Google Scholar] [CrossRef]
  13. Miettinen, R.; Paavola, S. Beyond the BIM utopia: Approaches to the development and implementation of building information modeling. Autom. Constr. 2014, 43, 84–91. [Google Scholar] [CrossRef]
  14. Jia, Y.; Hosseini, M.R.; Zhang, B.; Martek, I.; Nikmehr, B.; Wang, J. A scientometric-content analysis of integration of BIM and IoT. IOP Conf. Ser. Earth Environ. Sci. 2022, 1101, 072002. [Google Scholar] [CrossRef]
  15. Qiao, P. The Application Research of BIM and IoT Technology Integration in Construction Engineering. Acad. J. Archit. Geotech. Eng. 2023, 5, 35–45. [Google Scholar]
  16. Cui, W.; Chen, Y.; Xu, B. Application research of intelligent system based on BIM and sensors monitoring technology in construction management. Phys. Chem. Earth Parts A/B/C 2024, 134, 103546. [Google Scholar] [CrossRef]
  17. Zhao, L.; Zhang, H.; Wang, Q.; Wang, H. Digital-twin-based evaluation of nearly zero-energy building for existing buildings based on scan-to-BIM. Adv. Civ. Eng. 2021, 2021, 6638897. [Google Scholar] [CrossRef]
  18. Pan, Y.; Zhang, L. Integrating BIM and AI for smart construction management: Current status and future directions. Arch. Comput. Methods Eng. 2023, 30, 1081–1110. [Google Scholar] [CrossRef]
  19. Zhang, Y.; Jiang, X.; Cui, C.; Skitmore, M. BIM-based approach for the integrated assessment of life cycle carbon emission intensity and life cycle costs. Build. Environ. 2022, 226, 109691. [Google Scholar] [CrossRef]
  20. Jamaludin, F.A.B.; Li, J. Research on low-carbon evaluation of green buildings based on the whole life cycle theory. SN Appl. Sci. 2023, 5, 262. [Google Scholar] [CrossRef]
  21. Chen, F.; Yang, Y.; Li, J.; Tian, A. Calculation and evaluation of building thermal energy consumption and carbon emissions based on BIM technology. Therm. Sci. 2023, 27 Pt A, 1223–1230. [Google Scholar] [CrossRef]
  22. Yang, Y.; Yue, X.; Luo, Y.; Jin, L.; Jia, B. Building Information Modeling–Life Cycle Assessment: A Novel Technology for Rapid Calculation and Analysis System for Life Cycle Carbon Emissions of Bridges. Sustainability 2024, 16, 10574. [Google Scholar] [CrossRef]
  23. Arsentev, M.Y.; Sysoev, E.I.; Vorobyov, S.A.; Balabanov, S.V.; Diachenko, S.V.; Sychov, M.M.; Skorb, E.V. Crystal-inspired cellular metamaterials with reduced Poisson’s ratio as analogues of TPMS. Compos. Struct. 2025, 363, 119097. [Google Scholar] [CrossRef]
  24. Wan, F.; Guo, Y.; Ge, K.; Zhuang, S.; Elghazouli, A.Y. Mechanical properties of sustainable engineered geopolymer composites with sodium carbonate activators. J. Build. Eng. 2025, 105, 112486. [Google Scholar] [CrossRef]
  25. Zhang, J.; Guner, T.; Bursi, O.S.; Lu, Z. Seismic steel frames enhanced with locally resonant metastructures for reduced embodied carbon. Eng. Struct. 2025, 335, 120211. [Google Scholar] [CrossRef]
  26. Li, X.; Xie, W.; Yang, T.; Lin, C.; Jim, C.Y. Carbon emission evaluation of prefabricated concrete composite plates during the building materialization stage. Build. Environ. 2023, 232, 110045. [Google Scholar] [CrossRef]
  27. Yang, K.; Huo, Z.; Du, N.; Li, J.; Chai, Y.; Chen, Y. Experimental investigation of the performance of an innovative delignified wood-based phase change roof integrated with sky radiation cooling. Energy 2025, 325, 136163. [Google Scholar] [CrossRef]
  28. Wen, S.; You, R.; Chen, Q. Implementing building retrofitting strategies to halve campus office building carbon emissions by 2035: A case study in Hong Kong with techno-economic analysis. Energy Build. 2025, 338, 115705. [Google Scholar] [CrossRef]
  29. Ouria, M.; Moura, P.; Ouria, A.; de Almeida, A.T. Multi-objective architectural parametric optimization toward decarbonizing building sector-Tabriz city case study. J. Build. Eng. 2025, 105, 112422. [Google Scholar] [CrossRef]
  30. Li, Y.; Feng, H. Comprehensive spatial LCA framework for urban scale net zero energy buildings in Canada using GIS and BIM. Appl. Energy 2025, 388, 125649. [Google Scholar] [CrossRef]
  31. International Organization for Standardization. ISO 14040:2006; Environmental management–Life cycle assessment—Principles and framework. ISO: Geneva, Switzerland, 2006.
  32. International Organization for Standardization. ISO 14044:2006; Environmental management–Life cycle assessment—Requirements and guidelines. ISO: Geneva, Switzerland, 2006.
  33. Payandeh, Z.; Mesri-Gundoshmian, T.; Jahanbakhshi, A.; Shahgholi, G.H.; Rossi, L.; Bacenetti, J. Optimization of environmental and energy performance of egg production using data envelopment analysis (DEA) and life cycle assessment (LCA). Sci. Total Environ. 2025, 963, 178493. [Google Scholar] [CrossRef] [PubMed]
  34. Aruta, G.; Ascione, F.; Bianco, N.; Mauro, G.M. Incentive policies for building energy retrofit: A new multi-objective optimization framework to trade-off private and public interests. J. Clean. Prod. 2025, 498, 145142. [Google Scholar] [CrossRef]
  35. Guo, X.; Lin, K.; Huang, H.; Li, Y. Carbon footprint of the photovoltaic power supply chain in China. J. Clean. Prod. 2019, 233, 626–633. [Google Scholar] [CrossRef]
  36. Yu, Z.; Chen, C.; Lou, D.; Jiang, J.; Ye, B. Energy-economy-environment evaluation of building-integrated photovoltaic considering facade factors for representative megacities in China. Appl. Energy 2025, 389, 125839. [Google Scholar] [CrossRef]
  37. Lodhi, M.K.; Tan, Y.; Wang, X.; Suprijanto, A.; Imran, M. Advancing urban solar assessment: A deep learning and atmospheric modelling framework for quantifying PV yield and carbon reduction. Energy Build. 2025, 338, 115717. [Google Scholar] [CrossRef]
  38. Buyak, N.; Deshko, V.; Borodinecs, A.; Bilous, I.; Naumchuk, O.; Sukhodub, I. Assessment of strategies for low-carbon regeneration of buildings in Eastern Europe. Energy 2025, 325, 136069. [Google Scholar] [CrossRef]
  39. Arogundade, S.; Dulaimi, M.; Ajayi, S. Holistic review of construction process carbon-reduction measures: A systematic literature review approach. Buildings 2023, 13, 1780. [Google Scholar] [CrossRef]
  40. Huang, Z.; Zhou, H.; Miao, Z.; Tang, H.; Lin, B.; Zhuang, W. Life-cycle carbon emissions (LCCE) of buildings: Implications, calculations, and reductions. Engineering 2024, 35, 115–139. [Google Scholar] [CrossRef]
  41. National Standardization Administration of China. GB 55015-2021; General Code for Energy Efficiency and Renewable Energy Application in Buildings. China Architecture & Building Press: Beijing, China, 2021.
  42. Islam, M.A.; Ali, M.N.; Benitez, I.B.; Habib, S.S.; Jamal, T.; Flah, A.; Blazek, V.; El-Bayeh, C.Z. A comprehensive evaluation of photovoltaic simulation software: A decision-making approach using Analytic Hierarchy Process and performance analysis. Energy Strategy Rev. 2025, 58, 101663. [Google Scholar] [CrossRef]
  43. Dincer, F.; Ozer, E. Optimization of Rear-Side Energy Contribution in Bifacial PV Panels: A Parametric Analysis on Albedo, Tilt, Height, and Mounting Configuration. Energies 2025, 18, 4443. [Google Scholar] [CrossRef]
  44. Fares, H.; Lobaccaro, G.; Gazbour, N.; Rasmussen, F.N.; Chèze, D.; Le Pierrès, N.; Wurtz, E. A methodology for assessing environmental impact of building integrated PV in low carbon footprint electricity generation context. Energy Build. 2025, 329, 115219. [Google Scholar] [CrossRef]
  45. Farungsang, L.; Varquez, A.C.G.; Tokimatsu, K. Geospatial Assessment and Economic Analysis of Rooftop Solar Photovoltaic Potential in Thailand. Sustainability 2025, 17, 7052. [Google Scholar] [CrossRef]
Figure 1. Research Framework Diagram.
Buildings 15 04232 g001
Figure 2. System Boundary for Carbon Emission Calculation.
Buildings 15 04232 g002
Figure 3. BIM Model of the Case Building: (a): Civil Engineering Model; (b): Energy Consumption Model.
Buildings 15 04232 g003
Figure 4. Top 10 Material Production & Transportation Carbon Emissions.
Buildings 15 04232 g004
Figure 5. Carbon Emission Analysis of Various Systems in the Operational Phase.
Buildings 15 04232 g005
Figure 6. PV Carbon Reduction Data Analysis.
Buildings 15 04232 g006
Figure 7. Analysis of PV Degradation Rate and Power Generation Relationship.
Buildings 15 04232 g007
Table 1. Software Platform Description.
Software ToolPublisherDescription
AutoCAD 2023AutodeskProvides precise tools for architecture, engineering, and construction professionals to design and annotate 2D and 3D models. Leverages AI for automated drafting and supports custom toolkits to improve efficiency.
Glodon GTJ 2025GlodonIntegrates big data, BIM, and cloud technologies to deliver detailed quantity calculation services for the cost estimation field. Supports cloud-based collaboration and enables real-time calculation, enhancing efficiency and cost control.
Glodon GQI 2021GlodonTargets all installation disciplines in civil buildings, supporting both BIM-based and manual calculation modes. Addresses the low efficiency and high difficulty of traditional manual quantity takeoff through intelligent recognition and 3D visualization.
Glodon GCCP V6.0GlodonA cloud-based costing platform dedicated to providing digital transformation solutions for construction project costing. Utilizes cloud computing, big data, and AI technologies to significantly improve the user experience of costing software.
Table 2. Software Data Integration Workflow.
Processing StageSoftware PlatformData FormatPrimary Function
Drawing CreationAutoCADDWG/DXFBase drawing development and revision
Structural ModelingGlodon GTJ 2025GTJStructural model creation and quantity calculation
MEP ModelingGlodon GQI 2021GQI4Mechanical/electrical/plumbing modeling and quantity calculation
Cost EstimationGlodon GCCP V6.0GBQ6/ExcelQuantity-to-cost conversion and pricing
Carbon CalculationPKPM-CESProject filesCarbon emission simulation and computation
Table 3. Electricity Price and Meteorological Data for Xiangyang Region.
ParameterValue for Xiangyang Region
Annual Peak Sun Hours4.2 h/day (measured)
Average Annual Humidity72%
Grid Carbon Factor0.58 kgCO2eq/kWh
On-grid Electricity Price0.35 CNY/kWh
Subsidy PolicySubsidy 0.42 CNY/kWh (Hydropower + Thermal Power)
Industrial Electricity Price1.15 CNY/kWh (1–10 kV)
Table 4. Life Cycle Carbon Emissions.
NameCarbon Emissions (tCO2)Carbon Emissions Per Unit Area (kgCO2/m2)Annual Carbon Emissions Per Unit Area (kgCO2/m2·a)Proportion of Carbon Emissions
Embodied carbon459057411.4736.58%
Construction90.911.40.230.72%
Operation785098119.6162.54%
Demolition192.370.050.15%
Total12600157031.36
Table 5. Top 10 Material Carbon Emissions.
ConcreteBricksInsulation MaterialsSteel RebarMortarMetal MaterialsWoodWaterproof MaterialsFloor TilesPlastic Film
Prod. Emission (%)23.8320.8818.4411.079.325.964.002.181.250.89
Transp. Emission (%)43.2334.740.831.073.970.760.670.133.390.05
Table 6. Energy Consumption of Various Systems in the Operational Phase.
Energy Consumption (kWh)
HeatingAir ConditioningLightingEquipmentDomestic Hot WaterTotal
Region
Central China 186,85788,994.149,662.431,275.7124,807.49481,596.28
Table 7. Lighting System Design Parameters.
Room TypeArea (m2)Lighting Power Density (W/m2)
Bedrooms51106.0
Bathrooms13706.0
Staircases7422.0
Table 8. Power Generation of PV Systems with Different Installed Capacities.
Installed Capacity
(kW)
Embodied Carbon (t)Displaced Carbon Emissions(t)EnergyPV Power Output (MWh)
300.066747633.4835
400.088963944.81120
500.11179455.71390
600.13395266.81670
700.156111077.61940
800.178127089.02230
Table 9. Economic Payback Period of PV Investment.
Installed Capacity
(kW)
Installation Cost (10k CNY)70% Self-Consumption (Years)80% Self-Consumption (Years)90% Self-Consumption (Years)Reduction (90% vs. 70%)
3010.13.983.713.460.52
4013.74.013.743.490.52
5017.24.053.773.510.54
6020.74.073.793.530.54
7024.64.163.873.60.56
8028.24.143.853.580.56
Table 10. Analysis Data of Three Proposed Solutions.
Indicator40 kW System60 kW System80 kW System
Annual Carbon Reduction (tCO2)26.038.751.6
Carbon Reduction (%)16.624.732.9
Payback Period (years)3.493.533.58
Roof Space Required (m2)180360480
Disclaimer/Publisher’s Note: The statements, opinions and data contained in all publications are solely those of the individual author(s) and contributor(s) and not of MDPI and/or the editor(s). MDPI and/or the editor(s) disclaim responsibility for any injury to people or property resulting from any ideas, methods, instructions or products referred to in the content.