Abstract
Corrosion of rock bolts in engineering exhibits random spatial distribution characteristics. To elucidate the influence mechanism of stochastic corrosion on the surface of rock bolts on the propagation behavior of ultrasonic guided waves, this study establishes a finite element model of rock bolts that incorporates stochastic corrosion characteristics. The coupled effects of corrosion depth and area ratio on guided wave propagation characteristics, time-domain response, energy distribution, and wave velocity variation are systematically investigated. Results indicate that corrosion depth and area ratio synergistically deteriorate guided wave morphology, transforming the stress field from symmetric and uniform to asymmetric and spiral. Reflections, scattering, and mode conversion induced by defects lead to a significant increase in the attenuation rate of pulse amplitude, with the two parameters governing the vertical interaction intensity and horizontal interference scope, respectively. Analysis of the Hilbert curve reveals that corrosion characteristics disrupt energy concentration. Under constant corrosion depth, an increase in area ratio disperses energy toward delayed scattered waves, while under constant area ratio, greater corrosion depth reduces the peak amplitude of the envelope curve. Overall, the energy integral exhibits an increasing trend with the degree of corrosion, whereas the peak-to-peak wave velocity shows a declining trend. The established multivariate nonlinear model accurately describes the coupled influence of corrosion parameters on wave velocity. This stochastic corrosion model overcomes the limitations of traditional simplified models and provides critical theoretical support for parameter calibration and engineering application of ultrasonic guided wave technology in the quantitative assessment of rock bolt corrosion.
1. Introduction
Rock bolt support technology is a core reinforcement method in geotechnical engineering such as tunnels, mines, and slope stabilization [,]. However, rock bolts are prone to corrosion in harsh engineering environments characterized by darkness, humidity, and corrosiveness, which leads to a reduction in the effective cross-sectional area, degradation of mechanical properties, and even instability of the anchoring system, resulting in engineering disasters. Therefore, accurate detection of rock bolt corrosion is of great significance [,,,].
Traditional detection methods, such as pull-out tests, are post-event sampling inspections that are destructive and fail to fully evaluate the overall health status of rock bolts [,,]. Consequently, Non-Destructive Testing (NDT) technology has attracted widespread attention in the field of rock bolt detection due to its ability to obtain internal information without damaging the structure [,,,,,]. Among various NDT techniques, ultrasonic guided wave technology is regarded as a highly promising detection method owing to its advantages of long propagation distance, high detection efficiency, and sensitivity to structural defects [,]. Existing studies have verified the feasibility of this technology in detecting anchoring length and macroscopic defects [,,,,], and have further explored the propagation mechanism and dispersion characteristics of guided waves in rock bolts [,,].
In fact, the corrosion of rock bolts, especially pitting corrosion, exhibits significant random distribution characteristics in space (Figure 1) [,,,,,]. The harmfulness of corrosion depends on the combined effect of local corrosion depth and distributed area. However, existing studies have not systematically revealed the influence mechanism of these two key parameters on the propagation characteristics of guided waves [,], which severely limits the accuracy and reliability of ultrasonic guided wave technology in the quantitative evaluation of rock bolt corrosion.
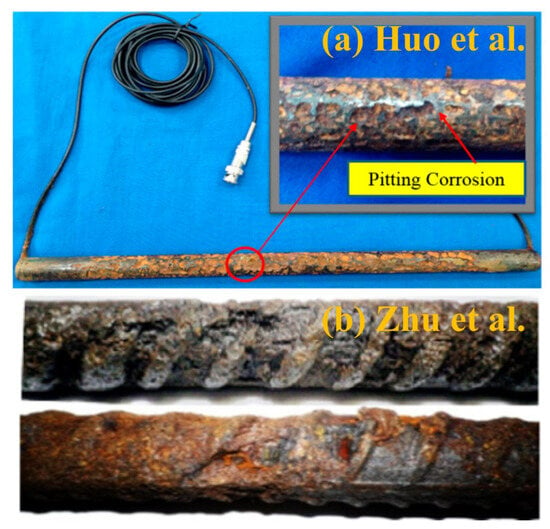
Figure 1.
Distribution characteristics of steel bar corrosion [,]: (a) Pitting corrosion; (b) Non-uniformly distributed corrosion.
Based on this, this study establishes a free bolt model with random corrosion using the Abaqus 2022 finite element software, accurately characterizing the two variables of corrosion depth and area ratio. The coupled influence mechanism of corrosion parameters on the propagation characteristics, time-domain waveform, energy distribution, and wave velocity of guided waves is revealed. This research can provide a theoretical basis for subsequent studies on the propagation mechanism of ultrasonic guided waves in anchoring systems with corrosion defects.
2. Experimental Methods
2.1. Numerical Model and Experimental Scheme
To avoid signal interference caused by medium coupling and boundary constraints in the anchoring system, a free bolt model is established to investigate the relationship between the morphology of random corrosion and the propagation characteristics of guided waves under idealized conditions. Studies by some scholars have shown that when the ratio of wavelength to rib size is large, the presence of ribs has a minimal impact on the propagation characteristics of ultrasonic guided waves in steel bars [,,,]. Therefore, this study uses a simplified solid steel bar bolt model to simulate ribbed steel bars.
Figure 2 shows the numerical model of rock bolts with random corrosion characteristics developed based on the Abaqus 2022 finite element analysis software. The length and diameter of the rock bolt model are 1000 mm and 20 mm, respectively. In this study, defect model is established by first constructing mesh models with different corrosion depths and then deleting elements. Therefore, it is necessary to first ensure a consistent number of elements on the outer surface of the rock bolt and define an element set representing the material surface layer. Subsequently, according to the preset damage ratio, a random sampling algorithm without replacement is used to select a corresponding number of elements from this set with equal probability for deletion. During this process, each element in the set has an equal chance of being selected, thereby ensuring the randomness and unbiasedness of the damage area distribution in space from a statistical perspective. This treatment method can simulate the common corrosion morphology that is uniformly and randomly distributed on a macroscopic scale in actual engineering structures. Considering the requirements of mesh division and practical conditions, the size of a single defect is set to 4 mm × 4 mm. In this study, 6 types of corrosion area ratios (5–30%) and 5 types of corrosion depths (0.5–2.5 mm) are set. The specific experimental working conditions are shown in Table 1.
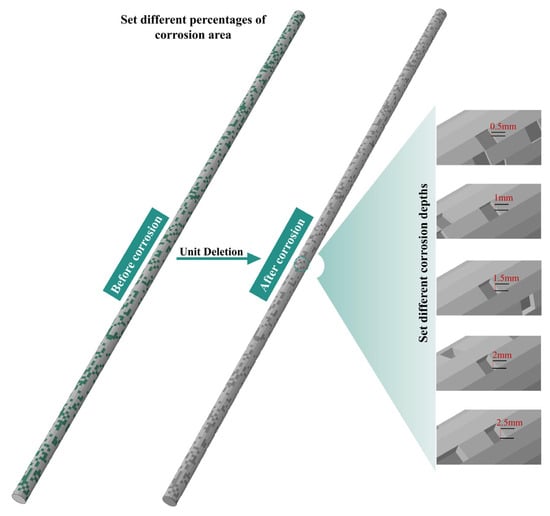
Figure 2.
Random corrosion distribution characteristics of rock bolts.

Table 1.
Experimental scheme.
Considering that the simulation of ultrasonic guided waves belongs to the category of transient dynamics and the wavelength of guided waves is small, the number of meshes is relatively large. To improve the convergence of the wave iteration calculation of the model, this chapter used the explicit dynamic analysis in the ABAQUS/Explicit module to simulate the propagation of guided waves in rock bolts. For more accurate analysis, the analysis step length was set to 0.001 s, and the time increment was 2 × 10⁻⁷ s. To avoid numerical oscillation, the model damping is defined by setting volume viscosity, where the linear volume viscosity and quadratic volume viscosity are set to 0.06 and 1.2, respectively. To balance calculation accuracy and efficiency, the model element type is set to C3D8R, which is more suitable for transient dynamic analysis of elastic solids. The rock bolt adopts elastic constitutive parameters, and the specific material parameters are shown in Table 2.

Table 2.
Material parameters.
2.2. Boundary and Load Conditions
After establishing the model, it is necessary to define a reasonable excitation signal and its application method to reduce the dispersion and multi-mode phenomena of ultrasonic guided waves during propagation. Figure 3 shows the group velocity dispersion curve of the steel rock bolt. It can be observed from the dispersion curve that in the frequency range of 0–125 kHz, there are few guided wave modes, and the propagation velocity of the L(0, 1) mode is the fastest. Studies have shown that ultrasonic guided waves in the low-frequency region have higher energy and longer wavelength, and their dispersion effect is relatively weak []. Therefore, this study selected a 50 kHz excitation signal for subsequent analysis. Additionally, the ultrasonic guided waves under the L(0, 1) mode were simulated and analyzed, which is helpful for more accurate identification and analysis of reflected waveforms.
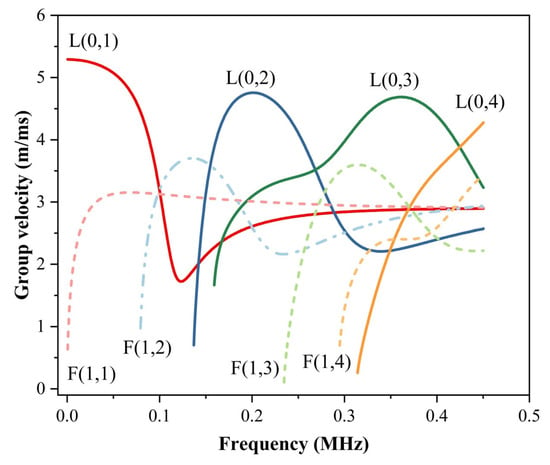
Figure 3.
Group Velocity Dispersion Curve of Rock Bolts.
The models used in the experiment are all longitudinally axisymmetric models, so longitudinal guided waves only have displacements in the radial and axial directions. In this study, the radial boundary condition of the rock bolt is fixed to eliminate radial displacement, ensuring that the simulated guided waves are consistent with the L(0, 1) longitudinal mode. No additional constraints are applied in the axial direction to avoid affecting the propagation of guided waves. A pressure load modulated by a Hanning window is applied to one end face of the rock bolt to simulate the excitation of ultrasonic guided waves. The other end face of the rock bolt is set as a coupling surface for collecting the received wave signals. The modulation formula of the excitation signal can be expressed as
where f is the signal frequency, n is the number of cycles, and t is the reciprocal of the sampling rate. The waveform diagram of the 50 kHz excitation signal is shown in Figure 4.
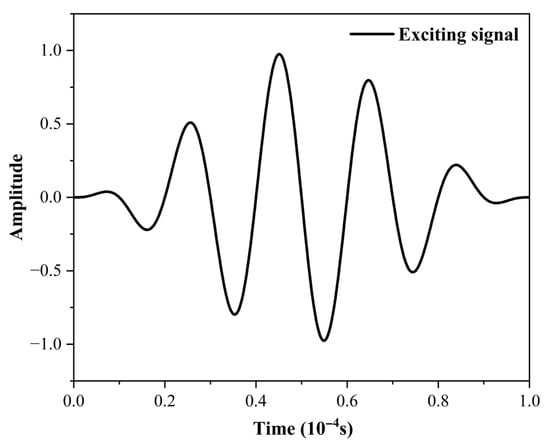
Figure 4.
Waveform Diagram of 50 kHz Excitation Signal.
2.3. Verification of Mesh Size Rationality
Mesh size is one of the important factors affecting the results of numerical simulation. Mesh accuracy and quantity not only affect the calculation accuracy and speed but also influence the propagation characteristics of guided waves. Theoretically, within a certain range, the calculation accuracy increases with the improvement of mesh density, but it also leads to a sharp increase in calculation time. To improve calculation efficiency while ensuring calculation accuracy, determining a reasonable mesh size for division is an effective approach. The element size calculation formula can be expressed as
where
In the formulas, is the minimum wavelength of the guided wave, is the maximum element size, is the propagation velocity of the guided wave in the rod, is the elastic modulus, is the density, and is generally 10~20. The final calculation result of is approximately 10.1 mm.
In addition, under the control group (without corrosion), a convergence test is carried out using 4 types of axial element sizes (1 mm, 2 mm, 4 mm, 6 mm). Figure 5 shows the characteristics of the received wave waveforms under the four element sizes. The results indicate that the waveform characteristics of the four element sizes overlap and the results are similar, showing good convergence. Considering calculation accuracy, calculation efficiency, and defect size, it is reasonable to set the axial element size to 4 mm.
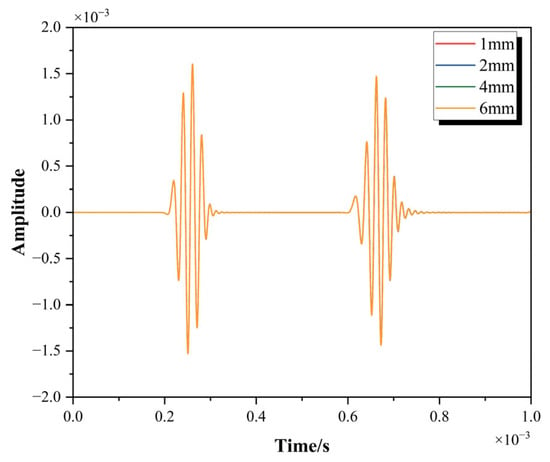
Figure 5.
Convergence verification results.
3. Numerical Simulation Results
3.1. Guided Wave Propagation and Waveform Characteristics
Figure 6 shows the cross-sectional stress nephogram of guided wave propagation at t = 0.00026 s. In the subgraph matrix of Figure 6, the horizontal direction corresponds to the increasing sequence of corrosion area ratio, and the vertical direction corresponds to the gradient change in corrosion depth. For all working conditions, the axial cross-section of the rock bolt is used as the observation plane, with the left side being the guided wave excitation end and the right side being the free end. To facilitate the observation of stress concentration phenomena and the comparative analysis between different variables, the deformation of all working conditions is controlled within the same range. The stress amplitude is quantitatively characterized by a gradient color from blue to gray. From the macro-evolution characteristics of the stress nephogram, the combined effect of corrosion area ratio and depth significantly changes the spatial distribution morphology of guided waves. Under the same depth (e.g., 1.5 mm depth), as the corrosion area increases from 5% to 30%, the stress field presents a color transition law of “uniform blue–blue-green gradient–yellow-green mottling–red-yellow aggregation”. The high-stress area (yellow-red) gradually shrinks toward the excitation end along the axial direction, and its distribution range changes from a continuous strip shape to a discrete block shape. Longitudinal comparison shows that under the same area (e.g., 20% area), when the corrosion depth increases from 0.5 mm to 2.5 mm, the stress nephogram gradually evolves from an axially symmetric distribution to an asymmetric spiral stripe shape.
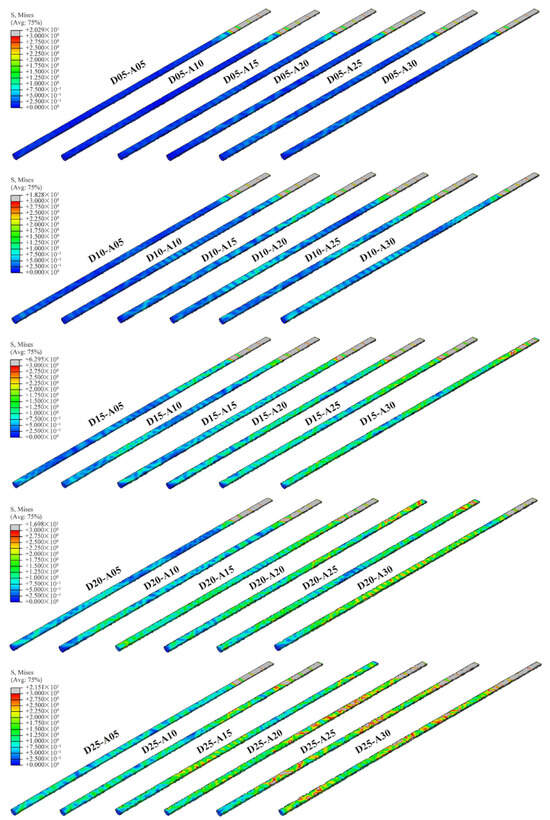
Figure 6.
Cross-sectional stress nephogram of guided wave propagation in rock bolts at t = 0.00026 s.
It is worth noting that there is always a local high-stress concentration area at the excitation end; the higher the corrosion degree (e.g., D25-A30 working condition), the closer the stress front is to the excitation end. The color saturation increases monotonically with the increase in corrosion degree, indicating that the energy reflection effect caused by corrosion defects is enhanced.
Figure 7 shows the time-domain waveforms of the received waves under different corrosion defect depths and area ratios, with the control group set as a reference for the baseline state. Figure 8 shows the amplitude attenuation rates under different corrosion defect depths and area ratios. As can be seen from the figures, the received waves of the control group exhibit typical characteristics of being dominated by double pulses and following an oscillating attenuation law. The two main pulses have high amplitudes and regular morphologies, with very few oscillating components between and after the pulses, and a small amplitude attenuation rate. This indicates that in the baseline state, the propagation of elastic waves is less disturbed, energy is concentrated in the main pulses, and the attenuation process is stable.
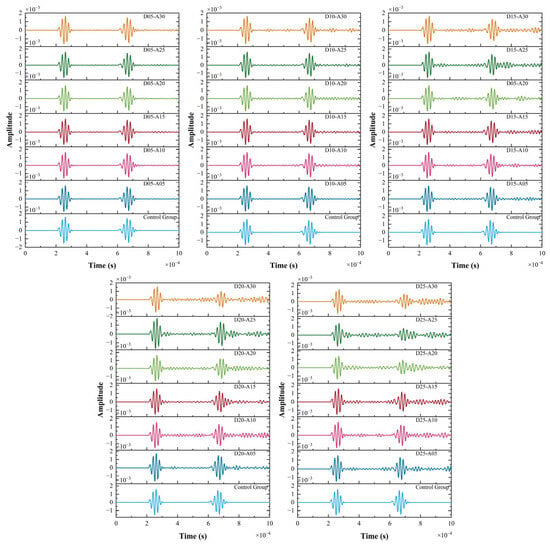
Figure 7.
Time-domain waveforms of received waves under different corrosion defect depths and area ratios.
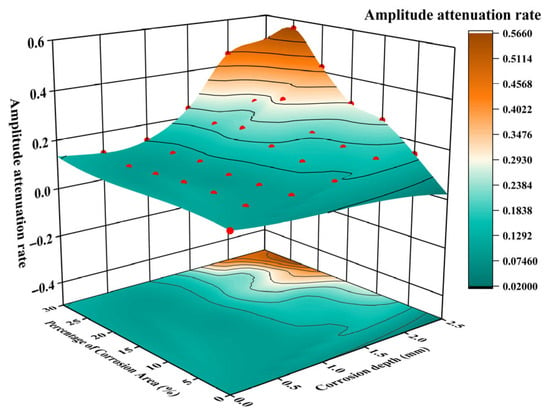
Figure 8.
Amplitude attenuation rates under different corrosion defect depths and area ratios.
As the defect depth increases from 0.5 mm to 2.5 mm, under the same area ratio, the received waves show a trend of gradual attenuation of the main pulse amplitude and significant enhancement of oscillation complexity. Taking the area ratio of 5% as an example, when the corrosion depth is 0.5 mm, the waveform is highly similar to that of the control group, with clear main pulses and amplitudes close to those of the control group. However, when the corrosion depth is 2.5 mm, the amplitude of the second main pulse is significantly attenuated, the amplitude attenuation rate is also significantly increased, and a large number of fine oscillations appear between and after the main pulses. This is because corrosion defects with greater depth have a stronger effect on the reflection and scattering of elastic waves. The propagation energy of the waves is dissipated and redistributed more at the defects, resulting in a decrease in the energy proportion of the main pulses at the receiving end. At the same time, defects with large depths are prone to exciting more complex wave modes (such as scattered waves and mode-converted waves), which is manifested as increased oscillation in the time-domain waveform.
When the corrosion area ratio increases from 5% to 30%, under the same depth, the energy dispersion of the received waves increases and the waveform distortion intensifies. Taking the corrosion depth of 2 mm as an example, when the corrosion area ratio is 5%, the waveform still retains a clear double-pulse structure, with little difference from the control group. However, when the corrosion area ratio is 30%, a large number of oscillating ripples appear before and after the pulses, and the overall waveform tends to be dispersed. This is because the corrosion area with a large area ratio expands the range of the disturbance interface. This not only enhances the reflection and scattering of waves but also increases the spatial scale of energy dissipation, making it difficult for the received waves to maintain a regular pulse shape, and the energy is gradually dispersed into more oscillating components.
When both the corrosion depth and area ratio increase, the difference between the received waves and those of the control group reaches the maximum. The amplitude attenuation rate increases significantly, with a maximum of 56.6%. At this time, the main pulse waveform of the received waves is severely deformed, the entire time-domain range is filled with continuous oscillations, and the pulse nature of the waveform is destroyed. This phenomenon reflects the coupled amplification effect of corrosion depth and area ratio. The depth determines the vertical action intensity of the waves at the defects, and the area ratio determines the horizontal interference range. Under the combined action of the two, the propagation path of elastic waves is severely disrupted, energy dissipation and wave mode conversion are more intense, and finally, the time-domain characteristics of the received waveform are fundamentally deteriorated.
In conclusion, both the depth and area ratio of corrosion defects have a significant impact on the time-domain waveform of the received waves: an increase in depth leads to the attenuation of the main pulse amplitude and the enhancement of oscillation complexity; an increase in the area ratio leads to the dispersion of waveform energy and the intensification of distortion. When the two act synergistically, the waveform deterioration is more significant.
3.2. Time-Domain Distribution and Concentration Characteristics of Received Wave Energy
To more intuitively reflect the time-domain distribution and concentration characteristics of received wave energy under different defect depths and corrosion area ratios, the Hilbert transform was applied to the received waveforms to construct analytical signals. The Hilbert transform is defined as the convolution of the original signal and , and its expression can be written as
where is the integral variable, and is the time variable. The analytical signal can be expressed as
where is the imaginary unit. The modulus of the analytical signal is the instantaneous amplitude of the signal, i.e., the Hilbert envelope curve. Its physical meaning is to characterize the time-varying characteristics of signal energy, which can be expressed as
Figure 9 shows the Hilbert envelope curves under different corrosion depths and defect area ratios. The Hilbert envelope curve of the control group exhibits the energy localization characteristic dominated by double pulses. The envelope peaks of the two main pulses show typical laws of high amplitude, steep rising and falling edges, and the envelope amplitude between and after the pulses approaches zero. This characteristic originates from the energy concentration and mode singularity of elastic wave propagation in a uniform medium. The uniformity of the medium inhibits the scattering and mode conversion of waves, and energy is transmitted in the form of pulse clusters without interference. This provides a baseline for the envelope comparison under defective working conditions.
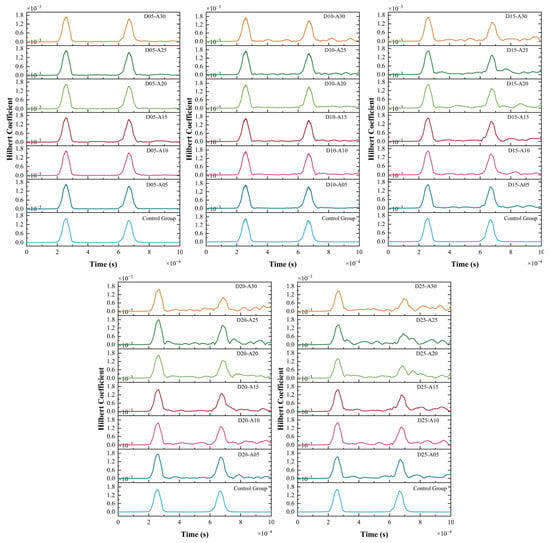
Figure 9.
Hilbert envelope curves under different corrosion depths and defect area ratios.
Under the same corrosion depth, with the increase in the area ratio, the envelope curve shows a trend of enhanced time-domain dispersion of energy. When the corrosion area ratio is 5%, the envelope curve at the trailing edge of the main pulse shows a characteristic of decreasing to zero after falling, and there is no significant tailing in the energy curve. However, when the corrosion area ratio is 30%, continuous low-amplitude envelope oscillations appear after the second main pulse, indicating that part of the energy is dispersed from the main pulse concentration period to a wide time-domain range. The reason for this phenomenon is that the corrosion area with a large area ratio has a scattering effect on the wavefront, causing the energy to be transmitted to the receiving end in the form of delayed scattered waves, which destroys the time-domain localization of energy.
Under the same corrosion area ratio, with the increase in corrosion depth, the envelope curve characteristics show an evolution from sharp to gentle peaks. This is because corrosion defects with large depths cause elastic waves to undergo multiple reflections and mode conversions at the upper and lower interfaces of the defects, resulting in time broadening of the energy during transmission in the vertical dimension and a decrease in the slope of the main pulse. Secondly, the greater the corrosion depth, the lower the amplitude of the envelope curve of the second main pulse. This is due to the multiple transmission and reflection of waves in the vertical direction of the defects, leading to a decrease in the effective energy of the main pulse with the increase in depth.
In addition, when both the corrosion depth and area ratio increase, the Hilbert envelope curve shows a dispersion characteristic, specifically manifested as low-amplitude oscillatory envelopes in a wide time-domain range. Energy is no longer localized in specific pulse periods, but dispersed throughout the observation time domain.
4. Discussion
4.1. Influence of Random Corrosion on the Energy Accumulation Characteristics of Received Waves
In this study, the area under the Hilbert envelope curve is used to characterize the time-domain integral characteristics of the received energy of elastic waves. Figure 10 shows the influence of corrosion depth and area ratio on the energy integral. Table 3 shows the energy integral growth rates under different corrosion depths and area ratios. From the overall trend, with the increase in corrosion depth and area ratio, the energy integral generally shows an upward trend. Compared with the control group, the growth range is 3.96–46.21%. This is because an increase in corrosion depth forms a disturbance structure in the propagation path of elastic waves, promoting multiple reflections and mode conversions of waves at the upper and lower interfaces of the defects. Although energy dissipation is accompanied by a single reflection or transmission, the complex propagation path enables more dispersed energy components to be captured by the receiving end. At the same time, an increase in the corrosion area ratio leads to the expansion of the scattering interface in the horizontal direction. The multi-directional scattering of the wavefront changes the energy propagation from concentrated to wide time-domain dispersion, and the receiving end can collect more delayed or scattered energy components, thereby increasing the energy integral at the receiving end.
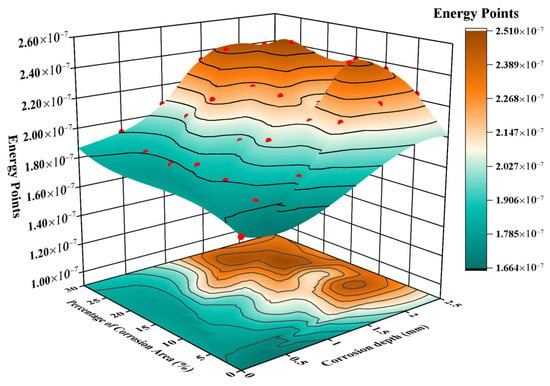
Figure 10.
Influence of corrosion depth and area ratio on the energy integral.

Table 3.
Energy integral growth rates under different corrosion depths and area ratios.
However, the curve is not a completely smooth monotonic increase. This is because the interaction between elastic waves and defects is a competition of multiple physical processes. On the one hand, the increase in defect size promotes scattering and energy dispersion, increasing the received energy. On the other hand, excessive scattering may cause part of the energy to deviate from the receiving path or be excessively dissipated, making it impossible to be received. When these two effects reach a temporary balance under local parameter combinations, local fluctuations in energy occur. However, from the global curve shape, when both the corrosion depth and area ratio increase, the dominant trend of energy increase is obvious.
In addition, the density of contour lines reflects the gradient of energy change. In the region where both the corrosion depth and area ratio are large, the contour lines are denser, indicating that the energy is more sensitive to parameter changes. That is, the synergistic effect of depth and area is more significant in the high-value range, and small parameter changes will lead to more obvious energy changes. In the low-value range of parameters, the contour lines are sparse, and the gradient of the energy integral with parameter changes is small, indicating that the presence of random corrosion has little effect on the elastic wave energy at this time.
4.2. Influence of Random Corrosion on the Wave Velocity of Received Waves
Peak-to-peak wave velocity is a key characteristic parameter for characterizing the effective propagation velocity of elastic waves in a medium [,]. Figure 11 shows the relationship between the peak-to-peak wave velocity and the corrosion depth and area ratio. Table 4 shows the peak-to-peak wave velocity attenuation rates under different corrosion depths and area ratios. From the overall trend, with the increase in corrosion depth and area ratio, the peak-to-peak wave velocity shows a significant and continuous attenuation trend, with an attenuation range of 0.121–4.718%. The main reason for the attenuation of the peak-to-peak wave velocity is that corrosion defects destroy the structural uniformity of the rock bolt as an elastic waveguide, causing complex wavefield reconstruction. Specifically, when the incident guided waves (mainly the longitudinal mode L(0, 1)) encounter corrosion pits, strong scattering and mode conversion occur due to the sudden change in wave impedance. The scattering effect not only causes energy loss but also its key forward scattering component leads to phase lag and broadening of the wave packet, which can be seen from Figure 7 and Figure 9. Mode conversion converts part of the energy from the high-velocity L(0, 1) mode to slower flexural wave modes (such as F(1, 1)) or higher-order longitudinal modes. Therefore, the signal measured at the receiving end is the result of the superposition of these multi-path and multi-mode wavefields. The above reasons directly lead to the delay of the peak, which is manifested as a decrease in wave velocity.
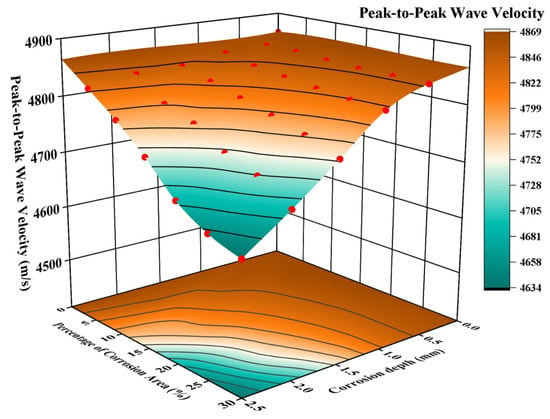
Figure 11.
Relationship between peak-to-peak wave velocity and corrosion depth and area ratio.

Table 4.
Peak-to-peak wave velocity attenuation rates under different corrosion depths and area ratios.
In addition, there is a synergistic attenuation effect between corrosion depth and area ratio. Specifically, an increase in corrosion depth prolongs the action path of elastic waves with defects, enhancing the cumulative disturbance effect of scattering and mode conversion. An increase in the corrosion area ratio expands the discontinuous scattering area in the horizontal direction, increasing the probability of the wavefront encountering defect interfaces. When the two are coupled, the attenuation trend of wave velocity is continuously strengthened with the increase in defect parameters. Finally, this is manifested as a monotonically decreasing characteristic of wave velocity in the direction of increasing “depth—area ratio” in Figure 11.
Figure 12 shows the relationship between corrosion degree and wave velocity. In this study, the ratio of the volume of corrosion defects to the total volume of the rock bolt is defined as the corrosion degree. It can be seen from Figure 12 that with the increase in corrosion degree, the wave velocity generally shows a monotonically decreasing characteristic. This is consistent with the wave velocity variation trend observed in experiments by Amjad et al. [], which also verifies the conclusion that the greater the corrosion degree, the weaker the ability of the material to carry and transmit elastic waves.
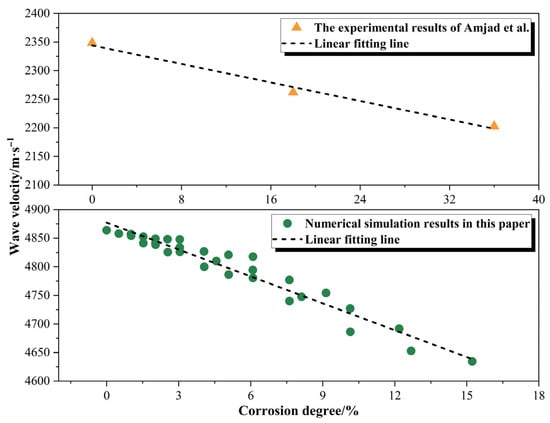
Figure 12.
Relationship between corrosion degree and wave velocity [].
In conclusion, the propagation velocity of elastic waves in a corroded medium presents a nonlinear relationship with the corrosion depth and area ratio. Therefore, this study selects a multivariate nonlinear form including first-order terms, second-order terms, and interaction terms to characterize the relationship among the three. The multivariate nonlinear equation can be expressed as
where is the wave velocity, are regression coefficients, is the corrosion depth, is the corrosion area ratio, and is the random error. The least squares method was used to calculate the data in Table 4, and the result is
The calculated is 0.99, indicating that the model has a very high goodness of fit to the data, and the independent variables and can well explain the changes in wave velocity.
5. Conclusions
By establishing a finite element model of rock bolts with random corrosion defects and combining methods such as stress nephograms, time-domain waveform analysis, and Hilbert transform, this study systematically reveals the coupled influence mechanism of corrosion depth and area ratio on the propagation characteristics of ultrasonic guided waves, providing theoretical support for the quantitative detection of rock bolt corrosion. The main conclusions are as follows:
- (1)
- With the increase in corrosion parameters, the guided wave stress field evolves from an axially symmetric uniform state to an asymmetric spiral stripe state. Reflections, scattering, and mode conversion induced by defects lead to the attenuation of the main pulse amplitude of the time-domain waveform and the enhancement of oscillation complexity. Mechanistically, corrosion depth determines the vertical action intensity of defects on guided waves, and the area ratio defines the horizontal interference range. The two synergistically amplify the waveform deterioration effect.
- (2)
- Under the same corrosion depth, an increase in the area ratio disperses energy toward delayed scattered waves. Under the same area ratio, an increase in depth leads to a gentle peak shape of the envelope and a decrease in the amplitude of the main pulse. The energy integral generally increases with the increase in corrosion parameters, and the sensitivity of the high-parameter region to parameter changes is significantly higher than that of the low-parameter region.
- (3)
- The peak-to-peak wave velocity of guided waves shows a nonlinear downward trend with the increase in corrosion parameters, with a maximum attenuation rate of 4.718%. The core mechanism is that corrosion defects destroy the structural uniformity of rock bolts, causing strong scattering and mode conversion of incident mode guided waves, resulting in phase lag and broadening of the wave packet. The multivariate nonlinear model constructed based on this can accurately describe the coupled effect of corrosion depth and area ratio on wave velocity, providing a reliable mathematical tool for the quantitative inversion of corrosion degree.
Author Contributions
Conceptualization, M.W., Q.Z., H.L. and W.H.; methodology, M.W.; software, Q.Z.; validation, H.L. and W.H.; formal analysis, M.W. and Q.Z.; investigation, M.W.; data curation, M.W. and Q.Z.; writing—original draft preparation, M.W. and Q.Z.; writing—review and editing, H.L. and W.H.; visualization, Q.Z.; supervision, H.L. and W.H.; funding acquisition, H.L. All authors have read and agreed to the published version of the manuscript.
Funding
This study was supported by the National Key Research and Development Program of China under the 14th Five-Year Plan (Grant No.: 2023YFC3012200).
Data Availability Statement
The original contributions presented in this study are included in the article. Further inquiries can be directed to the corresponding author.
Conflicts of Interest
The authors declare no conflicts of interest.
References
- Yu, J.D.; Byun, Y.H.; Lee, J.S. Experimental and numerical studies on group velocity of ultrasonic guided waves in rock bolts with different grouted ratios. Comput. Geotech. 2019, 114, 103130. [Google Scholar] [CrossRef]
- Wang, B.; Guo, X.X.; Jin, H. Experimental study on degradation behaviors of rock bolt under the coupled effect of stress and corrosion. Constr. Build. Mater. 2019, 214, 37–48. [Google Scholar] [CrossRef]
- Ma, Y.; Xiang, Y.; Wang, L.; Zhang, J.; Liu, Y. Fatigue life prediction for aging RC beams considering corrosive environments. Eng. Struct. 2014, 79, 211–221. [Google Scholar] [CrossRef]
- Dang, V.H.; François, R. Prediction of ductility factor of corroded reinforced concrete beams exposed to long term aging in chloride environment. Cem. Concr. Compos. 2014, 53, 136–147. [Google Scholar] [CrossRef]
- Yu, X.J.; Zou, S.C.; Deng, Y. Application and exploration of acoustic wave detection technology for anchorage quality of anchor rod. J. Eng. Geophys. 2022, 19, 649–656. [Google Scholar]
- Li, Z.; Yu, J.G.; Zhang, X.M. Study on propagation characteristics of ultrasonic guided wave and detection of the defect in resin bolts. Appl. Acoust. 2022, 195, 108843. [Google Scholar] [CrossRef]
- Yoon, H.K.; Lee, J.S.; Yu, J.D. Correlation of granite rock properties with longitudinal wave velocity in rock bolt. Int. J. Rock. Mech. Min. 2022, 159, 105200. [Google Scholar] [CrossRef]
- Zhang, C.S.; Zou, D.H. Numerical simulation of wave propagation in grouted rock bolts and the effects of mesh density and wave frequency. Int. J. Rock. Mech. Min. 2006, 43, 634–639. [Google Scholar] [CrossRef]
- Zima, B.; Rucka, M. Guided ultrasonic waves for detection of debonding in bars partially embedded in grout. Constr. Build. Mater. 2018, 168, 124–142. [Google Scholar] [CrossRef]
- Wang, C.; He, W.; Ning, J.G. Propagation properties of guided wave in the anchorage structure of rock bolts. J. Appl. Geophys. 2009, 69, 131–139. [Google Scholar] [CrossRef]
- Li, C.M.; Xia, X.; Feng, R.M. Experimental Study of the Effect of Axial Load on Stress Wave Characteristics of Rock Bolts Using a Non-Destructive Testing Method. Sustainability 2022, 14, 9773. [Google Scholar] [CrossRef]
- Rong, X.; Lin, P.Y.; Liu, J.Y. A new approach of waveform interpretation applied in nondestructive testing of defects in rock bolts based on mode identification. Math. Probl. Eng. 2017, 2017, 7920649. [Google Scholar] [CrossRef]
- Han, G.; Lv, S.C.; Tao, Z.G. Evaluation of Bolt Corrosion Degree Based on Non-Destructive Testing and Neural Network. Appl. Sci. 2024, 14, 5069. [Google Scholar] [CrossRef]
- Wang, Y.; Guan, R.; Lu, Y. Nonlinear Lamb waves for fatigue damage identification in FRP-reinforced steel plates. Ultrasonics 2017, 80, 87–95. [Google Scholar] [CrossRef]
- Li, J.; Lu, Y.; Guan, R.; Qu, W. Guided waves for debonding identification in CFRP reinforced concrete beams. Constr. Build. Mater. 2017, 131, 388–399. [Google Scholar] [CrossRef]
- Beard, M.D.; Lowe, M.J.S.; Cawley, P. Development of a guided wave inspection technique for rock bolts. AIP Conf. Proc. 2002, 44, 19–24. [Google Scholar]
- Wang, X.C.; Lin, M.; Li, J. Ultrasonic guided wave imaging with deep learning: Applications in corrosion mapping. Mech. Syst. Signal. Pract. 2022, 169, 108761. [Google Scholar] [CrossRef]
- Amjad, U.; Yadav, S.K.; Kundu, T. Detection and quantification of diameter reduction due to corrosion in reinforcing steel bars. Struct. Health. Monit. 2015, 14, 532–543. [Google Scholar] [CrossRef]
- Sriramadasu, R.C.; Banerjee, S.; Lu, Y. Detection and assessment of pitting corrosion in rebars using scattering of ultrasonic guided waves. Ndt E Int. 2019, 101, 53–61. [Google Scholar] [CrossRef]
- Wang, M.M. Study on the Propagation Characteristics of Ultrasonicguided Waves in the Anchorage Structure of BFRP Bolts; Jiangxi University of Science and Technology: Ganzhou, China, 2024. [Google Scholar]
- Yan, S.; Wang, X.N.; Zhu, R.F. A layer discrete particle based soft contact model in corroded rebar monitoring using linear and nonlinear ultrasonic guided waves. Ultrasonics 2024, 139, 107269. [Google Scholar] [CrossRef]
- Cui, Y.; Zou, D.H. Numerical simulation of attenuation and group velocity of guided ultrasonic wave in grouted rock bolts. J. Appl. Geophys. 2006, 59, 337–344. [Google Scholar] [CrossRef]
- Zou, D.H.; Cui, Y.; Madenga, V. Effects of frequency and grouted length on the behavior of guided ultrasonic waves in rock bolts. Int. J. Rock. Mech. Min. 2007, 44, 813–819. [Google Scholar] [CrossRef]
- Wu, B.; Sun, Y.X.; He, C.F. Application of high frequency ultrasonic guided waves to inspection of full-length-bonding bolt. Chin. J. Rock Mech. Eng. 2007, 181, 397–403. [Google Scholar]
- Cui, J.Y.; Sun, Y.X.; He, C.F. Application research on low frequency ultrasonic guided wave detection of full-length bonded resin bolt. Eng. Mech. 2010, 27, 240–245. [Google Scholar]
- Talakokula, V.; Bhalla, S.; Gupta, A. Corrosion assessment of reinforced concrete structures based on equivalent structural parameters using electro-mechanical impedance technique. J. Intell. Mater. Syst. Struct. 2014, 25, 484–500. [Google Scholar] [CrossRef]
- Ji, Y.S.; Zhao, W.; Zhou, M.; Ma, H.R.; Zeng, P. Corrosion current distribution of microcell and microcell of steel bar in concrete exposed to chloride environments. Constr. Build. Mater. 2013, 47, 104–110. [Google Scholar] [CrossRef]
- Hoult, N.A.; Regier, R. Concrete deterioration detection using distributed sensors. Struct. Build. 2015, 168, 118–126. [Google Scholar]
- Huo, L.; Li, C.; Jiang, T.; Li, H.-N. Feasibility Study of Steel Bar Corrosion Monitoring Using a Piezoceramic Transducer Enabled Time Reversal Method. Appl. Sci. 2018, 8, 2304. [Google Scholar] [CrossRef]
- Zhu, W.; Yu, K.; Xu, Y.; Zhang, K.; Cai, X. A Prediction Model of the Concrete Cracking Induced by the Non-Uniform Corrosion of the Steel Reinforcement. Materials 2020, 13, 830. [Google Scholar] [CrossRef]
- Shanmukha, S.; Sauvik, B.; Siddharth, T. Point Cloud-Based Finite Element Model for Interaction of Ultrasonic Guided Waves with Non-uniform Corrosion in Reinforced Concrete. J. Nondestruct. Eval. 2022, 41, 1. [Google Scholar]
- Rajeshwara, C.S.; Banerjee, S.; Lu, Y. Identification of zero effect state in corroded RCC structures using guided waves and embedded piezoelectric wafer transducers (PWT). Procedia. Eng. 2017, 188, 209–216. [Google Scholar] [CrossRef]
- Miller, T.; Hauser, C.J.; Kundu, T. Nondestructive inspection of corrosion and delamination at the concrete-steel reinforcement interface. Proceedings of the ASME 2002 International Mechanical Engineering Congress and Exposition. Nondestruct. Eval. 2002, 17–22, 121–128. [Google Scholar] [CrossRef]
- Ervin, B.L.; Bernhard, J.T.; Kuchma, D.A.; Reis, H. Estimation of general corrosion damage to steel reinforced mortar using frequency sweeps of guided mechanical waves. Insight Non Destr. Test. Cond. Monit. 2006, 48, 682–692. [Google Scholar] [CrossRef]
- Ervin, B.L.; Kuchma, D.A.; Bernhard, J.T.; Reis, H. Monitoring corrosion of rebar embedded in mortar using high-frequency guided ultrasonic waves. J. Eng. Mech. 2009, 135, 9–19. [Google Scholar] [CrossRef]
- Sriramadasu, R.C.; Banerjee, S.; Lu, Y. Sensitivity of longitudinal guided wave modes to pitting corrosion of rebars embedded in reinforced concrete. Constr. Build. Mater. 2020, 239, 117855. [Google Scholar] [CrossRef]
- Fan, K.S.; Yan, A.; Liu, S.W. Ultrasonic guided wave nondestructive testing of anchorage quality of rebar resin bolt based on EMD-PCA. Sci. Rep. 2025, 15, 15239. [Google Scholar] [CrossRef]
- Andrade, C. Propagation of reinforcement corrosion: Principles, testing and modelling. Mater. Struct. 2019, 52, 2. [Google Scholar] [CrossRef]
- Kashani, M.M.; Crewe, A.J.; Alexander, N.A. Nonlinear stress strain behaviour of corrosion-damaged reinforcing bars including inelastic buckling. Eng. Struct. 2013, 48, 417–429. [Google Scholar] [CrossRef]
Disclaimer/Publisher’s Note: The statements, opinions and data contained in all publications are solely those of the individual author(s) and contributor(s) and not of MDPI and/or the editor(s). MDPI and/or the editor(s) disclaim responsibility for any injury to people or property resulting from any ideas, methods, instructions or products referred to in the content. |
© 2025 by the authors. Licensee MDPI, Basel, Switzerland. This article is an open access article distributed under the terms and conditions of the Creative Commons Attribution (CC BY) license (https://creativecommons.org/licenses/by/4.0/).