Abstract
Jiangnan water towns, as distinctive cultural landscapes in China, are confronting the dual challenge of surging tourist flows and imbalances in spatial distribution. Research on pedestrian dynamics has so far offered narrow coverage of influencing factors and limited insight into underlying mechanisms, falling short of a systemic perspective and an interpretable theoretical framework. This study uses Nanxun Ancient Town as a case study to address this gap. Pedestrian trajectories were captured using temporarily installed closed-circuit television (CCTV) cameras within the scenic area and extracted using the YOLOv8 object detection algorithm. These data were then integrated with quantified environmental indicators and analyzed through Random Forest regression with SHapley Additive exPlanations (SHAP) interpretation, enabling quantitative and interpretable exploration of pedestrian dynamics. The results indicate nonlinear and context-dependent effects of environmental factors on pedestrian dynamics and that tourist flows are jointly shaped by multi-level, multi-type factors and their interrelations, producing complex and adaptive impact pathways. First, within this enclosed scenic area, spatial morphology—such as lane width, ground height, and walking distance to entrances—imposes fundamental constraints on global crowd distributions and movement patterns, whereas spatial accessibility does not display its usual salience in this context. Second, perceptual and functional attributes—including visual attractiveness, shading, and commercial points of interest—cultivate local “visiting atmospheres” through place imagery, perceived comfort, and commercial activity. Finally, nodal elements—such as signboards, temporary vendors, and public service facilities—produce multi-scale, site-centered effects that anchor and perturb flows and reinforce lingering, backtracking, and clustering at bridgeheads, squares, and comparable nodes. This study advances a shift from static and global description to a mechanism-oriented explanatory framework and clarifies the differentiated roles and linkages among environmental factors by integrating video-based trajectory analytics with machine learning interpretation. This framework demonstrates the applicability of surveillance and computer vision techniques for studying pedestrian dynamics in small-scale heritage settings, and offers practical guidance for heritage conservation and sustainable tourism management in similar historic environments.
1. Introduction
Pedestrian dynamics is the study of crowd characteristics in specific pedestrian scenarios [1]. Examining pedestrian dynamics across different settings enables a deep understanding of the mechanisms underlying walking behavior and supports accurate forecasting, providing a critical basis [2] for research on evacuation simulation [3], crowd risk assessment [4], and enhancing spatial vitality [5]. In general, research on pedestrian dynamics can be grouped into (i) behavior-focused studies and (ii) trajectory-based studies, with the latter being more convenient for quantitative analysis and more readily scalable across multiple spatial and temporal resolutions [6]. In early studies on pedestrian dynamics, scholars commonly relied on on-site observation [7,8] interviews [9], and questionnaires [10]. While these methods capture behavioral details, subjective perceptions, and environmental quality as “thick description,” making them suitable for small-scale diagnosis and hypothesis generation, they suffer from limited sample sizes and spatiotemporal coverage, high labor costs, and susceptibility to observation/recall bias and the Hawthorne effect [11]. Consequently, they struggle to provide long-term, repeatable measurements of dynamic indicators such as speed and trajectories. Recent advances in large-scale data collection and analytics have helped remedy these shortcomings. In particular, pedestrian video data from surveillance systems offers broad spatial coverage, long observation periods, and high accuracy. In particular, pedestrian video data acquired from surveillance systems offers broad spatial coverage, long observation periods, and high accuracy. Compared with traditional modalities such as mobile signaling data [12], Global Positioning System (GPS) traces [13], or nighttime light data [14], CCTV video can better measure dynamic indicators of crowd vitality—e.g., instantaneous speed and movement trajectories—thereby enabling high-granularity analyses of pedestrian dynamics [15].
Today, driven by the emerging needs of holistic heritage conservation, sustainable tourism, and systematic management, research on pedestrian dynamics in China has expanded from cities to a wider spectrum of spatial types, including towns, rural settlements, and Jiangnan water town historic districts. Jiangnan water towns are human settlements situated between rural and urban forms and shaped by intensive economic activities under specific environmental and cultural contexts [16]. Their distinctive waterscape patterns, architectural typologies, and cultural traditions endow them with unique cultural and landscape value. Since the tourism development of Zhouzhuang in the 1980s sparked a “water town tourism boom”, the tourism value of Jiangnan ancient towns has become increasingly prominent, turning them into major contemporary destinations [17,18]. However, the rapid growth in tourism and the continual influx of visitors pose severe challenges to the limited carrying capacity of these environments, often manifesting as excessive local crowding. This has exceeded the scenic area’s ecological and spatial capacity and has undermined the sustainability of tourism development [19]. Furthermore, recent studies have shown that walkability is fundamental for achieving sustainable tourism in cultural heritage sites. High walkability not only helps balance visitor flows and reduce congestion but also enhances tourists’ cultural identification and intention to revisit [20,21]. Therefore, elucidating the characteristics of pedestrian dynamics in ancient towns, and systematically identifying the influencing factors and their mechanisms, is essential for improving spatial quality and the experience of visitors in Jiangnan water towns [22,23,24].
Globally, ample research has demonstrated that environmental factors—such as space-syntax indicators [25,26,27,28], physical features [29], visual and thermal perceptions [30,31], and land use characteristics [32]—exert significant influence on pedestrian dynamics, forming a rich dataset that underpins current analytical frameworks. Furthermore, Fonseca et al. [33] conducted a comprehensive literature review revealing the key built environmental factors that affect walkability and explored the underlying mechanisms through which these factors operate. At the same time, related studies conducted within the specific context of Chinese ancient towns also suggest distinctive characteristics that differ from those observed in urban environments. Some scholars have already explored related issues, examining how business format structures and distributions [34], infrastructure affordances [35], attraction layouts, street network structures [36], and place imagery [37] affect vitality indicators such as pedestrian volumes, walking behaviors, and the spatiotemporal distribution of crowds. Nevertheless, several gaps remain. Existing studies on pedestrian dynamics in Jiangnan ancient towns cover a limited range of influencing factors and seldom approach the problem from a comprehensive perspective. Moreover, most findings remain at the level of static, global descriptions and overlook complex patterns of influence, such as the potential nonlinear relationships between environmental factors and pedestrian dynamics shaped by human perception, as suggested by Manning’s theory of environmental psychology [38]. Further still, the differences and interlinkages among the action modes of different factor types have not been systemically examined, leaving the overall framework incomplete.
To address these gaps, this study takes Nanxun Ancient Town as the research site. Pedestrian trajectories were captured using temporarily installed CCTV cameras within the scenic area and extracted through the YOLOv8 object detection algorithm. The extracted pedestrian trajectory data were then integrated with quantified environmental indicators derived from panoramic imagery and field measurements. Finally, a Random Forest regression model coupled with SHAP analysis was applied to quantitatively and interpretably examine how environmental factors influence pedestrian dynamics in the Jiangnan water-town context. At the theoretical level, the study identifies nonlinear and context-dependent mechanisms through which environmental factors act on pedestrian dynamics, effecting a shift from static, result-based descriptive analyses to a mechanism-oriented explanatory framework differentiated by factor types and thereby providing a more systematic theoretical interpretation of pedestrian dynamics in Jiangnan water towns. At the practical level, the study proposes operational, data-driven optimization approaches, offering quantitative evidence for refining street–alley structures, adjusting commercial layouts and facility placements, and informing conservation, renewal, and fine-grained crowd management in Jiangnan water town historic districts, thereby contributing to the sustainable management of tourism and heritage environments. This research centers on three core questions: (1) Which environmental factors most significantly influence pedestrian dynamics in Jiangnan water towns? (2) How do these factors operate under different contexts to shape pedestrian dynamics? (3) What differences and interrelations exist among the action modes of different factor types, and can they be integrated into a systematic explanatory framework?
The remainder of this paper is organized as follows. Section 2 reviews the related literature, including studies on pedestrian dynamics in ancient towns, the application of video data in trajectory-based pedestrian research, and the resulting research gaps. Section 3 presents the methodology, including the study area, extraction of influencing factors for pedestrian dynamics, data collection, and analytical methods. Section 4 reports the results. Section 5 provides discussion grounded in the findings, including interpretation, policy implications, and limitations. The final section concludes the paper.
2. Literature Review
2.1. Review of Research on Pedestrian Dynamics: From General Evidence to Ancient Town Contexts
In trajectory-based studies of pedestrian dynamics, the influencing factors are generally divided into two broad categories [39,40,41]: (i) spatial morphology, comprising street-plan network attributes grounded in graph theory and three-dimensional spatial form; and (ii) spatial elements and their distributional characteristics. Together, these two facets constitute the physical environment that underpins all human activities [33] and—consciously or unconsciously [42]—has important effects on walking [43]. Among them, the influence of spatial morphology has drawn sustained attention from pioneering scholars. Foremost is Bill Hillier, who proposed the idea of space syntax in The Social Logic of Space, examining human behavior through a spatial lens [44]. He systematically articulated the association between building/block form and pedestrian movement, employing socio-spatial methods to analyze interactions between spatial dimensions and human behavior. Building on this foundation, subsequent research on spatial accessibility—jointly described by integration, connectivity, and choice—has shown that these measures often determine the overall pattern and intensity of pedestrian dynamics [45]. In general, higher accessibility tends to be accompanied by larger flows or denser clustering, with especially pronounced gains in non-traffic contexts [46]. This pattern has been confirmed, for example, by Mohamed et al. in a study of urban parks [47]. A simple, legible street network also helps enhance visual connectivity between spaces, facilitating cross-node circulation at the perceptual level [48]. It is worth noting that space-syntax computations are subject to boundary effects in many study designs. To mitigate this, some scholars widen the analytical extent or use local/depth-limited analyses [27]; however, some studies further note that whether a study area is open or closed at the macro level can alter the efficacy of space syntax measures [49]. This may occur because the layout of entrances in enclosed areas creates differential walking costs to interior locations, thereby restructuring how the network operates [50,51], or because purposive wandering without a fixed destination interferes with the dominance of accessibility [52]. Nevertheless, network-structural measures still provide a baseline signal in most contexts and offer stable explanatory power for pedestrian movement [27]. The impact of these structural effects in ancient towns has been widely and deeply discussed. For instance, Zhang [37], Mao [53], and Chen [54] applied space syntax methods in Jiangnan to reveal the relationship between road network features and tourist distribution, highlighting the critical role of high accessibility along waterfront streets in shaping pedestrian dynamics, while also revealing the sharp variability of network effects within bounded spaces.
At the three-dimensional morphological level, street width is often taken to reflect a space’s capacity to accommodate flows [55] and to influence walking speeds [56,57]. It also provides the cross-sectional basis for a richer variety of street activities [58]. However, simply increasing effective sidewalk width does not monotonically improve pedestrian dynamics [59]; it must match surrounding land-use functions and user profiles [60], and work in concert with a highly connected street network to deliver maximum benefits [25]. For instance, Zhang et al. identified a peak effect in the walking intervention strength of D/H and observed that while wider streets can facilitate faster walking, excessive width reduces the tendency to linger [61]. Moreover, increases in width typically entail changes to the visual field, causing indicators such as depth-to-height ratio (D/H), richness of elements, color diversity, enclosure, and openness to shift accordingly, thereby affecting perception [35]. Although such changes in the visual field can be partially measured in micro- to small-scale spaces with Visibility Graph Analysis (VGA) in the space syntax framework [62] and can be linked to the strength of visual attraction [63], VGA has a limited capacity to represent fine-grained pedestrian dynamics in real settings [64]. It is also noteworthy that ground elevation and slope exert significant effects on walkability-related pedestrian dynamics [65,66], yet they are often overlooked in empirical studies [67]. Likewise, although this has not yet been empirically verified in ancient town environments, some scholars have inferred that the steep ramps of arch bridges increase the physical burden of walking [68].
The planar distribution of spatial elements is also important. While Yin et al. showed that the density and mix of street functions are key drivers of crowd aggregation [69], such diversity produces setting-dependent outcomes, yielding different conclusions across environments [32]. For example, in ancient town commercial streets with high POI density and strong functional mixture, activities are abundant, pedestrian volumes are high, and dwell times are long, yet walking speeds tend to be lower [35]. Zhang et al. further found that among business types, food and beverage, retail, lodging, and cultural-tourism services are most strongly associated with high-density vitality [34], while Chen advanced the discussion by examining the influence of signature attractions [70]. That said, while many studies have verified positive associations between functional diversity and pedestrian dynamics, one should remain alert to potential spatial heterogeneity and nonlinear mechanisms [71].
Concurrently, scholars have noted that multiple types of public infrastructure—such as benches, trees, and traffic signs—appeal to travelers [72,73,74]. Among these, the considered placement of outdoor seating along interactive edges—for example, in waterfront promenades—can markedly reshape movement and dwelling patterns and thereby enhance pedestrian vitality [75]. In plazas, combined with visibility graph analysis, Askarizad et al. demonstrated that seating both intervenes in vision and guides the distribution of people and activities [76]. Shade conditions along walking routes also matter: people systematically prefer arcades or tree-shaded environments; shade fraction correlates with the share of pedestrians [77]; and more continuous shade is more attractive [78]. In some hot climates, the comfort provided by shade is even preferred over additional rest facilities [79]. Regarding wayfinding systems, they create decision points for walkers [80]; the overall completeness and clarity of information are strongly associated with route choice and travel efficiency [81]. Along these lines, Zhang et al. not only demonstrated the effects of commercial formats and infrastructural affordances on pedestrian behavior but also specifically examined the significant impacts of overhead shading systems and wayfinding signage on slow walking and pausing [82]. In ancient town scenic areas, it is noteworthy that signage and interpretive systems can both cause people to congregate nearby (to read information, to use as meeting points, etc.) and—depending on their completeness—shape route choice [36].
Classic, distinctive townscapes composed of spatial elements are likewise indispensable to this line of research: perception of these elements directly affects street vitality [83], influences pedestrian aggregation and route choice behaviors [84], and is crucial for town design [85]. The emphasis on visual perception has been a key driver of the shift in trajectory studies from two- to three-dimensional perspectives [86]. Mechanistically, effects operate, on the one hand, through people’s abstract perception of scale, spatial relations, and boundaries, and, on the other, through their understanding of specific elements and images [87]. This stands apart from earlier work that focused solely on visual aesthetics as a determinant of walking [29]. Such embodied perception profoundly shapes visitors’ situational experience and further stimulates the “slow tourism” vitality characteristic of ancient towns [88]. In Jiangnan water towns, for example, water features exert a strong attraction; yet the visual appeal of traditional elements—such as bridges and buildings—varies with viewing angle, and elements such as boats and lanterns exhibit complex attraction mechanisms. Consequently, studies on how visual attraction influences walking perception should not be reduced to whether an element merely appears within the visual field or to a simplistic “the more, the better” premise [68].
2.2. Review of Video-Based Technologies on Pedestrian Trajectory Data Collection
How to efficiently collect spatial and behavioral information and cost-effectively quantify pedestrian dynamics has become a key research focus [89]. In early studies, technological constraints made it difficult to establish quantitative links between the street built environment (SBE) and pedestrian activity [90]. Some scholars have relied on methods such as on-site observation [91] and questionnaires [92] to collect data. Although these approaches are suitable for capturing behavioral details and subjective perceptions and are simple to implement and easy to disseminate, they require researchers to be involved in collecting each data sample, which limits sample size and spatiotemporal coverage and often leads to high labor costs. Moreover, such participatory or semi-participatory methods can interfere with participants’ natural behavior, resulting in distorted or biased information [11]. With advances in information technology, the advent of big data and the Internet of Things has begun to transform how pedestrian dynamics are measured, helping to overcome many limitations of traditional methods. Big data—characterized by large volume, rapid acquisition, and broad coverage—offers unprecedented opportunities for real-time exploration of crowd–space interactions [93]; examples include Wi-Fi probes [94], ultrawideband (UWB) locators [95], GPS traces [41], social media check-ins [96], and transaction records [97]. However, these sources can suffer from positional inaccuracies [98], uneven timeliness and completeness [90], and in some cases, the “atomistic fallacy,” where data from specific apps or handheld GPSs used by a limited subset are erroneously assumed to represent the whole [99].
Compared with the above, surveillance video has increasingly been adopted to fill these gaps, and its value for pedestrian trajectory research is being amplified by computer vision [6]. CCTV has been used since the early 2000s to study pedestrian behavior in public spaces [100]. The resulting information is highly precise and supports fine-grained analyses. At scale, networks of cameras can provide comprehensive and balanced spatial coverage or be targeted at key nodes to capture site-specific dynamics [101]. Moreover, such data collection and analysis are highly automated, and the inherently dynamic nature of video supports the construction of spatiotemporally continuous portraits of urban vitality [93]. Concretely, CCTV data allow extraction of static headcounts, flow volumes, spatial locations, and other trajectory-related indicators that enable more accurate decomposition and analysis of walking patterns [102]. For example, Hou et al. quantified small space utilization by extracting these indicators [103], Yan et al. stacked pedestrian trajectories to analyze the spatiotemporal distribution of dwell times [100], and Li et al. used multi-object tracking (MOT) to study pedestrian dynamics and proposed a classification approach to derive activity-based metrics [104]. Likewise, other scholars have utilized MOT to quantify vitality from pedestrian counts and to infer activity types [105].
Across these studies, methods such as support vector machines (SVMs), random forests (RF), convolutional neural networks (CNNs), and recurrent neural networks (RNNs) have substantially improved recognition accuracy and efficiency. In practice, however, high crowd density can still degrade performance, underscoring the importance of improving algorithms capable of enumerating all individuals present in an image [106]. To address such extreme cases, Liu et al., drawing on Hall’s theory of proxemics, examined relationships between crowd density and interpersonal distance to optimize pedestrian recognition algorithms [107]. In parallel, Kryjak [108], Zhang [109], and many others have contributed to the advancement of surveillance video analysis techniques.
3. Methodology
3.1. Research Framework
To investigate the spatial distribution of pedestrian dynamics and the mechanisms through which influencing factors operate in Jiangnan water towns, this study proceeds in three steps. First, drawing on prior research (site selection criteria) and a field survey of the street–lane system in Nanxun Ancient Town, we identified 95 representative observation locations (Section 3.3.1). During subsequent video monitoring, valid data were obtained for 93 of these sites (Section 3.3.2). Second, based on a literature review and on-site surveys, we defined pedestrian dynamics indicators for ancient town contexts and a suite of potential influencing factors. Using computer vision (object detection), we quantified the following indicators: number of people, walking speed, and trajectory complexity (Section 3.3.3). In parallel, through field measurements, statistical tabulation, and space syntax analysis, we compiled and quantified 18 pedestrian dynamics factors under two categories—spatial morphology and spatial elements—including integration, lane width, functional diversity, and visual attractiveness (Section 3.3.4). Third, we conducted regression analysis by inputting the pedestrian dynamics factors and indicators as predictors and responses, respectively, into a Python-implemented random forest model, and employed SHAP to interpret nonlinear relationships between predictors and responses (Section 3.4). Figure 1 presents the overall research framework adopted in this study.
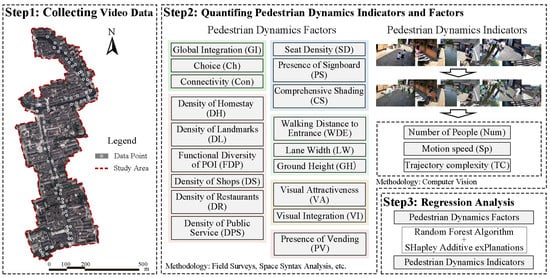
Figure 1.
Research framework.
3.2. Study Area
Nanxun Ancient Town is located in Nanxun District, Huzhou, northern Zhejiang Province, adjacent to Suzhou in Jiangsu. Renowned during the Ming and Qing dynasties for its flourishing silk industry, Nanxun possesses rich cultural heritage and a distinctive blend of Chinese and Western architectural styles. Celebrated as the “Land of Culture” and the “Hometown of Poetry and Books,” it was historically the wealthiest among Zhejiang’s “Six Ancient Towns” [110]. The town is divided into four zones: a core protection area, a traditional-style coordination area, a transitional area outside the protection belt, and a general urban construction area. The core protection and traditional-style coordination areas together constitute the principal conservation zone, covering about 2 km2 and showcasing the quintessential features of a modern Jiangnan water town [111]. Benefiting from classic landscapes and sound conservation management, Nanxun’s tourism appeal has continued to rise. In 2024, visitor arrivals exceeded 20 million—an increase of 65.89% over 2023—setting a new benchmark for ancient town tourism in China; during the May Day holiday in 2025 alone, the town welcomed approximately 1.65 million visitors [112].
Our research focuses on the main scenic corridor of Nanxun Old Town, which runs in a narrow north–south orientation (Figure 2). The site exhibits a pronounced land–water interface, with building clusters and key spatial landmarks—such as plazas and piers—arrayed along both riverbanks, generating a varied and vibrant spatial character. The corridor is punctuated by numerous bridges of different scales and multiple well-preserved historic residences.
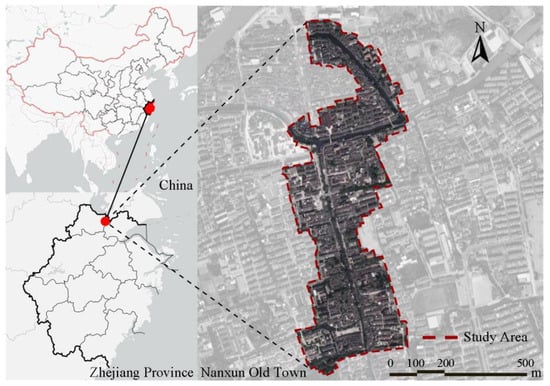
Figure 2.
Location of the study area in Huzhou, China.
3.3. Data Collection
3.3.1. Sample Selection
The data collection points initially used in this study were not randomly selected but were determined based on the authors’ previous research on Chinese water towns conducted within a broader research framework [68]. In urban street studies, some scholars select data collection points at fixed intervals. However, given the complexity and heterogeneity of Jiangnan water towns, such scene-agnostic sampling can undermine the locality of findings. Inspired by Kevin Lynch’s theory of the five elements of city image [113] and drawing upon both domestic and international research on spatial sampling in historic towns [114,115], we established the following criteria for selecting observation sites: (1) locations along main tourist flow lines; (2) intersections of two or more visitor routes; (3) distinctive spatial nodes such as boat piers, plazas, or bridge tops; and (4) midpoints of long, continuous spaces such as streets or corridors. Guided by these principles, we identified an initial set of 95 locations. Previous studies have verified the feasibility of this sampling strategy through empirical analysis. Accordingly, we adopted these 95 sites as our initial data collection points, making minor adjustments according to the actual installation of surveillance equipment.
3.3.2. Acquisition of Surveillance Video Data
Given that existing surveillance within the scenic area was installed by multiple entities (public security authorities, scenic area management, etc.), with heterogeneous hardware and no unified authorization, we deployed compact cameras on site to collect the required video data. Based on field reconnaissance, two of the initially planned 95 sampling locations were excluded due to the lack of suitable mounting positions and objections from nearby vendors, yielding 93 valid sites. To maximize consistency in video quality, we used the same camera model across all 93 sites. Filming took place on 16 August 2025 (clear weather), from 09:00 to 11:00—aligned with the shooting window used by Xu et al. for street view imagery in their visual attractiveness study [68]. Figure 3 presents the spatial distribution of valid sites, photographs of several camera installations, and representative video screenshots.
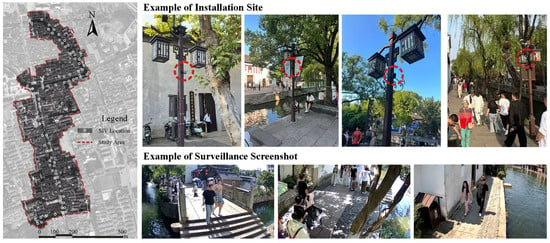
Figure 3.
Acquisition of surveillance video data.
3.3.3. Pedestrian Dynamics Indicators and Measurement
In classical theories of pedestrian dynamics, scholars centered core descriptors on pedestrian volume, walking speed, and pedestrian location—metrics that have been widely adopted in recent studies [116]. Accordingly, drawing on prior work, we probe the spatial characteristics, influencing factors, and action mechanisms of pedestrian dynamics in Nanxun Ancient Town from a trajectory perspective using three indicators: number of people (Num), motion speed (Sp), and trajectory complexity (TC).
These trajectory-based indicators can be efficiently derived with surveillance video and computer vision [6]. In this study, we perform pedestrian detection on video sequences using the computer vision model YOLOv8 and extract bounding boxes for crowd volume analysis. Figure 4 shows the YOLOv8 model architecture used in this study. As a major iteration of the YOLO family, YOLOv8 improves upon YOLOv5 in the backbone, detection head, sample assignment, and loss functions [117]. Its backbone adopts a lightweight C2f module to enhance feature fusion and gradient flow; the detection head employs an anchor-free, decoupled design that separates classification from regression, simplifying training and improving generalization. The network comprises a backbone for multi-scale feature extraction, a neck that fuses cross-level features (drawing on FPN and PANet), and a head for classification and localization. In addition, YOLOv8 leverages more efficient data augmentation and optimization strategies, delivering strong accuracy and real-time performance on datasets such as COCO.
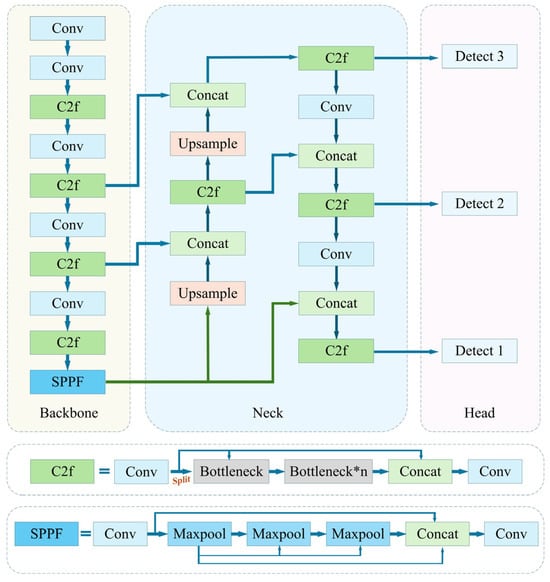
Figure 4.
YOLOv8 model architecture used in this study.
In each frame of the video sequence, the YOLOv8 model outputs a set of pedestrian detections where each bounding box consists of coordinate information and a confidence score. Let the i-th pedestrian detection box in the current frame be denoted as:
(,) and () denote the top-left and bottom-right coordinates of the detection box, respectively, and is the confidence that the target belongs to the “pedestrian” class.
For several key areas within the scenic site (e.g., counting flows only at main entrances or specific attractions), we pre-define mask regions , each described by the polygon’s vertex coordinates:
Here, denotes the number of vertices of region . For each detected pedestrian , we approximate the foot position by the bottom of the bounding box to determine whether the pedestrian has entered a mask region. Specifically, if the midpoint or either endpoint of the bottom edge of the detection box intersects region , the pedestrian is considered to have entered the corresponding mask. This strategy preserves computational efficiency while accurately reflecting entries into designated areas.
To avoid double counting the same individual, we perform multi-target association for crowd tracking. Target matching links detection boxes in the current frame to existing track identities. We measure the overlap between two boxes using the intersection over union (IoU), defined as:
Let and denote the detection box in the current frame and the previously tracked target box, respectively. If the IoU between a detection box and a tracked box exceeds a preset threshold, they are deemed to correspond to the same target, and the existing ID is inherited. Conversely, if the IoU falls below the threshold, the detection is treated as a new instance, and a new ID is assigned.
Meanwhile, we evaluate overall pedestrian detection performance using mAP50, i.e., mean average precision at an IoU threshold of 0.5. Specifically, mAP50 is obtained by computing the average precision for all categories under IoU = 0.5 and then averaging across categories to yield a global metric. To illustrate model performance across different settings, we randomly selected 15 of the 93 test scenes and visualized their mAP results (see Figure 5). Notably, the global mean mAP50 reached a solid 86.2%. The following section presents a concise overview of the selected pedestrian dynamics indicators and the computational procedures used for further processing.
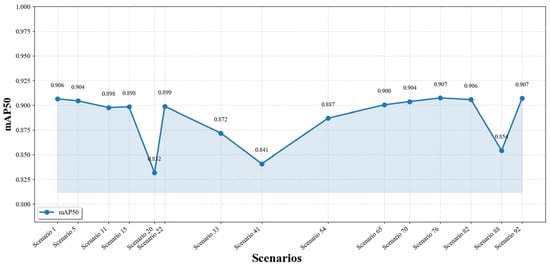
Figure 5.
mAP50 results for 15 randomly sampled scenes.
- Number of people (Num)
Number of people is one of the core indicators of pedestrian dynamics within confined street spaces [118]. Accordingly, we use this metric to analyze trajectory features such as route choice and clustering preferences of visitors in old towns. Specifically, we first use the tracking algorithm (see above) to detect pedestrians entering the image mask region and cumulatively count the total number of individuals entering the observation area over the entire video. We then divide this value by the video duration (i.e., total frames ÷ frame rate) and convert the result to an hourly throughflow. The computational procedures for all dynamics indicators are summarized in Table 1.

Table 1.
Calculation methods for pedestrian dynamics indicators.
- 2.
- Motion speed (Sp)
A pedestrian is commonly defined as an individual traveling on foot, and individual walking speed is commonly defined as the distance covered over the time spent traveling [119]. Walking speed is a key variable in pedestrian dynamics research because it directly relates to infrastructure operations and level of service under both normal and disrupted conditions [120]. This indicator was calculated proceed as follows. When a pedestrian enters the observation area, we take the bottom-center point of the YOLO detection box as the representative position and continuously track this point across subsequent frames, reconstructing the individual’s complete trajectory within the area until the pedestrian exits (Figure 6). By accumulating the displacements between the center points in adjacent frames, we obtain the pedestrian’s total travel distance in pixel space. Using the scale factor that links pixel units to real-world units, we convert pixel distance to actual walking distance. We assume the pedestrian represented by the YOLO box has an average real height of approximately 1.70 m, and on this basis establish a proportional relationship between the box’s pixel height and its physical height, thereby mapping pixel measurements to meters. Meanwhile, the individual’s dwell time within the area is calculated from the frame count and the video frame rate. Given the above distance and time information, we compute each pedestrian’s mean walking speed within the observation area. Finally, we average the speeds of all observed individuals to obtain the site-level mean walking speed.
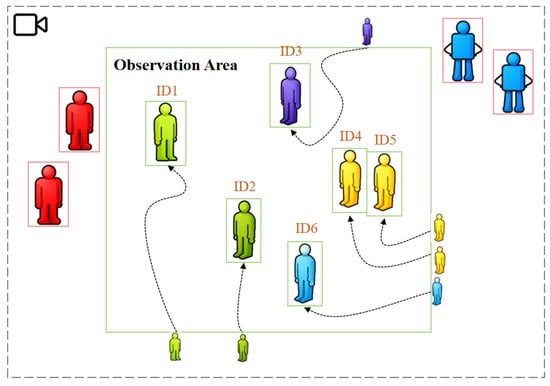
Figure 6.
Illustration of pedestrian identification and trajectory extraction.
- 3.
- Trajectory complexity (TC)
Trajectory complexity captures the characteristics of pedestrian movement between different origins and destinations. Even when start and end locations are similar, movement patterns within the site can differ markedly due to varying trip purposes. By incorporating this indicator, we can probe pedestrian dynamics beyond speed and flow, enabling a deeper examination of their attributes and the ways they are influenced. Methodologically, we adopt a centroid-based distance distribution strategy that incorporates the notion of the radius of gyration from human mobility analysis [121]. Specifically, taking the trajectory centroid as the reference, we compute the mean Euclidean distance from each sampled trajectory point to the centroid to characterize the spatial dispersion of a pedestrian’s path. This measure effectively captures local-scale movement diffusion and variations in path morphology. It markedly improves computational efficiency and scalability while preserving spatial interpretability. Finally, we average individual values across all pedestrians to obtain the site-level trajectory complexity indicator.
3.3.4. Pedestrian Dynamics Factors and Measurement
Following the construction of pedestrian dynamics indicators, we introduce the corresponding factor set and its measurement protocols to enable mechanism-oriented analysis. Based on a review of relevant studies and field investigations, this study classifies the factors influencing pedestrian dynamics in ancient towns into two major categories: spatial morphology and spatial elements. The former is further divided into configurational factors and three-dimensional morphology, while the latter encompasses four sub-types: amenity, visual perception, activity factor, and POI. The following sections, organized by types, briefly describe the rationale for indicator selection, as well as the measurement and computation methods.
- Spatial morphology
Within the configurational factors category, global integration, choice, and connectivity are widely used street network metrics. They reflect, respectively, a street’s centrality within the overall network, its importance to through-movement, and its direct adjacency relations; together, they indicate spatial accessibility and are commonly considered key determinants of pedestrian dynamics [37,46]. These metrics are computed under the space syntax framework. To compute these metrics, we first produced a CAD axial map of the street network based on in situ surveying and satellite imagery, and then imported it into DepthmapX v0.8.0 for quantification. Given the winding alignments and small spatial scales of ancient town streets, we employed the segment model to perform the calculations so as to improve analytical accuracy. In bounded spaces, the configuration of site entrances can significantly affect the walking cost to different interior areas [50]. This effect also operates in ancient towns, where entrances often differ in hierarchy and are unevenly distributed. To determine the importance of each entrance, we obtained entry counts for the survey day from the Nanxun Ancient Town Administration. The relative shares of these counts were used to derive entrance weights, which were then incorporated into a weighted walking cost calculation between entrances and sampling locations. We designated this factor Walking Distance to Entrance (WDE).
In terms of three-dimensional morphology, the effective walkable width of a street is commonly regarded as a key indicator of its capacity to accommodate pedestrian activity—wider streets can host more pedestrians, ensure unobstructed passage, and support a broader range of activities [55,56]. We measured this indicator in situ using a centimeter-level laser rangefinder. We designated this variable as Lane Width (LW). Furthermore, arch bridges are distinctive, place-specific elements in Jiangnan ancient towns and core components of the classic townscape [122]; however, the climbing required to traverse them can dampen willingness to pass [123]. We used the height difference between the bridge crown and the ground at the bridgehead as the elevation indicator for on-site measurement accuracy and convenience (Ground Height, GH) [66]. The values were obtained with a laser rangefinder. The computational procedures for all dynamics factors are summarized in Table 2.
Table 2.
Calculation methods for pedestrian dynamics factors.
- 2.
- Spatial elements
The substance reflected by pedestrian walking trajectories is the diversity of human activities in space—conversation, strolling, resting, and more [15]. Starting from the spatial requirements of these activities, one can further mine the spatial elements underlying pedestrian dynamics. Among these, POI diversity and density have often been shown to play a prerequisite role in shaping crowd activity within an area [124]. Notably, studies in historic streets and ancient towns indicate that while overall POI density is influential, the effects vary by POI type: restaurants, shops, public services, and key attractions contribute quite differently to street appeal [24,125]. Based on our field surveys, we further disaggregate POIs into five categories to enable differentiated analysis—shops, restaurants, public services, homestays, and landmarks. Because POIs in ancient towns are dense and major geospatial platforms cannot provide complete and accurate POI attributes and coordinates, we used a meter-level handheld GPS to determine each POI’s precise location and manually recorded its functional type on site. We then employed the Kernel Density tool in QGIS (v3.42.3) to compute the functional density at each sampling location (i.e., density of shops/restaurants/public services/homestays/landmarks). In parallel, using the Shannon entropy algorithm, we calculated the Functional Diversity of POIs (FDP) to capture how functional richness and evenness influence pedestrian walking [126].
In this study, we also explicitly account for the micro- to meso-scale influences of seating [75], shading [77], and signboards [80] on pedestrian dynamics. Given that the seating depth at all sampled sites is similar—uniform single-person, single-row configurations—we defined Seat Density (SD) as the ratio of the measured bench length to the effective area captured by surveillance. The practice of using seating length as a proxy for seating area has been empirically validated in previous studies [126]. While prior work often codes shading as a binary “presence/absence” variable or estimates it via the water surface projection of shading elements [127], we use the proportion of shaded area within the actual monitoring extent to mitigate noise from ineffective shade.
Furthermore, Jiangnan water towns are renowned for the spatial imagery of “small bridges over flowing water and dwellings” [128], a perceptual construct whose influence exceeds that of any single environmental element and thus merits inclusion. Benefiting from prior quantitative work in Nanxun, visual attractiveness already has a reasonably reliable operationalization [68]. We therefore adopt those results and pair them with visual integration from space syntax—which helps characterize visual fields/perception domains in micro- to small-scale spaces [62]—to form a two-variable visual perception layer. In addition, we introduce an independent variable, presence of vending, to assess the potential impact of such temporary activities on pedestrian flows [129], a factor that has at times been overlooked in other ancient town settings.
3.4. Establishing the Regression Model
The key step in constructing the regression model is to determine the weight of each factor’s impact on the attractiveness rating. To avoid subjective weighting and the lower precision and efficiency associated with manual methods such as Analytic Hierarchy Process (AHP), we adopt a data-driven approach and use the random forest algorithm to estimate variable weights. First formalized by Breiman, random forest is an efficient machine learning method that evaluates variable importance while exhibiting strong resistance to overfitting—further improvable via hyperparameter tuning [130]. It also captures interactions among factors and mitigates disturbances arising from heterogeneous data distributions. Moreover, even with multiple predictors and relatively small sample sizes, random forest maintains robust predictive stability and generalization. In this regression stage, the previously defined pedestrian dynamics indicators and factors were set as dependent and independent variables, respectively. Before model construction, all variables, including those related to space syntax [25,27], were standardized using Z-scores to eliminate the influence of dimensional differences on regression results. This normalization also enhances the generalizability of the findings for potential cross-regional studies. Methodologically, we implemented the random forest regression model in Python 3.12 using PyCharm 2024.3.1.1, by calling libraries such as scikit-learn and NumPy. This allowed us to perform separate regressions for the three dependent variables and ultimately obtain the global importance of each independent variable in explaining them.
However, importance scores derived from random forest are static, global summaries and cannot by themselves clarify how each predictor’s effect varies across different value ranges of the outcome. To probe these heterogeneous effects, we employ SHAP, a game-theoretic framework proposed by Lundberg et al. [131] SHAP provides nonlinear fits and visualization tools that elucidate the complex, context-dependent mechanisms through which influencing factors shape pedestrian dynamics. This method has demonstrated strong applicability and explanatory power in multivariate studies where the relationships among variables are complex [132]. Similar to the construction process of the random forest regression model, we also implemented the SHAP algorithm in Python, building upon the previously established random forest models. This approach outputs the contribution values of each factor to the corresponding pedestrian dynamics indicators, together with three sets of SHAP summary plots and SHAP dependence plots.
4. Results
4.1. Validation of Regression Model
Four separate models were constructed for the three vitality indicators, and their training and testing performance is summarized in Table 3. Among the evaluation metrics, R2 was adopted as the primary measure of explanatory power, with values closer to 1 indicating stronger model performance. In this study, the testing R2 values were as follows: TC = 0.867 (training 0.932), Num = 0.819 (training 0.894), and Sp = 0.667 (training 0.859). Overall, the testing R2 values ranged from 0.67 to 0.87, suggesting that the models effectively captured the nonlinear relationships between street vitality and the eighteen influencing factors.
Table 3.
Regression model performance.
Among the indicators, TC achieved the highest and most robust predictive performance (RMSE ≈ 0.270, MAE ≈ 0.235), reflecting its stable response to input variables. Num followed, with slightly larger errors (RMSE ≈ 0.388, MAE ≈ 0.296) but still demonstrating strong explanatory capacity. By contrast, Sp showed a moderate level of accuracy (RMSE ≈ 0.274), with greater sensitivity to variability across the data. The error-based metrics (MSE, RMSE, MAE) were consistent with the R2 ranking, and the modest discrepancies between training and testing performance indicated limited overfitting. Taken together, these results highlight that the models reproduce key patterns of vitality in Jiangnan water towns, with particularly strong predictive validity for TC and Num.
4.2. Statistical and Spatial Statistical Distributions of Variables
Table 4 summarizes the primary distributional characteristics of 22 indicators, including their minimum, maximum, mean, median, and standard deviation. Figure 7 shows the spatial distribution of variables. First, the three pedestrian dynamics indicators exhibit clear differences. Num shows the greatest variability and a south–north gradient (higher in the south, lower in the north), with a highly skewed distribution and pronounced clustering at several nodes. Sp has a big coefficient of variation (CV) and is relatively dispersed, with elevated values at only a few locations. TC stands out at key intersections and zones, reflecting the strong influence of spatial structure on walking patterns. Overall, core street nodes tend to exhibit higher crowd aggregation and more complex movement, whereas edge segments show lower vitality levels.
Table 4.
Descriptive statistics of variables.
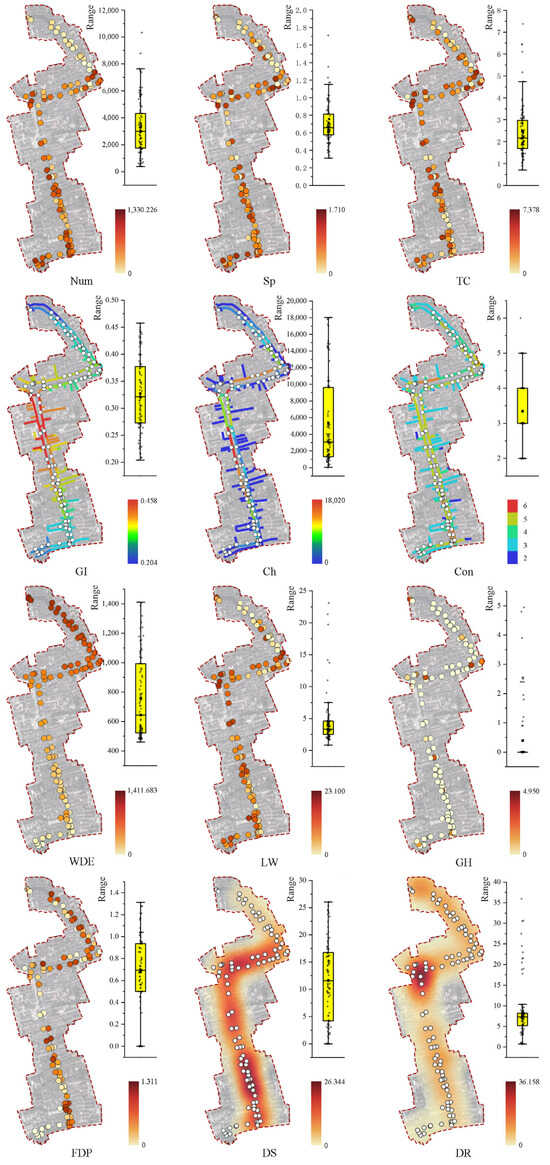
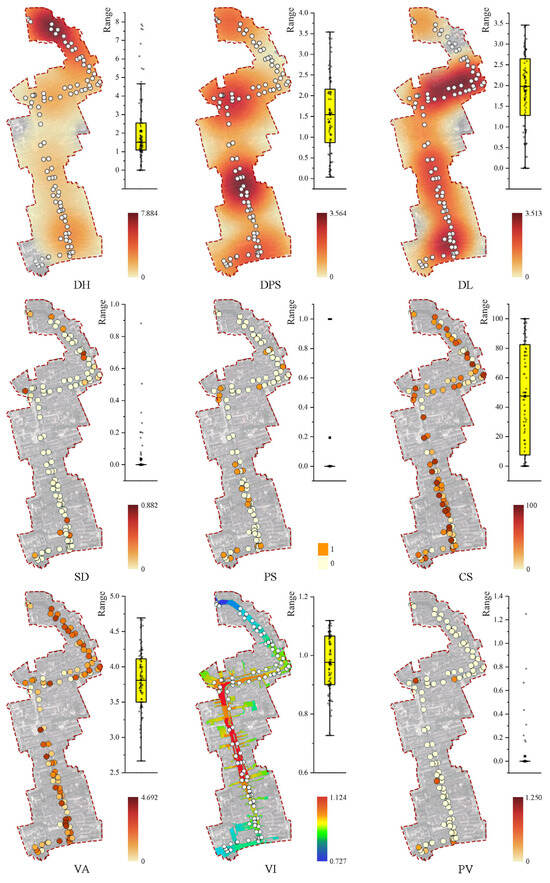
Figure 7.
Spatial distribution of variables.
Among the factors influencing pedestrian dynamics, four accessibility-related variables describe the global configuration of the street–alley system. GI varies within a relatively narrow band but is markedly higher along the central spine than along the northern and southern edges, indicating that the spatial centrality of the scenic area is concentrated along the main corridor. Ch is clearly skewed: the through-corridors flanking the north–south waterway bear most of the potential through-movement, while side streets contribute little. Con ranges only from 2 to 6, reaching its maximum at a limited number of nodes in the core area—evidence of modest local connectedness across the network. Weighted WDE spans a wide range and increases from south to north, implying higher access costs in the northern sector. This pattern is largely attributable to the major entrance being located on the southern side, which strongly shapes overall accessibility.
LW and GH objectively characterize street scale. LW ranges from 0.82 to 23.1 m, with a median of 3.327 m, consistent with Nanxun’s identity as a typical water town environment with generally narrow streets. Plan-view maps show that wider segments are concentrated around several nodal spaces and plazas, yielding a pattern of “predominantly narrow with local expansions.” GH varies modestly (0–4.95 m; median of 0.63), indicating limited overall elevation change. Spatially, most streets maintain similar heights; what varies are the bridges linking the two main corridors—highly representative and important observation points in ancient towns.
Within spatial elements, six indicators pertain to POI information—five density measures by type plus a diversity index. Overall, the FDP ranges from 0 to 1.310 (mean 0.677), suggesting intra-area differences but a generally low level of diversification, with higher mixed-use intensity on specific street segments. In terms of functional densities, DS and DR have relatively high means (≈10.672 and ≈9.258, respectively) and large deviations, indicating strong clustering and the formation of high-intensity commercial atmospheres in certain zones. Spatially, DS and DR create continuous high-value belts along the main street, forming the core commercial backbone of vitality. By contrast, DPS and DL have lower means and smaller variances, implying scattered distributions. These two POI types are spatially correlated: because public services include toilets and piers, their adjacency to landscape landmarks reflects a functionally reasonable layout.
The amenity and activity indicators capture how material elements in ancient town spaces interact with visitors. SD and PV are generally low, with medians of zero, indicating a scarcity of seating and vending on most segments, with high values appearing only at a few nodes—mainly near entrances and some intersections. PS is binary with low overall coverage and a scattered spatial pattern, appearing primarily at key movement nodes. In contrast, CS shows substantial variability, with mean and median being close, implying a relatively even spatial distribution across different shading types.
Finally, VI and VA examine the influence of spatial elements from a perceptual perspective. VA is relatively concentrated (mean ≈ 3.81; CV ≈ 0.37), indicating limited variation in perceived appeal across locations. Spatially, waterfront segments generally score higher on VA, whereas narrower stretches lacking landscape features score lower. VI also exhibits limited variance but shows a clear spatial trend: higher values concentrate in the core streets and intersections, while lower values occur at the northern and southern edges and along secondary alleys. This pattern indicates a pronounced core–periphery differentiation in the street–alley structure, with high-VI areas closely aligned with the main activity corridors.
4.3. Variable Importance
Random forest importance analysis indicates marked differences in how spatial morphology and environmental elements explain the three pedestrian dynamics indicators (Table 5). Overall, spatial morphology variables exhibit generally high importance across dimensions. At the same time, functional elements (e.g., restaurants, lodging, landmark facilities) and visual perception factors also contribute substantially in certain dimensions. This suggests that the formation of street–alley vitality in Nanxun is characterized by pronounced spatial dependence and scene sensitivity.
Table 5.
Variable importance.
First, among morphological factors, LW shows far greater importance than other variables for Sp (0.147) and TC (0.287), indicating that variations in street–alley scale are decisive for walking speed and trajectory complexity. In Nanxun, street–alley hierarchies differ markedly in scale: the main corridor runs along the water, with broad cross-sections and strong visibility, whereas secondary alleys are often narrow and enclosed—differences that translate into distinct behavioral patterns. WDE stands out as the most important variable for Num, well above others, implying that walking distance from entrances to key nodes—and the magnitude of entrance flows—critically shapes the distribution of visitor counts. The highly uneven visitor volumes across entrances in Nanxun further accentuate this skew. Meanwhile, GI and Ch maintain medium-to-high importance across multiple dimensions, indicating that overall network integration and through-movement potential exert stable predictive effects on vitality metrics.
Second, functional densities and facility configurations also show notable explanatory power in different dimensions. DR and DH rank second and third in importance for Sp, suggesting close links between restaurants/lodging and movement characteristics. Field observations indicate that uses such as dining frequently alter exterior spatial layouts (e.g., with outdoor seating), thereby affecting pedestrian trajectories. By contrast, PS and SD have relatively low importance, implying limited influence in the models.
Third, the visual perception indicators VI and VA are highly important for TC, indicating that visibility and overall townscape imagery play significant roles in shaping trajectory patterns. This likely reflects the purposive nature of tourist visits in a scenic destination such as Nanxun. By comparison, PV shows low overall importance, with modest contributions only in select dimensions—consistent with the fragmented, small-scale distribution of vending activities in Nanxun. Although its aggregate explanatory power is limited, PV can still play a meaningful role at specific nodal locations.
4.4. SHAP Values of Pedestrian Dynamics Factors
The SHAP summary plot in Figure 8 illustrates each factor’s contribution to the model’s predictions, along with the distribution of their values. From the SHAP values’ horizontal spread, it is evident that different pedestrian dynamics factors vary significantly in their importance in regard to different indicators.
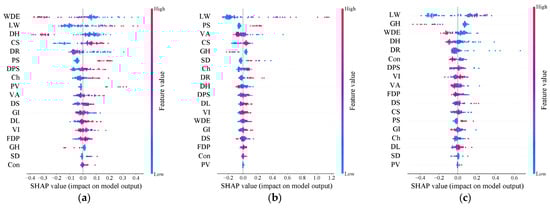
Figure 8.
(a) Shows the SHAP summary plot on Num; (b) shows the SHAP summary plot on Sp; (c) shows the SHAP summary plot on TC.
Figure 9, Figure 10 and Figure 11 show the nonlinear effects of pedestrian dynamics factors on Num, Sp, and TC, respectively. For Num, WDE and LW exhibit the largest SHAP contributions. As WDE increases, its SHAP value becomes increasingly negative, whereas LW shows the opposite pattern. This indicates that locations closer to entrances and with wider street–alley scales are more prone to large visitor aggregation—consistent with Nanxun’s linear structure of “main entrance—waterfront main street.” Spatially, the broad southern trunk road near the main entrance carries more visitors, while the narrow alleys in the far north, where walking costs are higher, attract fewer. CS and DPS also contribute notably to Num, both showing a simple positive correlation between factor value and SHAP value; thus, shading and public facilities clearly promote crowd clustering. In addition, PS and PV display similar, scattered yet positive effects, indicating that signboards and vending draw visitors to pause and cluster. In short, visitors tend to traverse the entrance-adjacent main corridor and cluster near shaded areas and public facilities, with PS and PV further reinforcing this pattern.
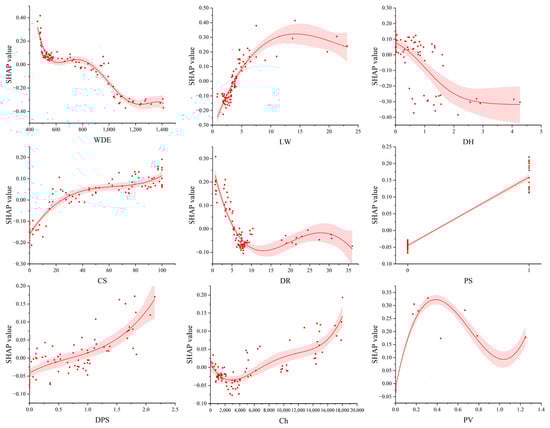
Figure 9.
The nonlinear effects of pedestrian dynamics factors on Num. The red area represents the 95% confidence interval.
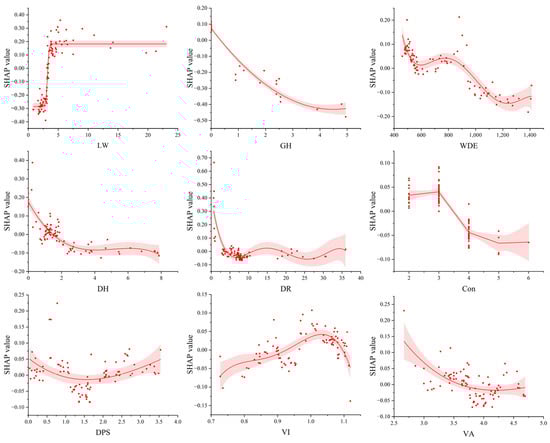
Figure 10.
The nonlinear effects of pedestrian dynamics factors on Sp. The red area represents the 95% confidence interval.
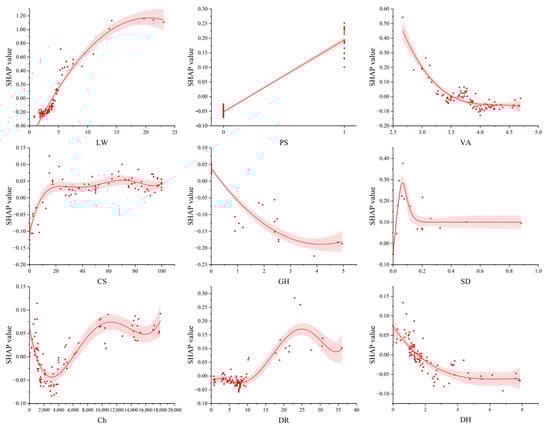
Figure 11.
The nonlinear effects of pedestrian dynamics factors on TC. The red area represents the 95% confidence interval.
For Sp, LW and GH are most prominent but with opposite trends. The SHAP plot for LW shows a clear threshold: at small widths, contributions to Sp are negative; as width increases, contributions quickly turn positive and then stabilize. Hence, narrow alleys constrain movement and reduce walking speed, whereas once width reaches 5 m, Sp is no longer limited by scale. GH and WDE share a similar pattern—SHAP values decrease and eventually turn negative as their values rise. Concretely, higher GH typically occurs atop bridges, where grade increases passage difficulty and the expanded view encourages slowing for sightseeing. The Sp reduction associated with larger WDE can be interpreted as fatigue by the time visitors reach segments farther from main entrances. DH and DR show similar SHAP trends, implying that lodging and restaurants reduce Sp—consistent with on-site observations that many homestay entries adjoin eateries, prompting lingering. Finally, VA and VI demonstrate the impact of visual perception: higher VA correlates negatively with Sp (more stopping), whereas higher VI is associated with increased forward movement, suggesting that visually integrated areas invite looking yet encourage progression. Overall, Sp reflects how spatial quality, elements, and scale either attract or impede visitors, thereby modulating touring speeds.
For TC, the spatial-scale variables LW and GH again exert significant but opposing effects. When LW is less than 5 m, narrow streets restrict movement; with greater width, visitors have more freedom to explore. Similarly, climbing to bridge crests (higher GH) limits route diversity due to constrained space. PS exerts a strong, approximately linear positive effect on TC: in its absence, SHAP values are near zero; when present, SHAP rises to 0.20–0.25, indicating that signboards substantially increase path complexity. Finally, VA shows a declining SHAP trend: at low–moderate levels, visual appeal disperses paths, but at high-VA nodes, visitors are drawn to the same iconic scenes, reducing exploratory routing. By contrast, moderate CS enhances willingness to explore in hot weather, stabilizing once coverage exceeds 20%.
5. Discussion
5.1. Spatial Morphology as the Global Foundational Constraint of Pedestrian Dynamics
Spatial morphology provides the overarching framework for pedestrian dynamics in ancient towns: it sets the core conditions that constrain overall crowd distribution and movement patterns, while Nanxun’s distinctive street–alley fabric and scales shape behavioral modes. Our results reaffirm that LW, GH, and WDE are key determinants of global distribution and mobility [65,133]. Planimetrically, WDE exerts a particularly strong influence on Num: visitor aggregation is concentrated in the waterfront blocks near the southern main entrance, while arrivals drop sharply deeper into the northern “Baijianlou” area, which aligns well with previous findings [50,51]. The same mechanism appears in the SHAP contribution to Sp: once WDE exceeds a certain level, its SHAP value declines and turns negative, indicating that walking costs surpass most visitors’ willingness to explore [36]. This effect is amplified in Nanxun’s semi-enclosed setting (unlike an open urban environment), where the southern main entrance plays a dominant role [49]. It is also notable that Con and GI—though standard space syntax measures—do not dominate here, diverging from earlier studies [134]. A plausible explanation is that the “main entrance—waterfront spine” constitutes the town’s sole high-integration axis, offering limited opportunities for free choice and exploration of secondary alleys; consequently, the explanatory power of accessibility indices (GI, Con, Ch) is diluted by more direct variables.
The strong effects of LW and GH on Num, Sp, and TC (with evident thresholds) underscore the pivotal role of scale in walking dynamics. In street–alley spaces, LW and GH correspond to the lateral and vertical boundaries, effectively defining the material envelope of pedestrian movement. In Jiangnan water towns, width varies across several spatial types—from narrow arcaded passages, to suitably scaled waterfront trunks, to open bridgehead plazas [55]. When the lane width is less than 5 m, narrowness limits aggregation and depresses Sp, while also curbing exploratory movement; once LW exceeds 5 m, width ceases to be the binding constraint, which reflects a behavioral threshold effect consistent with Manning’s theory [38]. Practically, the north–south main corridor in the ancient town generally has moderate width that maintains comfort while reinforcing the waterside imagery characteristic of Jiangnan streets, thereby attracting crowd aggregation (Figure 12a). By contrast, already narrow streets in the northern scenic sector are further constricted by shop furniture, reducing effective width and degrading the touring experience (Figure 12b). This contrast highlights how managing the spatial carrying capacity of historic streets remains a key challenge for planners and site managers, where excessive pedestrian density can surpass the comfort threshold and ultimately undermine environmental sustainability [135]. Variations in GH concentrate atop bridges. Bridges are iconic environmental elements in water towns; to clear navigation channels, historic bridges are often relatively high, affording unique vantage points. However, ascending bridges impose clear negative effects on Sp and TC; once the height difference approaches 3 m, the negative SHAP contribution tends to stabilize. In short, higher GH typically demands more effort to reach and dampens visitors’ willingness to proceed [68].
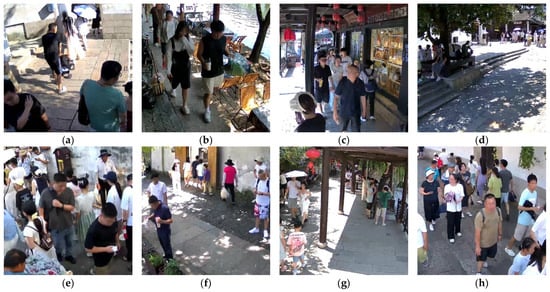
Figure 12.
Samples of dataset. (a) shows a roadway of suitable width that provides pedestrians with walking comfort; (b) shows furniture placed by shopkeepers that reduces the effective walking width; (c) shows shadows cast by buildings; (d) shows shadows cast by trees; (e) shows the minor influence of stalls placed along the roadside on pedestrians; (f) shows a scenic spot that fails to generate sufficient attraction for visitors; (g) shows crowding caused by tourists waiting in front of a restroom; (h) shows crowd aggregation at a pier.
Overall, spatial morphology-related indicators have a significant impact on pedestrian dynamics, yet the influence of individual indicators differs across specific contexts [40]. WDE governs entry and distribution, LW and GH delineate the scale boundaries for movement, and under this simple street-network structure, the roles of Con and GI are attenuated. Spatial morphology factors thus function as the “prior conditions” and “container” for global pedestrian dynamics—especially in a closed scenic area such as Nanxun, where the special layout confers foundational weight to morphology-based indicators.
5.2. Functional and Perceptual Elements Shaping Local Visiting Atmospheres
In Jiangnan water towns, perceptual and functional elements are not decisive in themselves. Instead, they shape touring behaviors by constructing local visiting atmospheres, which serve as meso-scale expressions of spatial attractiveness through spatial imagery, bodily comfort, and commercial ambience. First, VA and VI create the visual atmosphere via “what looks good” and “what can be seen”, thereby influencing pedestrian dynamics within a given area. As expected, higher VA indicates a greater visual share—or better composition—of characteristic elements such as bridges, lanterns, and water surfaces, which strengthens the Jiangnan townscape image [68]. Consequently, VA promotes visitor aggregation and reduces Sp as people slow down to appreciate street scenes. However, higher VA can also reduce TC, likely because high-quality waterfront scenery tends to lock visitors into similar viewing paths, which suggests that visual attractiveness not only enhances aggregation but also homogenizes behavior [136]. Second, the effect of VI on Sp is nonlinear: at low VI, enclosure and limited views induce hesitation and checking behavior; as VI rises, visibility and wayfinding improve, and thus, throughput increases; when VI becomes very high (e.g., on wide segments of the main street), visitors no longer “pass through quickly” but instead pause to look around [137]. Meanwhile, CS modulates experience via comfort; in Nanxun, shading is primarily provided by architectural overhangs (arcades) and trees (Figure 12c,d). With little shade, Num and TC decline; once the shaded area reaches 20%, shadier segments attract more visitors and foster freer exploration, which indicates that thermal comfort functions as a threshold-based moderator, aligning with broader walkability research [138,139]. Interestingly, in the narrow streets of ancient towns, high walls also create shaded areas, leading to a phenomenon where visitors tend to walk close to the walls—showing a pattern that differs from the findings of urban studies [140].
DR and DH are highly important for Num and Sp, indicating strong impacts on visitor distribution and pace. SHAP curves reveal nonlinearity: only at higher DR and DH levels do negative effects on Sp emerge. Dense clusters of restaurants and homestays encourage visitors to go indoors or linger and consume, thereby reducing street Num and slowing movement. The Num SHAP plots corroborate this: the positive contribution of DR and DH vanishes—and can turn negative—once density passes a threshold, implying that commercial clustering, rather than scatter, is needed to build a local commercial atmosphere [107,125]. Their effects diverge for TC: at higher density, DR tends to increase TC, whereas DH does the opposite. Closer inspection shows that restaurant clusters sit near the central convergence zone, where suitable LW lets visitors freely scan storefronts and signage, producing a distinctive foodscape and higher TC. By contrast, DH clusters lie in the far north along narrow streets; homestays often combine with tea rooms or light dining and place furniture outdoors, further constricting space and curbing exploratory freedom [141]. Notably, DS does not affect behavior as strongly as expected, suggesting that overly uniform shop distribution weakens marginal attraction—shops recede into the background rather than acting as salient draws [142]—raising concerns about over-commercialization. This finding resonates with the broader debates on over-commercialization in water-town contexts, where excessive concentration of shops tends to undermine the authenticity and social diversity of historic districts [143]. At the same time, it confirms that sustainable tourism development depends not only on the physical fabric of water towns but also on effective local governance—specifically, how to balance commercial interests with the preservation of the overall cultural atmosphere [144]. Likewise, functional diversity—a core vitality driver in many urban studies [145]—performs modestly in Nanxun. Even though its SHAP contribution is relatively stable, its overall impact is limited, likely because, as a closed cultural–tourism destination, visitors prioritize iconic local scenery and specialty foods [128] over the urban-like demand for highly diversified consumption.
Overall, functional and perceptual elements do not directly alter street–alley geometry, but they shape visibility through visual attraction (VA, VI), tune walkability via comfort (CS), and reconstruct conviviality through commercial ambience (DR, DH, DS). In doing so, they create distinctive local visiting atmospheres at the meso-scale, which can be regarded as tangible manifestations of spatial attractiveness. These elements do not operate in isolation; rather, they act jointly through an attract–linger–consume pathway that steers localized route choices and behavior patterns.
5.3. Nodal Elements as Site-Centered Intensifiers of Pedestrian Dynamics
At the nodal level, factors further exert anchoring and perturbation effects on pedestrian dynamics. As elements that require close-up observation and on-site interaction, PS, PV, and SD exert relatively concentrated effects on dynamics, and their benefits change more rapidly and markedly. First, the presence of signboard attracts visitors to nodes and induces returns or deviations from straight routes—yielding higher TC. This occurs because walkers continually update route plans in response to environmental cues [146]; in ancient towns dominated by slow tourism [88], this tendency is amplified at bridgeheads where scenery changes abruptly, at intersections, and after long walking stretches when visitors actively search for their next destination. Note, however, that PS sometimes occurs at intersections or on heavily trafficked corridors that already have strong route-choice properties; such co-occurring effects should be interpreted with care. Although PS has a relatively small direct effect on Sp, the summary plots show an overall positive influence, which is consistent with previous studies [147]: clear wayfinding signs and map boards help visitors quickly locate themselves and plan new routes, reducing “lostness” [148] and hesitation and—especially at hub-like traffic nodes—amplifying the guiding and activating effects on dynamics. In addition, the SHAP value plots of TC reveal that PS also exerts an influence on visitors’ approaching behavior. We also observe the influence of PV at nodal spaces with Ch values (e.g., bridgeheads, plazas, near public facilities), which is consistent with common patterns observed in urban contexts [129]. In general, PV strengthens crowd clustering but shows no pronounced effect on Sp or TC. While some studies report that street vending can disrupt or even interrupt pedestrian trajectories [149], in Nanxun, vendors typically place stalls along riverbanks or under trees (Figure 12e), minimally encroaching on effective walking space; hence, PV has limited impacts on TC and Sp. It is reasonable to infer that PV operates at a broader catchment scale, and its attraction would be better revealed in a larger study area. Furthermore, in light of previous research, the affordance factor SD also warrants attention [150]. On the one hand, seating alters pedestrian trajectories, slows movement, and enhances the quality of slow tourism—making SD an important micro-level factor. On the other hand, the type, amount, and placement of seating matter: moderate additions of public traditional benches can foster more positive dynamics, whereas in the northern “Baijianlou” area, many seats belong to private restaurants or homestays and are not freely accessible, creating a clear limit to their contribution.
DPS exhibits a more complex intervention effect on dynamics. Both restrooms and boat piers exert a positive, system-wide effect on crowd aggregation. This phenomenon largely arises because these public services are prominently presented to the public via information boards and digital maps, thereby generating an area-wide pull that extends beyond the video-surveillance coverage. Their influence peaks in the immediately adjacent areas. As shown in Figure 8, public service facilities have a strong positive impact on aggregation—spaces in front of restrooms and at piers (Figure 12f,g) are major clustering points. Notably, although DL likewise exhibits a system-wide influence and, as part of the POI set, would be expected to function as a landmark, it shows little effect on visitor dynamics here. Likely reasons include the following: (1) many attractions are courtyard-type compounds with relatively inconspicuous entrance signage, yielding low visual salience (Figure 12h); (2) although the scenic area is free-entry overall, these specific sites charge additional fees, and visitors prioritize riverside streetscape experiences over curated exhibitions [34]—dampening the draw of DL.
In sum, point elements in Nanxun exhibit nuanced, context-dependent effects through diverse point-based, nodal modes of action. By attracting at key nodes, inducing nodal perturbations along paths, and adjusting facility provision, they reshape Sp, TC, and local clustering at the node scale, thereby fine-tuning pedestrian dynamics beyond the macro-level structure.
5.4. Policy Recommendations
A systemic excavation of the factors influencing pedestrian dynamics in Jiangnan water towns—and an in-depth inquiry into their mechanisms—can provide comprehensive, actionable guidance for spatial conservation and renewal, distinctive cultural–tourism development, and precinct management.
First, prioritize the leading role of street spatial morphology in shaping scenic area pedestrian dynamics. While respecting the existing fabric and townscape, systematically identify and rectify blocked or illegally occupied alleys, open micro-circulation loops, and expand the walkable network to enhance internal accessibility and permeability. In parallel, implement a combined strategy of “cross-section clearance, pocket setbacks, movable facilities” to improve corridor throughput without undermining shop rights or frontage quality; adopt graded management for streets of different scales and functions and establish matching operational regimes for business formats. Regarding arrival organization, moderately add or activate secondary entrances and transfer points (e.g., opening or activating northern secondary entrances or shuttle nodes; time- and zone-based admission during holidays). From parking lots and bus stops to the main corridor, lay out more direct pedestrian feeder lines to reduce walking costs, balance flows and trip burdens at the source, and avoid vitality decay and spatial imbalance in distal segments caused by the “long-distance fatigue effect.”
Second, cultivate atmospheric factors and enhance bodily comfort. In terms of scene construction, mine the distinctive spatial imagery of Jiangnan (bridges, water, courtyards, alleys), and use small-scale micro-renewal and frontage repair to upgrade spatial resource quality—stimulating higher-level spontaneous strolling, reducing inefficient wandering, and adapting design or management to the perceptual intent and visual field of each scene. For comfort, employ buildings, walls, trees, and colonnades to create continuous cool walk experiences that increase willingness to linger and improve utilization of tourism resources. Note that ancient town visitation is dominated by experiential activities such as sightseeing and dining: while commercial and food and beverage elements positively affect pedestrian dynamics, there is a ceiling to gains from functional diversity. Avoid large-scale, homogeneous replication of traditional commercial streets with an “everything and more” mindset; instead, preserve a small-but-refined, accessible, and frontage-friendly mixed pattern.
Finally, building on the two dimensions above, strengthen the nodal factors as local intensifiers of pedestrian dynamics and fully leverage their anchoring effect. Capitalize on high baseline flows at transport hubs by completing a highly legible, continuous wayfinding system to raise touring efficiency; improve landmark buildings’ visual and semantic recognizability and organize a themed sequence of attractions that is both unique and continuous and integrated into the town’s overall conservation–development framework. At the same time, increase capacity and order management around public service facilities so that their siphon effect does not produce crowding or degrade experience; regulate temporary stalls and “encroaching” seating with designated locations, times, and quantities, coupled with aesthetic guidelines—maximizing micro-scale vitality without encroaching on the pedestrian cross-section.
In conclusion, the optimization of pedestrian dynamics in water towns should be grounded in the refinement of distinctive spatial morphology, centered on environmental comfort and atmosphere creation, and guided by meticulous nodal management—forming an integrated strategy that balances vitality with heritage preservation. These recommendations not only help enhance visitor experience and spatial quality but also provide practical insights for the sustainable tourism management of similar historic water towns.
5.5. Limitations
Although our models demonstrate good explanatory power and help illuminate the spatial characteristics of pedestrian dynamics in Jiangnan water towns—together with the key factors and their plausible mechanisms—several limitations remain. First, while our analysis has, to some extent, considered multisensory aspects, auditory and olfactory factors have not yet been incorporated into the quantitative investigation even though they may shape movement and lingering behavior. In addition, potential endogeneity among the dependent variables (e.g., mutual influences between pedestrian counts and walking speed) was not modeled explicitly. Future work should extend the feature set to include multisensory factors and adopt more sophisticated joint frameworks—such as multivariate or structural models, dynamic systems, or causal graphs—to probe these interdependencies.
Second, due to constraints related to manpower, the battery life of the temporary cameras, and the limited time window during which we were permitted to install them, this study was only able to capture two hours of continuous footage. At the current stage, the video data therefore only covered a limited time span and could not fully reflect diurnal variations, particularly nighttime dynamics under characteristic lighting. Seasonal and weather effects were likewise not observed, and the study period did not coincide with typical event-based activities (e.g., water town weddings), making it impossible to assess event-induced perturbations to pedestrian flows and route choices. Consequently, this research represents only a preliminary exploration of how environmental factors influence pedestrian dynamics in the water town context. To extend the observation period, subsequent studies could collaborate with local authorities to access existing public surveillance data under ethical approval. Currently, more than one hundred CCTV cameras are deployed within Nanxun Ancient Town, and once permission is granted, these video archives would provide a large-scale dataset for extended experimentation. In summary, future research will seek to implement round-the-clock, cross-season, and multi-weather monitoring, complemented by before–during–after designs around typical events, in order to strengthen spatio-temporal representativeness and identify event effects.
Third, while computer vision allowed us to derive objective indicators (counts, walking speed, trajectory complexity), current algorithms are not yet reliable for inferring individual attributes such as age, and we lacked survey and interview data on visitor identity, preferences, and travel experience—limiting heterogeneity analyses and behavioral interpretation. Additionally, the study is confined to a single case (Nanxun) with a relatively small number of sites; some spatial nodes and tenant and land use details were not included, which may constrain model depth and coverage. Although validation metrics suggest some external generalizability, applicability to other water towns with different development intensities and morphologies requires multi-site empirical studies.
6. Conclusions
Using Nanxun Ancient Town as the case, this study proposes an integrated framework that combines video data, object detection, and data analytics to systematically evaluate pedestrian dynamics in a scenic ancient-town setting, thereby positioning the analysis within the broader domain of socio-technical systems in which human mobility interacts with technological monitoring. The framework links CCTV-extracted pedestrian trajectories to a comprehensive set of potential influencing factors. Furthermore, we employ a random forest model together with the interpretable SHAP approach to rank factor importance and to reveal their nonlinear, context-dependent effects on three core indicators: Num, Sp, and TC.
Findings show that in Jiangnan water towns, pedestrian dynamics are jointly shaped by multi-level factors and by associations within each level, yielding a complex, multi-dimensional influence mechanism. First, spatial morphology provides the foundational constraints on global dynamics. WDE, LW, and GH jointly structure patterns of overall distribution and movement. In a closed scenic area with a single main entrance, WDE produces the south–north bias in visitor presence; at the same time, the town’s characteristic street–alley scale and its arch bridges cause LW and GH to operate as thresholds on both passage and exploration. By contrast, traditional space syntax metrics (GI, Con, Ch) contribute little under Nanxun’s single-axis spatial configuration, implying that, in this particular setting, direct geometric conditions explain behavior better than abstract integration measures.
Second, functional and perceptual elements shape local touring atmospheres. VA and VI reinforce the townscape imagery typical of water towns and substantially affect aggregation, speed regulation, and tendencies to explore. Shade provided by arcades or trees improves bodily comfort, lengthens dwell time, and widens the range of routes people are willing to try. DR and DH are highly influential for Num and Sp, yet their SHAP profiles point to a nonlinear rule: only after restaurants and homestays reach a certain cluster scale does a genuine commercial ambience emerge. In contrast, DS—despite its overall density—is spread too uniformly and therefore functions as a lower-impact “background factor,” raising concerns about over-commercialization.
Finally, dispersed nodal elements act as site-centered intensifiers that adjust pedestrian dynamics in a context-dependent, multi-scale manner. PS and PV, typically concentrated at bridgeheads or intersections, act as hubs and elevate TC by triggering pauses and route replanning. DPS (restrooms, piers) produces a system-wide pull with peak effects in adjacent areas, while SD reshapes dwell–movement rhythms by extending dwell time and supporting the qualities of slow tourism. Conversely, DL—though one might expect it to be a core POI—shows limited influence in Nanxun, likely because courtyard-type attractions have low visual salience and involve additional entry fees; this pattern also signals a stronger visitor preference for the continuous riverside streetscape over isolated buildings.
In sum, pedestrian dynamics in Nanxun are not determined by any single factor but by the global baseline constraints of spatial morphology, the local atmospheric shaping of functional and perceptual elements, and the nodal adjustments of point features. Acting together, these three layers generate the distinctive pedestrian-dynamics signature of Jiangnan water towns. By integrating video-based trajectory analytics with machine learning interpretation using temporarily installed cameras, this study verifies the feasibility and effectiveness of such approaches for analyzing pedestrian dynamics in heritage environments. This methodological framework provides a replicable reference for future research on visitor behavior and environmental response in complex, small-scale cultural spaces. It also deepens understanding of pedestrian dynamics in traditional water town settings and reveals how spatial morphology, perceptual atmosphere, and nodal governance shape pedestrian dynamics, providing a basis for balancing visitor vitality with heritage conservation, offering important insights for the sustainable tourism management of similar historic water towns.
Author Contributions
Conceptualization, H.C. and C.X.; methodology, H.C.; software, H.C.; validation, R.W., W.M. and S.X.; formal analysis, H.C.; investigation, R.W., W.M. and S.X.; resources, C.X.; data curation, Z.X.; writing—original draft preparation, H.C. and C.X.; writing—review and editing, Z.X. and C.X.; visualization, H.C.; supervision, C.X.; project administration, Z.X. and C.X.; funding acquisition, Z.X. and C.X. All authors have read and agreed to the published version of the manuscript.
Funding
This research was funded by Zhejiang Provincial Philosophy and Social Sciences Planning Project (26NDJC198YB), the Scientific Research Fund of Zhejiang Provincial Education Department (Y202454182), the Science and Technology Bureau Foundation of Huzhou (2021GZ12), the Natural Science Foundation of Jiangsu Province (BK20211315), and the Humanities and Social Science Project of the Ministry of Education (18YJCZH195).
Institutional Review Board Statement
The study was conducted in accordance with the Declaration of Helsinki and approved by the Institutional Review Board (IRB) of Huzhou University (code: 202507-02, 6 July 2025).
Informed Consent Statement
Informed consent was obtained from all subjects involved in the study.
Data Availability Statement
The original contributions presented in this study are included in the article; further inquiries can be directed to the authors.
Conflicts of Interest
The authors declare no conflicts of interest.
References
- Lovreglio, R.; Kinateder, M. Augmented Reality for Pedestrian Evacuation Research: Promises and Limitations. Saf. Sci. 2020, 128, 104750. [Google Scholar] [CrossRef]
- Miguel, A.F. The Emergence of Design in Pedestrian Dynamics: Locomotion, Self-Organization, Walking Paths and Constructal Law. Phys. Life Rev. 2013, 10, 168–190. [Google Scholar] [CrossRef] [PubMed]
- Pelechano, N.; Malkawi, A. Evacuation Simulation Models: Challenges in Modeling High Rise Building Evacuation with Cellular Automata Approaches. Autom. Constr. 2008, 17, 377–385. [Google Scholar] [CrossRef]
- Liu, M.; Lo, S.M. The Quantitative Investigation on People’s Pre-Evacuation Behavior under Fire. Autom. Constr. 2011, 20, 620–628. [Google Scholar] [CrossRef]
- Xu, M.; Lan, J. The study on influence factors of visitors dynamic in tourism town based on geo-detector model: A case study in Wuzhen Xizha. Mod. Urban Res. 2023, 38, 62–66+73. (In Chinese) [Google Scholar]
- Huang, S.; Wei, R.; Lian, L.; Lo, S.; Lu, S. Review of the Application of Neural Network Approaches in Pedestrian Dynamics Studies. Heliyon 2024, 10, e30659. [Google Scholar] [CrossRef]
- Jacobs, J. The Death and Life of Great American Cities; Vintage: New York, NY, USA, 1961. [Google Scholar]
- Brownson, R.C.; Hoehner, C.M.; Day, K.; Forsyth, A.; Sallis, J.F. Measuring the Built Environment for Physical Activity. Am. J. Prev. Med. 2009, 36, S99–S123.e12. [Google Scholar] [CrossRef]
- Lynch, K. A Theory of Good City Form; MIT Press: Cambridge, MA, USA, 1981. [Google Scholar]
- Ewing, R.; Cervero, R. Travel and the Built Environment: A Meta-Analysis. J. Am. Plann. Assoc. 2010, 76, 265–294. [Google Scholar] [CrossRef]
- Miller, S.M.; Landsberger, H.A. Hawthorne Revisited: Management and the Worker, Its Critics, and Developments in Human Relations in Industry; Cornell University: Ithaca, NY, USA, 1958. [Google Scholar]
- Liu, S.; Zhang, L.; Long, Y.; Long, Y.; Xu, M. A New Urban Vitality Analysis and Evaluation Framework Based on Human Activity Modeling Using Multi-Source Big Data. ISPRS Int. J. Geo-Inf. 2020, 9, 617. [Google Scholar] [CrossRef]
- Delclòs-Alió, X.; Gutiérrez, A.; Miralles-Guasch, C. The Urban Vitality Conditions of Jane Jacobs in Barcelona: Residential and Smartphone-Based Tracking Measurements of the Built Environment in a Mediterranean Metropolis. Cities 2019, 86, 220–228. [Google Scholar] [CrossRef]
- Zhang, Y.; Shang, K.; Shi, Z.; Wang, H.; Li, X. Spatial Pattern of the Vitality of Chinese Characteristic Towns: A Perspective from Nighttime Lights. Land 2022, 11, 85. [Google Scholar] [CrossRef]
- Niu, T.; Qing, L.; Han, L.; Long, Y.; Hou, J.; Li, L.; Tang, W.; Teng, Q. Small Public Space Vitality Analysis and Evaluation Based on Human Trajectory Modeling Using Video Data. Build. Environ. 2022, 225, 109563. [Google Scholar] [CrossRef]
- Xiong, X.; Zhang, S.; Zhou, J. Problems and countermeasures of tourism development in Jiangnan ancient towns: An investigative analysis of the tourism situation in Zhouzhuang, Tongli, and Luzhi. Urban Plan. Forum 2002, 46, 61–63+80. (In Chinese) [Google Scholar]
- Zhang, D.; Qiu, F. A summary of ancient town tourism studies at home and abroad. Tour. Trib. 2011, 26, 86–92. (In Chinese) [Google Scholar]
- Ruan, Y.; Xiao, J. Seeking a win–win resolution for heritage preservation and tourism development. City Plan. Rev. 2003, 27, 86–90. (In Chinese) [Google Scholar]
- Bac, D.P. The Emergence of Sustainable Tourism—A Literature Review. Quaestus Multidiscip. Res. J. 2014, 4, 131–140. [Google Scholar]
- Leung, T.M.; Miao, S.; Lin, M.; Hou, H.; Sun, M. Tourist Walkability in Traditional Villages: The Role of Built Environment, Shareability, and Personal Attributes. Sustainability 2025, 17, 5311. [Google Scholar] [CrossRef]
- Amen, M.A.; Afara, A.; Nia, H.A. Exploring the Link between Street Layout Centrality and Walkability for Sustainable Tourism in Historical Urban Areas. Urban Sci. 2023, 7, 67. [Google Scholar] [CrossRef]
- Hunter, C.; Green, H. Tourism and the Environment: A Sustainable Relationship? Routledge: London, UK, 1995; 212p. [Google Scholar]
- WTO. Indicators of Sustainable Development for Tourist Destinations—A Guidebook; WTO: Geneva, Switzerland, 2004; 507p. [Google Scholar]
- Jia, B.; Xu, H. Study on tourist behavior at Qibao ancient town based on the combination of GVT and VEP. J. Shanghai Jiaotong Univ. Agric. Sci. 2019, 37, 102–108. (In Chinese) [Google Scholar]
- Nag, D.; Sen, J.; Goswami, A.K. Measuring Connectivity of Pedestrian Street Networks in the Built Environment for Walking: A Space-Syntax Approach. Transp. Dev. Econ. 2022, 8, 34. [Google Scholar] [CrossRef]
- Hacar, Ö.Ö.; Gülgen, F.; Bilgi, S. Evaluation of the Space Syntax Measures Affecting Pedestrian Density through Ordinal Logistic Regression Analysis. Isprs Int. J. Geo-inf. 2020, 9, 589. [Google Scholar] [CrossRef]
- Lerman, Y.; Rofè, Y.; Omer, I. Using Space Syntax to Model Pedestrian Movement in Urban Transportation Planning. Geogr. Anal. 2014, 46, 392–410. [Google Scholar] [CrossRef]
- Raford, N.; Ragland, D. Space Syntax: Innovative Pedestrian Volume Modeling Tool for Pedestrian Safety. Transp. Res. Rec. J. Transp. Res. Board 2004, 1878, 66–74. [Google Scholar] [CrossRef]
- Huang, G.; Yu, Y.; Lyu, M.; Sun, D.; Dewancker, B.; Gao, W. Impact of Physical Features on Visual Walkability Perception in Urban Commercial Streets by Using Street-View Images and Deep Learning. Buildings 2025, 15, 113. [Google Scholar] [CrossRef]
- Ying, S.; Li, L.; Gao, Y.; Zheng, X. Analysis of Relationship Between Pedestrian Facilities and Urban Morphology Based on Visibility. In Proceedings of the Geoinformatics 2008 and Joint Conference on GIS and Built Environment: The Built Environment and Its Dynamics, Guangzhou, China, 28–29 June 2008; p. 71441C. [Google Scholar] [CrossRef]
- Jamei, E.; Rajagopalan, P. Effect of Street Design on Pedestrian Thermal Comfort. Archit. Sci. Rev. 2019, 62, 92–111. [Google Scholar] [CrossRef]
- Huang, J.; Hu, X.; Wang, J.; Lu, A. How Diversity and Accessibility Affect Street Vitality in Historic Districts? Land 2023, 12, 219. [Google Scholar] [CrossRef]
- Fonseca, F.; Ribeiro, P.J.G.; Conticelli, E.; Jabbari, M.; Papageorgiou, G.; Tondelli, S.; Ramos, R.A.R. Built Environment Attributes and Their Influence on Walkability. Int. J. Sustain. Transp. 2022, 16, 660–679. [Google Scholar] [CrossRef]
- Zhang, L.; Yang, B. Analysis of the space vitality features and influencing factors of Tongli Ancient Town. Hous. Sci. 2023, 43, 17–26. (In Chinese) [Google Scholar] [CrossRef]
- Xuan, X.; Yan, M.; Zou, J.; Zheng, Y.; Zhang, Z. Exploring the influences of the tourist path space quality on visitor behaviors under a physical environment intervention: A case study based on Sanhe Ancient Town in Hefei city. S. Archit. 2024, 44, 14–28. (In Chinese) [Google Scholar]
- Zhang, J.; Zhang, L. Attraction analysis of ancient town tourism space based on space syntax and actual measurement of tour route—A case study of Tongli Ancient Town. Hous. Sci. 2020, 40, 43–47. (In Chinese) [Google Scholar] [CrossRef]
- Zhang, F.; Ye, T.; Zhou, J.; Zhu, L.; Zhou, X. Vitality evaluation of waterfront blocks in ancient area of Suzhou. J. Suzhou Univ. Sci. Technol. 2022, 35, 55–64. (In Chinese) [Google Scholar]
- Manning, R.E. Studies in Outdoor Recreation: Search and Research for Satisfaction, 3rd ed.; Oregon State University Press: Corvallis, OR, USA, 2011. [Google Scholar]
- Chen, L.; Lu, Y.; Ye, Y.; Xiao, Y.; Yang, L. Examining the Association between the Built Environment and Pedestrian Volume Using Street View Images. Cities 2022, 127, 103734. [Google Scholar] [CrossRef]
- Elzeni, M.M.; ELMokadem, A.A.; Badawy, N.M. Impact of Urban Morphology on Pedestrians: A Review of Urban Approaches. Cities 2022, 129, 103840. [Google Scholar] [CrossRef]
- Wozniak, M.; Filomena, G.; Wronkowski, A. What’s Your Type? A Taxonomy of Pedestrian Route Choice Behaviour in Cities. Transp. Res. Part F Traffic Psychol. Behav. 2025, 109, 1257–1274. [Google Scholar] [CrossRef]
- Zhai, X.; Wang, M.; Ghani, U. The SOR (Stimulus-Organism-Response) Paradigm in Online Learning: An Empirical Study of Students’ Knowledge Hiding Perceptions. Interact. Learn. Environ. 2020, 28, 586–601. [Google Scholar] [CrossRef]
- Yildirim, O.C.; Sungur, A.; Gulec Ozer, D. Understanding Measurement of Walkability in Urban Environments: A Systematic Review and Research Agenda. Int. J. Urban Sci. 2024, 1–30. [Google Scholar] [CrossRef]
- Hillier, B.; Hanson, J. The Social Logic of Space; Cambridge University Press: Cambridge, UK, 1984. [Google Scholar]
- Handy, S. Is Accessibility an Idea Whose Time Has Finally Come? Transp. Res. Part D Transp. Environ. 2020, 83, 102319. [Google Scholar] [CrossRef]
- Yoshida, N.; Nakai, T. Impact Analysis of Street Space Quality on Pedestrian Behavior Using Mobile Probe Data. IATSS Res. 2024, 48, 477–486. [Google Scholar] [CrossRef]
- Mohamed, A.A.; Kronenberg, J.; Łaszkiewicz, E. Integrating Space Syntax with Field Observations to Understand the Spatial Logic of Park Infrastructure. J. Asian Archit. Build. Eng. 2024, 23, 2115–2133. [Google Scholar] [CrossRef]
- Hajrasouliha, A.; Yin, L. The Impact of Street Network Connectivity on Pedestrian Volume. Urban Stud. 2015, 52, 2483–2497. [Google Scholar] [CrossRef]
- Yang, Y.; Vaughan, L. Does Area Type Matter for Pedestrian Distribution? Testing Movement Economy Theory on Gated and Non-Gated Housing Estates in Wuhan, China. Comput. Environ. Urban Syst. 2022, 97, 101868. [Google Scholar] [CrossRef]
- Zhai, Y.; Korça Baran, P.; Wu, C. Can Trail Spatial Attributes Predict Trail Use Level in Urban Forest Park? An Examination Integrating GPS Data and Space Syntax Theory. Urban For. Urban Green. 2018, 29, 171–182. [Google Scholar] [CrossRef]
- Zhai, Y.; Baran, P.K. Do Configurational Attributes Matter in Context of Urban Parks? Park Pathway Configurational Attributes and Senior Walking. Landsc. Urban Plan. 2016, 148, 188–202. [Google Scholar] [CrossRef]
- Liu, J.; Wang, B.; Xiao, L. Non-Linear Associations between Built Environment and Active Travel for Working and Shopping: An Extreme Gradient Boosting Approach. J. Transp. Geogr. 2021, 92, 103034. [Google Scholar] [CrossRef]
- Mao, Y.; Yin, L.; Sun, Q.; Zhu, Y.; Fan, Y.; Dai, X. A study on optimization strategies for Tongli scenic spots based on tourist behavior maps. In Proceedings of the Vitality of Urban and Rural Areas, Better Human Settlements—Proceedings of the 2019 China Annual Conference on Urban Planning (Vol. 13 Landscape and Environmental Planning), Chongqing, China, 19 October 2019; pp. 424–433. (In Chinese). [Google Scholar]
- Chen, X.; Xiang, Z.; Mao, Z. Research on the spatial vitality distribution characteristics and driving factors of ancient tourism towns: A case study of Dayan ancient town in Lijiang city. Dev. Small Cities Towns 2021, 39, 14–22. (In Chinese) [Google Scholar]
- Jin, C.-J.; Jiang, R.; Liu, T.; Li, D.; Wang, H.; Liu, X. Pedestrian Dynamics with Different Corridor Widths: Investigation on a Series of Uni-Directional and Bi-Directional Experiments. Phys. A Stat. Mech. Its Appl. 2021, 581, 126229. [Google Scholar] [CrossRef]
- Tarawneh, M.S. Evaluation of Pedestrian Speed in Jordan with Investigation of Some Contributing Factors. J. Saf. Res. 2001, 32, 229–236. [Google Scholar] [CrossRef]
- Su, L. Spatial vitality of historical and cultural block from perspective of scenario theory: Taking Suzhou Shantang historical and cultural block as an example. Urban Archit. Space 2023, 30, 88–90. (In Chinese) [Google Scholar]
- Zhang, J.; Zhou, W.; Lian, H.; Hu, R. Research on Optimization Strategy of Commercial Street Spatial Vitality Based on Pedestrian Trajectories. Buildings 2024, 14, 1240. [Google Scholar] [CrossRef]
- Angel, A.; Cohen, A.; Nelson, T.; Plaut, P. Evaluating the Relationship between Walking and Street Characteristics Based on Big Data and Machine Learning Analysis. Cities 2024, 151, 105111. [Google Scholar] [CrossRef]
- Chuang, I.-T.; Chen, Q. Urban Street Dynamics: Assessing the Relationship of Sidewalk Width and Pedestrian Activity in Auckland, New Zealand, Based on Mobile Phone Data. Urban Stud. 2025, 62, 1546–1565. [Google Scholar] [CrossRef]
- Zhang, L.; Zhang, R.; Yin, B. The Impact of the Built-up Environment of Streets on Pedestrian Activities in the Historical Area. Alex. Eng. J. 2021, 60, 285–300. [Google Scholar] [CrossRef]
- Johnsson, C.; Camporeale, R. Exploring Space Syntax Integration at Public Transport Hubs and Public Squares Using Drone Footage. Appl. Sci. 2022, 12, 6515. [Google Scholar] [CrossRef]
- Ai, D.; Wang, H.; Kuang, D.; Zhang, X.; Rao, X. Measuring Pedestrians’ Movement and Building a Visual-Based Attractiveness Map of Public Spaces Using Smartphones. Comput. Environ. Urban Syst. 2024, 108, 102070. [Google Scholar] [CrossRef]
- Ericson, J.D.; Chrastil, E.R.; Warren, W.H. Space Syntax Visibility Graph Analysis Is Not Robust to Changes in Spatial and Temporal Resolution. Environ. Plan. B-Urban Anal. City Sci. 2021, 48, 1478–1494. [Google Scholar] [CrossRef]
- Xie, W.; Wai Ming Lee, E.; Li, T.; Jiang, N.; Ma, Y. Pedestrian Dynamics on Slopes: Empirical Analysis of Level, Uphill, and Downhill Walking. Saf. Sci. 2024, 172, 106429. [Google Scholar] [CrossRef]
- Fan, P.; Wan, G.; Xu, L.; Park, H.; Xie, Y.; Liu, Y.; Yue, W.; Chen, J. Walkability in Urban Landscapes: A Comparative Study of Four Large Cities in China. Landsc. Ecol 2018, 33, 323–340. [Google Scholar] [CrossRef]
- Omwamba, J.; Rotaris, L.; Longo, G. An Assessment of Proximity in the 15-Minute City: A Systematic Literature Review. Urban Transit. 2025, 3, 100012. [Google Scholar] [CrossRef]
- Xu, C.; Cao, H.; Xia, Z.; You, X.; Wang, Z. Understanding the Influence of Environmental Elements on Spatial Attractiveness in a Jiangnan Water Town through Computer Vision Techniques. Buildings 2025, 15, 2091. [Google Scholar] [CrossRef]
- Zhou, Y.; Long, Y. Urban Development Analysis and Simulation to Address Inventory and Increment Planning: A Case Study of Chengdu. Geogr. Geo-Inf. Sci. 2016, 32, 45–51. (In Chinese) [Google Scholar]
- Cheng, K.; Xiao, L.; Xu, H.; Liang, F. A study on the spatiotemporal behavioral characteristics of tourists in ancient towns based on UGC data: A case study of Daxu ancient town, Guilin. J. Chifeng Univ. 2022, 38, 96–102. [Google Scholar] [CrossRef]
- Wu, Y.; Xie, C.; Zhang, A.; Zhao, T.; Cao, J. Spatiotemporal Analysis of Urban Vitality and Its Drivers from a Human Mobility Perspective. ISPRS Int. J. Geo-Inf. 2025, 14, 167. [Google Scholar] [CrossRef]
- Whyte, W.H. The Social Life of Small Urban Spaces; The Conservation Foundation: Washington, DC, USA, 1980. [Google Scholar]
- Nagata, S.; Nakaya, T.; Hanibuchi, T.; Amagasa, S.; Kikuchi, H.; Inoue, S. Objective Scoring of Streetscape Walkability Related to Leisure Walking: Statistical Modeling Approach with Semantic Segmentation of Google Street View Images. Health Place 2020, 66, 102428. [Google Scholar] [CrossRef] [PubMed]
- Huang, X.; Han, C.; Ma, M. Visual Preferences for Outdoor Space along Commercial Pedestrian Streets under the Influence of Plant Characteristics. PLoS ONE 2022, 17, e0264482. [Google Scholar] [CrossRef]
- Chen, Z.; Zhang, Z.; Wang, X.; Furuya, N. Interactive Contact Interface Elements and Correlations with Social Behavior in Historic Commercial Streets: A Study of Qushuiting Street, Jinan. J. Asian Archit. Build. Eng. 2025, 24, 3654–3679. [Google Scholar] [CrossRef]
- Askarizad, R.; Lamíquiz-Daudén, P.J.; Dastoum, M.; Khotbehsara, E.M.; Sharifi, A.; Garau, C. A Cross-Cultural Study to Identify Social Behaviours of Pedestrians in Urban Public Spaces: Evidence from Iran, Spain, Italy, and Australia. Sci. Rep. 2025, 15, 31338. [Google Scholar] [CrossRef]
- Levenson, M.; Pearlmutter, D.; Aleksandrowicz, O. An Observational Analysis of Shade-Related Pedestrian Activity. Build. Cities 2025, 6, 398–414. [Google Scholar] [CrossRef]
- Sang, Y.; Hu, Y.; Qin, X.; Yan, H.; Wu, R.; Qian, F.; Nan, X.; Shao, F.; Bao, Z. Impacts of Street Tree Canopy Coverage on Pedestrians’ Dynamic Thermal Perception and Walking Willingness. Sustain. Cities Soc. 2025, 121, 106196. [Google Scholar] [CrossRef]
- Ernawati, J.; Lu, D.; Esperanza, D. Making a Walkable City: Street Physical Attributes, Pedestrian Perceptions, and Walking Behaviour in Malang, Indonesia. Cities Health 2025, 1–21. [Google Scholar] [CrossRef]
- Peng, J.; Ren, C.; Lan, L.; Cui, X.; Zhang, L.; Wu, M. Effects of Pedestrians’ Visual Search Effectiveness and Behavioral Characteristics on the Wayfinding Performance at Underground Rail Interchange Stations: A Field Test Study. Tunn. Undergr. Space Technol. 2025, 162, 106617. [Google Scholar] [CrossRef]
- Dai, Z.; Li, D.; Feng, Y.; Yang, Y.; Sun, L. A Study of Pedestrian Wayfinding Behavior Based on Desktop VR Considering Both Spatial Knowledge and Visual Information. Transp. Res. Part C Emerg. Technol. 2024, 163, 104651. [Google Scholar] [CrossRef]
- Zhang, S.; Wei, K. Research on the street space activation strategy of ancient towns in Chengdu plain from the perspective of environmental behavior studies: A case study of Yuantong Ancient Town in Chongzhou. Sichuan Build. Sci. 2025, 51, 99–108. [Google Scholar] [CrossRef]
- Gehl, J. Life Between Buildings; Van Nostrand Reinhold: New York, NY, USA, 1987. [Google Scholar]
- Guo, Z.; Loo, B.P.Y. Pedestrian Environment and Route Choice: Evidence from New York City and Hong Kong. J. Transp. Geogr. 2013, 28, 124–136. [Google Scholar] [CrossRef]
- Cullen, G. The Concise Townscape; Architectural Press: New York, NY, USA, 1971. [Google Scholar]
- Peng, Y.; Cui, X.; Yu, B.; Liu, R.; Li, H. How 2D and 3D Built Environment Impact Urban Vitality: Evidence from Overhead-Level to Eye-Level Urban Form Metrics. Land 2025, 14, 1026. [Google Scholar] [CrossRef]
- Alexander, C. A Pattern Language: Towns, Buildings, Construction; Oxford University Press: New York, NY, USA, 1977; ISBN 978-0-19-972653-0. [Google Scholar]
- Xu, Q.; Chia, K.W. Beyond Slowness: Exploring Destination Stimuli and Tourists’ Emotional Connections in Slow Tourism. Acta Psychol. 2025, 259, 105402. [Google Scholar] [CrossRef]
- Jia, C.; Liu, Y.; Du, Y.; Huang, J.; Fei, T. Evaluation of Urban Vibrancy and Its Relationship with the Economic Landscape: A Case Study of Beijing. ISPRS Int. J. Geo-Inf. 2021, 10, 72. [Google Scholar] [CrossRef]
- Zou, H.; Liu, R.; Cheng, W.; Lei, J.; Ge, J. The Association between Street Built Environment and Street Vitality Based on Quantitative Analysis in Historic Areas: A Case Study of Wuhan, China. Sustainability 2023, 15, 1732. [Google Scholar] [CrossRef]
- Sung, H.-G.; Go, D.-H.; Choi, C.G. Evidence of Jacobs’s Street Life in the Great Seoul City: Identifying the Association of Physical Environment with Walking Activity on Streets. Cities 2013, 35, 164–173. [Google Scholar] [CrossRef]
- Marquet, O.; Miralles-Guasch, C. The Walkable City and the Importance of the Proximity Environments for Barcelona’s Everyday Mobility. Cities 2015, 42, 258–266. [Google Scholar] [CrossRef]
- Kim, Y.-L. Urban Vitality Measurement through Big Data and Internet of Things Technologies. ISPRS Int. J. Geo-Inf. 2025, 14, 14. [Google Scholar] [CrossRef]
- Hou, J.; Zhang, E.; Long, Y. Measuring Pedestrian Flows in Public Spaces: Inferring Walking for Transport and Recreation Using Wi-Fi Probes. Build. Environ. 2023, 230, 109999. [Google Scholar] [CrossRef]
- Jin, S.; Ma, J.; Li, J. Research on Spatio-temporal Data Association of Physical Environment and Audience Viewing Behavior in an Exhibition Hall Based on UWB Indoor Positioning Technology: Taking a Remodeled Exhibition Hall of a University in Shenzhen as an Example. Des. Commun. 2020, 4, 114–119. (In Chinese) [Google Scholar]
- Lu, R.; Wu, L.; Chu, D. Portraying the Influence Factor of Urban Vibrancy at Street Level Using Multisource Urban Data. ISPRS Int. J. Geo-Inf. 2023, 12, 402. [Google Scholar] [CrossRef]
- Carpio-Pinedo, J.; Romanillos, G.; Aparicio, D.; Martín-Caro, M.S.H.; García-Palomares, J.C.; Gutiérrez, J. Towards a New Urban Geography of Expenditure: Using Bank Card Transactions Data to Analyze Multi-Sector Spatiotemporal Distributions. Cities 2022, 131, 103894. [Google Scholar] [CrossRef]
- Wang, J.; Shi, C.; Zheng, F.; Yang, C.; Liu, X.; Liu, S.; Xia, M.; Jing, G.; Li, T.; Chen, W.; et al. Multi-Frequency Smartphone Positioning Performance Evaluation: Insights into a-GNSS PPP-B2b Services and Beyond. Satell. Navig. 2024, 5, 25. [Google Scholar] [CrossRef]
- Robertson, C.; Feick, R. Inference and Analysis across Spatial Supports in the Big Data Era: Uncertain Point Observations and Geographic Contexts. Trans. GIS. 2018, 22, 455–476. [Google Scholar] [CrossRef]
- Yan, W.; Forsyth, D.A. Learning the Behavior of Users in a Public Space through Video Tracking. In Proceedings of the 2005 Seventh IEEE Workshops on Applications of Computer Vision (WACV/MOTION’05), Breckenridge, CO, USA, 5–7 January 2005; Volume 1, pp. 370–377. [Google Scholar]
- Alia, A.; Maree, M.; Chraibi, M.; Toma, A.; Seyfried, A. A Cloud-Based Deep Learning Framework for Early Detection of Pushing at Crowded Event Entrances. IEEE Access 2023, 11, 45936–45949. [Google Scholar] [CrossRef]
- Hao, Y.; Tang, Z.; Alzahrani, B.; Alotaibi, R.; Alharthi, R.; Zhao, M.; Mahmood, A. An End-to-End Human Abnormal Behavior Recognition Framework for Crowds with Mentally Disordered Individuals. IEEE J. Biomed. Health Inform. 2022, 26, 3618–3625. [Google Scholar] [CrossRef]
- Hou, J.; Chen, L.; Zhang, E.; Jia, H.; Long, Y. Quantifying the Usage of Small Public Spaces Using Deep Convolutional Neural Network. PLoS ONE 2020, 15, e0239390. [Google Scholar] [CrossRef]
- Li, Y.; Yabuki, N.; Fukuda, T. Exploring the Association between Street Built Environment and Street Vitality Using Deep Learning Methods. Sustain. Cities Soc. 2022, 79, 103656. [Google Scholar] [CrossRef]
- Wanting, X.; Hongtao, M.; Nan, B. The Influence of Spatial Vitality around Subway Stations in Beijing on Pedestrians’ Emotion. In Proceedings of the 13th International Symposium for Environment-Behavior Studies (EBRA), Wuhan, China, 3–4 November 2018. [Google Scholar]
- Loy, C.C.; Chen, K.; Gong, S.; Xiang, T. Crowd Counting and Profiling: Methodology and Evaluation. In Modeling, Simulation and Visual Analysis of Crowds: A Multidisciplinary Perspective; Ali, S., Nishino, K., Manocha, D., Shah, M., Eds.; Springer: New York, NY, USA, 2013; pp. 347–382. ISBN 978-1-4614-8483-7. [Google Scholar]
- Bai, L.; Wu, C.; Xie, F.; Wang, Y. Crowd Density Detection Method Based on Crowd Gathering Mode and Multi-Column Convolutional Neural Network. Image Vis. Comput. 2021, 105, 104084. [Google Scholar] [CrossRef]
- Kryjak, T.; Komorkiewicz, M.; Gorgon, M. Hardware-Software Implementation of Vehicle Detection and Counting Using Virtual Detection Lines. In Proceedings of the 2014 Conference on Design and Architectures for Signal and Image Processing, Madrid, Spain, 8–10 October 2014; pp. 1–8. [Google Scholar]
- Zhang, W.; Wang, N.; GUo, X.; Yang, K.; Ma, C.; Zhu, Q. A two-way pedestrian flow statistical method integrating depth information. Meas. Control Technol. 2021, 42, 52–61. (In Chinese) [Google Scholar] [CrossRef]
- Wang, Y. Tourism development models comparative study and sustainable development countermeasures of ancient towns in south China. J. Cent. China Norm. Univ. 2006, 52, 104–109. (In Chinese) [Google Scholar] [CrossRef]
- Mao, Q. An analysis of the construction of the residential culture system in water towns from the perspective of urbanization: A case study of Nanxun town, Huzhou. People’s Trib. 2015, 24, 96–97. (In Chinese) [Google Scholar] [CrossRef]
- Sina Finance. The Ancient Town at a Crossroads: How to Remain a Top Destination After Removing Admission Fees? A Cultural Tourism Evolution of a Jiangnan Water Town. Available online: https://finance.sina.com.cn/jjxw/2025-07-09/doc-infevnxv5064275.shtml?froms=ggmp&utm_source=chatgpt.com (accessed on 1 October 2025).
- Lynch, K. The Image of the City; MIT Press: Cambridge, MA, USA, 1960. [Google Scholar]
- Vanore, M.; Triches, M. (Eds.) #CURACITTÀ VENEZIA: Vs Marghera e la Città-Paesaggio; Quodlibet: Macerata, Italy, 2021. [Google Scholar]
- Kang, N.; Liu, C. Assessment of Visual Quality and Social Perception of Cultural Landscapes: Application to Anyi Traditional Villages, China. Herit. Sci. 2024, 12, 235. [Google Scholar] [CrossRef]
- Helbing, D. Social Force Model for Pedestrian Dynamics. Phys. Rev. E 1995, 51, 4282–4286. [Google Scholar] [CrossRef]
- Terven, J.; Córdova-Esparza, D.-M.; Romero-González, J.-A. A Comprehensive Review of YOLO Architectures in Computer Vision: From YOLOv1 to YOLOv8 and YOLO-NAS. Mach. Learn. Knowl. Extr. 2023, 5, 1680–1716. [Google Scholar] [CrossRef]
- Gehl, J.; Svarre, B. How to Study Public Life; Island Press: Washington, DC, USA, 2013. [Google Scholar]
- Transportation Research Board. Highway Capacity Manual; National Research Council: Washington, DC, USA, 2000. [Google Scholar]
- Brinckerhoff, P. Transit Capacity and Quality of Service Manual, 3rd ed.; Transportation Research Board: Washington, DC, USA, 2013; ISBN 978-0-309-28344-1. [Google Scholar]
- González, M.C.; Hidalgo, C.A.; Barabási, A.-L. Understanding Individual Human Mobility Patterns. Nature 2008, 453, 779–782. [Google Scholar] [CrossRef]
- Wang, X.; Jia, D. The analysis of contemporary on constructing strategy in traditional settlements and architectural space: The thought of water system of landscape and architecture space changes in Huizhou Hongcun. Huazhong Archit. 2011, 29, 83–85. (In Chinese) [Google Scholar] [CrossRef]
- Ki, D.; Chen, Z.; Lee, S.; Lieu, S. A Novel Walkability Index Using Google Street View and Deep Learning. Sustain. Cities Soc. 2023, 99, 104896. [Google Scholar] [CrossRef]
- Wu, W.; Liu, X.; Zhou, Y.; Zhao, K. Spatial Heterogeneity of Built Environment’s Impact on Urban Vitality Using Multi-Source Big Data and MGWR. Sci. Rep. 2025, 15, 23459. [Google Scholar] [CrossRef] [PubMed]
- Hu, X.; Ren, Y.; Tan, Y.; Shi, Y. Research on the Spatial and Temporal Dynamics of Crowd Activities in Commercial Streets and Their Relationship with Formats—A Case Study of Lao Men Dong Commercial Street in Nanjing. Sustainability 2023, 15, 16838. [Google Scholar] [CrossRef]
- Xia, Z.; Wang, X.; Wang, H.; Jiang, J.; Chen, S.; Cao, H. Age-Friendly Street Construction: The Synergy of the Physical Environment in Old Urban Communities in Suzhou. Buildings 2024, 14, 3378. [Google Scholar] [CrossRef]
- Xu, G.; Zhong, L.; Wu, F.; Zhang, Y.; Zhang, Z. Impacts of Micro-Scale Built Environment Features on Tourists’ Walking Behaviors in Historic Streets: Insights from Wudaoying Hutong, China. Buildings 2022, 12, 2248. [Google Scholar] [CrossRef]
- Zhang, L.; Zhang, B.; Kou, H. Tourist perception of ancient town landscape in the area south of Yangtze River based on NLP of online comments data. J. Chin. Urban For. 2022, 20, 125–132. (In Chinese) [Google Scholar]
- Sun, Z.; Scott, I.; Bell, S.; Yang, Y.; Yang, Z. Exploring Dynamic Street Vendors and Pedestrians through the Lens of Static Spatial Configuration in Yuncheng, China. Remote Sens. 2022, 14, 2065. [Google Scholar] [CrossRef]
- Breiman, L. Random Forests. Mach. Learn. 2001, 45, 5–32. [Google Scholar] [CrossRef]
- Lundberg, S.M.; Lee, S.-I. A Unified Approach to Interpreting Model Predictions. In Proceedings of the 31st Conference on Neural Information Processing Systems (NIPS 2017), Long Beach, CA, USA, 4–9 December 2017. [Google Scholar]
- Li, Y.; Song, X.; Sun, L.; Zhuang, C.C.; Liu, J.; Yang, M. Exploring Urbanization Strategies by Dissecting Aggregate Crowd Behaviors: A Case Study in China. Systems 2024, 12, 459. [Google Scholar] [CrossRef]
- Shu, D.; Peng, Y.; Zhang, Z.; Shi, R.; Wu, C.; Gan, D.; Li, X. Distance Decay of Urban Park Visitation: Roles of Personal Characteristics and Visitation Patterns. Forests 2024, 15, 1589. [Google Scholar] [CrossRef]
- Yu, B.; Sun, J.; Wang, Z.; Jin, S. Influencing Factors of Street Vitality in Historic Districts Based on Multisource Data: Evidence from China. ISPRS Int. J. Geo-Inf. 2024, 13, 277. [Google Scholar] [CrossRef]
- Saveriades, A. Establishing the Social Tourism Carrying Capacity for the Tourist Resorts of the East Coast of the Republic of Cyprus. Tour. Manag. 2000, 21, 147–156. [Google Scholar] [CrossRef]
- Domènech, A.; Mohino, I.; Moya-Gómez, B. Using Flickr Geotagged Photos to Estimate Visitor Trajectories in World Heritage Cities. ISPRS Int. J. Geo-Inf. 2020, 9, 646. [Google Scholar] [CrossRef]
- Mu, X.; Mu, L.; Zhang, J. The Impact of Street Elements on Pedestrian Stopping Behavior in Commercial Pedestrian Streets from the Perspective of Commercial Vitality. Sustainability 2024, 16, 7727. [Google Scholar] [CrossRef]
- Wolf, H.; Vierø, A.R.; Szell, M. CoolWalks for Active Mobility in Urban Street Networks. Sci. Rep. 2025, 15, 14911. [Google Scholar] [CrossRef] [PubMed]
- Melnikov, V.R.; Christopoulos, G.I.; Krzhizhanovskaya, V.V.; Lees, M.H.; Sloot, P.M.A. Behavioural Thermal Regulation Explains Pedestrian Path Choices in Hot Urban Environments. Sci. Rep. 2022, 12, 2441. [Google Scholar] [CrossRef]
- Ma, J.; Song, W.-G.; Fang, Z.-M.; Lo, S.-M.; Liao, G.-X. Experimental Study on Microscopic Moving Characteristics of Pedestrians in Built Corridor Based on Digital Image Processing. Build. Environ. 2010, 45, 2160–2169. [Google Scholar] [CrossRef]
- Ding, W.; Wei, Q.; Jin, J.; Nie, J.; Zhang, F.; Zhou, X.; Ma, Y. Research on Public Space Micro-Renewal Strategy of Historical and Cultural Blocks in Sanhe Ancient Town under Perception Quantification. Sustainability 2023, 15, 2790. [Google Scholar] [CrossRef]
- Chen, X.; Yin, Y.; Jiang, M.; Lin, H. Deep Analysis of the Homogenization Phenomenon of the Ancient Water Towns in Jiangnan: A Dual Perspective on Landscape Patterns and Tourism Destination Images. Sustainability 2023, 15, 12595. [Google Scholar] [CrossRef]
- Zhang, T.; Yin, P.; Peng, Y. Effect of Commercialization on Tourists’ Perceived Authenticity and Satisfaction in the Cultural Heritage Tourism Context: Case Study of Langzhong Ancient City. Sustainability 2021, 13, 6847. [Google Scholar] [CrossRef]
- Bramwell, B.; Lane, B. Critical Research on the Governance of Tourism and Sustainability. J. Sustain. Tour. 2011, 19, 411–421. [Google Scholar] [CrossRef]
- Jiang, Y.; Han, Y.; Liu, M.; Ye, Y. Street Vitality and Built Environment Features: A Data-Informed Approach from Fourteen Chinese Cities. Sustain. Cities Soc. 2022, 79, 103724. [Google Scholar] [CrossRef]
- Filomena, G.; Verstegen, J.A. Modelling the Effect of Landmarks on Pedestrian Dynamics in Urban Environments. Comput. Environ. Urban Syst. 2021, 86, 101573. [Google Scholar] [CrossRef]
- Lei, B.; Xu, J.; Li, M.; Li, H.; Li, J.; Cao, Z.; Hao, Y.; Zhang, Y. Enhancing Role of Guiding Signs Setting in Metro Stations with Incorporation of Microscopic Behavior of Pedestrians. Sustainability 2019, 11, 6109. [Google Scholar] [CrossRef]
- Hu, X.; Xu, L. How Guidance Signage Design Influences Passengers’ Wayfinding Performance in Metro Stations: Case Study of a Virtual Reality Experiment. Transp. Res. Rec. 2023, 2677, 1118–1129. [Google Scholar] [CrossRef]
- Hagos, K.G.; Adnan, M.; Yasar, A.-H. Effect of Sidewalk Vendors on Pedestrian Movement Characteristics: A Microscopic Simulation Study of Addis Ababa, Ethiopia. Cities 2020, 103, 102769. [Google Scholar] [CrossRef]
- Larranaga, A.M.; Arellana, J.; Rizzi, L.I.; Strambi, O.; Cybis, H.B.B. Using Best–Worst Scaling to Identify Barriers to Walkability: A Study of Porto Alegre, Brazil. Transportation 2019, 46, 2347–2379. [Google Scholar] [CrossRef]


Disclaimer/Publisher’s Note: The statements, opinions and data contained in all publications are solely those of the individual author(s) and contributor(s) and not of MDPI and/or the editor(s). MDPI and/or the editor(s) disclaim responsibility for any injury to people or property resulting from any ideas, methods, instructions or products referred to in the content. |
© 2025 by the authors. Licensee MDPI, Basel, Switzerland. This article is an open access article distributed under the terms and conditions of the Creative Commons Attribution (CC BY) license (https://creativecommons.org/licenses/by/4.0/).