Abstract
This study reveals the evolution of the mechanical behavior of tunnel lining under the influence of heavy rainfall through field monitoring and coupled fluid-solid numerical simulations. Field monitoring shows that after 14 h of rainfall, the maximum vertical tensile stress increment at monitoring point 2 reached 0.55 MPa. The simulation results indicate that when the rainfall intensity is 1.11 × 10⁻⁵ m/s and the rainfall duration lasts for 36 h, the principal stress increment at the sidewall monitoring point is 2.34 MPa (exceeding the tensile strength of C30 concrete of 1.43 MPa). Based on these findings, the suggested threshold for rainfall-induced checks is a single-day rainfall of ≥80 mm or continuous rainfall of ≥10 h. It is recommended to monitor once every 3 days during normal conditions and once every 2 h during heavy rainfall. When the permeability coefficient of the loosened zones increases from 2.05 × 10⁻⁶ m/s to 6.48 × 10⁻⁵ m/s, the principal stress at the sidewall decreases by 41%. It is suggested to reduce the blind drainage spacing on the sidewalls to 3–4 m. The model reproduces the observed stress increment within a 10% error margin. These results may provide a valuable reference for tunnel design, monitoring, and reinforcement in regions prone to heavy rainfall.
1. Introduction
Mountain tunnels, as a crucial component of modern transportation infrastructure, directly influence the smooth flow of traffic, regional economic development, and public safety regarding life and property []. However, under extreme rainfall conditions, a large amount of rainwater infiltrates the surrounding rock mass, causing a rapid rise in the groundwater level, an increase in the surrounding rock water pressure, a reduction in effective stress, and a weakening of shear strength, which leads to surrounding rock deformation and even instability or sliding failure []. According to incomplete statistics, 20 railway tunnels in China have experienced rainfall-induced arch damage. A typical example is the Yuanbaoshan Tunnel, where a daily rainfall of 306 mm caused an arch uplift of 54.7 mm, and the Fangdoushan Tunnel of the Yuli Railway, where a daily rainfall of 148 mm led to a right-side sidewall bulge and crack reaching over 15 cm []. Tunnel engineering faces severe risks such as increased infiltration, surrounding rock instability, lining damage, and structural collapse, which have become prominent safety issues in the current construction and operation of mountain transportation.
Therefore, the study of tunnel seepage evolution and lining mechanical response under heavy rainfall conditions has become a hot topic among scholars both domestically and internationally. In terms of infiltration mechanisms, research has revealed that the dominant flow in fractures governs groundwater movement [,], leading to surrounding rock wetting and asymmetric lining stress []. Drainage systems can effectively alleviate water pressure buildup [], while heavy rainfall increases the volume of water ingress into tunnels []. Construction disturbances [] and surrounding rock moisture content [,] significantly affect groundwater, and under extreme conditions, drainage failure exacerbates lining damage []. In terms of lining mechanical response, heavy rainfall induces stress redistribution and increased deformation, with stress concentration prominent at wall corners [], and an increase in water pressure on the crown arch leading to uplift []. Optimizing drainage systems can reduce uplift displacement [], while tensile stress in the contact zone of voids can increase by 40% []. The coupling of multiple factors further complicates the response mechanism. The combined effect of earthquakes and rainfall reduces seismic resistance [], while sudden water table drops induce “tension-compression” cyclic damage [], and the coupling of surface and groundwater leads to surface subsidence []. In the field of fluid-solid coupling research, most studies focus on the influence of water ingress conditions on vertical surface subsidence [], the progressive collapse characteristics of surrounding rock [], and construction damage mechanisms []. Furthermore, composite models for temperature-stress-seepage coupling [] and pore-fracture-macroscopic seepage coupling models in a cross-scale coupling framework [] have enhanced the model accuracy. The existing literature often employs surrounding rock permeability field analysis or overall safety factor assessments for karst tunnels, while there is a relative lack of analysis on the local stress evolution, deformation response, and the temporal correlation with rainfall processes for various tunnel lining structures (such as the crown, waist, foot, sidewalls, and invert). Particularly, there is a lack of systematic revelation of the stress-displacement multivariable coupling evolution mechanism driven by rainfall infiltration, which makes it difficult to accurately reflect the true characteristics of the structural degradation process during the service life of mountain tunnels.
In summary, current research on tunnel lining mechanical behavior under rainfall infiltration primarily focuses on surrounding rock seepage and overall stability evaluation. However, there is a need for further investigation into the dynamic response and temporal evolution of key lining components under complex heavy rainfall parameters (intensity, duration, permeability). Therefore, this study focuses on mountain tunnels as the research subject, utilizing comprehensive monitoring in the tunnel site area. A multi-parameter coupled numerical model is employed to address the following research questions: under rainfall intensities of 20–80 mm/h, will key lining components such as sidewalls and crown arches experience tensile stresses exceeding the tensile strength of concrete? Within this rainfall intensity range, is there a threshold characteristic in the temporal correlation between rainfall duration and lining mechanical response (such as displacement and stress)? This study aims to reveal the mechanical evolution of surrounding rock-lining systems in the loosened zone under heavy rainfall conditions.
2. Field Monitoring and Dynamic Response Signatures
2.1. Project Profile
The engineering project in this study is a separated double-tube bi-directional four-lane tunnel located on the S0101 Changfu Expressway in Chongqing, China. The tunnel has a net width of 10.82 m, a net height of 7.09 m, and a cross-sectional area of 63.85 m2. The tunnel’s horizontal slope is 2%, and the vertical slope is 2.3%. The design speed is 60 km/h, with the left tunnel spanning from K97+340 to K99+480 (2500 m in length), and the right tunnel from K97+351 to K99+844 (2493 m in length). The center-to-center distance between the two tunnel axes is 30 m at the west portal and 40 m at the east portal. The excavation of the tunnel primarily adopts full-section excavation, with Class V surrounding rock used for construction. The initial support uses 20-grade concrete, while the secondary lining is constructed using full-section formwork and track-supported lining, with over-excavated areas backfilled with the same-grade concrete. The surrounding rock is Triassic Upper Xujiahe River Group gray-white feldspar quartz sandstone, with a layered structure, medium to coarse grains, and blocky embedded texture. Precipitation is dominated by rainfall, with snow precipitation during the cold winter season. The average annual rainfall is 1175 mm, with an uneven distribution, usually concentrated from May to September, accounting for about 70% of the annual rainfall, and accompanied by thunderstorms. The surrounding rock is also Triassic Upper Xujiahe River Group gray-white feldspar quartz sandstone, with a layered structure, medium to coarse grains, and blocky embedded texture. The tunnel is located within a syncline, forming a box-shaped mountain with steep slopes on both the east and west sides and a wider, gentler middle. The east wing is steeper, with an inclination angle of 60–78°, and the west wing is gentler, with an inclination angle of 1130°. The central part of the tunnel lies on the axis of the Huangcaoshan syncline, where the strata are gently inclined at an angle of 410°.Within the tunnel section and one tunnel diameter range of the crown, there are thin layers of weak carbonaceous shale and mudstone intercalations. The crown also contains thin layers of weak carbonaceous shale, and the middle section has well-developed fractures with a fragmented rock mass. The hydrological and geological conditions at the west portal are favorable, with no significant groundwater systems within the mountain mass. However, certain sections contain fissure water and pore-type groundwater. The Triassic Upper Xujiahe River Group sandstone aquifer is the main groundwater source in the western section of the tunnel. This aquifer consists of medium to thick layers of fine to coarse-grained feldspar quartz sandstone in the second, fourth, and sixth sections of the Xujiahe Group, and thin layers of deep gray, black-gray mudstone, coal seams, and siltstone in the third and fifth sections. Although the third and fifth sections act as aquicludes, their thin layers and well-developed fractures allow for groundwater movement, which does not affect the recharge, infiltration, or drainage of the entire aquifer. Therefore, the aquifer has good water abundance, and the groundwater type is pore-fissure water.
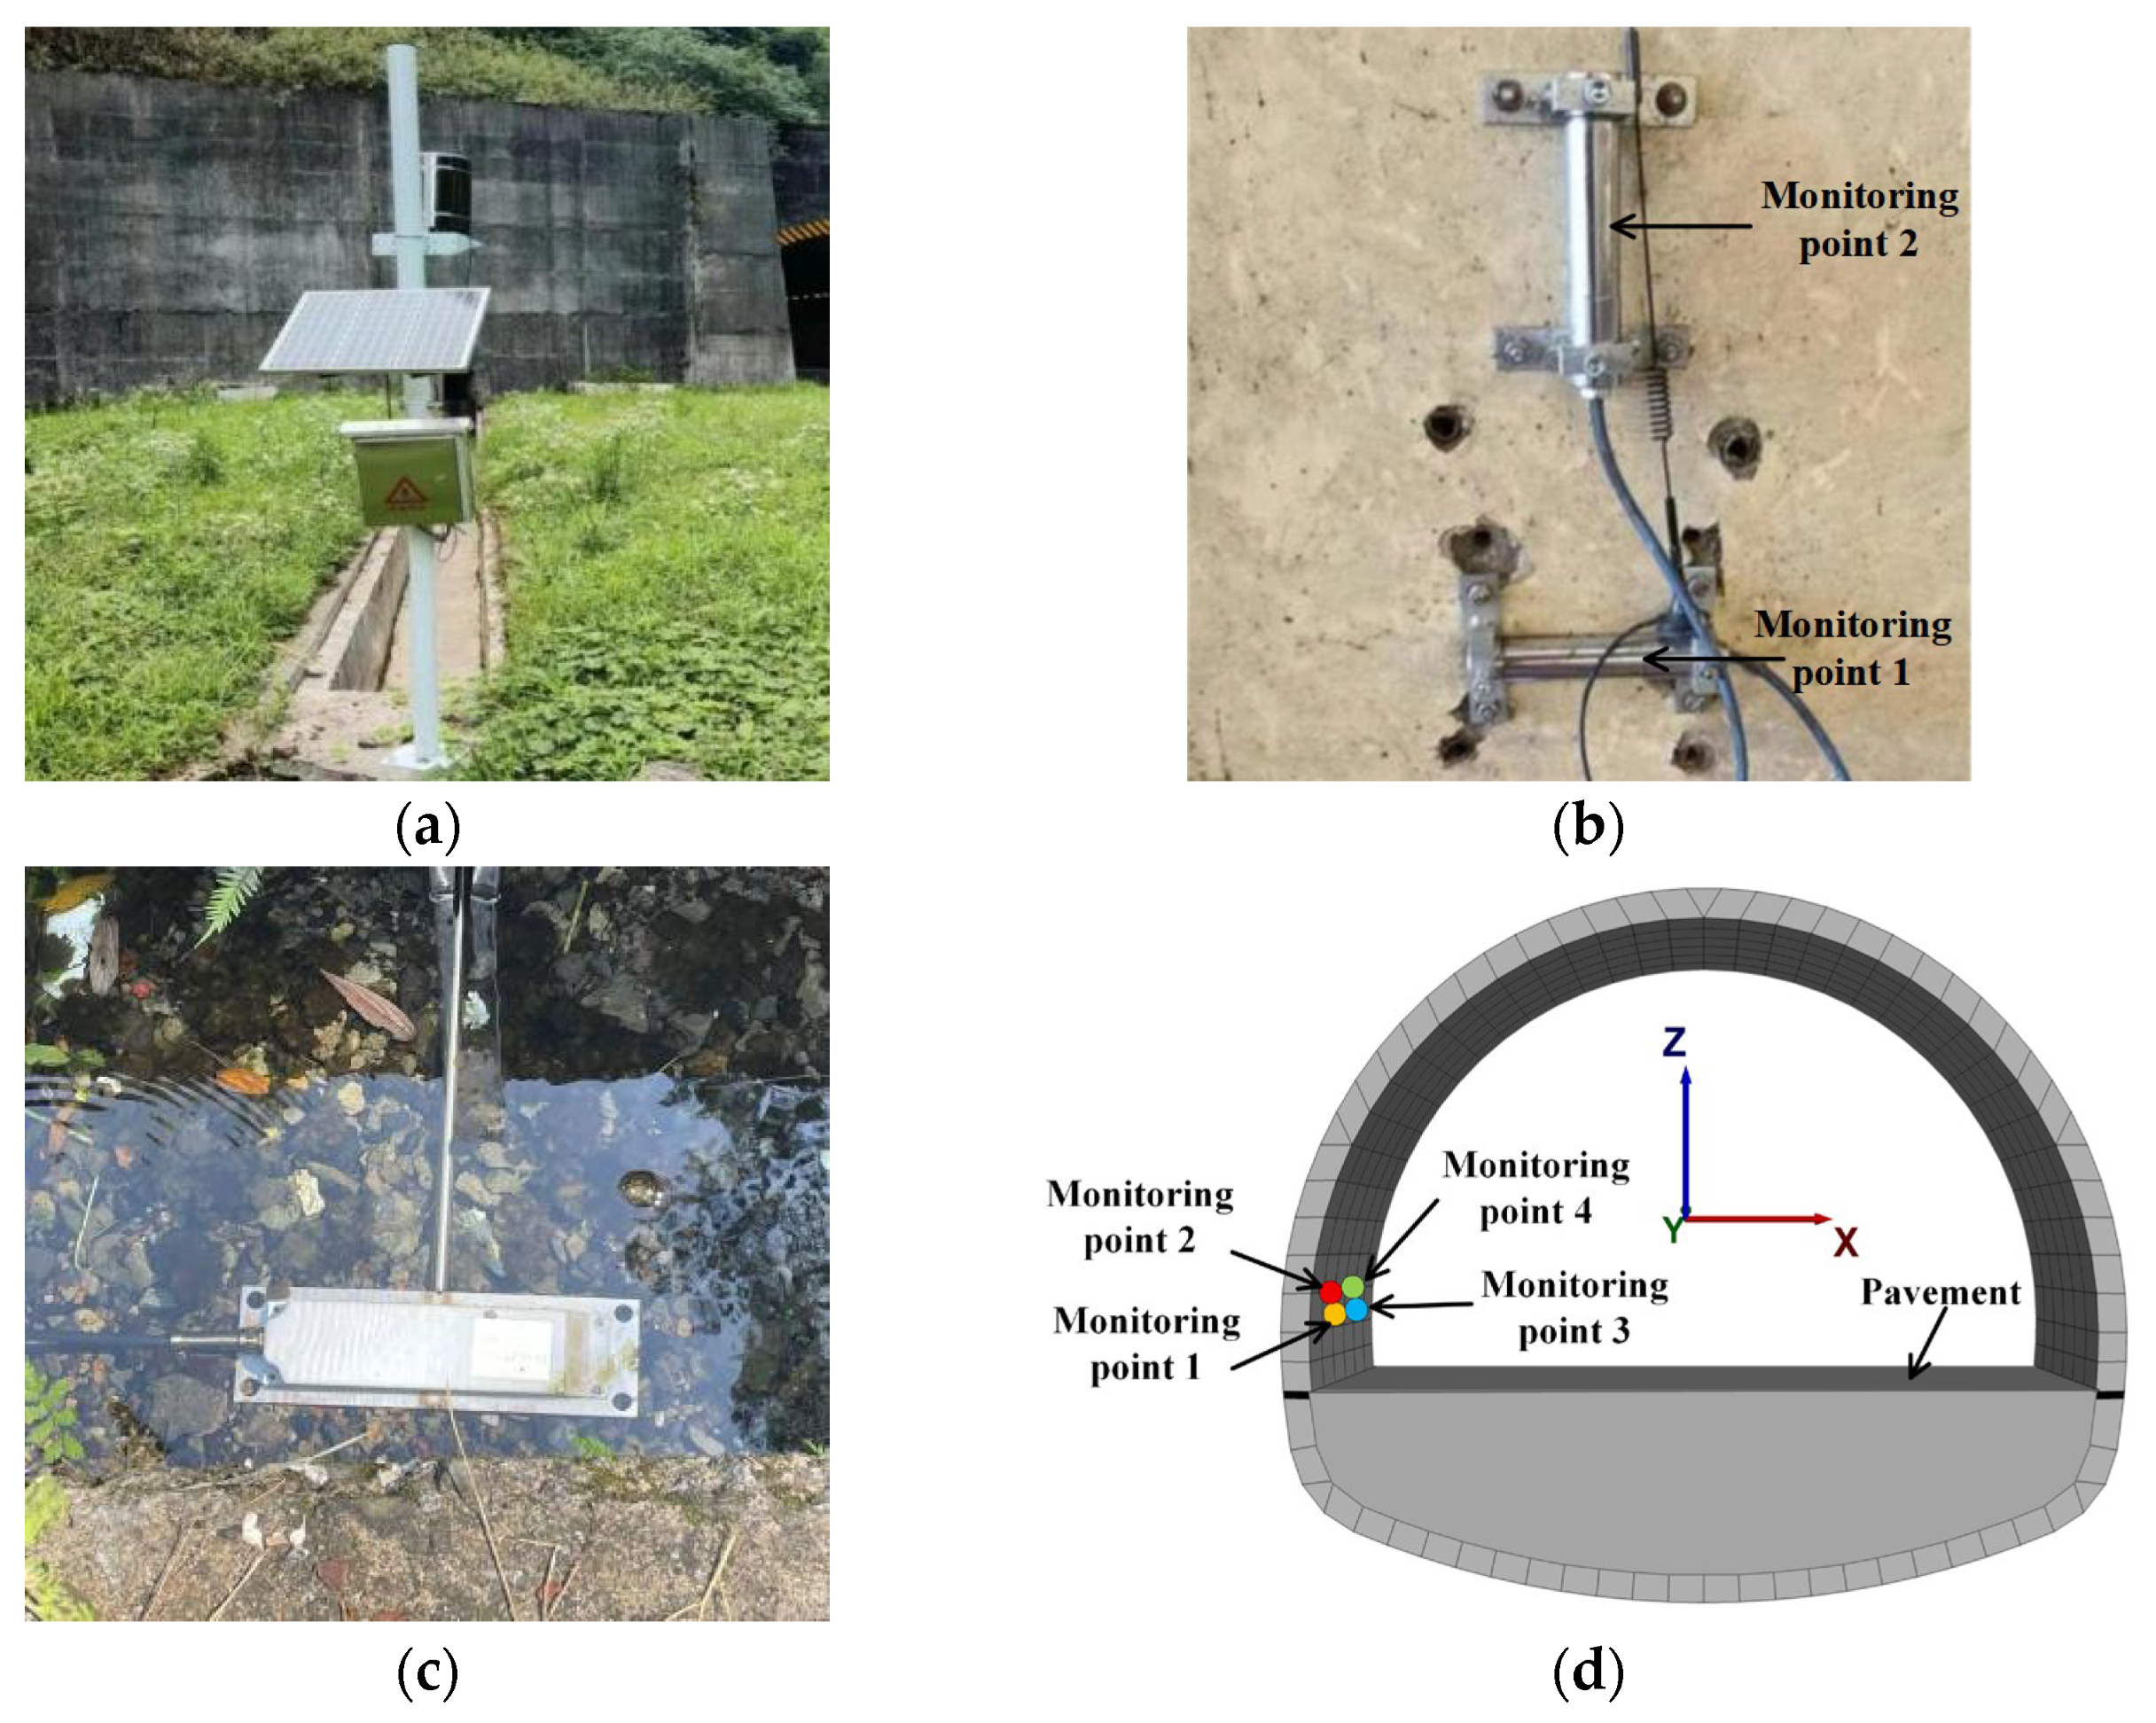
Therefore, this study selects K97+350 and K97+375 as typical monitoring sections. By integrating the topography and tunnel lining structure, a monitoring system is designed to record the influence of rainfall, drainage, and other factors on the stress and deformation of the lining structure, forming a comprehensive monitoring network that links hydrological and structural responses. The monitoring system at the tunnel site includes an automatic rain gauge, Doppler ultrasonic flow velocity sensors, and vibrating wire strain gauges (rain gauge measurement range: 0–4 mm/min, resolution: 0.01 mm, calibration frequency: every two months, sampling frequency: 30 min; flow sensor resolution: 0.001 m3/s, calibration frequency: every two months, sampling frequency: 30 min; vibrating wire strain gauge measurement range: 1000 με, accuracy ≤ 0.5%F·S, sampling frequency: 16 min). These sensors monitor rainfall, drainage, and strain on the lining structure. The locations of the monitoring points are shown in Figure 1. In Figure 1d, monitoring points are arranged at two key locations on the lining structure (sidewalls), with measurements in the Y direction (Monitoring points 1 and 3) and Z direction (Monitoring points 2 and 4). The Y direction represents the tunnel axis direction (longitudinal), and the Z direction represents the vertical direction parallel to the sidewall (vertical).
Figure 1.
Field Monitoring Conditions (a) rainfall monitoring, (b) strain monitoring, (c) Drainage Monitoring, (d) lining on-site monitoring section.
2.2. Monitoring Results
2.2.1. Analysis of Heavy Rainfall Characteristics
Heavy rainfall typically refers to a precipitation event where the rainfall amount significantly exceeds the climatic norm within a short period. The criteria for assessing heavy rainfall involve multiple parameters such as rainfall intensity, total amount, and duration. The short-duration heavy rainfall classification in DB62/T 2755-2017 [] and the National Oceanic and Atmospheric Administration (NOAA) standards define short-duration heavy rainfall as precipitation with an hourly rainfall of ≥20 mm or a three-hour rainfall of ≥50 mm. In China, rainfall exceeding 20 mm per hour is classified as heavy rainfall [,]. Additionally, some countries use the total rainfall within 24 h as the criterion for heavy rainfall. Therefore, this study adopts an hourly rainfall exceeding 20 mm as the threshold for heavy rainfall.
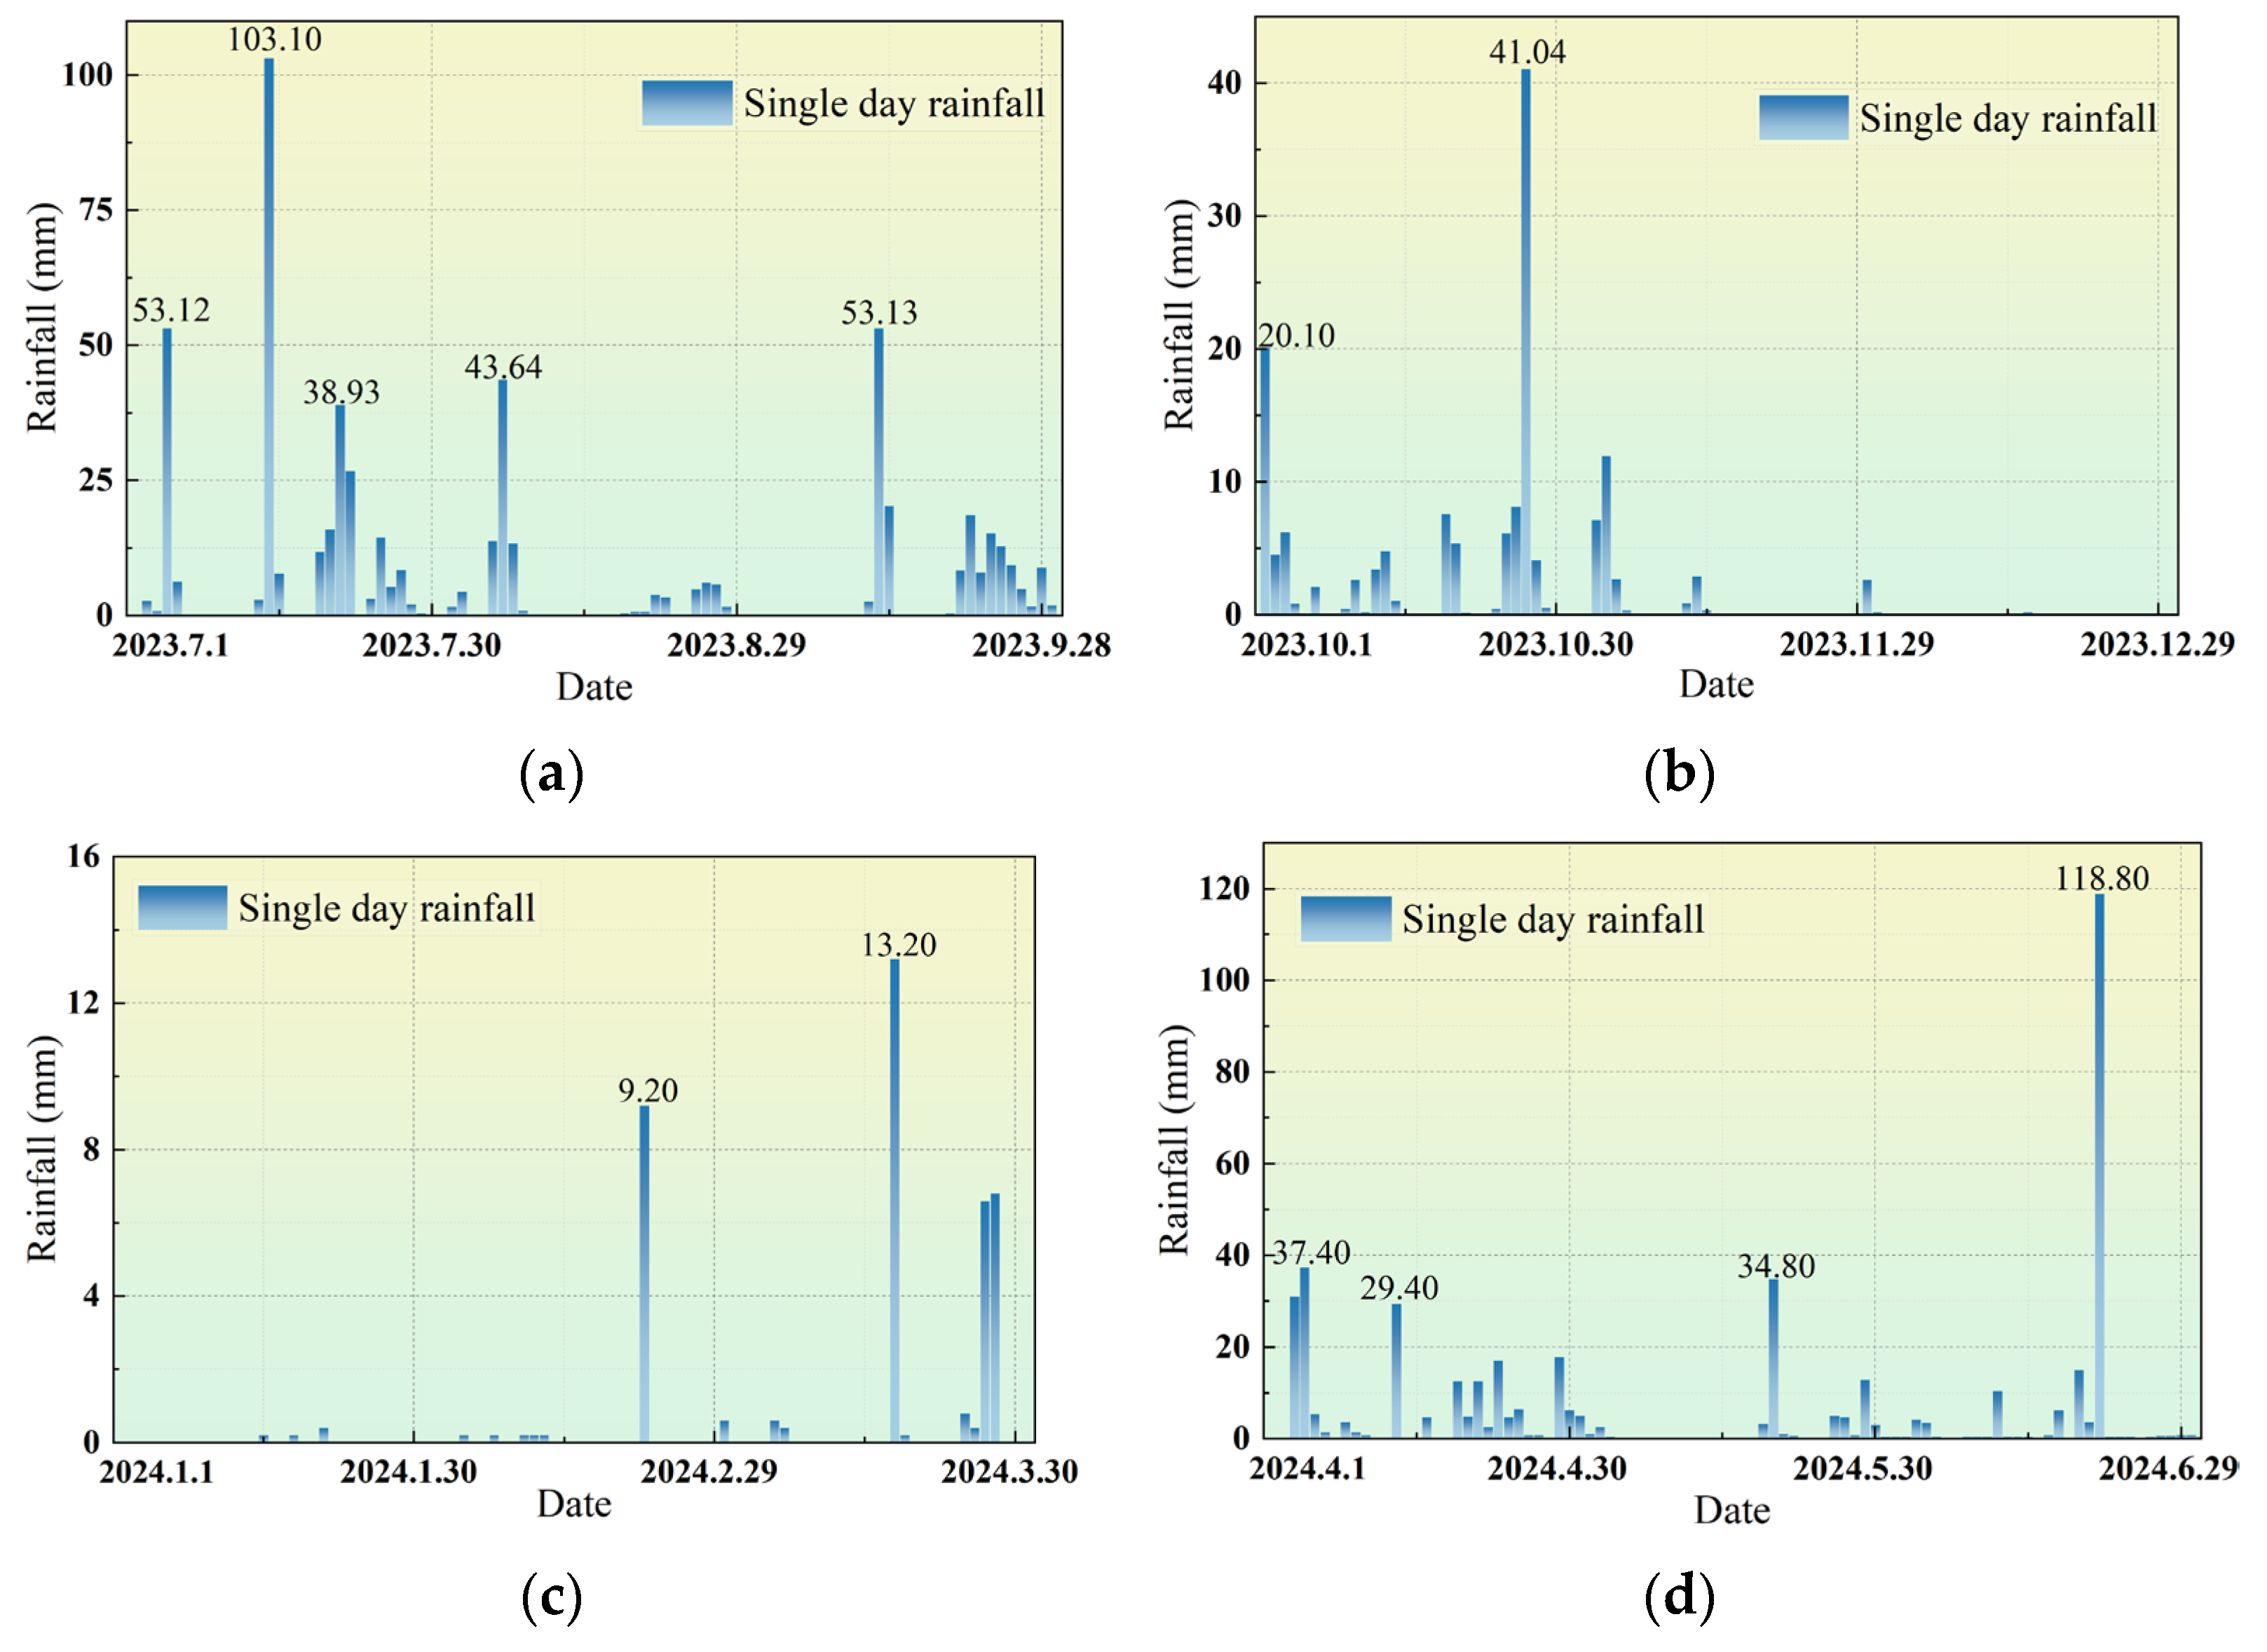
During the one-year monitoring period, rainfall occurred on 155 days, accounting for 42.4% of the total days (as shown in Figure 2). Although the number of heavy rainfall events was low, the risks were significant: there were 8 days of heavy rain (25–49.9 mm/24 h), 2 days of rainstorm (50–99.9 mm/24 h), and 2 days of torrential rain (100–249.9 mm/24 h). The short-duration, high-intensity characteristics of these events can easily trigger abrupt changes in lining stress and seepage damage. Two significant heavy rainfall events were recorded during the monitoring period: the first event had a 24 h rainfall of 103.1 mm, lasting about 15 h; the second event had a rainfall of 118.8 mm, lasting 12 h. Both events were typical short-duration heavy rainfall processes that caused concentrated water pressure and sudden load impacts on the tunnel structure, potentially triggering phenomena such as crack propagation and localized seepage, leading to stress instability. Through a systematic analysis of the daily rainfall distribution, frequency, and duration of heavy rainfall events, boundary input conditions for subsequent lining stress simulations can be provided, as well as key references for formulating structural response measures and protection strategies under extreme weather conditions. The results of the heavy rainfall monitoring are shown in Table 1.
Figure 2.
Daily rainfall at the tunnel Site. The four quarters of rainfall during the monitoring period were (a) the third quarter of 2023, (b) the fourth quarter of 2023, (c) the first quarter of 2024, and (d) the second quarter of 2024.
Table 1.
Heavy Rainfall Event Monitoring Results.
2.2.2. Analysis of Drainage Volume
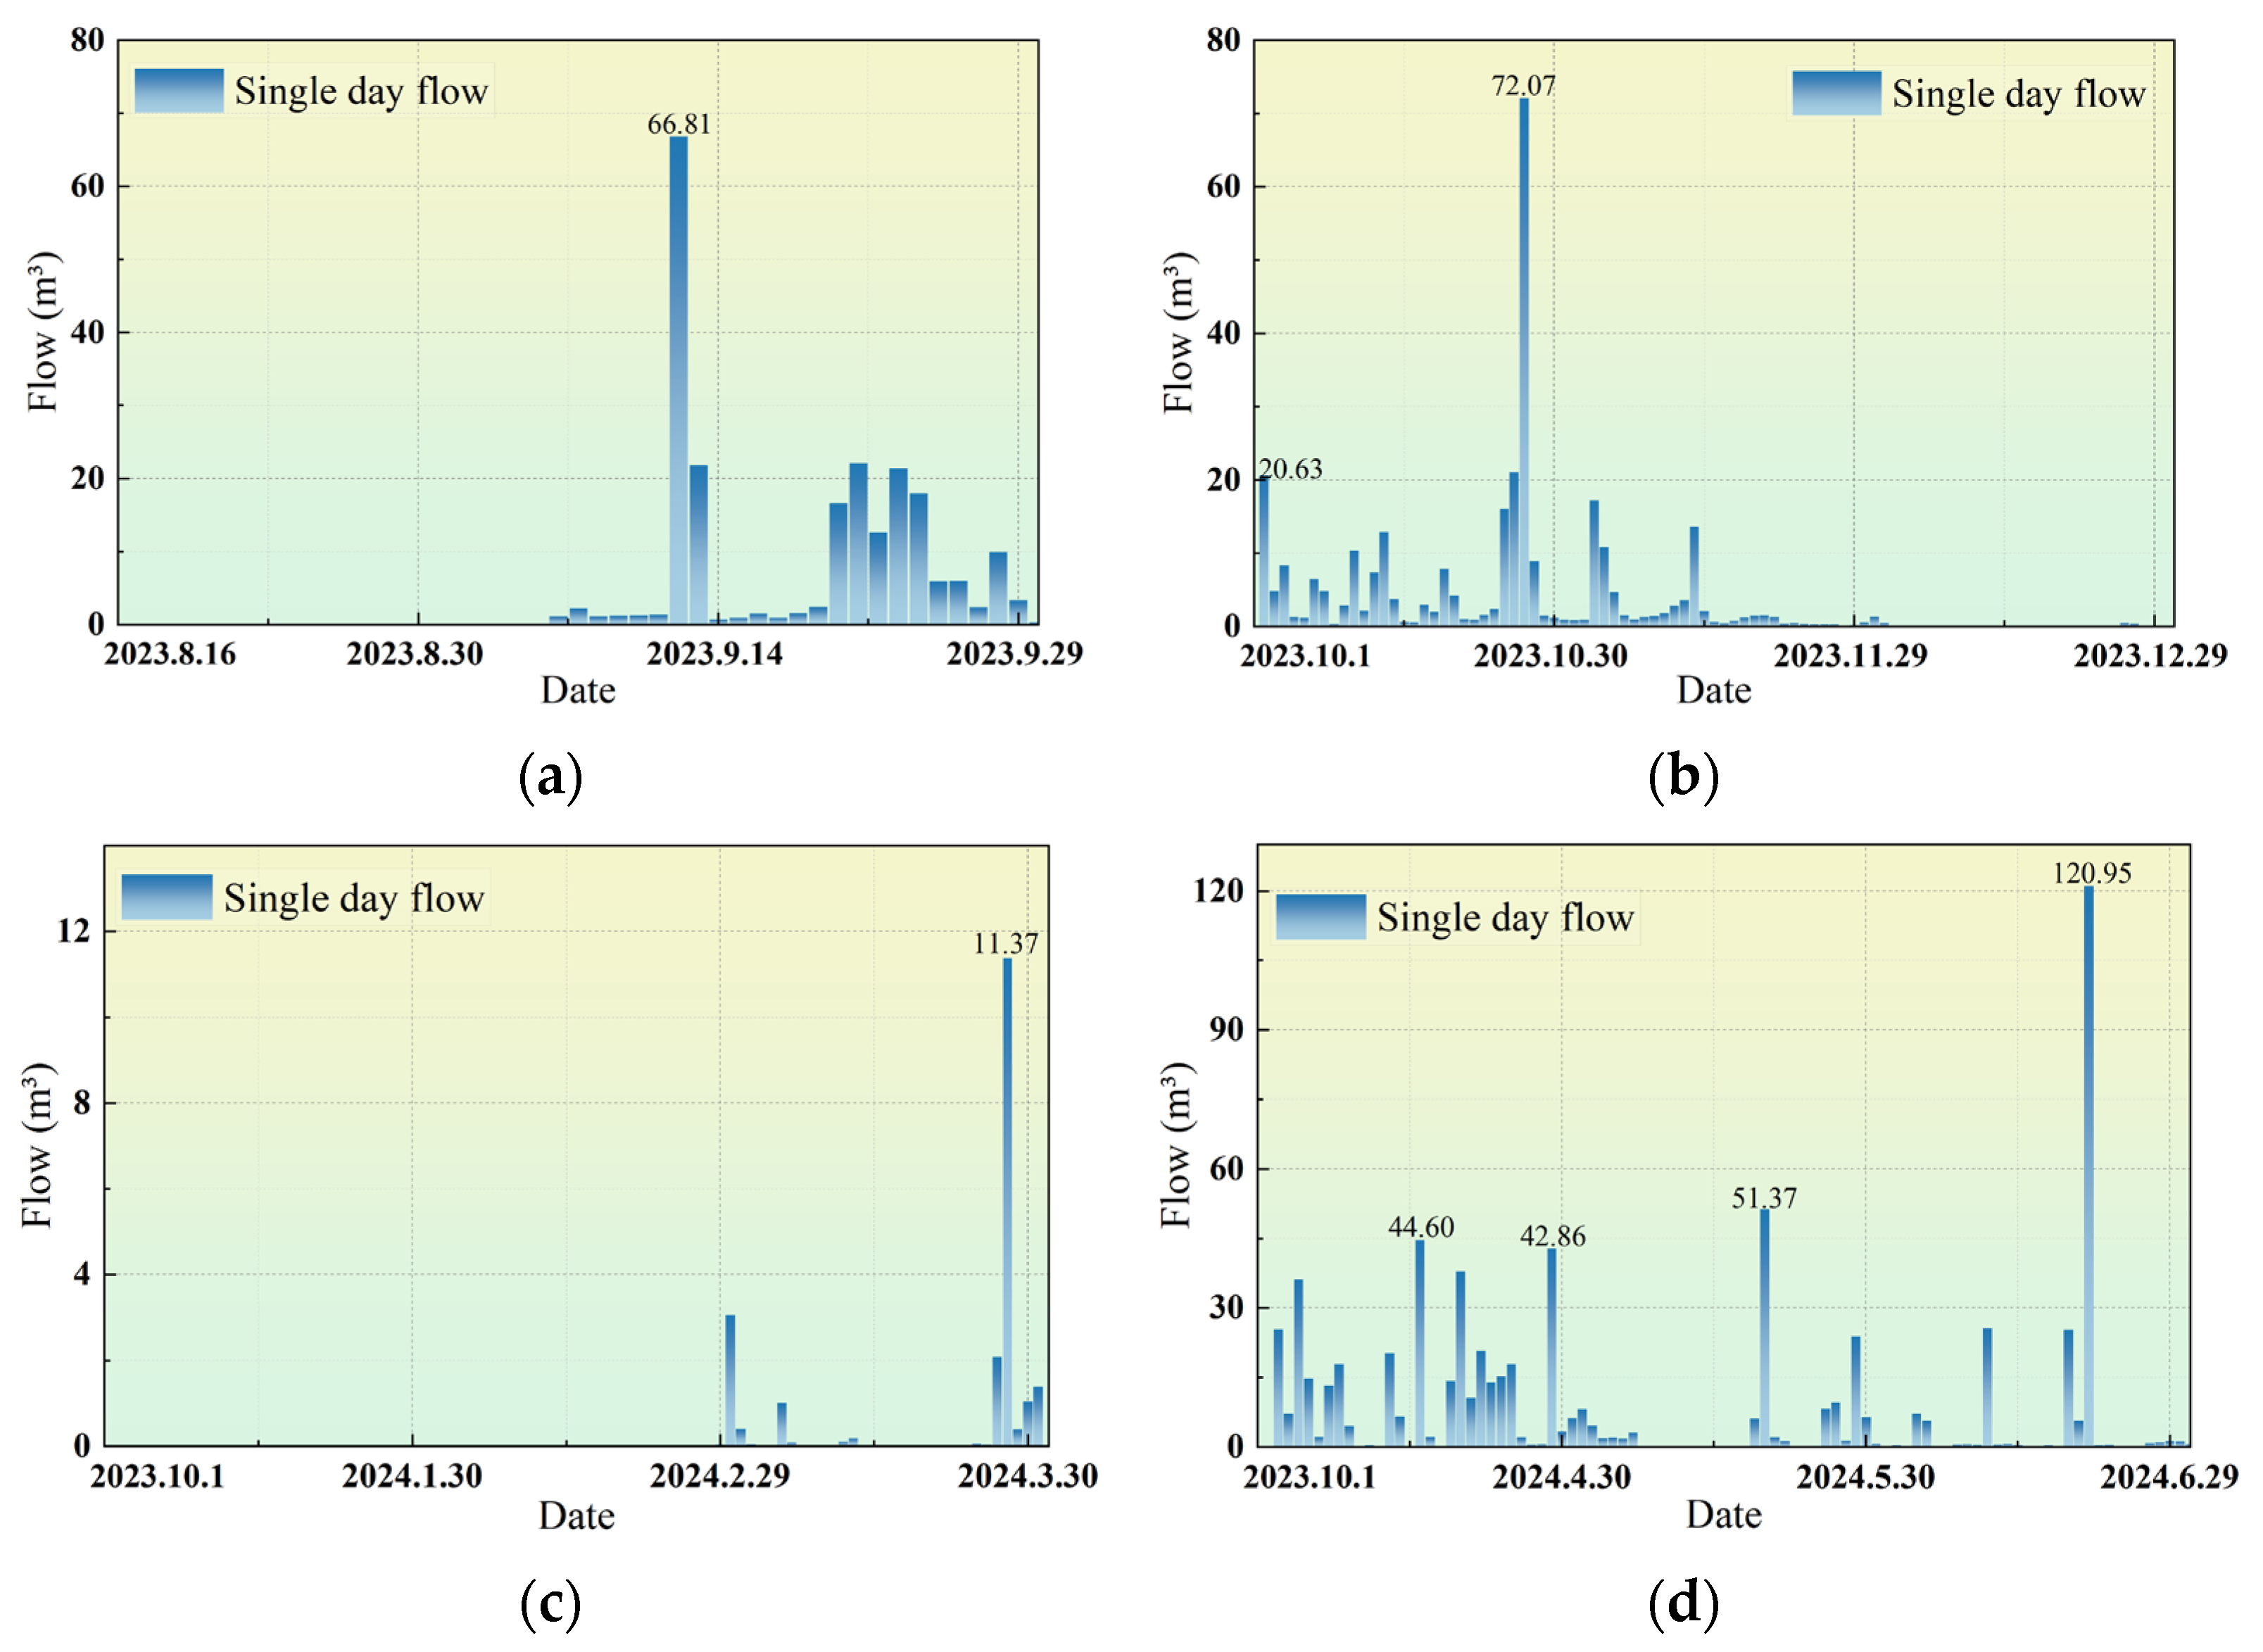
This study conducts a comprehensive analysis of the cumulative flow of a single drainage ditch in the tunnel site area, with a time span from 16 August 2023 to 30 June 2024. Figure 3a–d show the variations in daily flow at the tunnel site, with a significant increase in drainage ditch flow during heavy rainfall, exhibiting clear phase fluctuations. Overall, the variation in drainage flow is an important representation of the tunnel’s hydrodynamic response, which potentially impacts the safety of the tunnel structure.
Figure 3.
Daily Flow at the Tunnel Site. The four quarters of water discharge during the monitoring period were (a) the third quarter of 2023, (b) the fourth quarter of 2023, (c) the first quarter of 2024, and (d) the second quarter of 2024.
During the monitoring period, the number of days with measurable flow changes was 154, accounting for 42% of the total monitoring days. Although the rainfall on these days was relatively small in magnitude, it was sufficient to cause fluctuations in the flow of the drainage ditch. Over time, this accumulation could lead to drainage system blockages, sediment buildup, and a decrease in the permeability of the structure. Days with significant flow changes were monitored for 58 days, accounting for 16%, typically corresponding to heavy rainfall or continuous rainfall events. During these periods, the drainage system endured high water volume impacts in a short time, which could easily lead to overloading and increase the risks of local water pressure and structural deformation in the tunnel lining. On the remaining 110 days, no flow was recorded in the drainage ditch, accounting for 30%, corresponding to low rainfall or no rainfall conditions. The daily flow variation trends show several peak flow events in each quarter. In the third quarter of 2023 (Figure 3a), the maximum daily flow reached 66.81 m3, and in the fourth quarter (Figure 3b), the peak rose to 72.07 m3, reflecting the seasonal intensification of rainfall. Entering the first quarter of 2024 (Figure 3c), the overall flow remained at a low fluctuation level, with no significant high-flow events, indicating a marked reduction in both winter rainfall and seepage runoff capacity. However, in the second quarter of 2024 (Figure 3d), the strongest single-day drainage peak of the year occurred, reaching 120.95 m3, accompanied by multiple moderate intensity events (44.6, 42.86, 51.37 m3), showing typical characteristics of concentrated heavy rainfall events, which put significant load pressure on the tunnel drainage system.
2.2.3. Stress Evolution Analysis
Analysis of the rainfall monitoring results at the tunnel site shows that there were no rainfall on 202 days, while rainfall occurred on 155 days. Therefore, an analysis of the stress variation in the tunnel lining under heavy rainfall conditions was conducted to provide reference for subsequent simulations. Based on the data in Figure 4, the stress variation pattern under rainstorm conditions is analyzed as follows. The formula for calculating the stress on the surface of the lining is:
—Represents the calculated strain (unit: microstrain);
—Conversion coefficient, with units of , used to convert the square difference in frequency to strain;
—Frequency at the measurement moment ;
—Initial frequency , which is the frequency reading of the sensor in the strain-free state;
—Temperature correction coefficient, with units of , used to correct measurement errors caused by temperature variations;
—Temperature variation (°C), which is the difference between the temperature at the measurement moment and the initial temperature.
- 1.
- variation (Monitoring points 1 and 3)
The tensile stress variation is relatively stable. Although the fluctuation amplitude is small, the tensile stress at Monitoring point 1 varies between 1.8–2.2 Mpa, and at Monitoring point 3, it fluctuates between 1.5–1.8 Mpa. Despite fluctuations in the value of a (tensile stress) during rainfall, the amplitude of fluctuation is smaller compared to the Z direction, indicating a relatively stable stress state in the Y direction.
- 2.
- variation (Monitoring points 2 and 4)
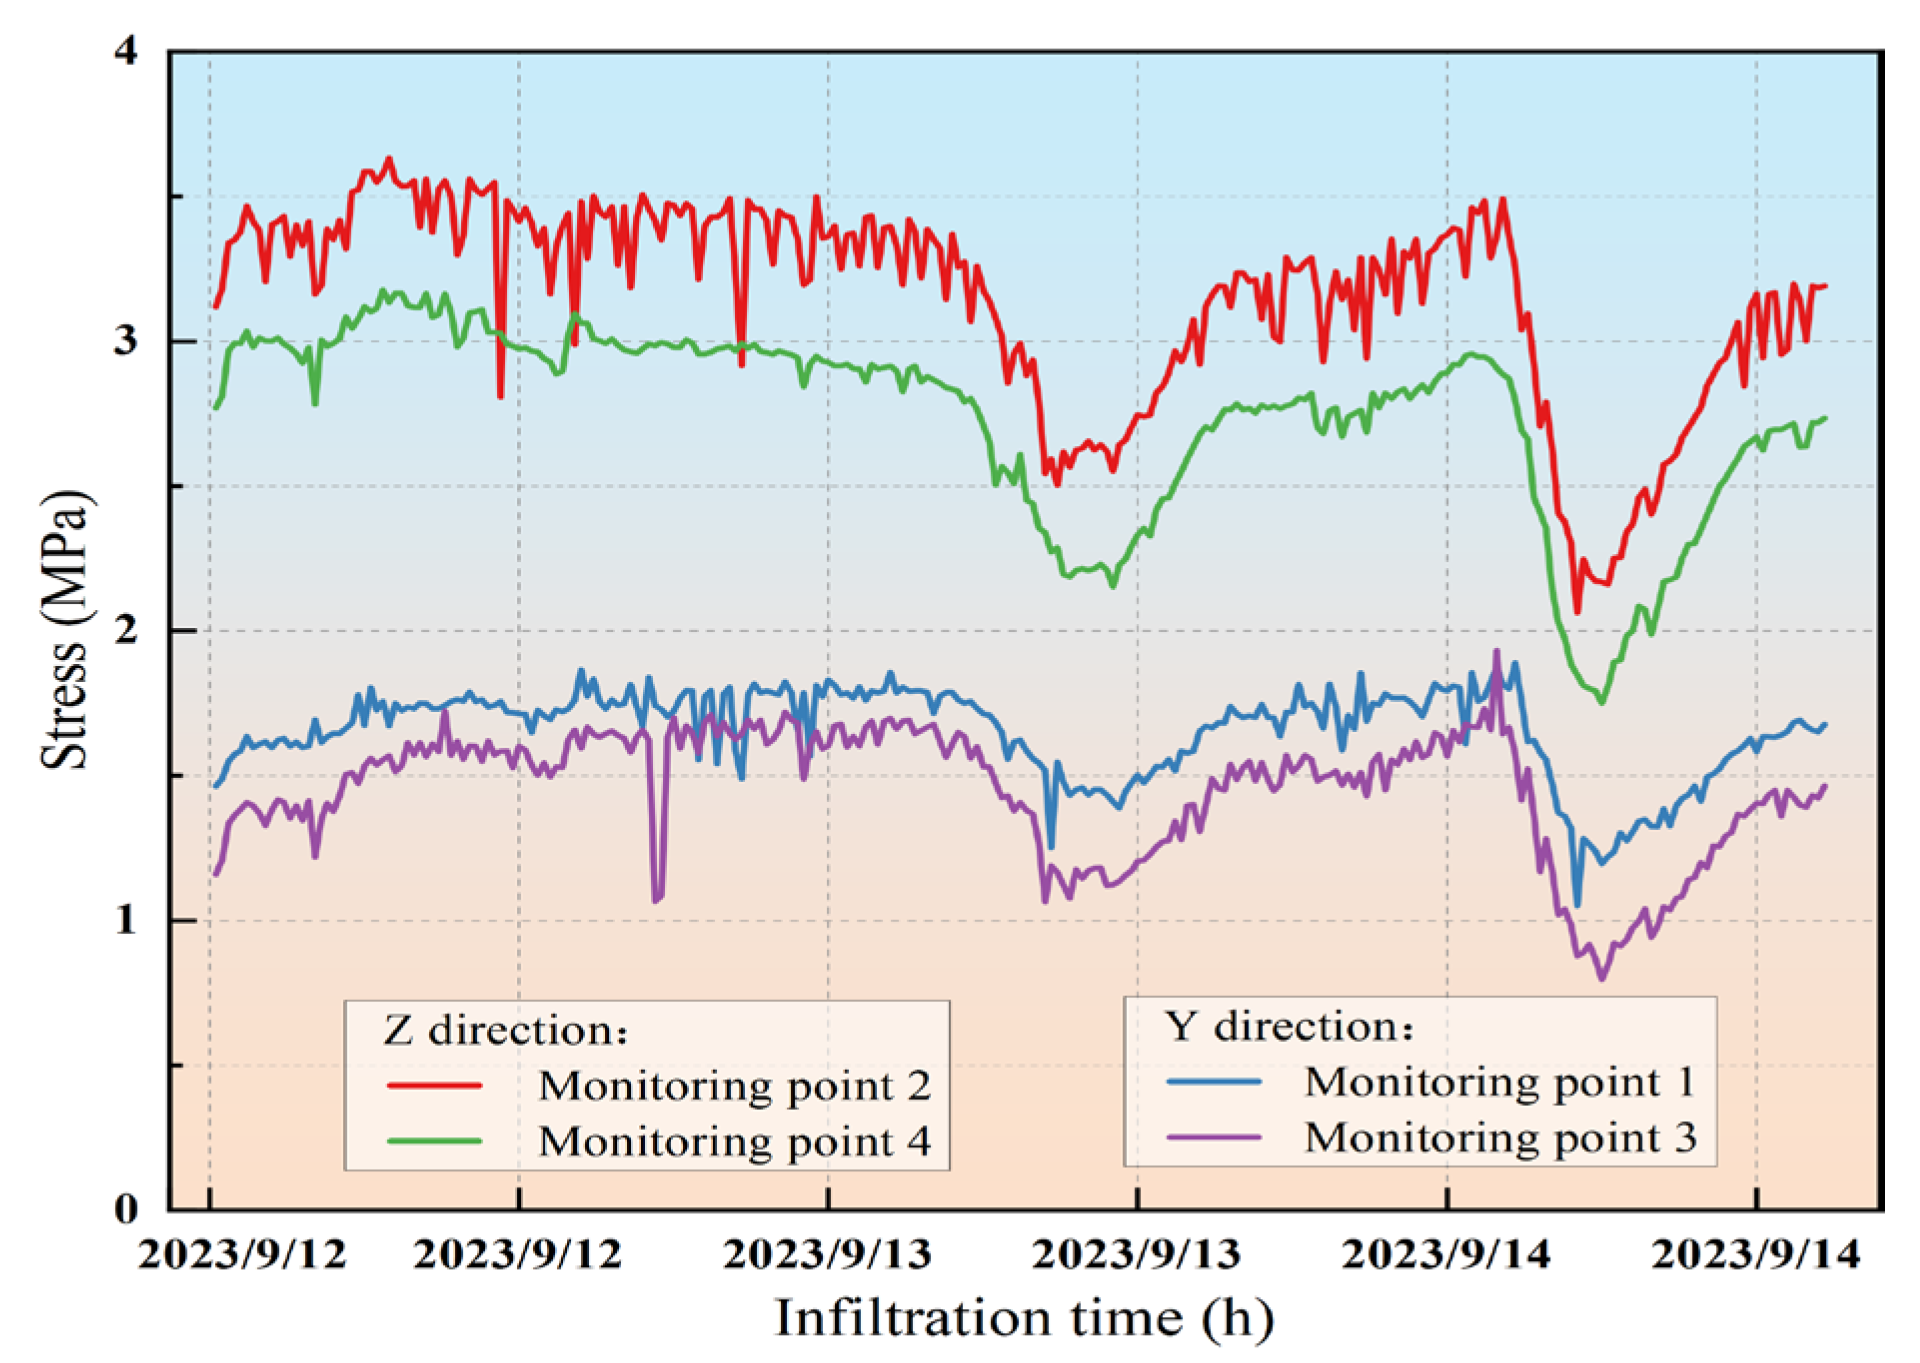
During rainfall, the tensile stress fluctuates more significantly. The tensile stress at Monitoring point 2 rises sharply to 3.5 Mpa, exhibiting a clear peak. Monitoring point 4 shows similar fluctuations, but with a slightly smaller amplitude, remaining around 2.5 Mpa. The post-rainfall fluctuations reflect the impact of moisture infiltration caused by rainfall on the tensile stress in the Z direction.
The significant difference in the variations of and is essentially due to the mismatch between the direction of the lining stress and the local geological conditions. In the Y direction (Monitoring points 1 and 3), which is parallel to the near-horizontal bedding of the feldspar quartz sandstone in the tunnel section, the corresponding area has sparse joints and no thick weak interlayers. Under heavy rainfall, the surrounding rock’s bearing capacity is weakened to a limited extent; so, the tensile stress remains stable at 1.5–2.2 Mpa, with fluctuations only between 0.3–0.4 Mpa. In contrast, in the Z direction (Monitoring points 2 and 4), which is perpendicular to the sandstone bedding, the stress path crosses the fractured rock layers and the intercalated carbonaceous shale zones. The high-angle perpendicular bedding joints become rapid pathways for pore-fissure water. The strong rainfall causes the interlayers to soften when wet, transferring additional loads to the lining. As a result, the peak tensile stress at Monitoring point 2 reaches 3.5 Mpa.
Figure 4.
Stress variation diagram under rainstorm conditions.
On 12 September 2023, a heavy rainfall event with a duration of 14 h and an intensity of 20 mm/h led to a significant infiltration of surface water into the tunnel area. At this time, the drainage volume of a single drainage ditch was approximately 66 m3 (reflecting the infiltration intensity of this rainfall). Monitoring data showed that the maximum tensile stress increment in the Z direction (vertical) at the two monitoring points reached 0.53 Mpa and 0.55 Mpa, respectively, while the maximum tensile stress increment in the Y direction (longitudinal) at the two monitoring points was 0.28 Mpa and 0.22 Mpa. This significant stress variation was primarily caused by the infiltration of surface water from the rainfall: the heavy rainfall allowed a large amount of water to seep through cracks or pores into the surrounding and interior of the tunnel lining, altering the lining’s stress state. The increment in (tensile stress) is more significant, indicating that this direction is more directly and strongly affected by the additional water pressure or softening effect caused by moisture infiltration. In contrast, the tensile stress increment in the Y direction is smaller, which is primarily related to the boundary conditions in this direction. Specifically, the tunnel’s longitudinal direction is usually subject to more complex interactions between the surrounding rock and the lining (such as frictional resistance and longitudinal constraints), which limits the stress changes caused by water infiltration, resulting in relatively smaller fluctuations.
3. Fluid-Solid Coupling Numerical Model
3.1. Model Establishment
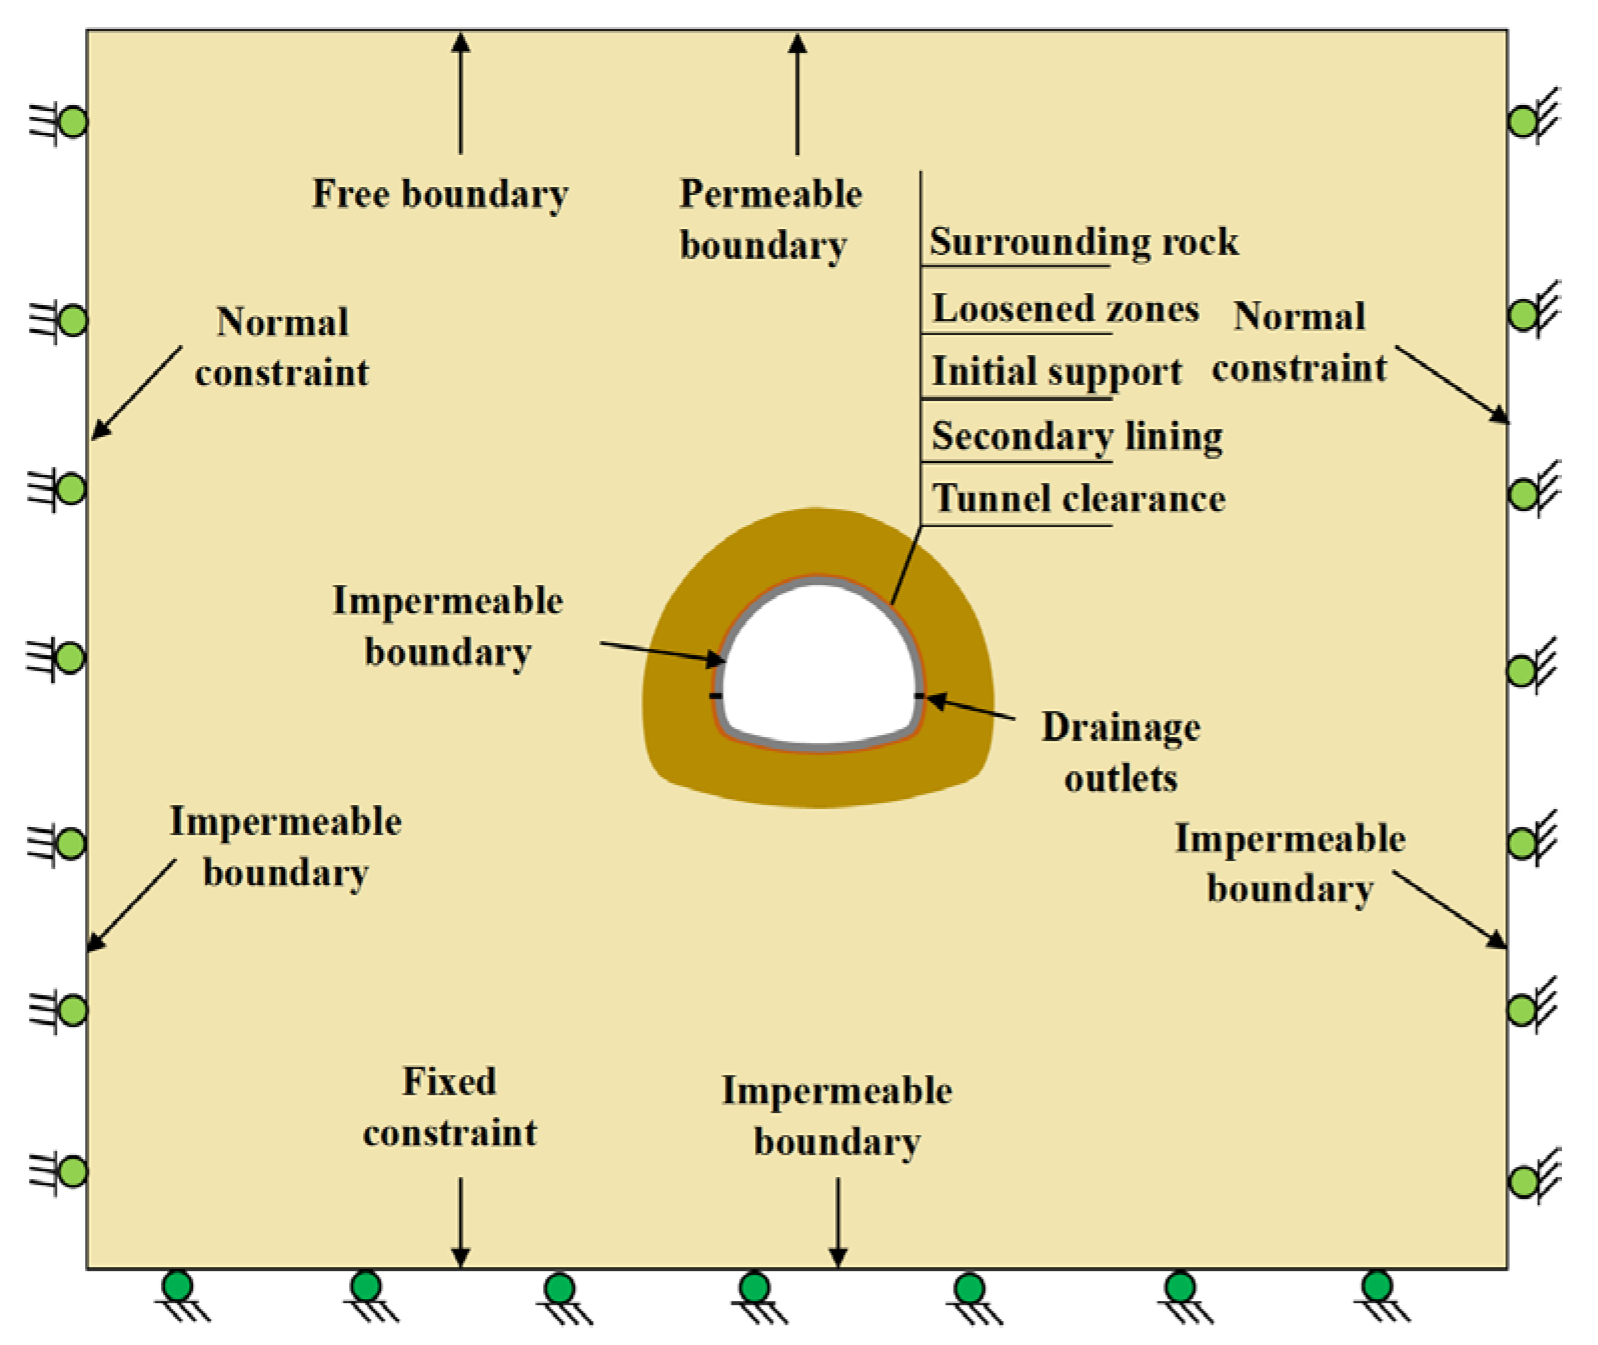
This study selects the K97+450 section of the tunnel for simulation. The tunnel is buried at a depth of 40 m, and the engineering surrounding rock is considered to be a homogeneous soil layer, classified as Class V. The surrounding rock and lining structure are modeled using solid elements, and the mechanical model adopts the Mohr-Coulomb plasticity model, assuming the surrounding rock as an equivalent continuous medium. The lining structure uses an elastic constitutive model, and the fluid model adopts an isotropic seepage model []. This study uses the Richards equation as the governing equation for unsaturated seepage, combined with the Van Genuchten model to accurately describe the unsaturated-saturated transition process. Additionally, FLAC3D provides the SEEP module, which enables the numerical solution of the Richards equation. This is combined with unsaturated seepage theory to make adaptive adjustments for different types of soils, allowing the model to be applicable to the seepage characteristics of various soil types. The formulas are detailed in Appendix A. In the model calculations, the boundary conditions for the computational analysis can be divided into displacement boundary conditions and seepage boundary conditions. The top is a free boundary, while the bottom, front, rear, and lateral boundaries are fixed. The surface at the top of the tunnel is a free seepage boundary, and all other boundaries are impermeable boundaries (as shown in Figure 5). The groundwater level is located 10 m below the surface, and the saturation below the water level is set to 1, indicating complete saturation in this area []. These boundary conditions allow for a more accurate simulation of the displacement and seepage behavior in the actual situation.
Figure 5.
Calculation model boundary condition diagram.
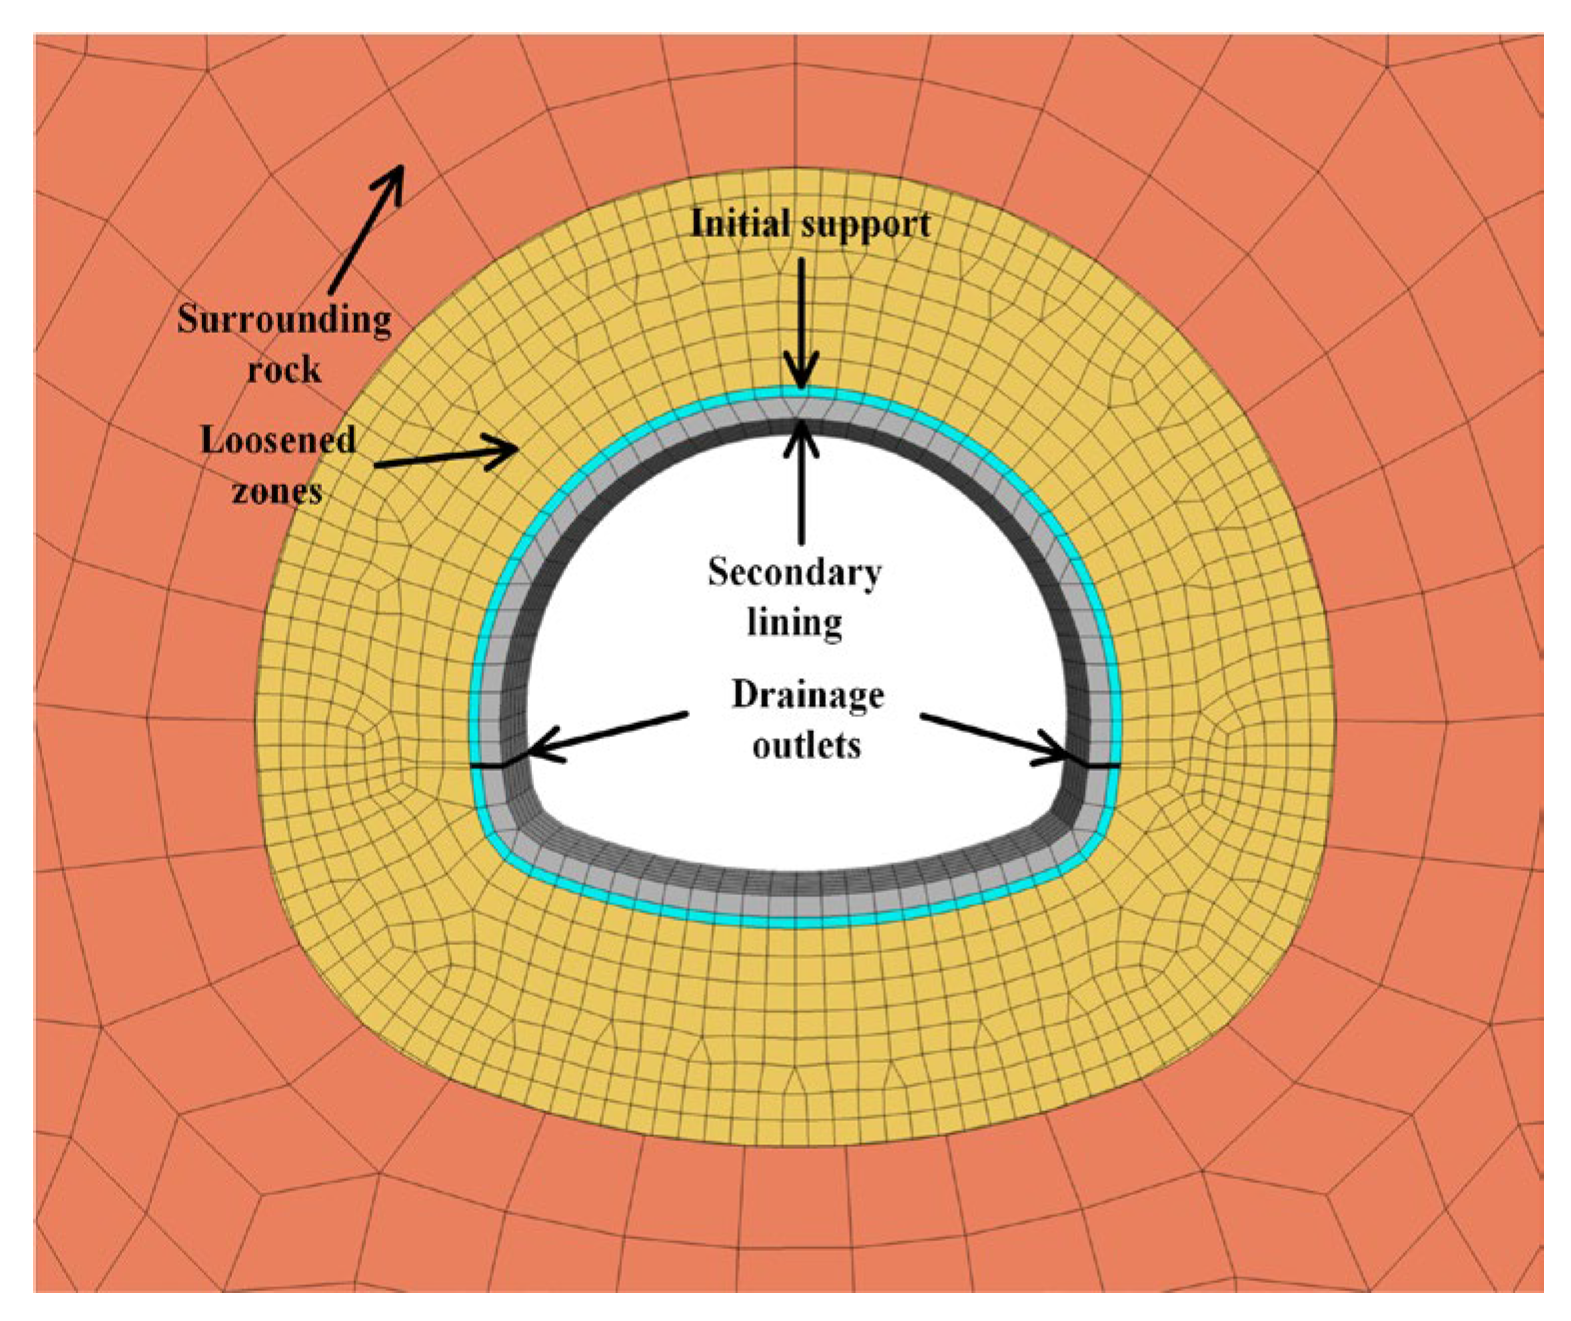
The tunnel’s 3D geometry model is constructed based on the actual engineering dimensions and shape. The tunnel is excavated using the bench method, with the details shown in Figure 6. Specifically, the tunnel cross-section has a net width of 10.82 m, net height of 7.09 m, and a cross-sectional area of 63.85 m2, with a tunnel body dimension of 3 m. The secondary lining, initial support, drainage outlets, and surrounding rock (loosened and non-loosened zones) are set as different layers in the model. The drainage outlet is idealized during modeling, with a permeability coefficient of 9 × 10⁻² m/s. For mesh discretization, the surrounding rock region uses a grid size of 2 m, while key areas such as near the lining and the loosened zones are refined using a 0.5 m grid, resulting in a total of 12,588 elements. The surrounding rock consists primarily of moderately weathered sandstone, with occasional intercalated carbonaceous shale layers. The structure is fragmented, and joints are well-developed. The geological survey report from the early stages of the project provides measured and estimated values for the natural density, elastic modulus, Poisson’s ratio, and permeability coefficient of the major soil and rock media. Further values are determined by referencing data from the literature []. Due to the lack of field data covering all the simulation requirements, certain parameters, such as shear strength indicators (cohesion c and internal friction angle φ) and hydraulic modulus, refer to the typical recommended values in the “Highway Tunnel Design Code” (JTG 3370.1-2018) [] and “Geotechnical Engineering Investigation Code” (GB 50021-2001) []. The mechanical and fluid parameters for the model are shown in Table 2 and Table 3.
Figure 6.
Details of the calculation model.
Table 2.
Mechanical parameter.
Table 3.
Fluid parameters.
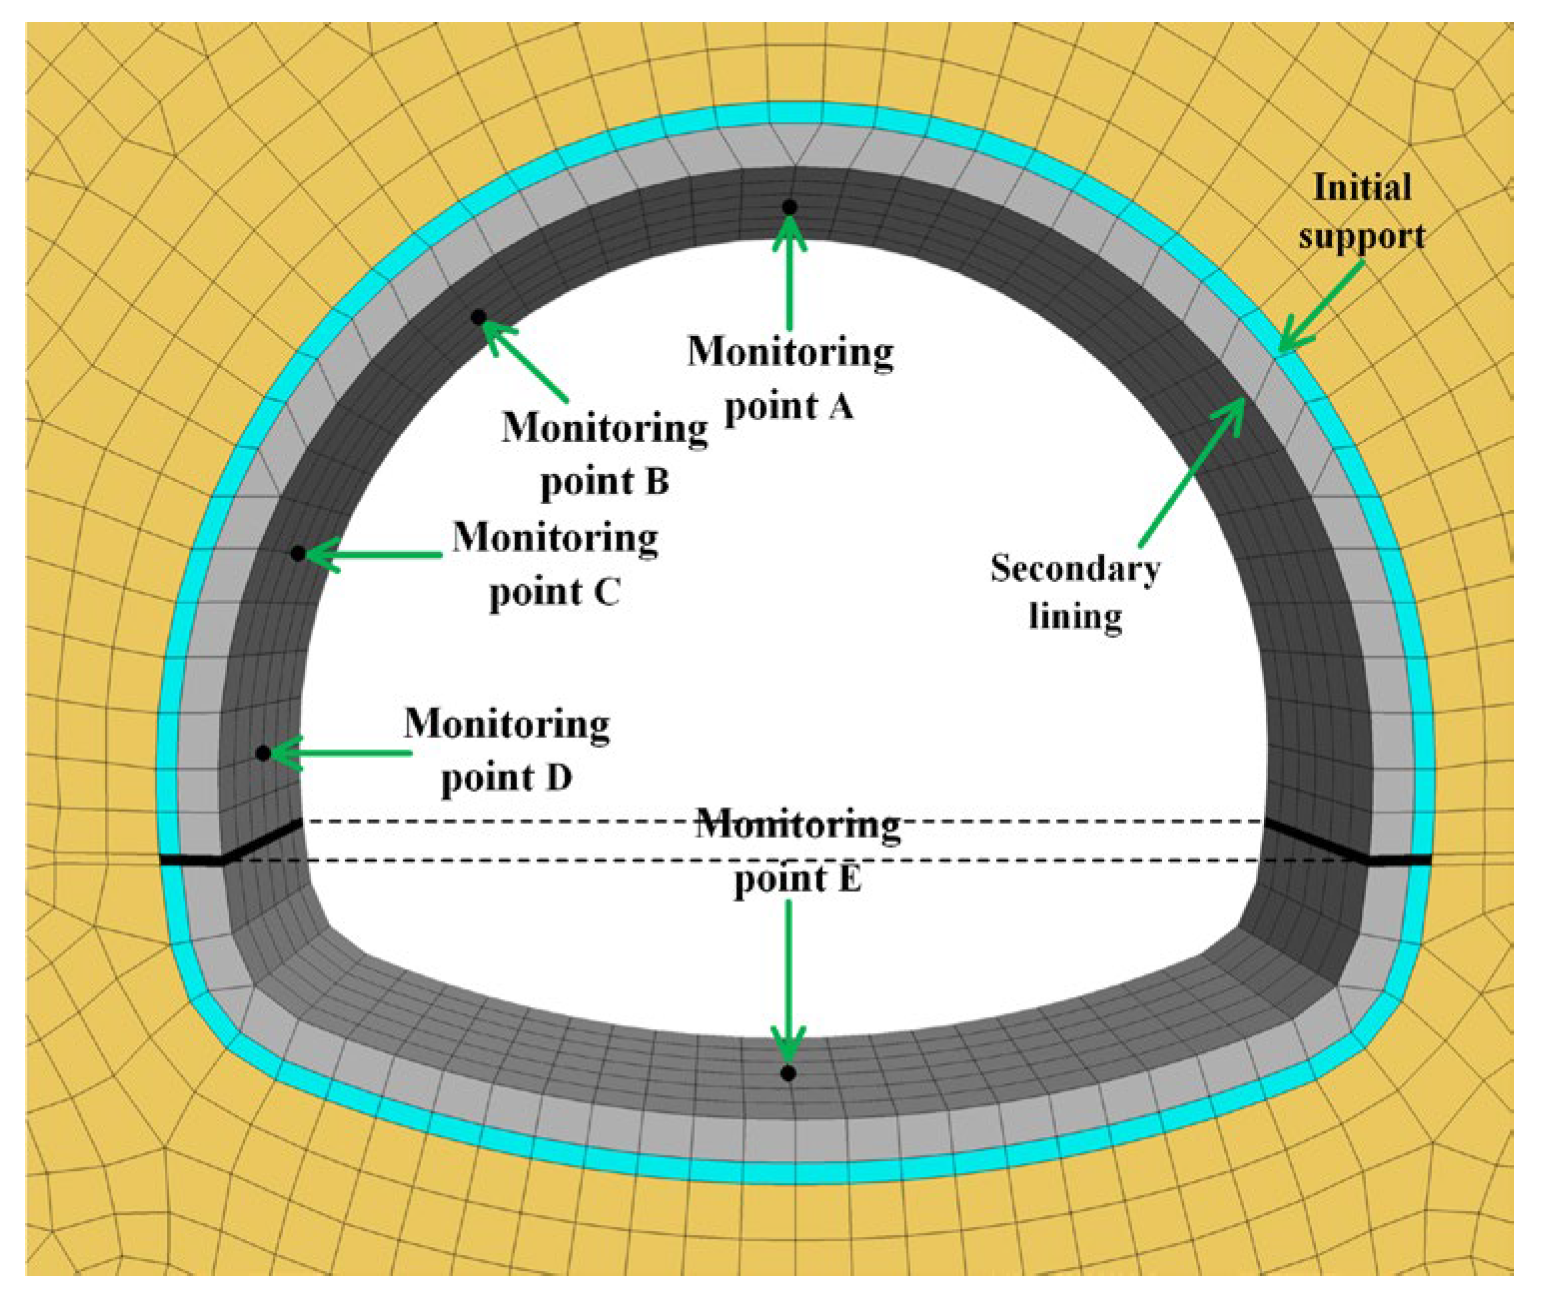
To accurately assess the impact of heavy rainfall on tunnel lining, the first step is to analyze the rainfall intensity and duration conditions. Rainfall intensities of 20 mm/h, 30 mm/h, 40 mm/h, 60 mm/h, and 80 mm/h are converted into simulation software units as 5.56 × 10⁻⁶ m/s, 8.33 × 10⁻⁶ m/s, 1.11 × 10⁻⁵ m/s, 1.67 × 10⁻⁵ m/s, and 2.22 × 10⁻⁵ m/s, respectively (conversion formula: 1 mm/h = 1 × 10⁻³ m/3600 s = 2.78 × 10⁻⁷ m/s). The final step is to analyze the permeability conditions of the surrounding rock in the loosened zone under heavy rainfall conditions (see Table 4). Multiple monitoring points are set up in the FLAC3D model to monitor real-time changes in lining water pressure, stress, and displacement. The specific monitoring points include Point A in the crown area, Point B in the waist area, Point C in the foot area, Point D in the sidewall area, and Point E in the invert area (as shown in Figure 7), with the dashed line indicating the approximate position of the road surface. Due to the symmetry of the tunnel model, monitoring points are only placed on one half of the tunnel.
Table 4.
Heavy rainfall calculation conditions.
Figure 7.
Calculate each monitoring point of the model.
3.2. Model Validation
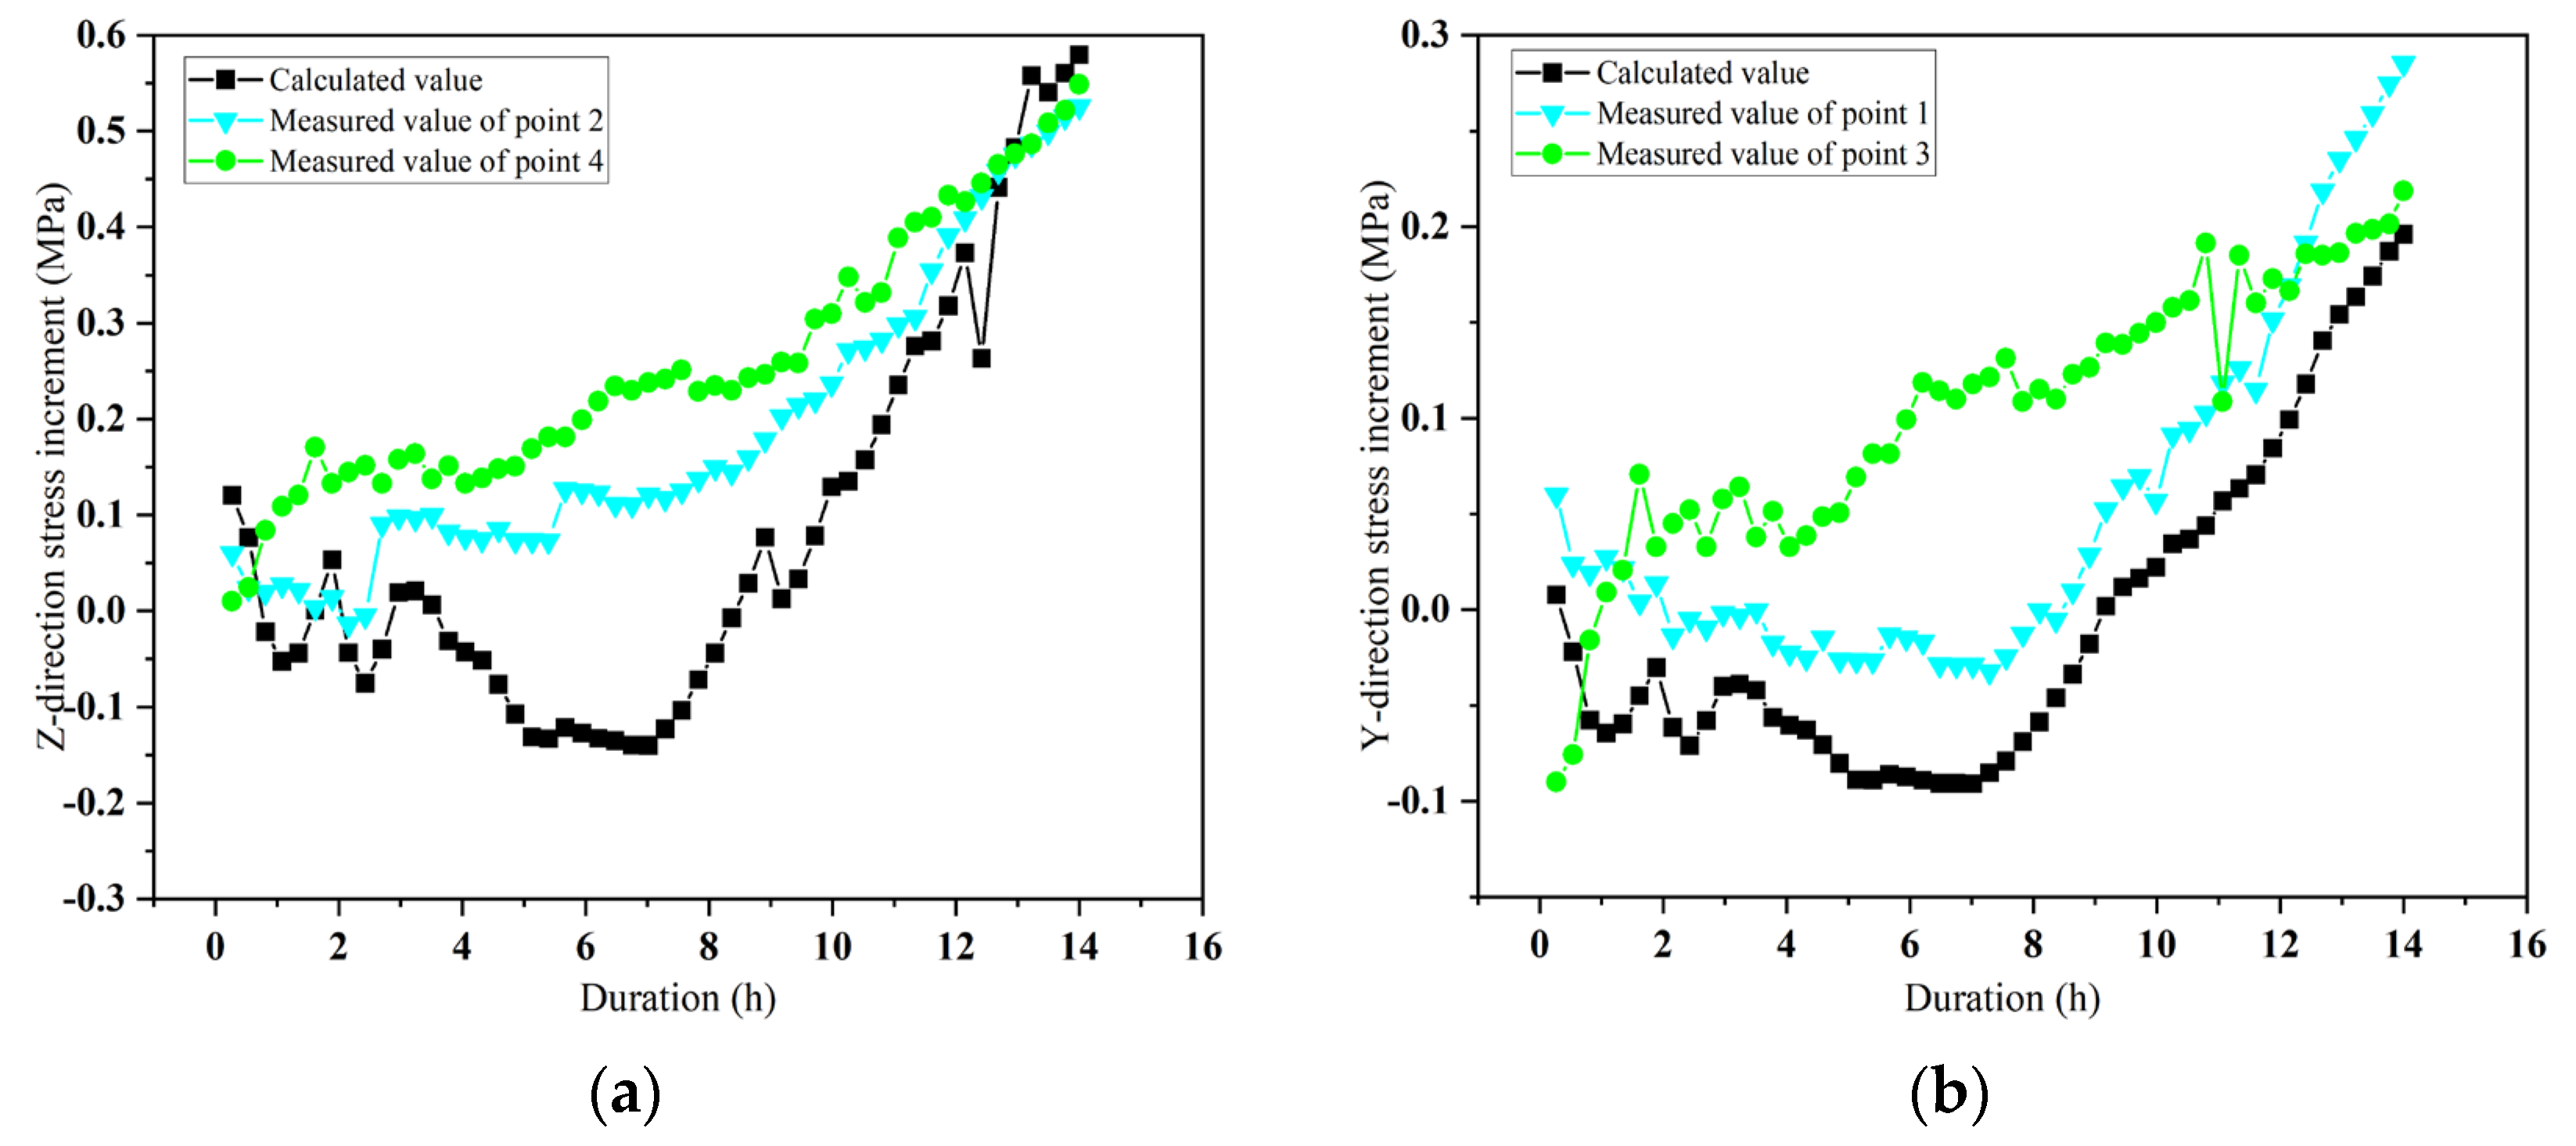
The field monitoring data from 12 September 2023, is selected as the model verification condition for the heavy rainfall scenario. On that day, the rainfall intensity was 20 mm/h, which meets the heavy rainfall standard, and this is used as the rainfall boundary condition for the model. Field monitoring data shows that the drainage volume of a single drainage ditch over 14 h was approximately 66 m3. After idealization (assuming that the four drainage ditches of the twin-tube tunnel share the load evenly), the drainage volume of a single ditch is converted to 2.64 × 10⁻² m3/(14 h·m), with the conversion formula provided in Appendix B. In the numerical model, the drainage volume of the outlet is 2.33 × 10⁻² m3/(14 h·m), which differs by 11.7% from the field monitoring value. The drainage monitoring location is outside the tunnel portal, where it is influenced by mountain slope runoff, shallow groundwater seepage, and some non-tunnel structural leakages (such as surface rainwater and lateral seepage from the mountain). These factors contribute to the higher field measurement compared to the simulation value. The deviations are primarily due to external factors rather than flaws in the core logic of the model (such as seepage calculation theory), and thus this error is within an acceptable range. As shown in Figure 8, the measured maximum stress increments at Monitoring points 2 and 4 in the Z direction are 0.53 Mpa and 0.55 Mpa, respectively. Compared to the calculated value of 0.58 Mpa, the deviations are 9.4% and 5.5%, respectively. In the Y direction, the measured maximum stress increments at Monitoring points 1 and 3 are 0.28 Mpa and 0.22 Mpa, respectively. Compared to the calculated value of 0.20 Mpa, the deviations are 28.6% and 9.1%. The larger deviation in point 1 ( variation of 28.6%) is mainly due to the relatively small distance between the front and rear boundaries in the model, which results in a slightly stronger longitudinal constraint effect in the tunnel, causing a minor impact on the calculation of . The comparison and analysis of the measured and calculated values above show that the errors in both drainage volume and stress increment are within an acceptable range, indicating that the fluid-solid coupling model can accurately reflect the evolution of tunnel lining mechanical behavior under heavy rainfall conditions.
Figure 8.
Comparison diagram of stress increment between calculated value and measured value. The comparison figures are (a) Z direction and (b) Y direction.
4. Investigation of Tunnel Lining Mechanical Behavior Under Heavy Rainfall
4.1. Effects of Rainfall Intensity on Lining Mechanical State
To investigate the variations in key parameters such as water pressure, stress, and displacement in the lining structure under different rainfall intensities, an in-depth analysis of the parameters listed in Table 5 is conducted. The aim is to comprehensively understand the response characteristics of the lining structure under extreme rainfall conditions at varying intensities, providing reliable scientific basis and reference for the design and construction of underground engineering projects.
Table 5.
Rainfall intensity condition parameters.
4.1.1. Effects of Rainfall Intensity on Secondary Lining Stresses
- (1)
- Maximum Principal Stress Analysis
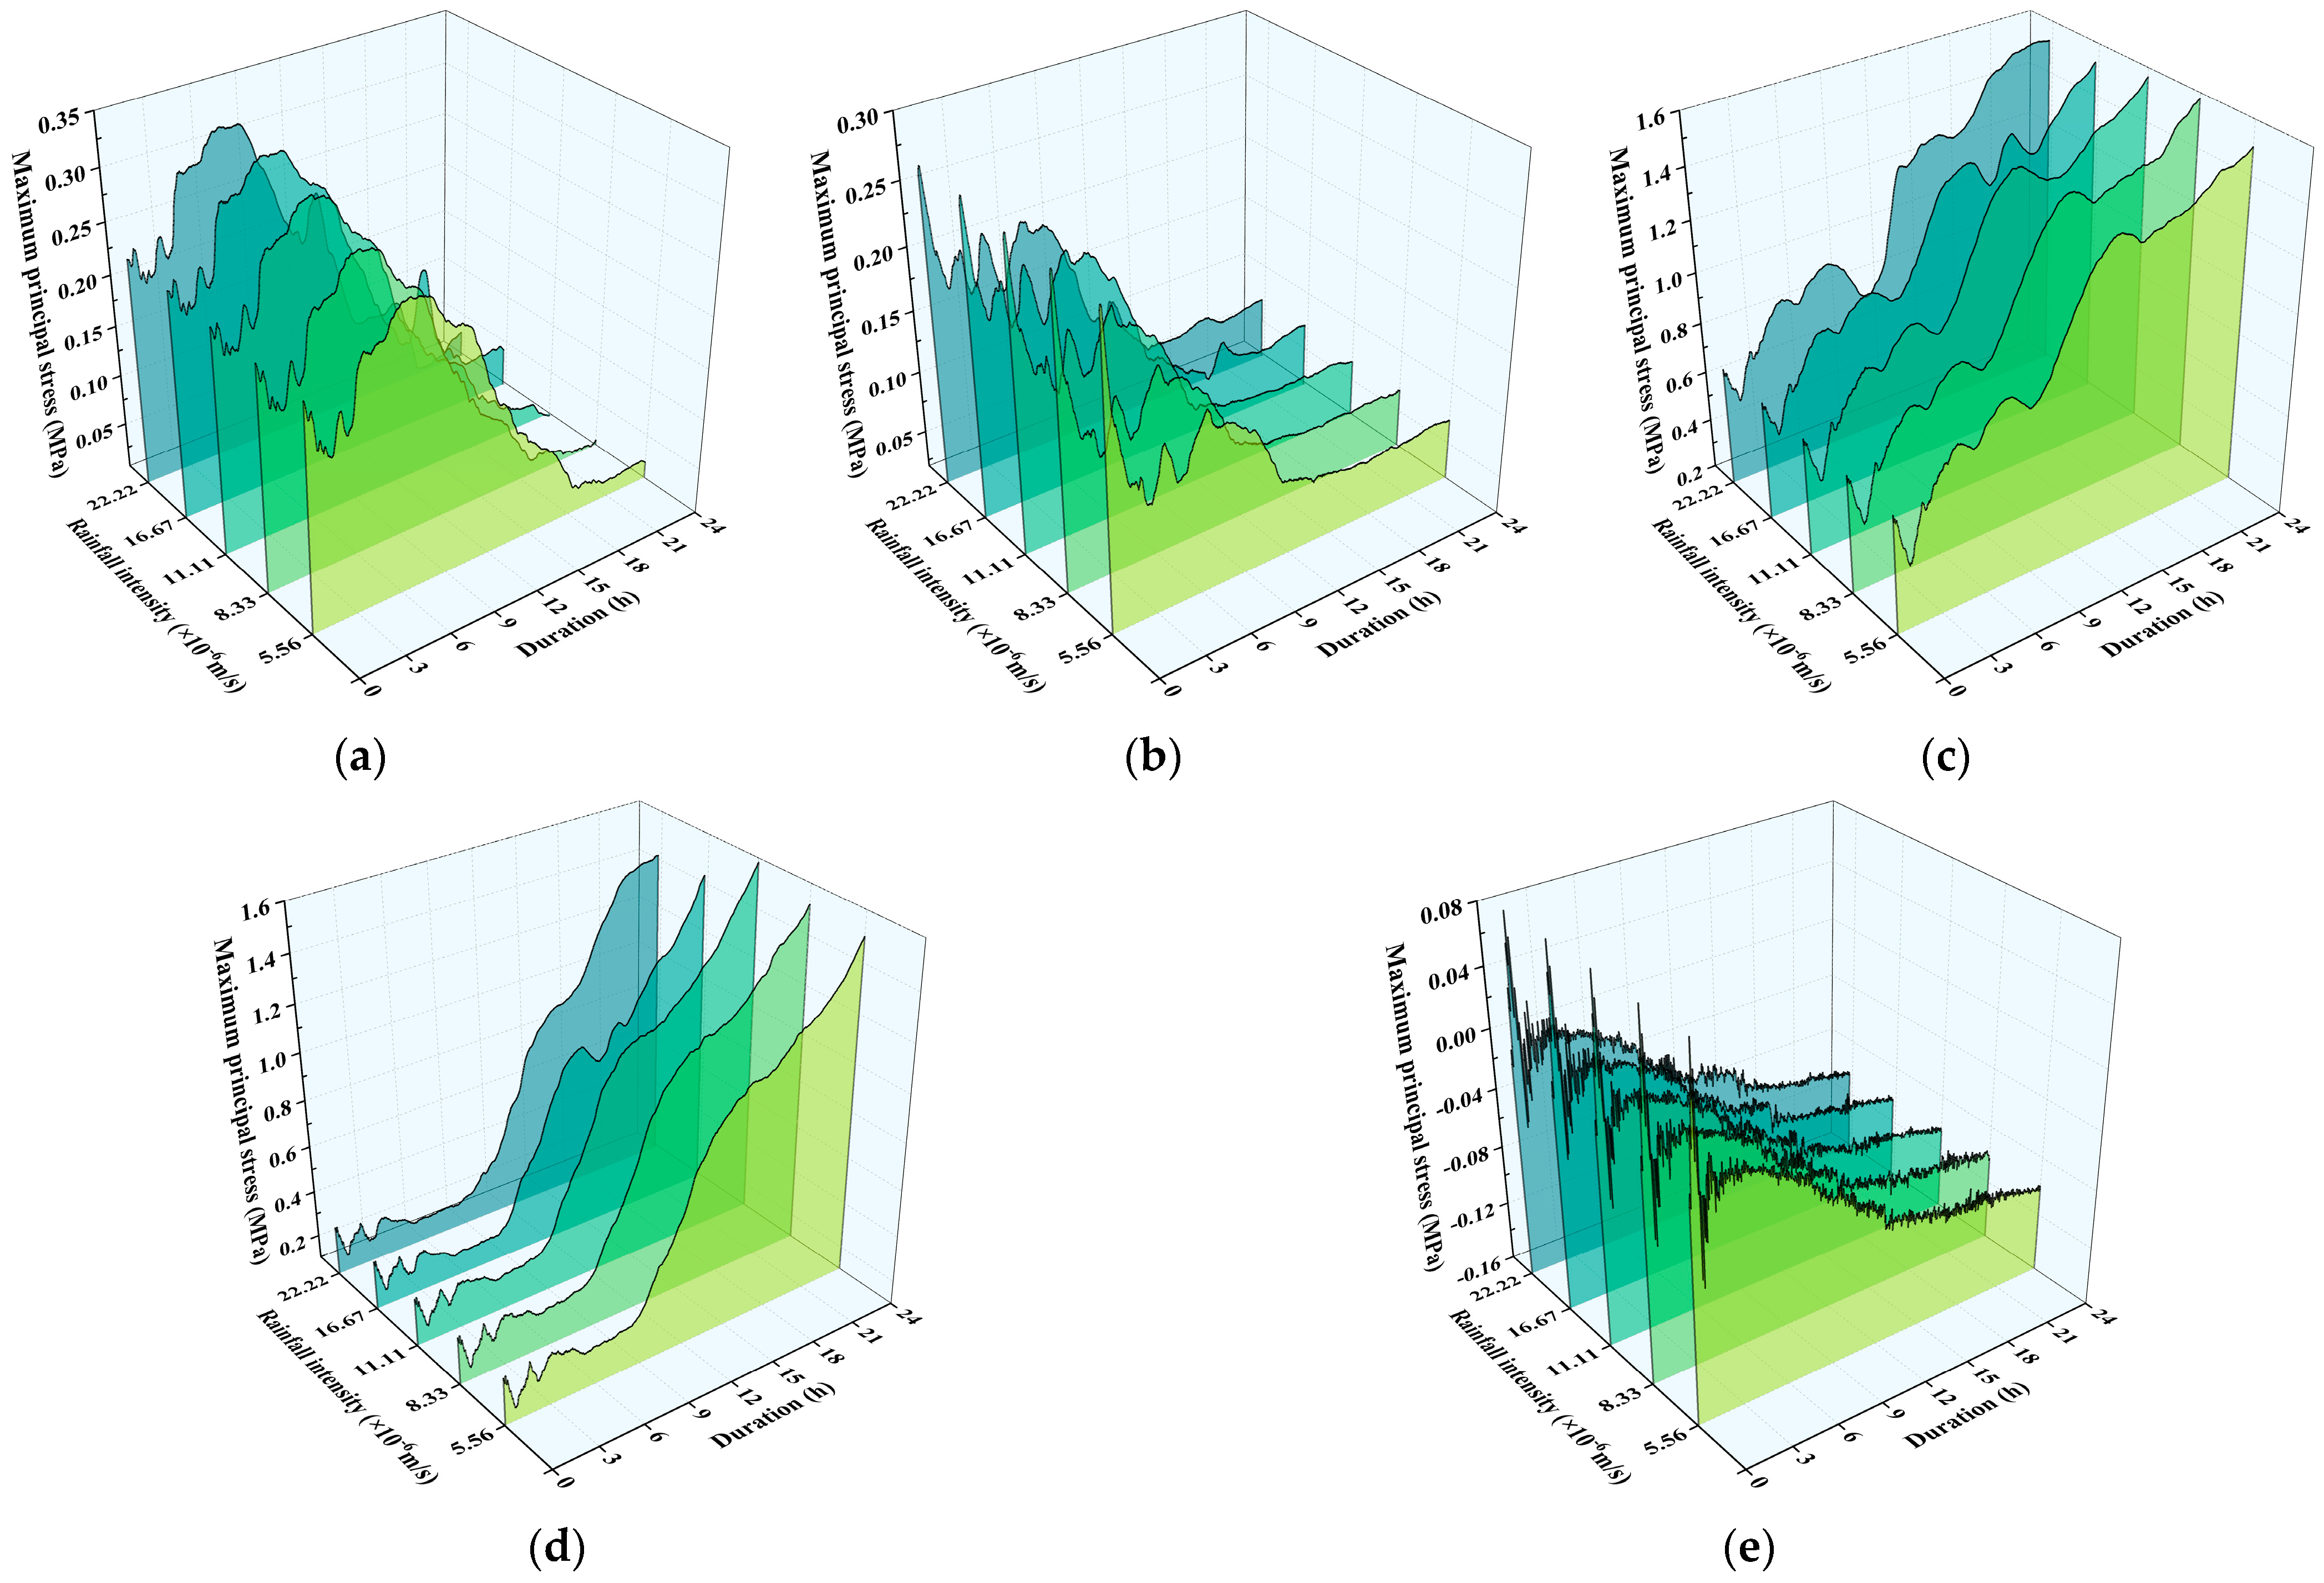
Figure 9a–e reveal the influence of rainfall intensity on the maximum principal stress in the tunnel lining. The maximum principal stress at most monitoring points is predominantly tensile stress, with the exception of the crown arch, which exhibits compressive stress. At Monitoring points A and B, the maximum principal stress initially decreases steeply during the early stage of rainfall (0–3 h) before rising back to the peak value. It then decreases and stabilizes, showing a “steep increase-steep decrease” characteristic. The stress at Monitoring point A is most sensitive to rainfall intensity, with a peak maximum principal stress of 0.32 Mpa during heavy rainfall (2.22 × 10⁻⁵ m/s). At Monitoring points C and D, the maximum principal stress generally increases non-linearly, stabilizing after 9 h before rising further. At a rainfall intensity of 1.11 × 10⁻⁵ m/s, Monitoring point D reaches a peak tensile stress of 1.58 Mpa at 24 h (exceeding the tensile strength design value of 1.43 Mpa for C30 concrete in the “Standard for Concrete Structure Design” (GB/T50010-2010) []), with a net increment of 1.3 Mpa. This indicates a risk of cracking in the sidewall area corresponding to Monitoring point D. The sidewall area experiences significant stress concentration due to the dual effects of lateral seepage pressure and surrounding rock expansion, with heavy rainfall accelerating the infiltration of fissure water and weakening the supporting capacity of the surrounding rock. At Monitoring point E, the maximum principal stress shows a gradual decreasing trend. Before the rainfall, it is characterized by small tensile stress, but after rainfall, it turns to compressive stress and slowly increases. Heavy rainfall significantly intensifies the tensile stress levels at the crown foot and sidewall areas, making these structural parts the weak points of the overall safety. It is recommended to install blind drainage pipes in the sidewall area to dissipate lateral water pressure and enhance the tensile strength of critical areas.
Figure 9.
The change in the maximum principal stress of each monitoring point in different heavy rainfall intensity. Each monitoring point is (a) measuring point A, (b) measuring point B, (c) measuring point C, (d) measuring point D, (e) measuring point E.
- (2)
- Minimum Principal Stress Analysis
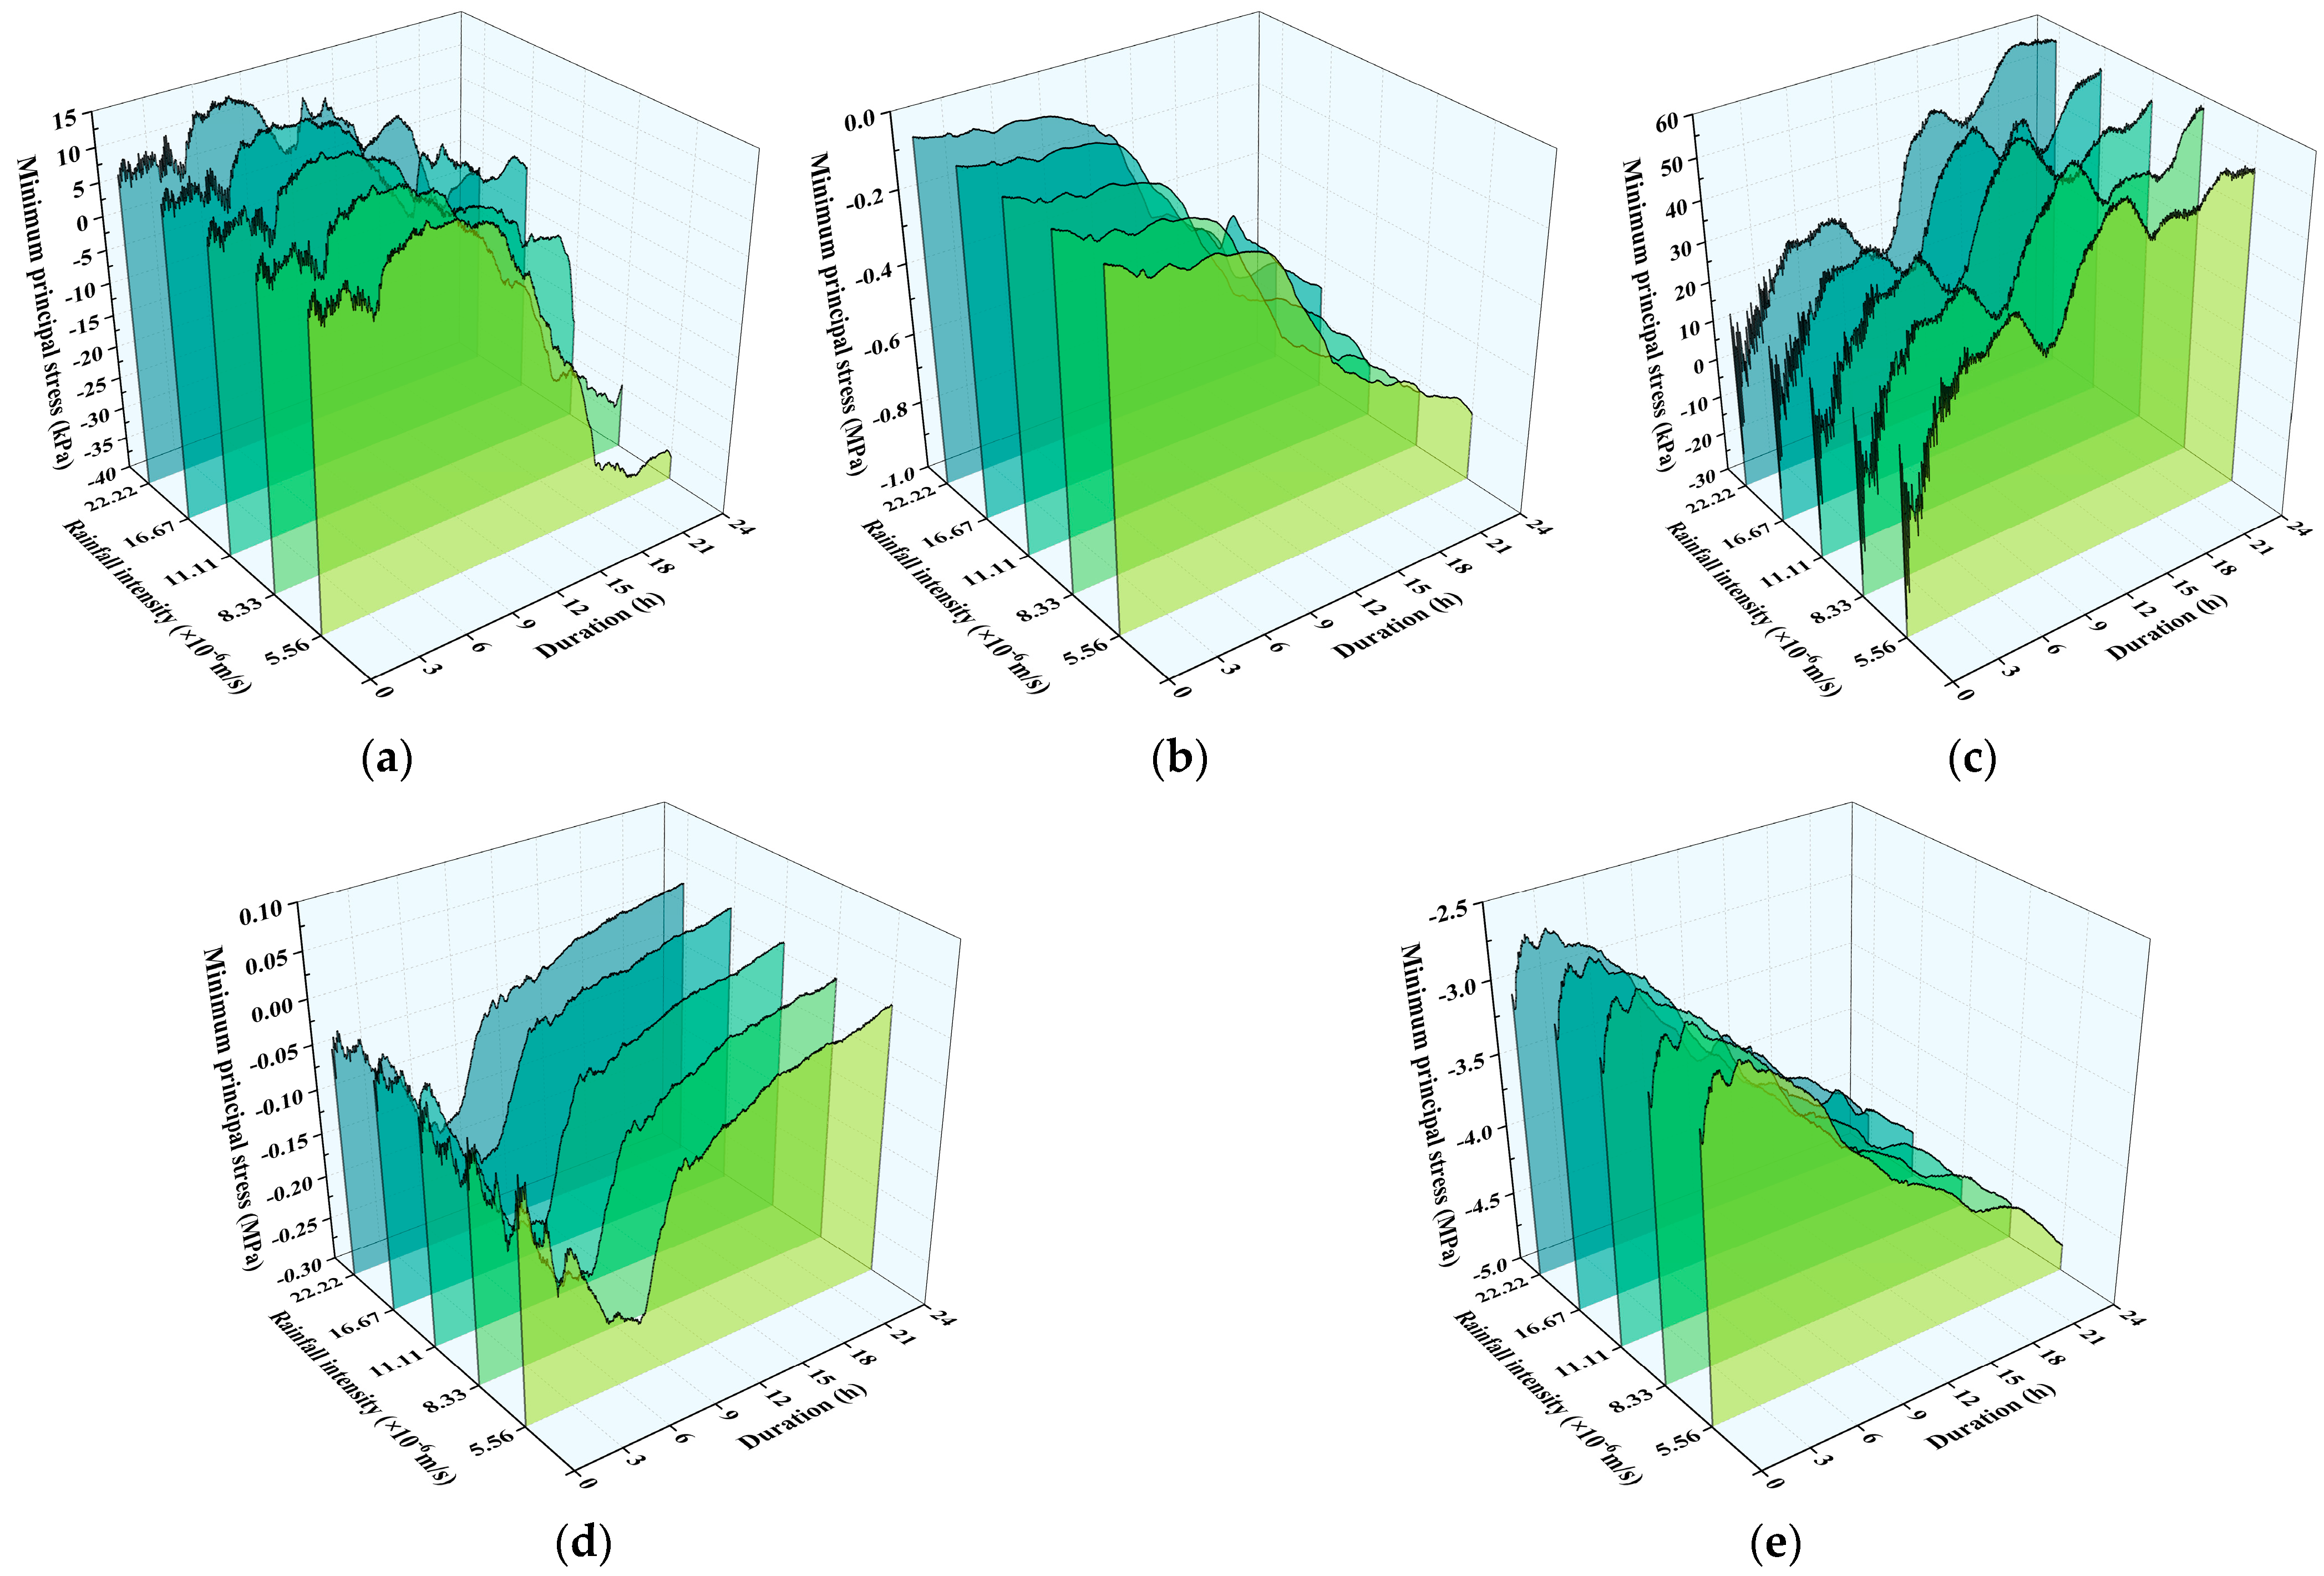
Figure 10a–e show the effect of rainfall intensity on the minimum principal stress of the tunnel lining. The minimum principal stress at most monitoring points is primarily compressive stress. At Monitoring points A and B, the change in minimum principal stress is influenced by the dynamic balance of the seepage field, with an overall increment of less than 0.1 Mpa, which has a limited impact on structural safety. At Monitoring points C and D, the minimum principal stress increases non-linearly after rainfall begins, transitioning from compressive stress to tensile stress, but the increment is small. At Monitoring point E, the minimum principal stress decreases non-linearly with increasing rainfall intensity (5.56 × 10⁻⁶ to 2.22 × 10⁻⁵ m/s), with compressive stress increasing. At a rainfall intensity of 1.11 × 10⁻⁵ m/s, a “critical change point” phenomenon occurs at the 24 h mark, where the stress growth rate accelerates significantly, with the most drastic change observed. The peak compressive stress reaches 4.8 Mpa (an increase of 1.8 Mpa before and after rainfall). While high compressive stress may lead to lining crushing or buckling, the peak compressive stress of 4.8 Mpa is far below the design compressive strength of 14.3 Mpa for C30 concrete in the “Standard for Concrete Structure Design” (GB/T50010-2010), indicating no such risk and providing ample safety margin. During the rainfall, the rise in water head reduces the bearing capacity of the base soil, and the load originally carried by the soil is transferred to the lining. Heavy rainfall significantly increases the compressive stress on the crown arch. It is recommended to reinforce the crown arch with reinforced concrete to improve its compressive bearing capacity.
Figure 10.
The change in the minimum principal stress of each monitoring point in different heavy rainfall intensity. Each monitoring point is (a) measuring point A, (b) measuring point B, (c) measuring point C, (d) measuring point D, (e) measuring point E.
4.1.2. Effects of Rainfall Intensity on Displacements of Secondary Linings
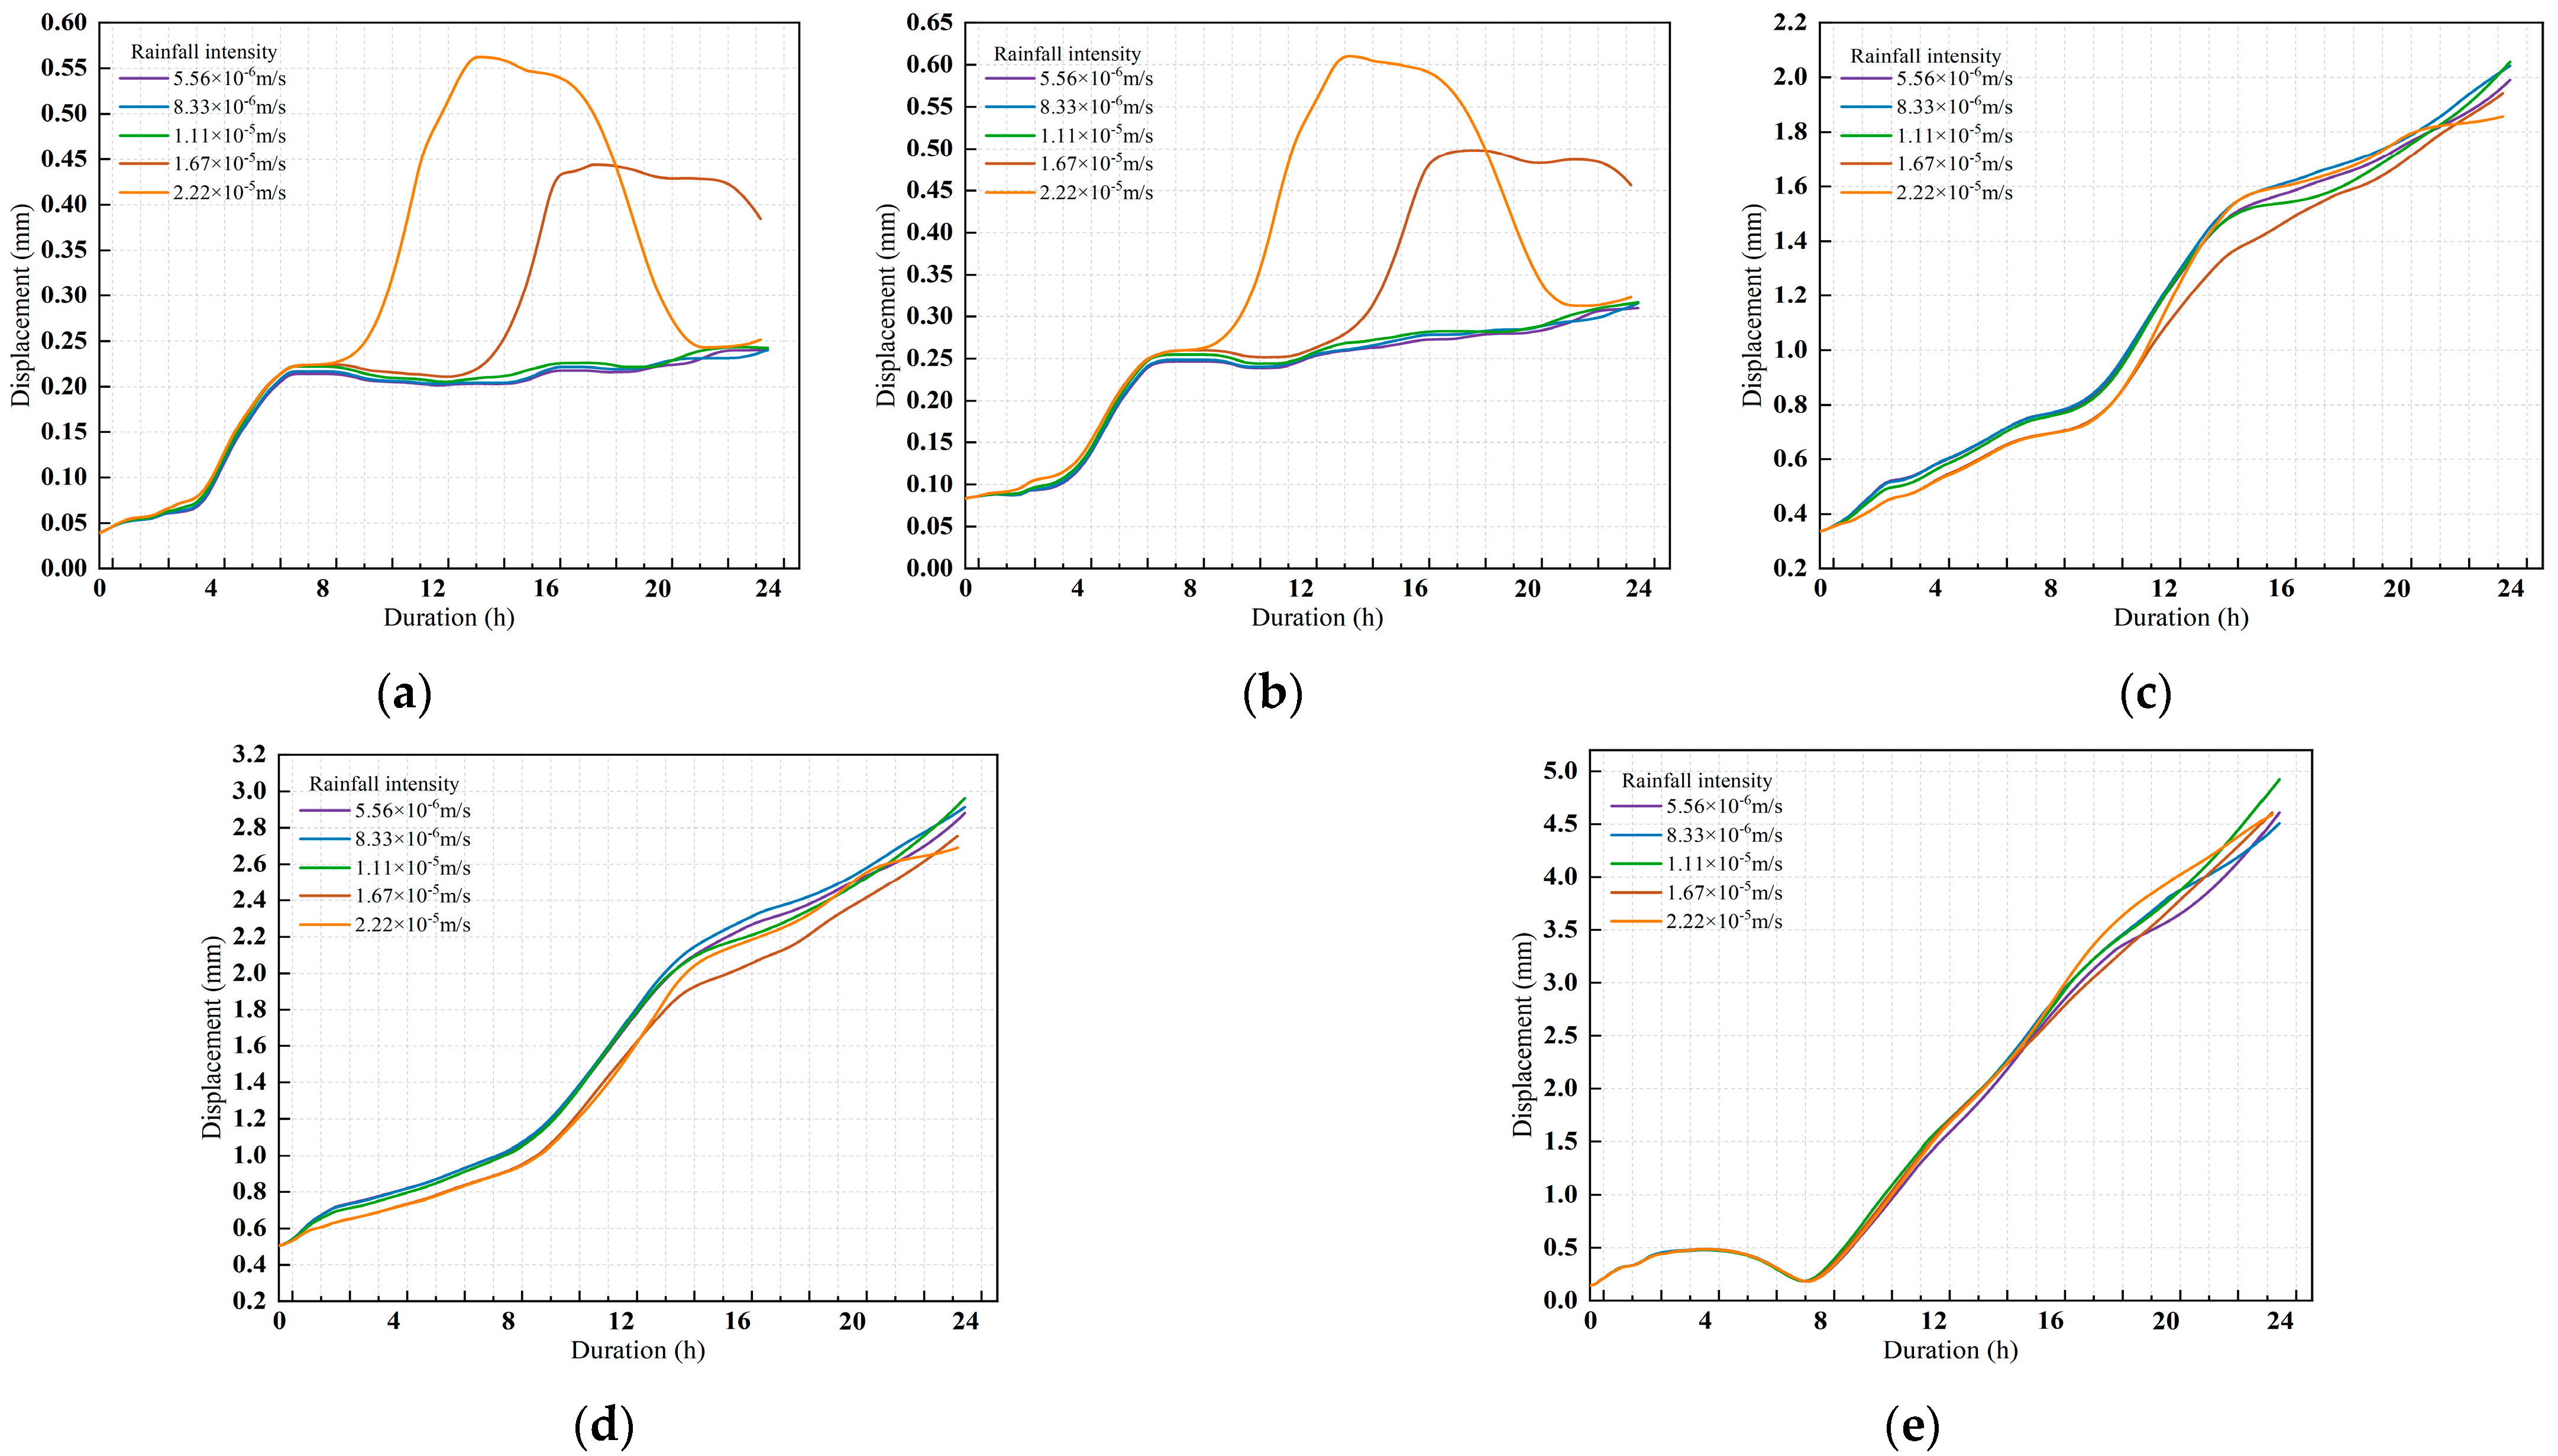
Figure 11a–e show the displacement time-history variations at typical tunnel locations under different rainfall intensities. When the rainfall intensity ranges from 5.56 × 10⁻⁶ to 1.11 × 10⁻⁵ m/s, the displacement at Monitoring points A and B increases rapidly in the early stage of rainfall and then stabilizes, showing a “rapid increase-slow stabilization” characteristic. When the rainfall intensity reaches 1.67 × 10⁻⁵ and 2.22 × 10⁻⁵ m/s, the displacement experiences a sudden increase during the stable phase seen at lower intensities, but the maximum value only reaches 0.56 mm, which has minimal impact on the lining stability. At Monitoring points C, D, and E, the displacement shows a nonlinear increase under all rainfall intensities. At a rainfall intensity of 1.11 × 10⁻⁵ m/s, the maximum displacement at Monitoring point E occurs at the 24 h mark (4.9 mm), followed by Monitoring point D (2.9 mm) and Monitoring point C (2 mm). The displacement at Monitoring point E is primarily driven by the base uplift force, while the displacement at Monitoring point D is caused by lateral seepage pressure. Heavy rainfall significantly exacerbates lining deformation, with the crown foot, sidewall, and invert being the main deformation concentration zones. It is recommended to use lightweight concrete for the crown arch to reduce its self-weight and to set up drainage expansion joints at the sidewalls to reduce buoyancy effects and release lateral deformation.
Figure 11.
The change in the displacement of each monitoring point in different heavy rainfall intensity. Each monitoring point is (a) measuring point A, (b) measuring point B, (c) measuring point C, (d) measuring point D, (e) measuring point E.
4.2. Effects of Heavy Rainfall Duration on Mechanical Response of Tunnel Linings
To investigate the variations in key parameters such as water pressure, stress, and displacement in the lining structure under different heavy rainfall durations, an in-depth analysis of the key parameters in Table 6 is conducted. The aim is to comprehensively understand the response characteristics of the lining structure under extreme rainfall conditions with varying durations, providing reliable scientific basis and reference for the design and construction of underground engineering projects.
Table 6.
Conditional parameters of heavy rainfall duration.
4.2.1. Effects of Rainfall Duration on Secondary Lining Stresses
- (1)
- Maximum Principal Stress Analysis
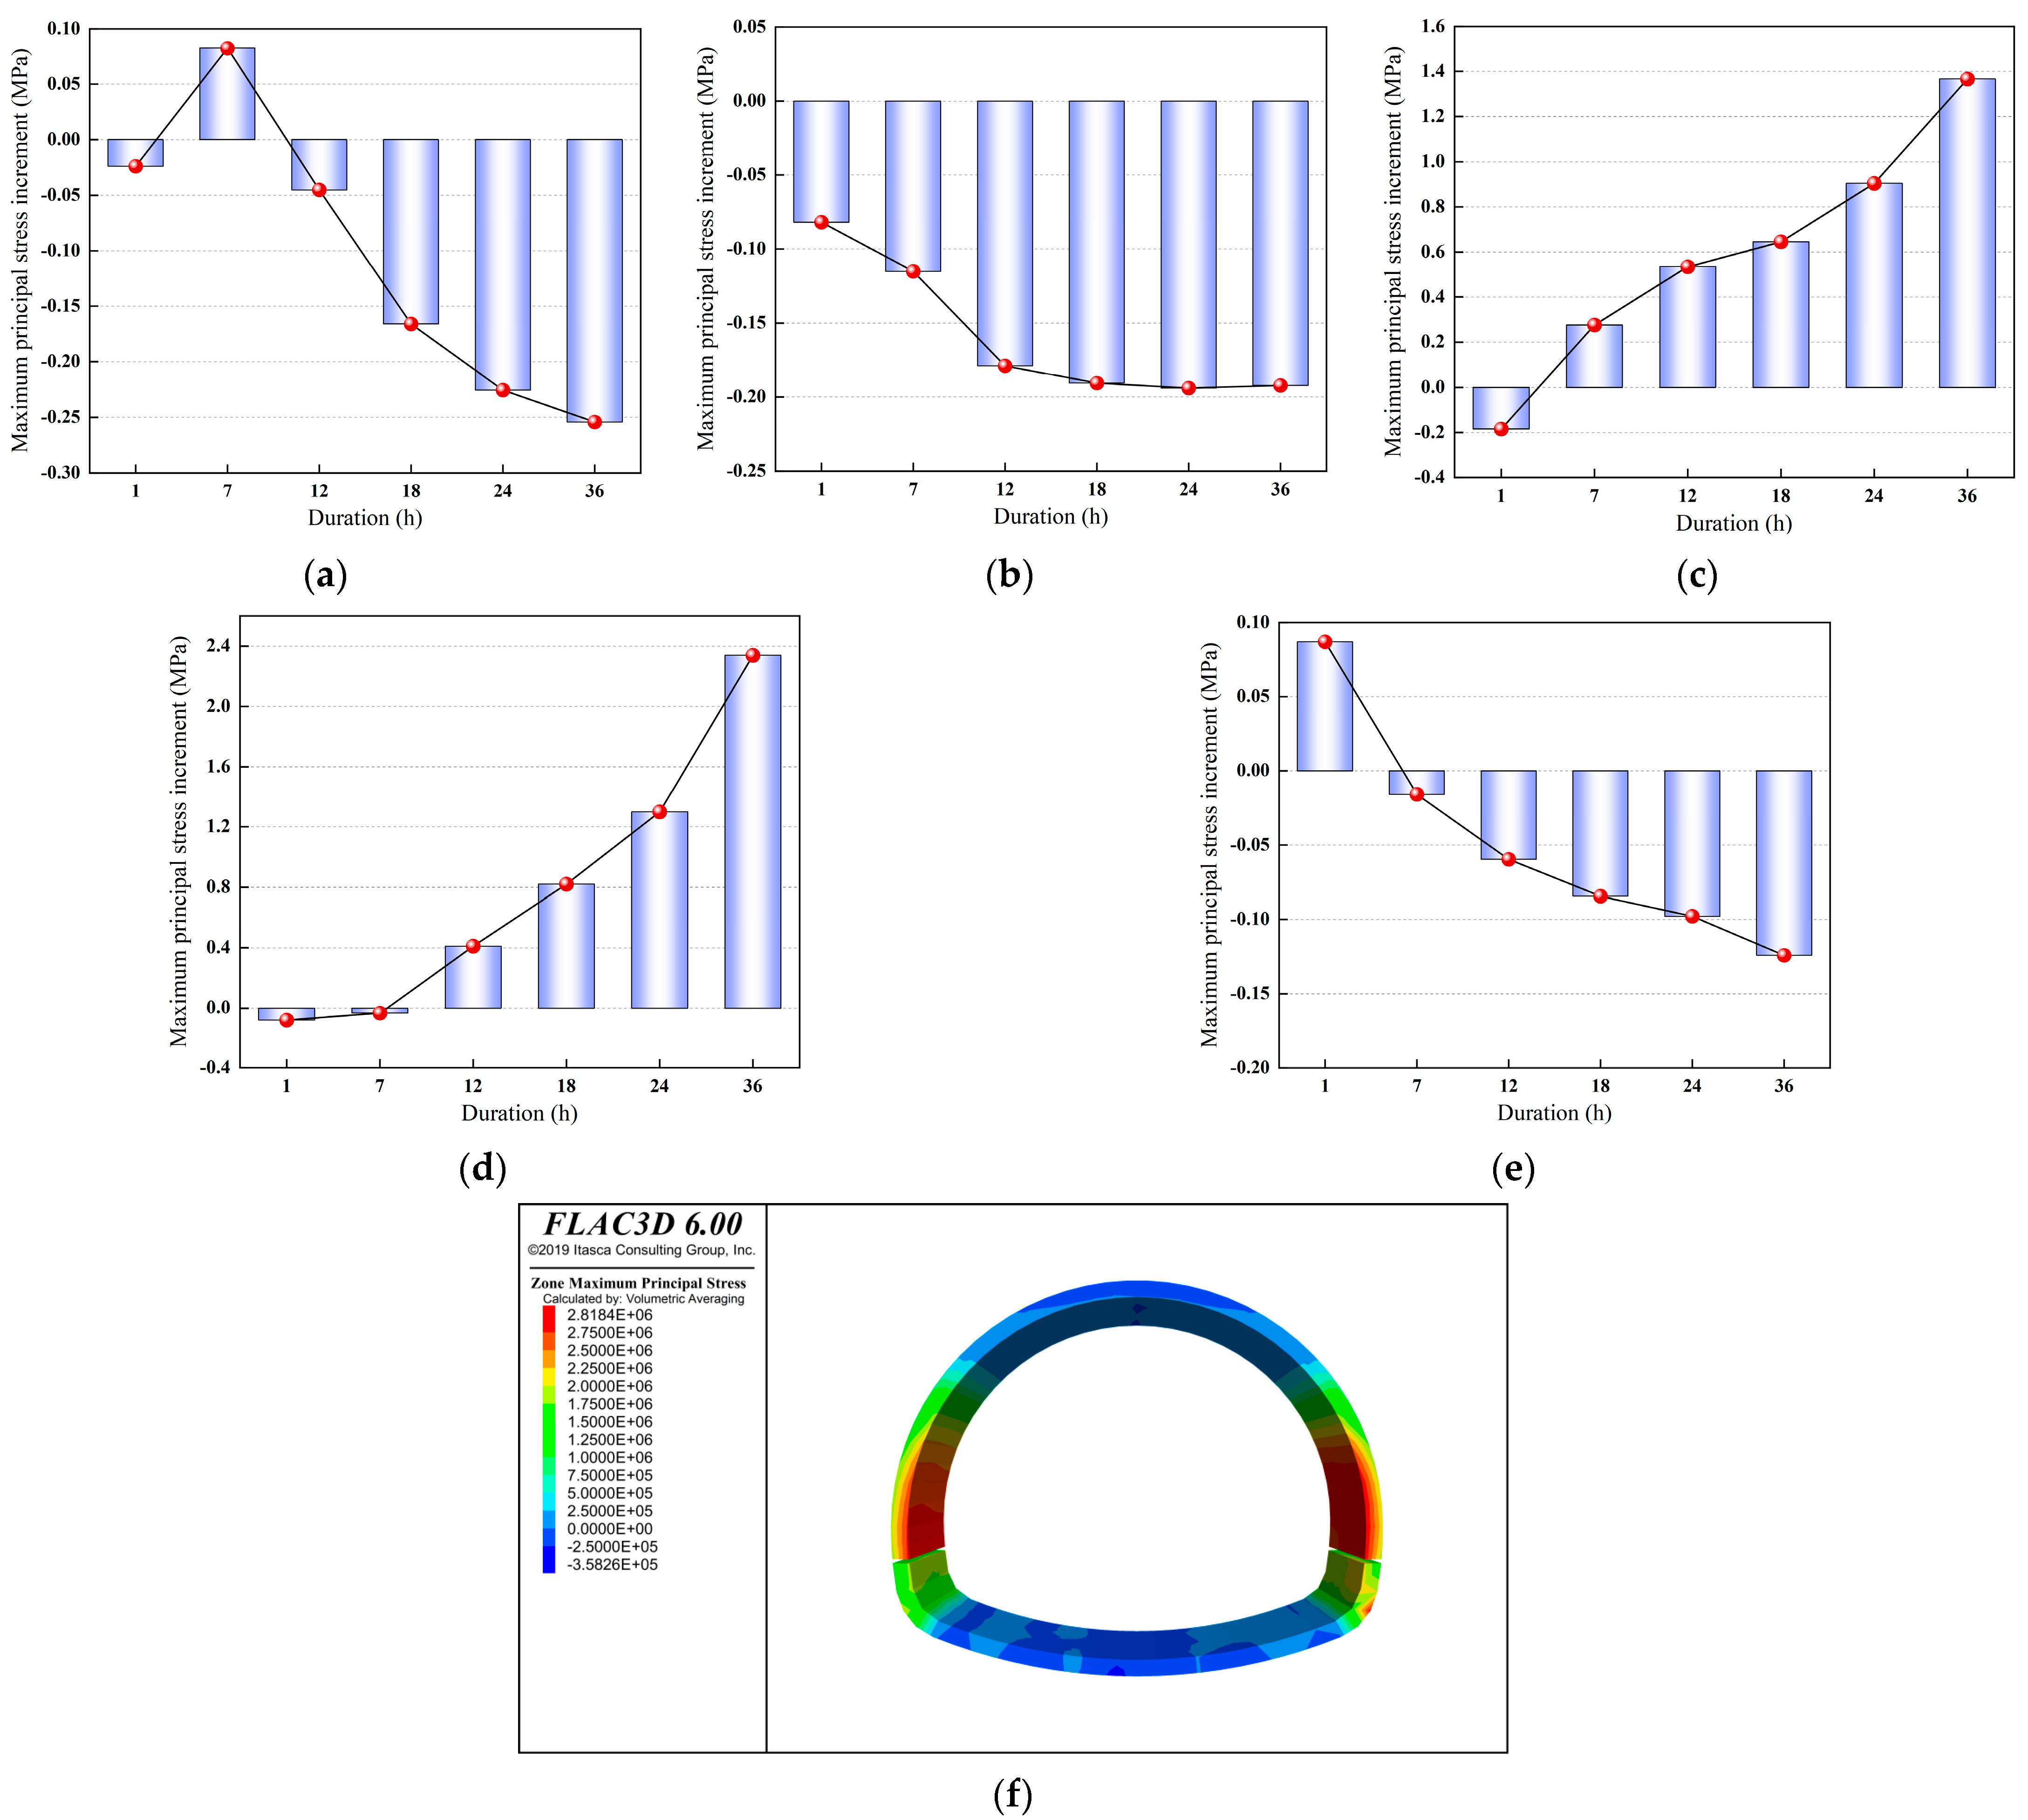
Figure 12a–e show the impact of rainfall duration on the maximum principal stress increment in the tunnel lining. At Monitoring point A, the increment rapidly increases from 0.02 Mpa to a peak value of 0.08 Mpa within the first 7 h, and then gradually decreases, indicating that the tensile stress at Monitoring point A follows a trend of first increasing and then decreasing. The increment shows a “rapid decrease-stabilization” fluctuation pattern, remaining negative, which indicates that the tensile stress at Monitoring point B gradually decreases and then stabilizes. At Monitoring points C and D, the maximum principal stress increment generally exhibits a nonlinear increase. During the initial stage of rainfall, there is a brief negative increment phase (tensile stress decreases), but in the 7 h to 36 h positive increment phase, the maximum increment values reach 1.36 Mpa (corresponding to a tensile stress of 2.03 Mpa) and 2.34 Mpa (corresponding to a tensile stress of 2.63 Mpa), respectively. These peak values far exceed the tensile strength design value of 2.01 Mpa for C30 concrete, indicating a serious risk of cracking in the crown foot and sidewall areas corresponding to Monitoring points C and D. This is due to prolonged seepage, which causes continuous softening of the surrounding rock, increasing the proportion of the load borne by the lining, and accelerating the accumulation of tensile stress. At Monitoring point E, the increment gradually decreases. Within 1 h of rainfall, the compressive stress increases and then transitions to tensile stress. After 7 h, the tensile stress decreases and switches to compressive stress, and then the compressive stress gradually increases. Prolonged rainfall leads to high tensile stress in the crown foot and sidewall areas, significantly increasing the risk of cracking. It is recommended to inject grout to reinforce the surrounding rock at the crown foot and add a steel-fiber concrete surface layer to the sidewalls to improve the integrity of the surrounding rock and the lining’s crack resistance.
Figure 12.
Impact of Rainfall Duration on the Maximum Principal Stress Increment at Each Monitoring Point and the Principal Stress Contour Map. (a) measuring point A, (b) measuring point B, (c) measuring point C, (d) measuring point D, (e) measuring point E. (f) Maximum Principal Stress Contour Map.
The simulation results of the maximum principal stress increment in the tunnel lining under different rainfall durations are highly consistent with the stress evolution patterns observed in the field monitoring data shown in Figure 4. Both the simulation and field monitoring validate the directional differential impact of rainfall infiltration on tunnel lining stress and the cumulative effect of rainfall duration. Field monitoring shows that fluctuates significantly: the peak value at Monitoring point 2 reaches 3.5 Mpa, while Monitoring point 4 stabilizes around 2.5 Mpa, with a maximum increment of 0.53–0.55 Mpa during the same period. At Monitoring points C and D, the stress increases non-linearly, ending the negative increment phase after 7 h. The maximum increment within 36 h reaches 1.36–2.34 Mpa, corresponding to tensile stress exceeding the tensile strength of C30 concrete (2.01 Mpa), which replicates the dramatic response of and the risk of cracking. The critical stress evolution node at 7 h captured by the simulation aligns with the stress mutation triggered by 14 h of rainfall in the field, further confirming the seepage lag effect. Together, these results support the engineering recommendation of “grouting reinforcement at the crown foot and adding a steel-fiber concrete surface layer to the sidewalls.”
Figure 12f shows the maximum principal stress contour map of the secondary lining after 36 h of rainfall. The peak maximum principal stress across the full section is 2.81 Mpa (tensile stress), higher than the preset value of 2.63 Mpa at Monitoring point D, further revealing the spatial distribution characteristics and potential risks of tensile stress. The high tensile stress zone, with a peak value of 2.81 Mpa, is concentrated in the upper-middle region of the sidewall (at approximately 2/3 of the height from the bottom of the sidewall), where no monitoring points were preset. Additionally, high tensile stress (≥2.0 Mpa, close to the tensile strength standard of 2.01 Mpa for C30 concrete) shows a “vertical band” distribution, extending from the bottom of the sidewall upward to the middle-upper part of the sidewall, covering about 80% of the sidewall height. This coverage far exceeds the monitoring range of the preset points C (foot of the arch) and D (middle-lower part of the sidewall). There is a significant stress gradient toward the crown foot direction in the high tensile stress zone, creating a “stress communication band” between the crown foot and the sidewall high-stress zone. This may lead to cracking propagating from the high-stress zone in the sidewall toward the crown foot, forming a through crack. Based on the predicted failure characteristics, it is recommended that the high-stress area in the upper-middle part of the sidewall be reinforced with a “steel fiber concrete + longitudinal steel bars” combination to block the vertical cracking path caused by high tensile stress.
- (2)
- Minimum Principal Stress Analysis
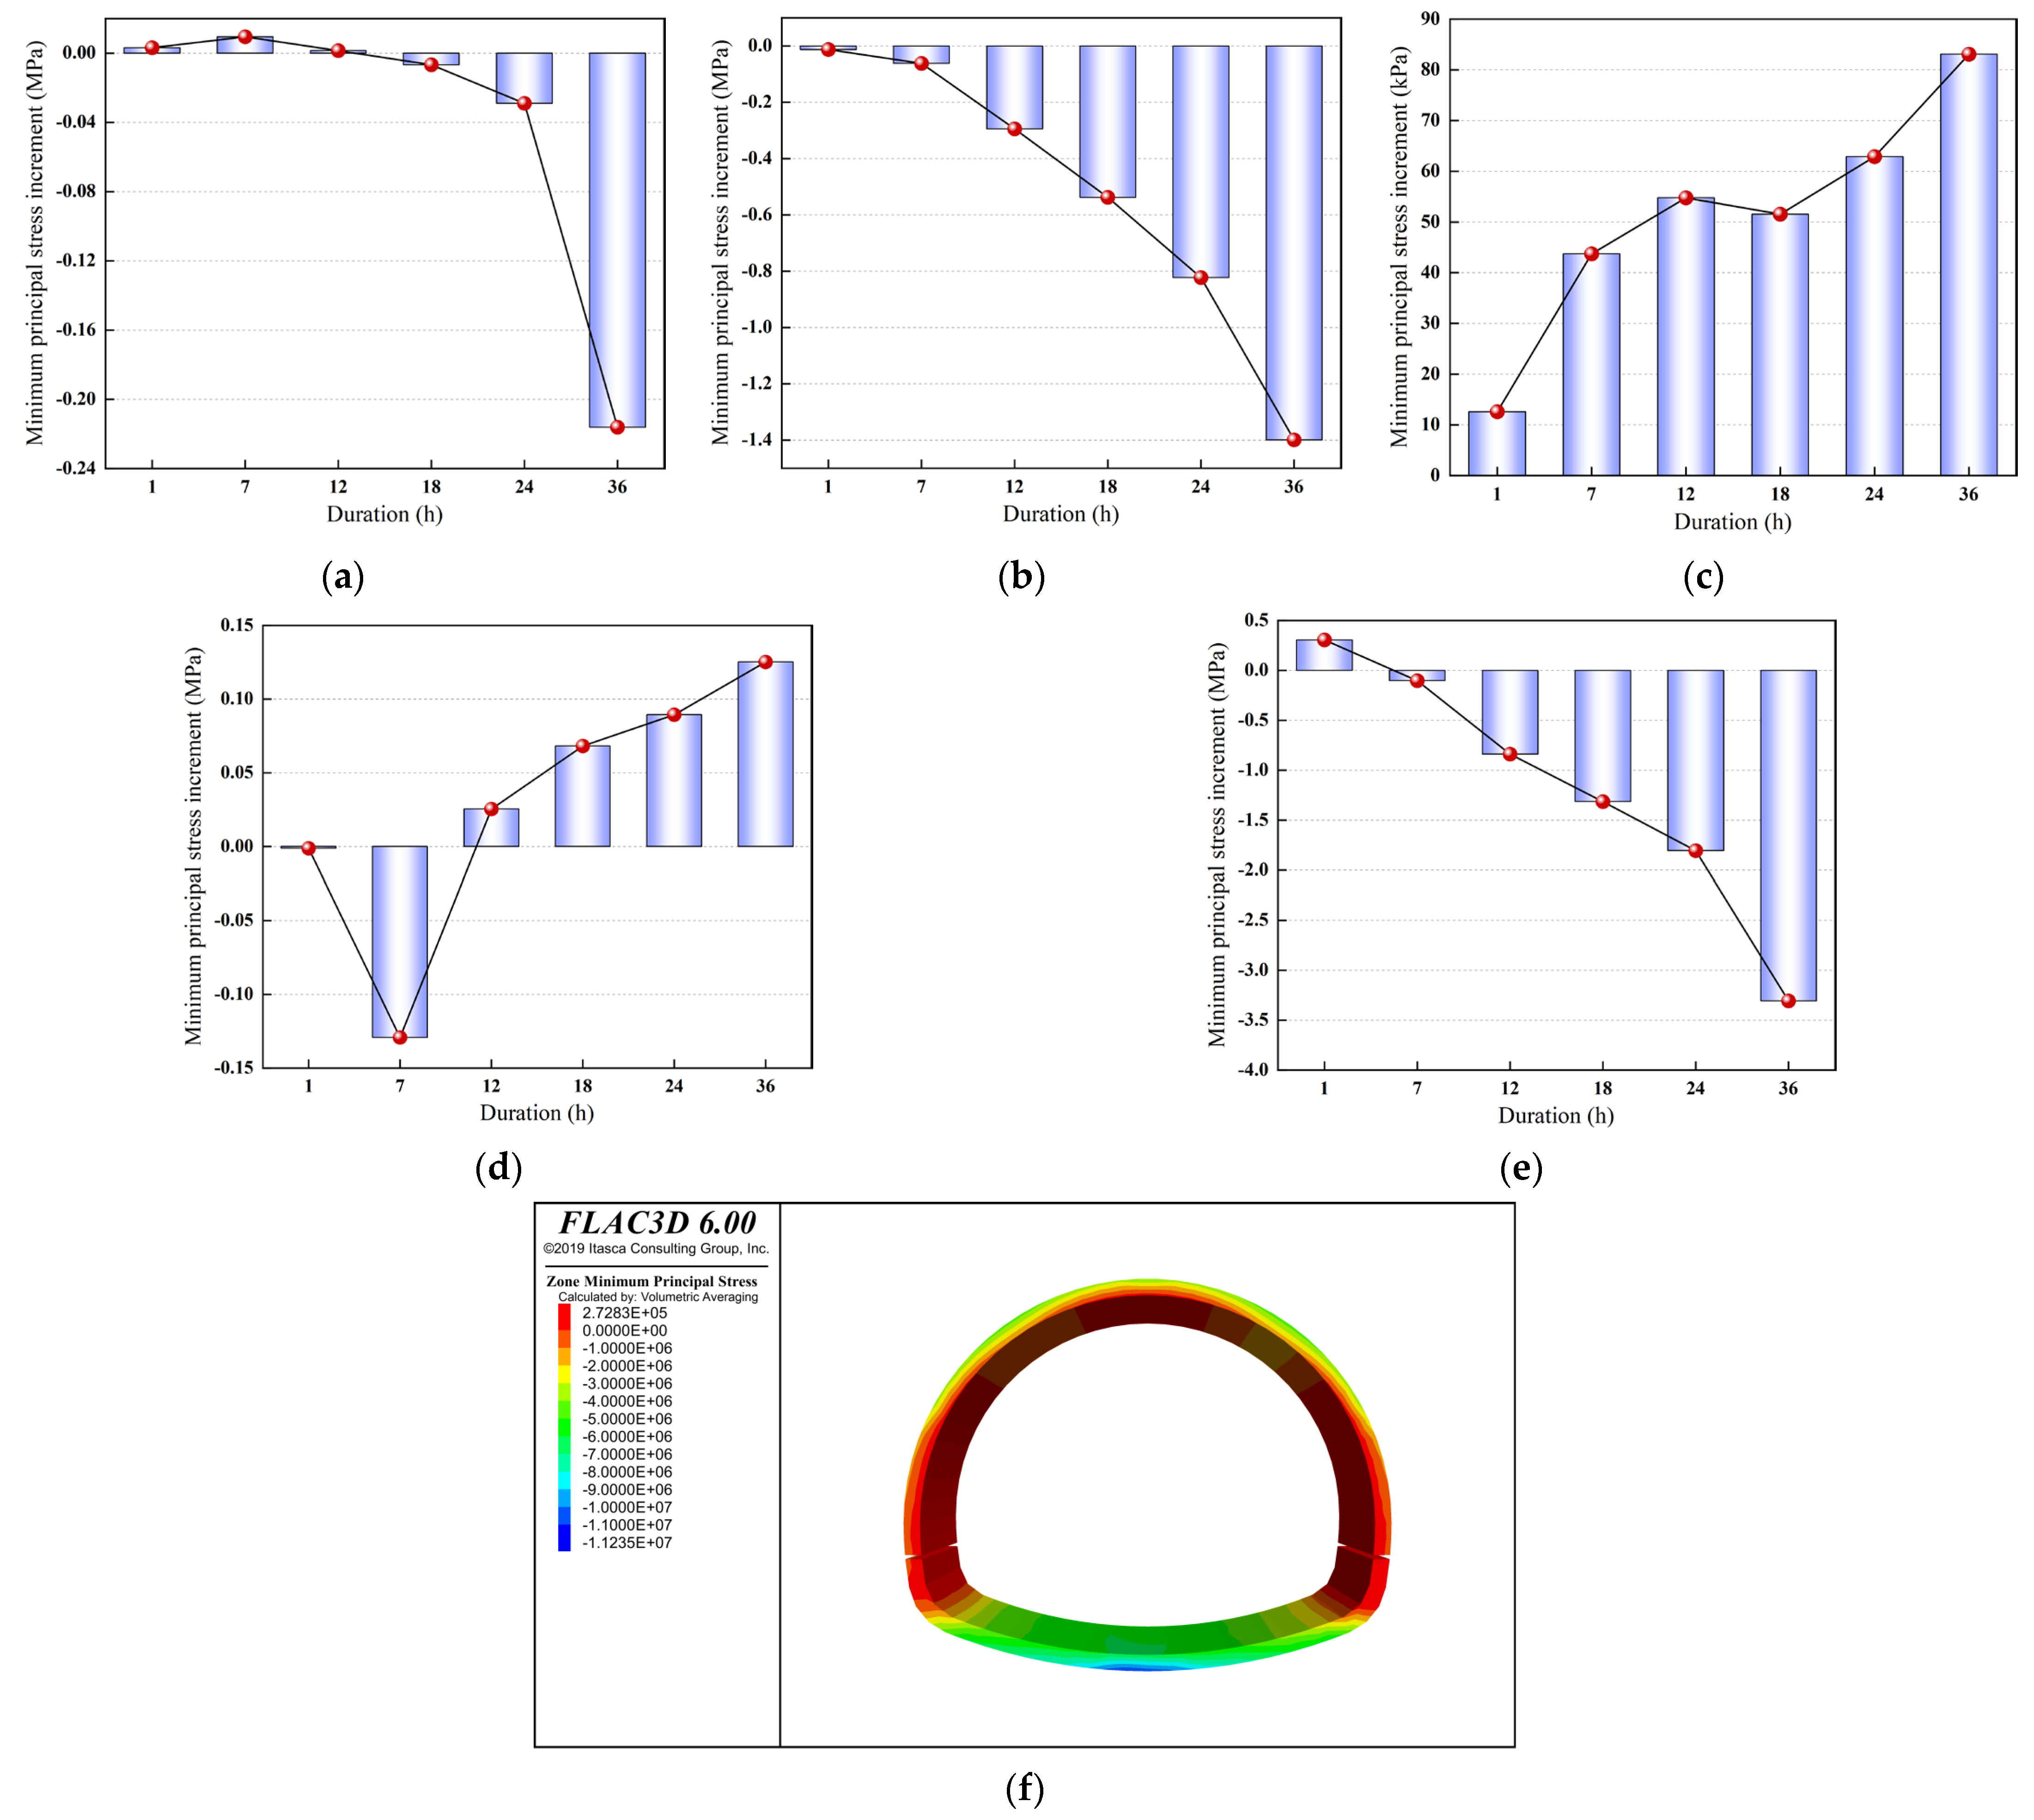
Figure 13a–e show the impact of rainfall duration on the minimum principal stress increment in the tunnel lining. At Monitoring point A, the minimum principal stress increment first increases briefly and then drops sharply, showing that tensile stress increases to a peak before gradually decreasing and transforming into compressive stress after about 18 h. The increment at Monitoring point B shows a nonlinear decreasing trend, indicating that compressive stress gradually increases. The maximum increment is 1.4 Mpa (corresponding to compressive stress of 1.43 Mpa), which has minimal impact on the structure. At Monitoring point C, the increment gradually rises, with tensile stress continuing to increase. At Monitoring point D, the increment decreases briefly and then gradually increases, with compressive stress first increasing and then decreasing. The changes at Monitoring points C and D are both small, and their impact is limited. At Monitoring point E, the increment gradually decreases, with compressive stress decreasing in the first 7 h and then gradually increasing after 7 h. The maximum increment reaches 3.31 Mpa (corresponding to compressive stress of 6.3 Mpa). Compared to the design compressive strength value of 14.3 Mpa for C30 concrete, 6.3 Mpa is far below this value; so, there is no risk of crushing. The 7 h mark may be the critical duration for base softening, where prolonged soaking causes a significant reduction in the elastic modulus of the base soil, and the load continues to transfer to the lining. Prolonged rainfall significantly increases compressive stress in the crown arch area. It is recommended to activate emergency drainage pumps during heavy rainfall to control the base softening process and reduce stress accumulation.
Figure 13.
Impact of Rainfall Duration on the Minimum Principal Stress Increment at Each Monitoring Point and the Minimum Principal Stress Contour Map. Each monitoring point is (a) measuring point A, (b) measuring point B, (c) measuring point C, (d) measuring point D, (e) measuring point E, (f) minimum principal stress contour map.
Figure 13f shows the minimum principal stress contour map of the secondary lining after 36 h of rainfall. The peak minimum principal stress across the full section is 11.23 Mpa (compressive stress, with the negative sign indicating compressive stress direction), significantly higher than the preset value of 6.3 Mpa at Monitoring point E. The spatial distribution of this stress provides new insights for compressive stress risk prevention. The high compressive stress zone, with a peak value of 11.23 Mpa (78% of the design value), is concentrated on the inner side of the crown arch center (an initial unmonitored blind spot; the initial monitoring only covered the outer side of the crown arch center at Monitoring point E).This high-stress zone exhibits a “diffusion” pattern, with compressive stress at the inner side of the crown arch center consistently ranging from 9 Mpa to 11.23 Mpa, forming a “high-pressure core zone at the inner side of the crown arch center.” Although the current stress has not exceeded the design value, the high stress gradient may lead to microcracks within the concrete (especially under humidity variations caused by water infiltration). Over time, these microcracks could develop into macrocracks, weakening the overall bearing capacity of the lining. To mitigate the long-term risk of high-stress degradation, a crushed stone blind drainage trench is added along the high-stress band (compressive stress ≥ 8.0 Mpa) on the side of the crown arch center near the sidewall. This helps accelerate the drainage of base water and reduces the accumulation of water-induced compressive stress.
4.2.2. Effects of Rainfall Duration on Displacements of Secondary Linings
Figure 14a–e show the impact of rainfall duration on the displacement increment in the tunnel lining. As the duration of rainfall increases, the overall displacement increment in the lining increases significantly, and the deformation gradually intensifies. At Monitoring points A and B, the displacement increases sharply within the first 7 h of rainfall, then rises slowly from 7 h to 24 h, showing an overall “sharp increase-slow increase-sharp increase” trend, indicating that the stability of this area is relatively good. At Monitoring points C and D, the displacement increment increases with the duration of rainfall, reaching maximum values of 2.79 mm (corresponding to a displacement of 3.12 mm) at 36 h for point C, and 3.94 mm (corresponding to a displacement of 4.45 mm) for point D. At Monitoring point E, the displacement increment remains stable in the first 7 h, then increases significantly, with the maximum increment reaching 8.47 mm (corresponding to a displacement of 8.61 mm). The duration of rainfall has a significant impact on the stability of the crown foot, sidewall, and invert areas, with the deformation in the invert area being the most prominent. This may be related to the positive feedback mechanism formed by buoyancy and the compression of the softened soil. It is recommended to use lightweight concrete for the invert to reduce its self-weight and suppress the acceleration of deformation. When the displacement rate exceeds 1 mm/h (as seen in the sharp increase stage after 7 h), or when compressive stress approaches 10 Mpa (the safety reserve warning line), emergency drainage pumps should be activated to control the water level, and heavy traffic should be temporarily restricted.
Figure 14.
The influence of rainfall duration on the displacement increment in each monitoring point. Each monitoring point is (a) measuring point A, (b) measuring point B, (c) measuring point C, (d) measuring point D, (e) measuring point E.
5. Effects of Permeability Changes in Loosened Zones on Mechanical State of Tunnel Linings
The loosened zone refers to the area where the surrounding rock undergoes physical and mechanical property changes due to cracks, displacement, or deformation caused by excavation, rainfall, or other external factors during tunnel excavation. As the tunnel is constructed or under the influence of external loads, some areas of the surrounding rock become loosened, forming the loosened zone []. The thickness, permeability, and other properties of the loosened zone directly affect the stability of the tunnel lining. Therefore, the study of the loosened zone in tunnel engineering is crucial for assessing the behavior of tunnel linings under complex hydrological conditions. To investigate the changes in key parameters such as stress and displacement of the lining structure under the permeability conditions of the loosened zone surrounding rock, a detailed analysis of these key parameters in Table 7 [] is conducted. The aim is to deeply understand the response behavior of the lining structure under extreme rainfall conditions, with the loosened zone permeability coefficient, providing scientific evidence and reliable reference for the design and construction of underground engineering projects.
Table 7.
Condition parameters of permeability coefficient of loosened zones.
5.1. Effects of Permeability Coefficient in Loosened Zones on Stress Response Characteristics of Secondary Linings
- (1)
- Maximum Principal Stress Analysis
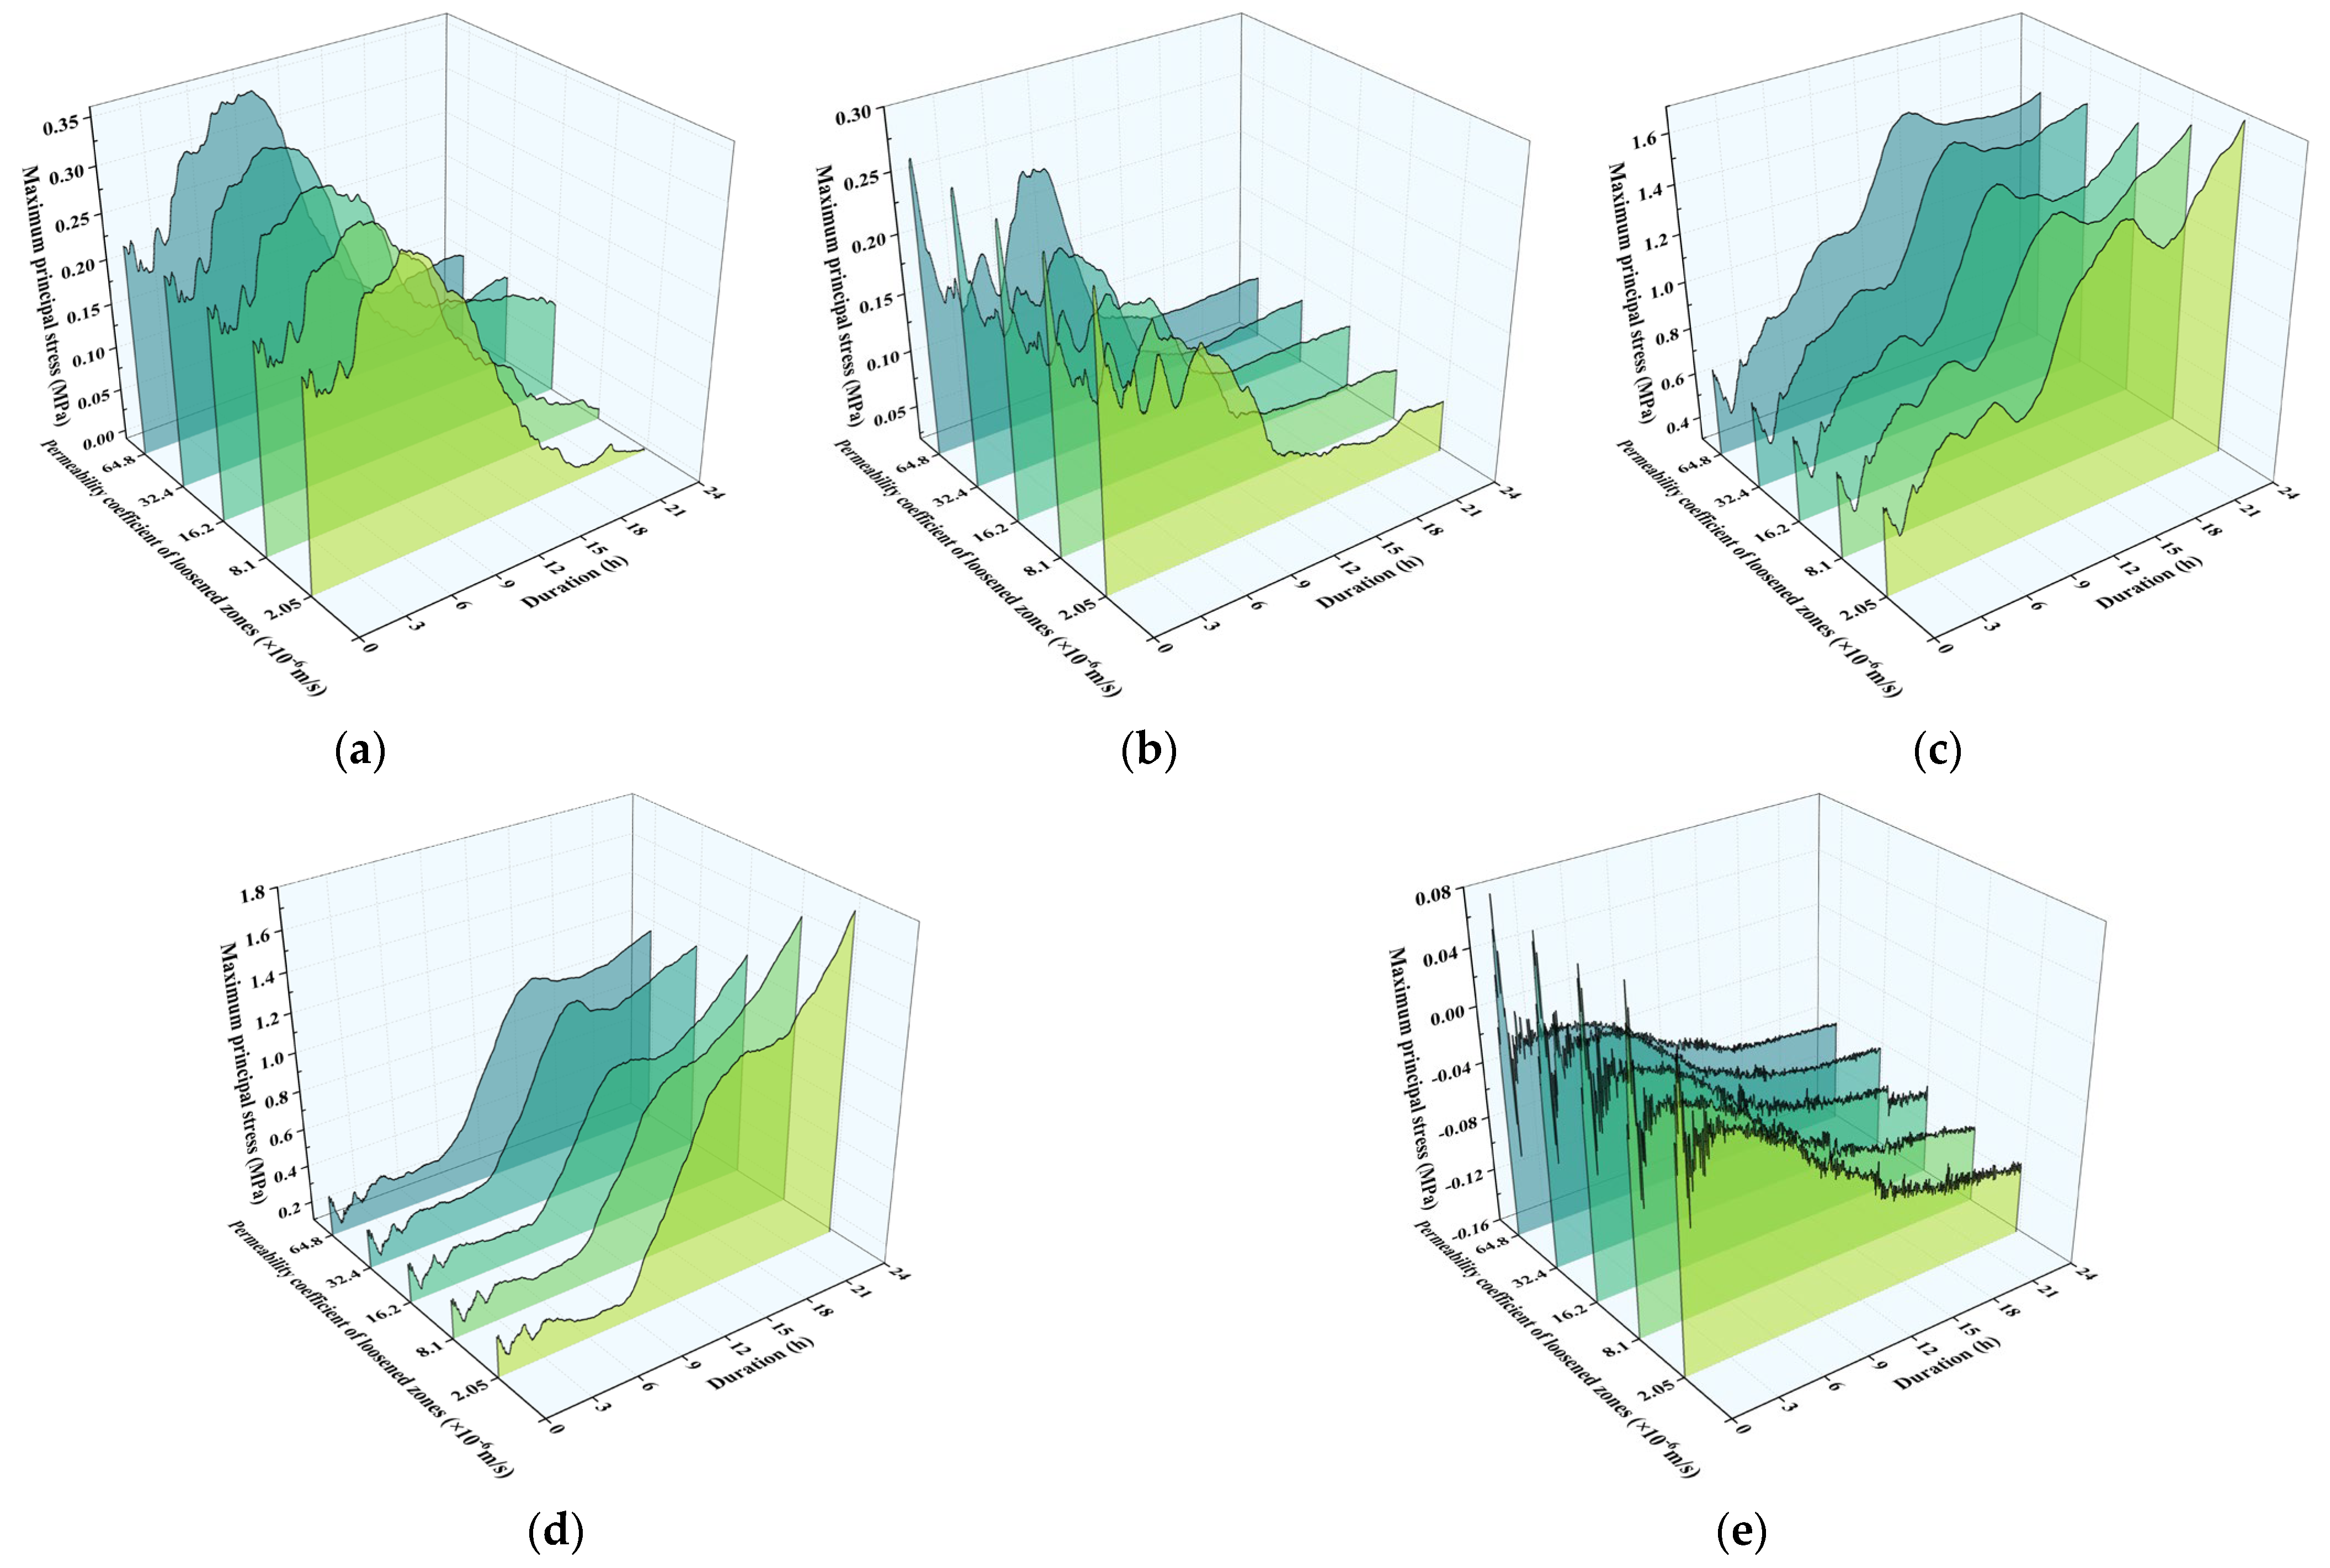
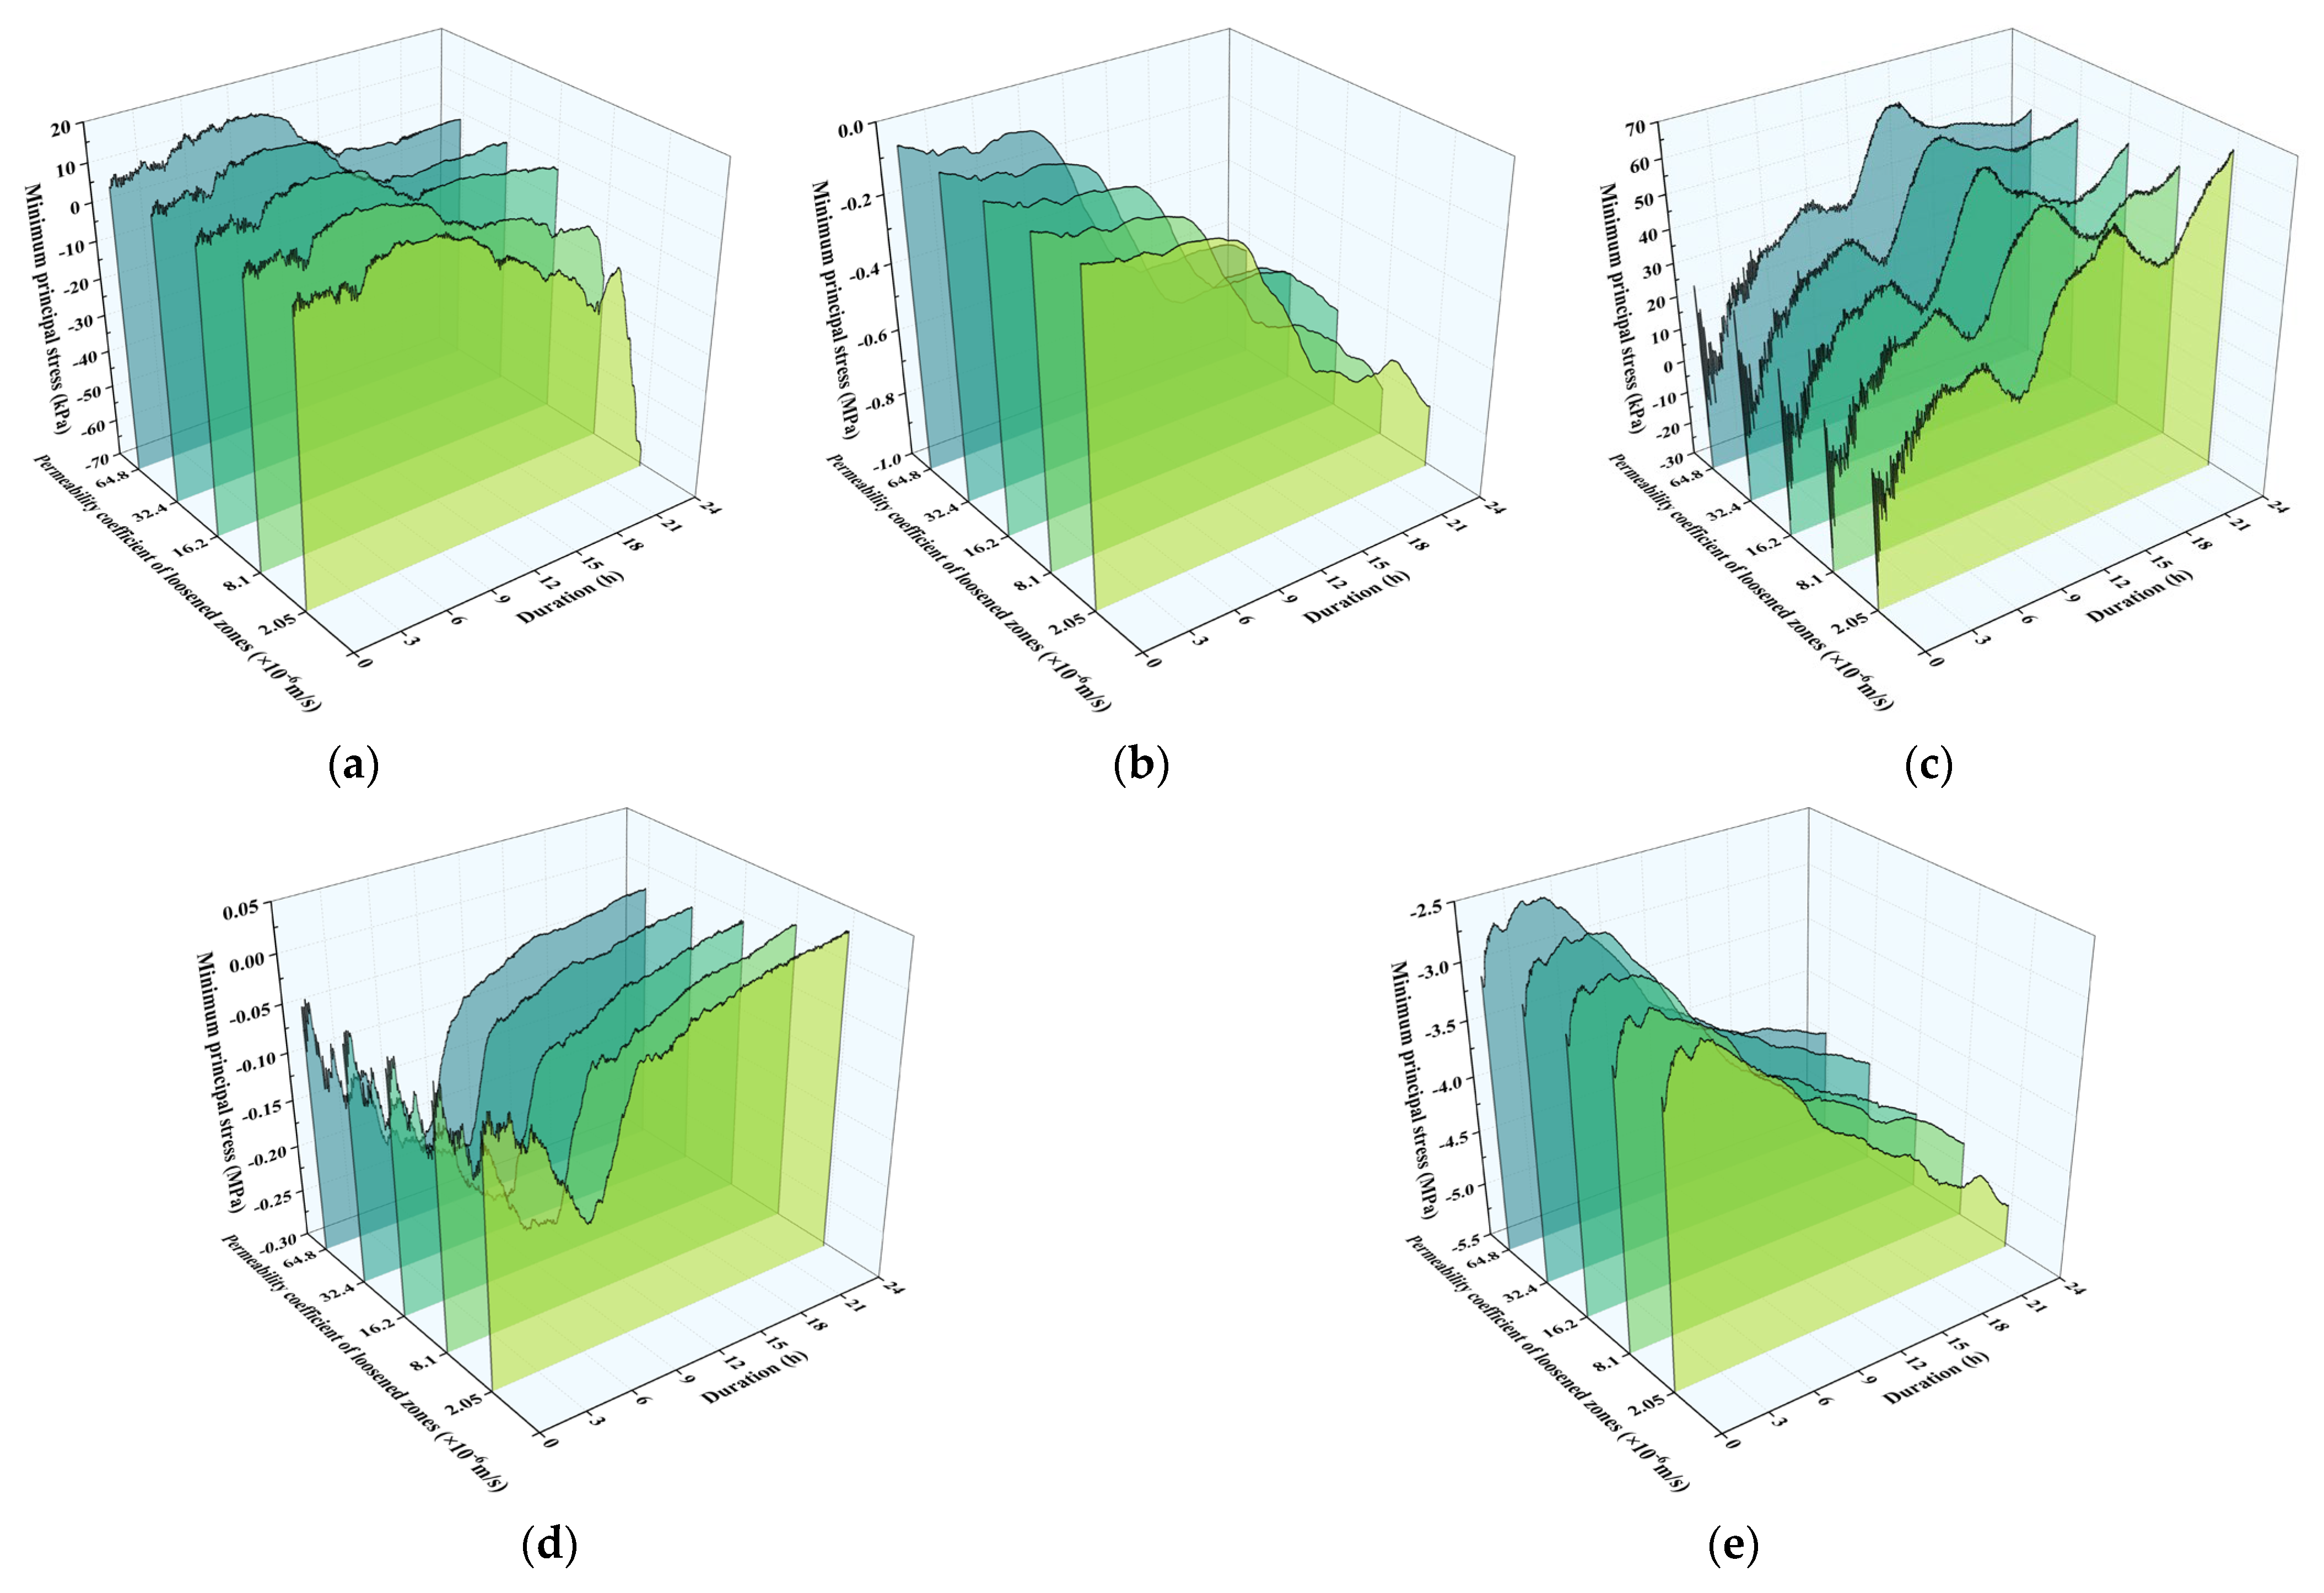
Figure 15a–e show the impact of the permeability coefficient of the loosened zone on the maximum principal stress in the tunnel lining. The maximum principal stress at most monitoring points is predominantly tensile stress, with the exception of the crown arch, which exhibits compressive stress. At Monitoring points A and B, the maximum principal stress rapidly decreases within the first 0–3 h of rainfall, then gradually rises to the peak value within the next 10 h, before decreasing and stabilizing, showing a “sharp increase-sharp decrease” characteristic. The stress at Monitoring point A is more sensitive to changes in the permeability coefficient, with the peak value reaching 0.35 Mpa under high permeability conditions (6.48 × 10⁻⁵ m/s), although the impact is limited. After the rainfall begins, the stress generally increases non-linearly. The maximum principal stress at Monitoring points C and D rises after stabilizing for 9 h. Under high permeability surrounding rock conditions (6.48 × 10⁻⁵ m/s), the stress response at Monitoring points C and D is most significant, with increments of 0.75 Mpa and 0.84 Mpa, respectively, before and after rainfall. Under low permeability surrounding rock conditions (taking 2.05 × 10⁻⁶ m/s as the lower limit of the permeability range in the original text), the baseline stress increments at these two points are 1.0 Mpa and 1.42 Mpa, respectively. Compared to the baseline, the absolute reduction in increments under high permeability conditions is 0.25 Mpa and 0.58 Mpa, with relative reductions of 25% and 41%. As the permeability coefficient of the loosened zone increases, the surrounding seepage dissipates more quickly, leading to a reduction in the size of the high-stress zone, a decrease in stress peak values, and a weakening of the overall fluctuation, especially in the crown foot and sidewall areas. This indicates that the surrounding rock in the lower part of the tunnel is highly sensitive to changes in permeability. The low permeability of the loosened zone significantly increases the tensile stress level in the crown foot and sidewall areas. The trend of stress reduction achieved by increasing the permeability of the surrounding rock aligns with the expected mitigation measure of enhanced drainage to reduce water-induced stresses in the tunnel. This demonstrates that the core objective of enhanced drainage is to accelerate seepage dissipation and weaken the cumulative effect of water pressure on structural stress.
Figure 15.
The influence of different permeability coefficient of loosened zones on the maximum principal stress of each monitoring point. Each monitoring point is (a) measuring point A, (b) measuring point B, (c) measuring point C, (d) measuring point D, (e) measuring point E.
- (2)
- Minimum Principal Stress Analysis
Figure 16a–e show the impact of the permeability coefficient of the loosened zone on the minimum principal stress in the tunnel lining. The minimum principal stress at most monitoring points is predominantly compressive stress. At Monitoring point A, the stress decreases slowly within the first 12 h of rainfall, then rises to a peak value, while at Monitoring point B, the stress decreases slowly and then drops sharply, transitioning from tensile stress to compressive stress. The variation in minimum principal stress is relatively insensitive to changes in the permeability coefficient. At Monitoring points C and D, the minimum principal stress shows a nonlinear increase, transitioning from compressive stress to tensile stress. The change is relatively more significant under low permeability conditions, but the increment is small, with minimal impact on the lining structure. The stress exhibits a nonlinear decreasing trend, with compressive stress gradually increasing. Under high permeability conditions (6.48 × 10⁻⁵ m/s), Monitoring point E shows the most significant response in minimum principal stress at the 24 h mark, with a stress increment of 1.45 Mpa before and after rainfall. Compared to the low permeability surrounding rock, the decrement in the increment reaches 31%. This is due to the high seepage reducing the hydraulic gradient and lowering the uplift pressure at the base. Enhancing the drainage capacity at the tunnel’s base can reduce the concentration of compressive stress.
Figure 16.
The influence of different permeability coefficient of loosened zones on the minimum principal stress of each monitoring point. Each monitoring point is (a) measuring point A, (b) measuring point B, (c) measuring point C, (d) measuring point D, (e) measuring point E.
5.2. Effects of Permeability Coefficients in Loosened Zones on Displacements of Secondary Linings
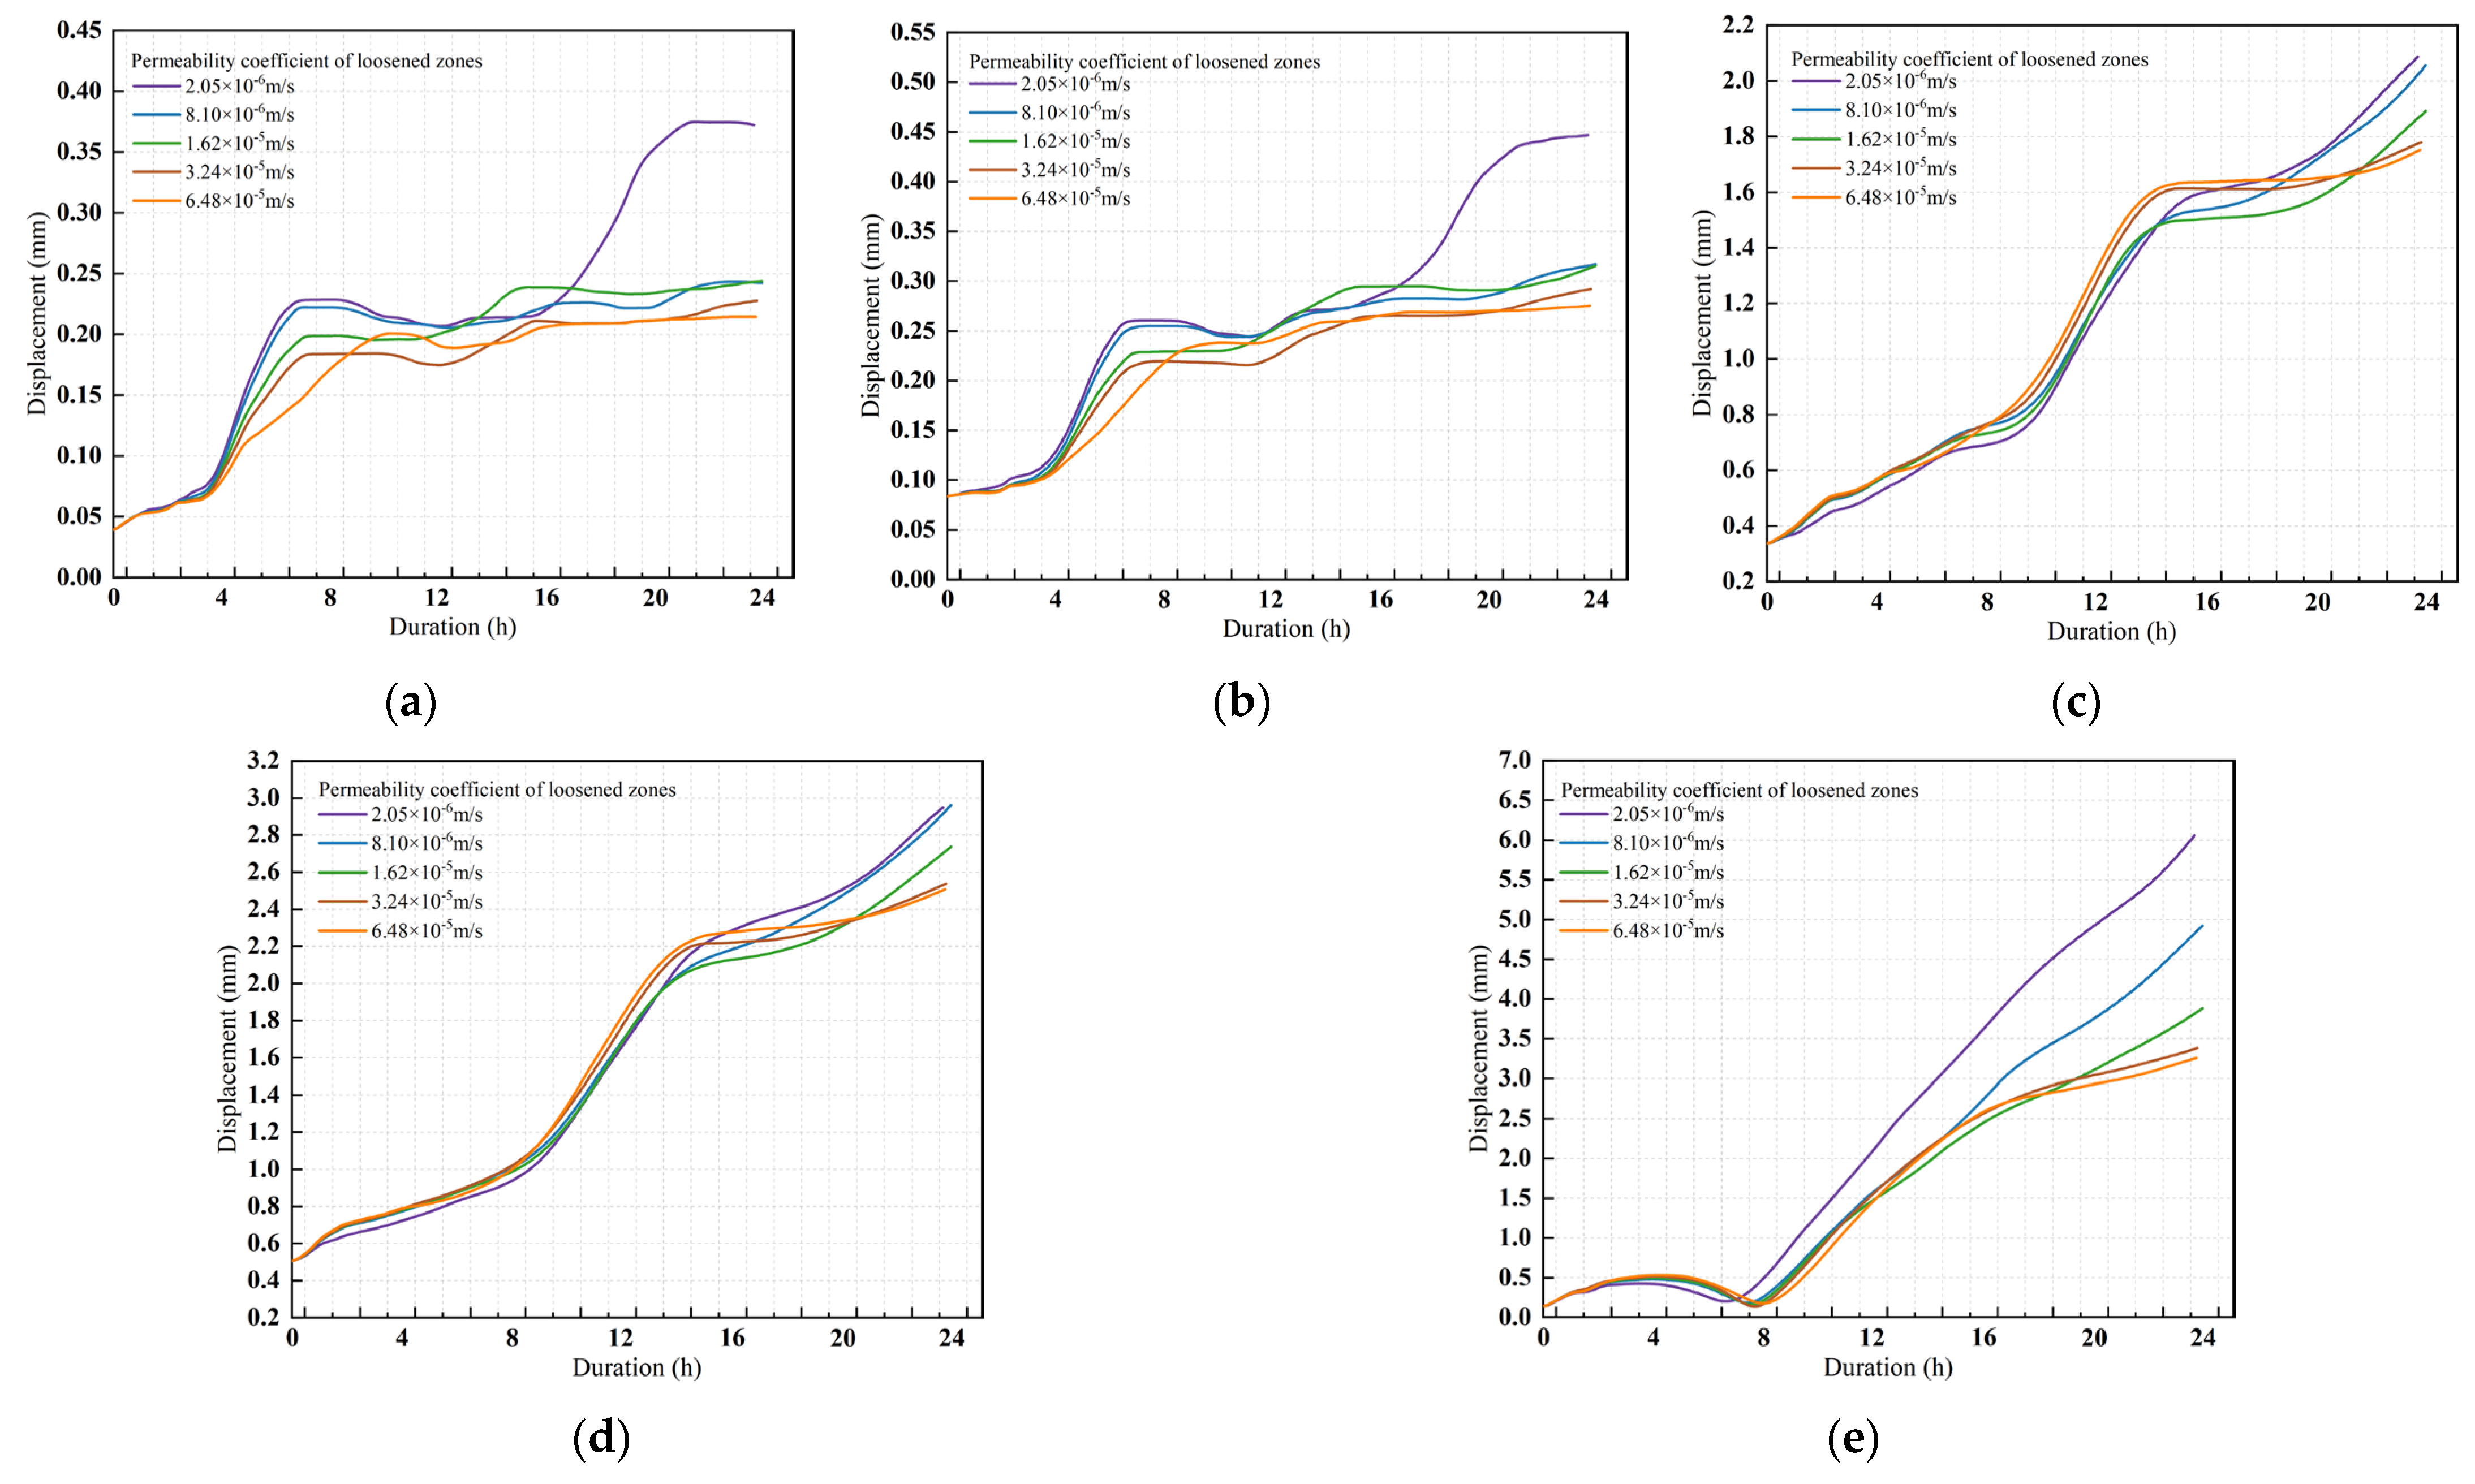
Figure 17a–e show the displacement time-history variations at typical tunnel locations under different permeability coefficients of the loosened zone. When the permeability coefficient ranges from 8.1 × 10⁻⁶ to 6.48 × 10⁻⁵ m/s, the displacement at Monitoring points A and B rapidly increases in the early stage of rainfall and then gradually stabilizes, showing a “rapid increase-slow increase” characteristic. Under low permeability conditions (2.05 × 10⁻⁶ m/s), the displacement shows a sudden increase during the stable phase corresponding to other permeability coefficients, but the maximum value only reaches 0.45 mm, indicating minimal impact. At Monitoring points C, D, and E, the displacement shows nonlinear growth under all permeability coefficients. Under high permeability conditions (6.48 × 10⁻⁵ m/s), the displacement at Monitoring points D and E is most significant at the 24 h mark, with increments of 2 mm and 3.12 mm before and after rainfall, respectively. Compared to low permeability surrounding rock, the decrement in the increment is 18% and 33%, indicating that the bottom structure responds most strongly to changes in the permeability of the surrounding rock. This suggests that high permeability allows rainwater to quickly infiltrate the surrounding rock, preventing the formation of significant pore water pressure differences. This effectively reduces the hydraulic gradient and minimizes the lateral pushing force on the lining. Additionally, it prevents a sudden rise in the groundwater level, reducing the concentrated effect of uplift pressure on the base, thereby reducing displacement. As the permeability of the surrounding rock increases, the displacement growth trend significantly slows, indicating that high permeability surrounding rock helps alleviate water pressure accumulation and reduces the rate of structural deformation.
Figure 17.
The influence of different permeability coefficient of displacement on the minimum principal stress of each monitoring point. Each monitoring point is (a) measuring point A, (b) measuring point B, (c) measuring point C, (d) measuring point D, (e) measuring point E.
6. Conclusions
This study aims to investigate the evolution of the mechanical behavior of mountain tunnel linings under the influence of heavy rainfall. Through field monitoring and numerical simulation, a three-dimensional fluid-solid coupling model is constructed to systematically analyze the impact of rainfall conditions and the loosened zone surrounding rock on the response characteristics of the lining structure. The main conclusions are as follows:
- (1)
- Field monitoring results show that heavy rainfall has a significant impact on the mechanical response of mountain tunnel lining structures. During the monitoring period, rainfall was recorded on 155 days, with the maximum single-day rainfall reaching 118.8 mm, lasting for 15 h. The maximum single-day drainage volume reached 120.95 m3. Under rainstorm conditions, the maximum increment in tensile stress in the lining was 0.55 MPa, exhibiting a stress mutation characteristic, while the tensile stress remained relatively stable. Rainfall of this magnitude can easily induce local stress concentration, which may lead to lining cracking. During the model validation process, the observed stress increment was reproduced within a 10% error margin.
- (2)
- Based on the monitoring data from this study and the results of the three-dimensional fluid-solid coupling model, heavy rainfall intensity and duration significantly cause the redistribution of stress and concentration of displacement in the tunnel lining, which are core factors leading to a reduction in structural stability. When the rainfall intensity is 1.11 × 10⁻⁵ m/s, the peak maximum principal stress at the sidewall monitoring point reaches 1.58 MPa (tensile stress, with a net increment of 1.3 MPa). As the rainfall duration increases from 1 h to 36 h, the maximum stress increments at the crown foot and sidewall monitoring points reach 1.36 MPa (corresponding to tensile stress of 2.03 MPa) and 2.34 MPa (corresponding to tensile stress of 2.63 MPa), respectively, while the minimum principal stress increment at the invert monitoring point reaches 3.31 MPa (corresponding to compressive stress of 6.3 MPa).The sidewall and invert areas are the main control zones for displacement response, with the maximum displacement increments at the monitoring points in these areas reaching 3.94 mm (corresponding to displacement of 4.45 mm) and 8.47 mm (corresponding to displacement of 8.61 mm), respectively. Moreover, the maximum principal stress increment at the sidewall exceeds the tensile strength design value of 1.43 MPa for C30 concrete, indicating a significant risk of cracking. Based on these findings, it is recommended to set the rainfall-triggered inspection threshold as follows: single-day rainfall ≥ 80 mm or continuous rainfall ≥ 10 h. Additionally, monitoring frequency should be adjusted to once every 3 days during normal conditions, once every 2 h during heavy rainfall, and once every 6 h within 3 days after rainfall, to promptly capture risks.
- (3)
- The increased permeability has a positive impact on the stability of the surrounding rock-lining system. When the permeability coefficient increases from 2.05 × 10⁻⁶ m/s to 6.48 × 10⁻⁵ m/s, the maximum principal stress increment at the sidewall monitoring point is 0.84 MPa (tensile stress, with a decrement of 41%), and the minimum principal stress increment at the invert monitoring point is 1.45 MPa (compressive stress, with a decrement of 31%). The displacement increment at the invert monitoring point is 3.12 mm (a 33% reduction compared to low permeability surrounding rock). However, under low permeability conditions in the loosened zone, lining stress and deformation are particularly significant, and the risk in local areas increases noticeably. Based on these findings, it is recommended to optimize the design by reducing the sidewall blind drainage spacing from the conventional 5 m to 3–4 m, in order to enhance drainage and increase permeability.
This study has the following limitations: First, the validation relies on data from a single site, limiting the applicability due to regional geological conditions. Second, the Mohr-Coulomb yield criterion is used for surrounding rock behavior, without considering nonlinear deformation under complex stress states. Third, the model lacks a crack evolution module, preventing quantification of crack propagation effects on structural response. Fourth, validation is based on a limited number of rainfall events, insufficient for covering extreme weather. Future research can focus on: (1) incorporating a damage constitutive model and field crack data to improve the damage assessment system; (2) developing a discontinuous medium model with crack networks to better represent the loosened zone’s heterogeneity; (3) extending the monitoring period to include seasonal rainfall and long-term weather effects, enhancing the engineering applicability of the conclusions.
Author Contributions
Conceptualization, K.A. and Z.W.; methodology, K.A. and Z.W.; software, L.L.; validation, X.Z., L.L. and Y.Z. (Yongqi Zhen); formal analysis, Y.Z. (Yongqi Zhen); investigation, Y.Z. (Yongqi Zhen). and X.Z.; resources, L.L.; data curation, L.L.; writing—original draft preparation, K.A.; writing—review and editing, K.A.; visualization, W.M.; supervision, W.M.; project administration, Y.Z. (Yuanfu Zhou); funding acquisition, Y.Z. (Yuanfu Zhou). All authors have read and agreed to the published version of the manuscript.
Funding
This research was funded by Natural Science Foundation of Chongqing, China (Grant No. CSTB2022NSCQ-MSX1515), and the National Natural Science Foundation of China (Grant No. 52308394).
Data Availability Statement
The data presented in this study are available on request from the corresponding author.
Conflicts of Interest
Authors Ke An and Zhenwei Wang are employed by the China Railway Eryuan Engineering Group Co., Ltd. Author Xueyong Zhou is employed by the China Construction Tunnel Corp., Ltd. The remaining authors declare that the research was conducted in the absence of any commercial or financial relationships that could be construed as a potential conflict of interest.
Appendix A. Fluid-Solid Coupling Governing Equations
Appendix A.1. Darcy’s Law
Darcy’s law is used to describe the flow of water in saturated soils and defines the relationship between the flow rate, hydraulic gradient, and permeability coefficient. The formula is:
—flow rate, which refers to the amount of water passing through a unit area per unit of time;
—permeability coefficient, which reflects the soil’s ability to transmit water;
—hydraulic gradient, which represents the rate of change in the water head.
Appendix A.2. Richards Equation
The Richards equation is a partial differential equation used to describe the movement of water in soil, integrating Darcy’s law and the principle of mass conservation. The Richards equation provides a comprehensive description of water movement under both unsaturated and saturated conditions. The equation is expressed as follows:
—soil moisture content;
—permeability coefficient, which varies with soil moisture content;
—pressure head;
—vertical coordinate.
Appendix A.3. Van Genuchten Mode
The following equation is obtained through the relationship between the Van Genuchten model and saturation.
—residual saturation;
—negative pore water pressure;
—fitting parameters.
According to the theory of unsaturated seepage, the permeability coefficient of unsaturated soil changes with soil moisture content (negative pore water pressure or soil saturation). Scholars at home and abroad have derived formulas that describe the relationship between the permeability coefficient of unsaturated soil and negative pore water pressure based on the unsaturated seepage theory. Among them, a formula summarized by Gardner and others has been widely accepted by most scholars. The formula is:
—unsaturated permeability coefficient;
—saturated permeability coefficient of soil;
—pore air pressure;
—pore water pressure;
—absolute value of negative pore water pressure;
—fluid density;
—gravitational acceleration;
,—fitting parameters .
Appendix B. Drainage Volume Conversion Formula
Since only the drainage volume of one drainage ditch was monitored, it is assumed that the drainage volume of each drainage ditch is the same.
—Model value of the drainage volume for a single drainage ditch;
—Monitoring value of the drainage volume for a single drainage ditch;
—Total number of drainage ditches;
—Total tunnel length.
References
- Lu, F.; Wang, Y.; Fu, J.; Yang, Y.; Qiu, W.; Jing, Y.; Jiang, M.; Li, H. Safety Evaluation of Plain Concrete Lining Considering Deterioration and Aerodynamic Effects. Sustainability 2023, 15, 7170. [Google Scholar] [CrossRef]
- Tang, K.; Liu, D.; Xie, S.; Qiu, J.; Lai, J.; Liu, T.; Fang, Y. Analysis of Loess Water Migration Regularity and Failure Response of Tunnel Structure under Rainfall Environment. Bull. Eng. Geol. Environ. 2024, 83, 6. [Google Scholar] [CrossRef]
- Luo, Y.; Yang, J.; Xie, Y.; Fu, J.; Zhang, C. Investigation on Evolution Mechanism and Treatment of Invert Damage in Operating Railway Tunnels under Heavy Rainfall. Bull. Eng. Geol. Environ. 2024, 83, 160. [Google Scholar] [CrossRef]
- Zou, L.; Tang, M.; Li, B. Bingham and Herschel-Bulkley Fluids Flow Regimes in Rough-Walled Rock Fractures. Int. J. Rock Mech. Min. Sci. 2024, 180, 105832. [Google Scholar] [CrossRef]
- Zhang, Z.; Wang, S.; Yin, H.; Yang, T.; Wang, P. Fracture Seepage and the Temperature Field Distribution of Rocks Surrounding High-Temperature Tunnels: A Numerical Analysis. Geomech. Geophys. Geo-Energy Geo-Resour. 2022, 8, 112. [Google Scholar] [CrossRef]
- Zhang, Z.; Yang, Z. Research on the Stress Characteristic of Cracked Lining in Operating Tunnel under the Action of Fluid-Structure Interaction. Mod. Eng. Technol. Res. 2025, 10, 15–17. [Google Scholar]
- Tang, K.; Qiu, J.; Lai, J.; Xue, F.; Wang, Z.; Li, X. Experimental Investigation on Deformation-Failure Mechanisms of a Shallow-Bias Large-Section Loess Tunnel Induced by Rainfall. Tunn. Undergr. Space Technol. 2025, 157, 106253. [Google Scholar] [CrossRef]
- An, P.T.; Li, S. Analysis of the Influence Characteristics of Hidden Karst Cavities on Water Gushing in Tunnels Under Heavy Rainfall Conditions. Carbonates Evaporites 2025, 40, 85. [Google Scholar] [CrossRef]
- Tang, W.; Kong, X.; Tang, L.; Ling, X.; Yao, C. Experimental Investigation of Erosion Damage and Bearing Performance of 3D-Modeled High-Precision Segment Models under Salt-Load Coupling Effects. Constr. Build. Mater. 2025, 49, 142985. [Google Scholar] [CrossRef]
- Tian, X.; Song, Z.; Wang, H.; Zhang, Y.; Wang, J. Evolution Characteristics of the Surrounding Rock Pressure and Construction Techniques: A Case Study from Taoshuping Tunnel. Tunn. Undergr. Space Technol. Inc. Trenchless Technol. Res. 2022, 125, 104522. [Google Scholar] [CrossRef]
- Chang, Z.; Yan, C.; Yin, P.; Lan, H.; Bao, H.; Zhang, J.; Lu, Z. Case Study on Hydro-Mechanical Behavior of Tunnel Structure in Red Mudstone Adjacent to Water-Rich Fault Zones. Alex. Eng. J. 2025, 123, 620–636. [Google Scholar] [CrossRef]
- Zhang, C.; Liu, N.; Chen, K.; Ren, F. Study on Drainage Mode and Anti-Clogging Performance of New Waterproofing and Drainage System in a Tunnel. Sci. Rep. 2023, 13, 5354. [Google Scholar] [CrossRef]
- Qian, W.; Tang, X.; Ma, X.; Wang, X. Mechanical Characteristics and Safety Evaluation of Tunnel Lining Structures in Karst Areas Under Heavy Rainfall Conditions. Buildings 2025, 15, 1756. [Google Scholar] [CrossRef]
- Fan, H.; Zhu, Z.; Song, Y.; Zhang, S.; Zhu, Y.; Gao, X.; Hu, Z.; Guo, J.; Han, Z. Water Pressure Evolution and Structural Failure Characteristics of Tunnel Lining Under Hydrodynamic Pressure. Eng. Fail. Anal. 2021, 130, 105747. [Google Scholar] [CrossRef]
- Sun, D.; Wang, N. Research on the Applied Technology for Prevention and Control of Water Seepage Disease of Highway Operation Tunnel in Northern Cold Region. North Commun. 2024, 12, 83–87. [Google Scholar]
- Tian, C.; Xiao, Z.; Ye, F.; Tong, Y.; Cao, X.; Sun, J.; Li, Z. The Impact of Extreme Rainfall and Drainage System Failure on Rock Tunnels: A Case Study of Deep-Buried Karst Tunnel. Eng. Fail. Anal. 2025, 171, 109345. [Google Scholar] [CrossRef]
- Li, H.; Tan, Y.; Zeng, D.; Su, D.; Qiao, S. Attitude-Predictive Control of Large-Diameter Shield Tunneling: PCA-SVR Machine Learning Algorithm Application in a Case Study of the Zhuhai Xingye Express Tunnel. Appl. Sci. 2025, 15, 1880. [Google Scholar] [CrossRef]
- Si, J.; Liu, S.; Zhang, H.; Zhu, Y.; Zheng, Y. Failure Investigation and Treatments of Tunnel Entrance Collapse in Weak Diatomaceous Soil Induced by Heavy Rainfall Through Coupling Surface and Groundwater Flows. Eng. Fail. Anal. 2023, 150, 107337. [Google Scholar] [CrossRef]
- Wang, Z.; Dong, J.; Zhao, Y.; Wang, Z. Analysis of Fluid–Structure Coupling of Sudden Water Deformation in Tunnels Under Construction. Water 2024, 16, 3479. [Google Scholar] [CrossRef]
- Jin, C.; Sun, C.; Lan, S.; Zhang, J. Progressive Collapse Mechanism Analysis of Tunnel Roof with Weak Surrounding Rock Considering Seepage Effect. Int. J. Geomech. 2025, 25, 04025170. [Google Scholar] [CrossRef]
- Shi, Z.; Xu, J.; Xie, X.; Li, P.; Chai, L.; Li, S. Failure Mechanism Analysis for Tunnel Construction Crossing the Water-Rich Dense Fracture Zones: A Case Study. Eng. Fail. Anal. 2023, 149, 107242. [Google Scholar] [CrossRef]
- Yu, H.T.; Li, T.T.; Yan, X. Multi-Scale Response Characteristics of Overlying Soil-Tunnel System Under Reverse Fault Dislocation. Hydrogeol. Eng. Geol. 2025, 52, 202–213. [Google Scholar]
- Geng, X.; Wu, S.; Yan, Q.; Sun, J.; Xia, Z.; Zhang, Z. An Optimized XGBoost Model for Predicting Tunneling-Induced Ground Settlement. Geotech. Geol. Eng. 2023, 42, 1297–1311. [Google Scholar] [CrossRef]
- DB62/T 2755-2017; Grades of Short-Duration Heavy Precipitation. Gansu Provincial Administration of Quality and Technology Supervision: Lanzhou, China, 2017.
- He, Z.; Xie, M.-W.; Wu, Z.-X.; Zhao, C.; Sun, G.-C.; Xu, L. Field Measurement Study on the Pre-Collapse Inclination Deformation Characteristics of Tension-Cracking Slope Rock Mass Using Micro-Core-Pile Sensor. Rock Soil Mech. 2024, 45, 3399–3415. [Google Scholar] [CrossRef]
- Xu, X.; Liu, J.; Zhang, J.; Ji, M.; Zhang, K.; Shi, S. Spatial and Temporal Distribution Characteristics of Rainfall in Daqing River Basin in the Haihe “23·7” Basin-Wide Extreme Flood. China Flood Drought Manag. 2024, 34, 45–51. [Google Scholar]
- Ma, Y.; Wang, Z.; Wang, D. The Safe Load-Bearing Capacity of Railway Tunnel Linings under High-Pressure and Water-Rich Conditions. Buildings 2023, 13, 2154. [Google Scholar] [CrossRef]
- Liu, Y.; Zheng, J.-J.; You, L.; Lu, J.-T.; Cui, L.; Yang, W.-Y.; Huang, Z.-F. An Analytical Solution for 2D Plane Strain Consolidation in Unsaturated Soils with Lateral and Vertical Semipermeable Drainage Boundaries under Time-Dependent Loading. Int. J. Geomech. 2022, 22, 12. [Google Scholar] [CrossRef]
- JTG 3370.1-2018; Highway Tunnel Design Code. Ministry of Transport of the People’s Republic of China: Beijing, China, 2018.
- GB 50021-2001; Geotechnical Engineering Investigation Code. Ministry of Construction of the People’s Republic of China: Beijing, China, 2001.
- GB/T 50010-2010; Standard for Concrete Structure Design. Ministry of Housing and Urban-Rural Development of the People’s Republic of China & Standardization Administration of the People’s Republic of China: Beijing, China, 2010.
- Yang, Y.; Li, Z.; Tan, Z.; Lin, C.; Liu, Z. Mechanics Analysis of Weak Rock Progressive Squeezing Deformation Characteristics for Tunnel in Suture Zone: A Case Study. Arch. Civ. Mech. Eng. 2025, 25, 5–6. [Google Scholar] [CrossRef]
- Wang, R. Method and Application Study on Determining the Loose Zone of Tunnel Surrounding Rock. Master’s Thesis, Xi’an University of Technology, Xi’an, China, 2019. [Google Scholar]
Disclaimer/Publisher’s Note: The statements, opinions and data contained in all publications are solely those of the individual author(s) and contributor(s) and not of MDPI and/or the editor(s). MDPI and/or the editor(s) disclaim responsibility for any injury to people or property resulting from any ideas, methods, instructions or products referred to in the content. |
© 2025 by the authors. Licensee MDPI, Basel, Switzerland. This article is an open access article distributed under the terms and conditions of the Creative Commons Attribution (CC BY) license (https://creativecommons.org/licenses/by/4.0/).