Abstract
Accurately estimating total accident costs is essential for managing construction safety budgets. While direct costs are well-documented, indirect costs—such as productivity loss, material damage, and legal expenses—are difficult to predict and often overlooked. Traditional ratio-based methods lack accuracy due to variability across projects and accident types. This study introduces a two-tiered machine learning framework for real-time indirect cost estimation. In the first tier, classification models (decision tree, random forest, k-nearest neighbor, and XGBoost) predict total cost categories; in the second, regression models (decision tree, random forest, gradient boosting, and light-gradient boosting machine) estimate indirect costs. Using a dataset of 1036 construction accidents collected over two years, the model achieved accuracies above 87% in classification and an R2 of 0.95 with a training MSE of 0.21 in regression. Compared to conventional statistical and single-step models, it demonstrated superior predictive performance, reducing average deviations to $362.63 and sometimes achieving zero deviation. This framework enables more precise, real-time estimation of hidden costs, promoting better safety investment, reduced financial risk, and adaptive learning through retraining. When integrated with a national accident cost database, it supports ongoing improvement and informed risk management for construction stakeholders.
1. Introduction
The construction industry consistently ranks among the most hazardous sectors worldwide [1], with Korea reporting the highest fatality rate across all industries in 2022, 24.25% of all work-related deaths occurred in construction [2]. Similar trends have also been observed in other developed countries, such as the United States, the United Kingdom, Australia, and Singapore [3,4]. Since the mid-1990s, developing preventive measures that account for the magnitude and characteristics of construction accidents, as well as their associated costs, has remained one of the most challenging areas in construction research [5] despite continuous efforts to enhance on-site safety protocols. A key reason for this challenge is the lack of a standardized system for classifying cost components and collecting comprehensive accident data, an undertaking that requires substantial time and coordination among multiple stakeholders.
In this context, Hinze [6] underscored the importance of approaching construction safety from an economic perspective, advocating for accurate cost assessments to encourage greater investment in preventive measures by stakeholders. Pellicer et al. [7] proposed that a predictive tool for accident and prevention costs could optimize safety measures within budget constraints prior to project initiation. From the government’s perspective, it can help in formulating policies related to occupational safety and health, assessing the adequacy of the budget and preparing detailed plans. From a corporate standpoint, it facilitates the formulation of more specific accident prevention plans, the introduction of industrial safety and health technologies and internal policies, the scientific planning and budgeting for project safety and health costs, and helps measure declining project profitability due to accidents. Finally, from an academic perspective, it enables the economic evaluation of health and safety technologies, the economic evaluation of the formulation and revision of construction safety standards, and the statistical data analysis of socio-economic losses caused by accidents.
Heinreich [8] pioneered the identification of hidden costs associated with occupational accidents, and inspired researchers to categorize them into two main groups [9,10]. Direct costs, such as compensation to victims and medical costs, are easily identifiable and are usually covered by insurance policies to protect contractors from liability claims [11,12]. In contrast, indirect costs are not directly associated with accidents, but account for a significant proportion of total accident costs. The costs mentioned encompass legal fees, productivity losses, labor replacements, and the expenses associated with investigating accidents [13].
Direct costs are typically easier to manage, whereas tracking indirect costs, such as lost productivity and legal claims, requires a time-consuming and complex process. Consequently, indirect costs are often excluded from safety accident databases and related reports [10]. To simplify estimation, previous studies have frequently applied fixed ratios to direct costs [14,15,16], with Heinrich’s 1:4 ratio widely adopted due to its simplicity [15]. However, this ratio varies depending on the type, severity, and intensity of the accident, making ratio-based estimates inadequate for capturing the true indirect accident costs [17,18].
Accurate estimation of accident costs in construction is essential for quantifying risk levels and supporting preventive strategies. However, the inability of ratio-based methods to reflect variations across different accident scenarios presents a significant limitation. These shortcomings underscore the need for data-driven approaches, such as data mining and machine learning, that can deliver more accurate, work-specific risk assessments while accounting for factors such as accident type, injury severity, and other contributing variables.
Recent studies have increasingly applied machine learning to enhance construction cost and accident outcome prediction, highlighting both methodological advances and policy implications. For example, Turkyilmaz and Polat [19] explored six machine learning classification algorithms to predict cost-overrun ratio classes using project risk indicators, enabling proactive cost control and resource planning throughout project execution. Chen et al. [20] introduced a comprehensive and transparent framework for construction cost prediction using advanced machine learning integrated with explainable AI (XAI) and uncertainty quantification, highlighting the potential of machine learning models to revolutionize construction cost estimation. Similarly, Jafary et al. [21] proposed an AI-augmented construction cost estimation framework that leverages ensemble Natural Language Processing (NLP) to align quantity take-offs (QTOs) with construction cost indexes (CCIs). The model automates the traditionally manual, error-prone task of mapping free-text QTO descriptions to standardized cost items, thereby improving accuracy, transparency, and efficiency in cost estimation. Collectively, these studies underscore the growing policy relevance of interpretable machine learning frameworks for improving economic forecasting, optimizing safety investments, and guiding strategic construction management decisions.
The objective of this study was to bridge this gap by leveraging data mining techniques to develop predictive models that provide a more accurate estimate of indirect accident costs. To achieve this objective, we’ve developed a two-tiered machine learning framework to forecast the indirect costs of accidents at construction sites. This framework used a compiled dataset obtained through a survey of on the top 20 contractors in Korea based on their construction project evaluation amounts and conducted over an approximate two-year period. The reason for selecting these companies is that they operate dedicated departments that systematically collect and manage data on construction safety incidents.
The proposed framework combines a classification and quantification approach using machine learning algorithms to improve the accuracy of the estimation results. Unlike static ratios, machine learning models can accommodate variability across projects, accident types, and severity levels based on direct costs. Additionally, machine learning-based predictive models enable immediate indirect cost estimation, which is critical for rapid decision-making in safety management. The results of this study can help construction stakeholders to estimate indirect accident costs, thus evaluating the financial effect on different trades and tasks and facilitating the appropriate allocation of safety budgets and measures.
2. Literature Review
2.1. Direct and Indirect Costs Analysis in Construction Accidents
According to Heinreich [8], indirect costs are approximately four times higher than direct costs in industrial accidents. Hinze and Appelgate [12] noted discrepancies, referencing Leopold and Leonard [22], who reported that indirect costs are a quarter of direct costs because they included costs like repair, replacement, and lost wages as direct costs. Hinze and Applegate [12] analyzed over 500 construction injury cases, finding that the direct to indirect cost ratio for medical injuries aligns with Heinrich’s one to four ratio, while the ratio for work restriction days may be one to twenty.
Choi [23] conducted a study on roof construction accidents and supported Hinze and Appelgate’s [12], hypothesis that indirect costs could be 20 times higher than direct costs. Since then, researchers have attempted to determine the ratio between direct and indirect costs under different conditions and accident records in different regions, such as 1:2.415 based on industrial accidents in Israel [17], 1.5:1 from 47 building projects in Singapore [24], approximately 1:>1 from 100 accident cases in South Africa [15], and 1:1.22, 1:1.94, and 1:1.19 for fatal, permanent disability, and temporary disability accidents in railway projects in Malaysia, respectively [16]. The variability of indirect costs and the lack of a universal relationship between direct-to-indirect accident costs necessitates a new approach. Manuele [14] explained that the previous ratios are invalid owing to the different cost categories, with direct costs increasing more than indirect costs. Therefore, it is essential to independently assess indirect costs using construction accident datasets through machine learning and statistical frameworks to develop a more accurate quantification method.
2.2. Data Mining in Construction Management Research
Data mining has become an important tool for knowledge discovery in the construction industry. Data mining approaches can generate effective predictive models that enable the interpretation of an ordinary database and contribute to new knowledge [25]. As the construction industry is data-intensive, there are many cases where data mining has been used in management and safety-related research, as well as in cost estimation.
For instance, Lee et al. [26] used a decision tree (DT) for both classification and quantification of productivity losses, such as the impact on project costs and schedule resulting from the change in order. Son and Kim [27] used an artificial neural network (ANN) to predict construction costs in the preliminary construction stage to ensure that the resulting costs were in line with the project budget. Their model achieved a test error of only 6.82%. Chou and Tsai [28] proposed a combined classification and regression model approach for estimating the compressive strength of high-performance concrete using three combinations: support vector machines (SVM) with linear regression (LR), SVM with artificial neural networks (ANN), and SVM with support vector regression (SVR). In this approach, the classifier first predicts the strength as high or low and the regressor then estimates the compressive strength.
Tixier et al. [29] used random forest (RF) and stochastic gradient tree boosting (GB) to incorporate the features of natural language processing and accurately predict the type of injury, energy type, and body parts affected. Ayhan and Tokdemir [30] used artificial neural network (ANN) regression models to predict the outcomes of construction site incidents. The authors integrated fuzzy set theory with an ANN to improve the prediction outcome. Pham et al. [31] investigated the effectiveness of 13 machine-learning regression models in optimizing building costs using variables such as building characteristics, costs, and required resources. They found that ANN, gradient boosting (GB), and XGBoost exhibited superior performance compared to other models.
Shahani et al. [32] investigated the prediction of uniaxial compressive strength using boosting algorithms, including GB, Catboost, light gradient boosting machine (LightGBM), and XGBoost, for soft sedimentary rocks. Choi and Kim [33] proposed a DT and a specific work-based model for predicting fatal construction accidents to safely execute construction projects and ensure the implementation of appropriate safety measures. More recently, Wang et al. [34] developed a classification-regression combination model (CRCM) that initially classified the Easy-to-Repair Limit State (ERLS) of a scoured bridge pile group foundation and then predicted the displacement ductility factor and the corresponding strength hardening factor at the ERLS using a linear classifier (LC) and an LR. Table 1 summarizes the discussion above, highlighting diverse applications of data mining and machine learning in construction. Some studies compare multiple techniques to find the most suitable model, while others enhance performance by integrating metaheuristic methods.

Table 1.
Data mining applications in construction management.
Based on the discussion, studies related to accident safety analysis have predominantly focused on accident consequences or risk intensity. To date, there has been a conspicuous lack of studies dealing with the estimation of accident costs or the prediction of safety accident costs using a substantial amount of accident cost data. Techniques such as DT, RF, k-NN, SVM, and boosting algorithms have emerged as predominant in these studies, reflecting the industry’s increasing reliance on advanced technologies for improved decision-making and risk management. These algorithms are particularly well-suited to handle key characteristics commonly found in construction safety datasets, such as non-linearity, mixed data types, and noise. Some studies have combined both classification and regression techniques, arguing that a single regressor model may not adequately account for all the complex factors involved. These studies have also compared the combined approach with conventional single-step regression models and found that the combined model performs better [26,28,34].
Building on this insight, the present study adopts classification followed by regression framework for indirect cost estimation. This structure was motivated by the observed diversity in indirect cost patterns and the limitations of prior single-regressor approaches. The selection of algorithms was informed by both prior literature and the characteristics of the dataset. For classification, DT, k-NN, RF, and XGBoost were selected, while DT, RF, GB, and LGBM were chosen for regression. SVM and SVR were excluded due to their susceptibility to overfitting and the complexity of hyperparameter tuning in multiclass settings [35]. Similarly, ANNs were not considered due to their complex nature, which can lead to overfitting issues, and because their performance in the presence of multiple categorical variables often requires integration with other techniques to be effective. Linear models were also excluded due to their limited capacity to capture the complex interactions inherent in accident-related cost data.
3. Methodology
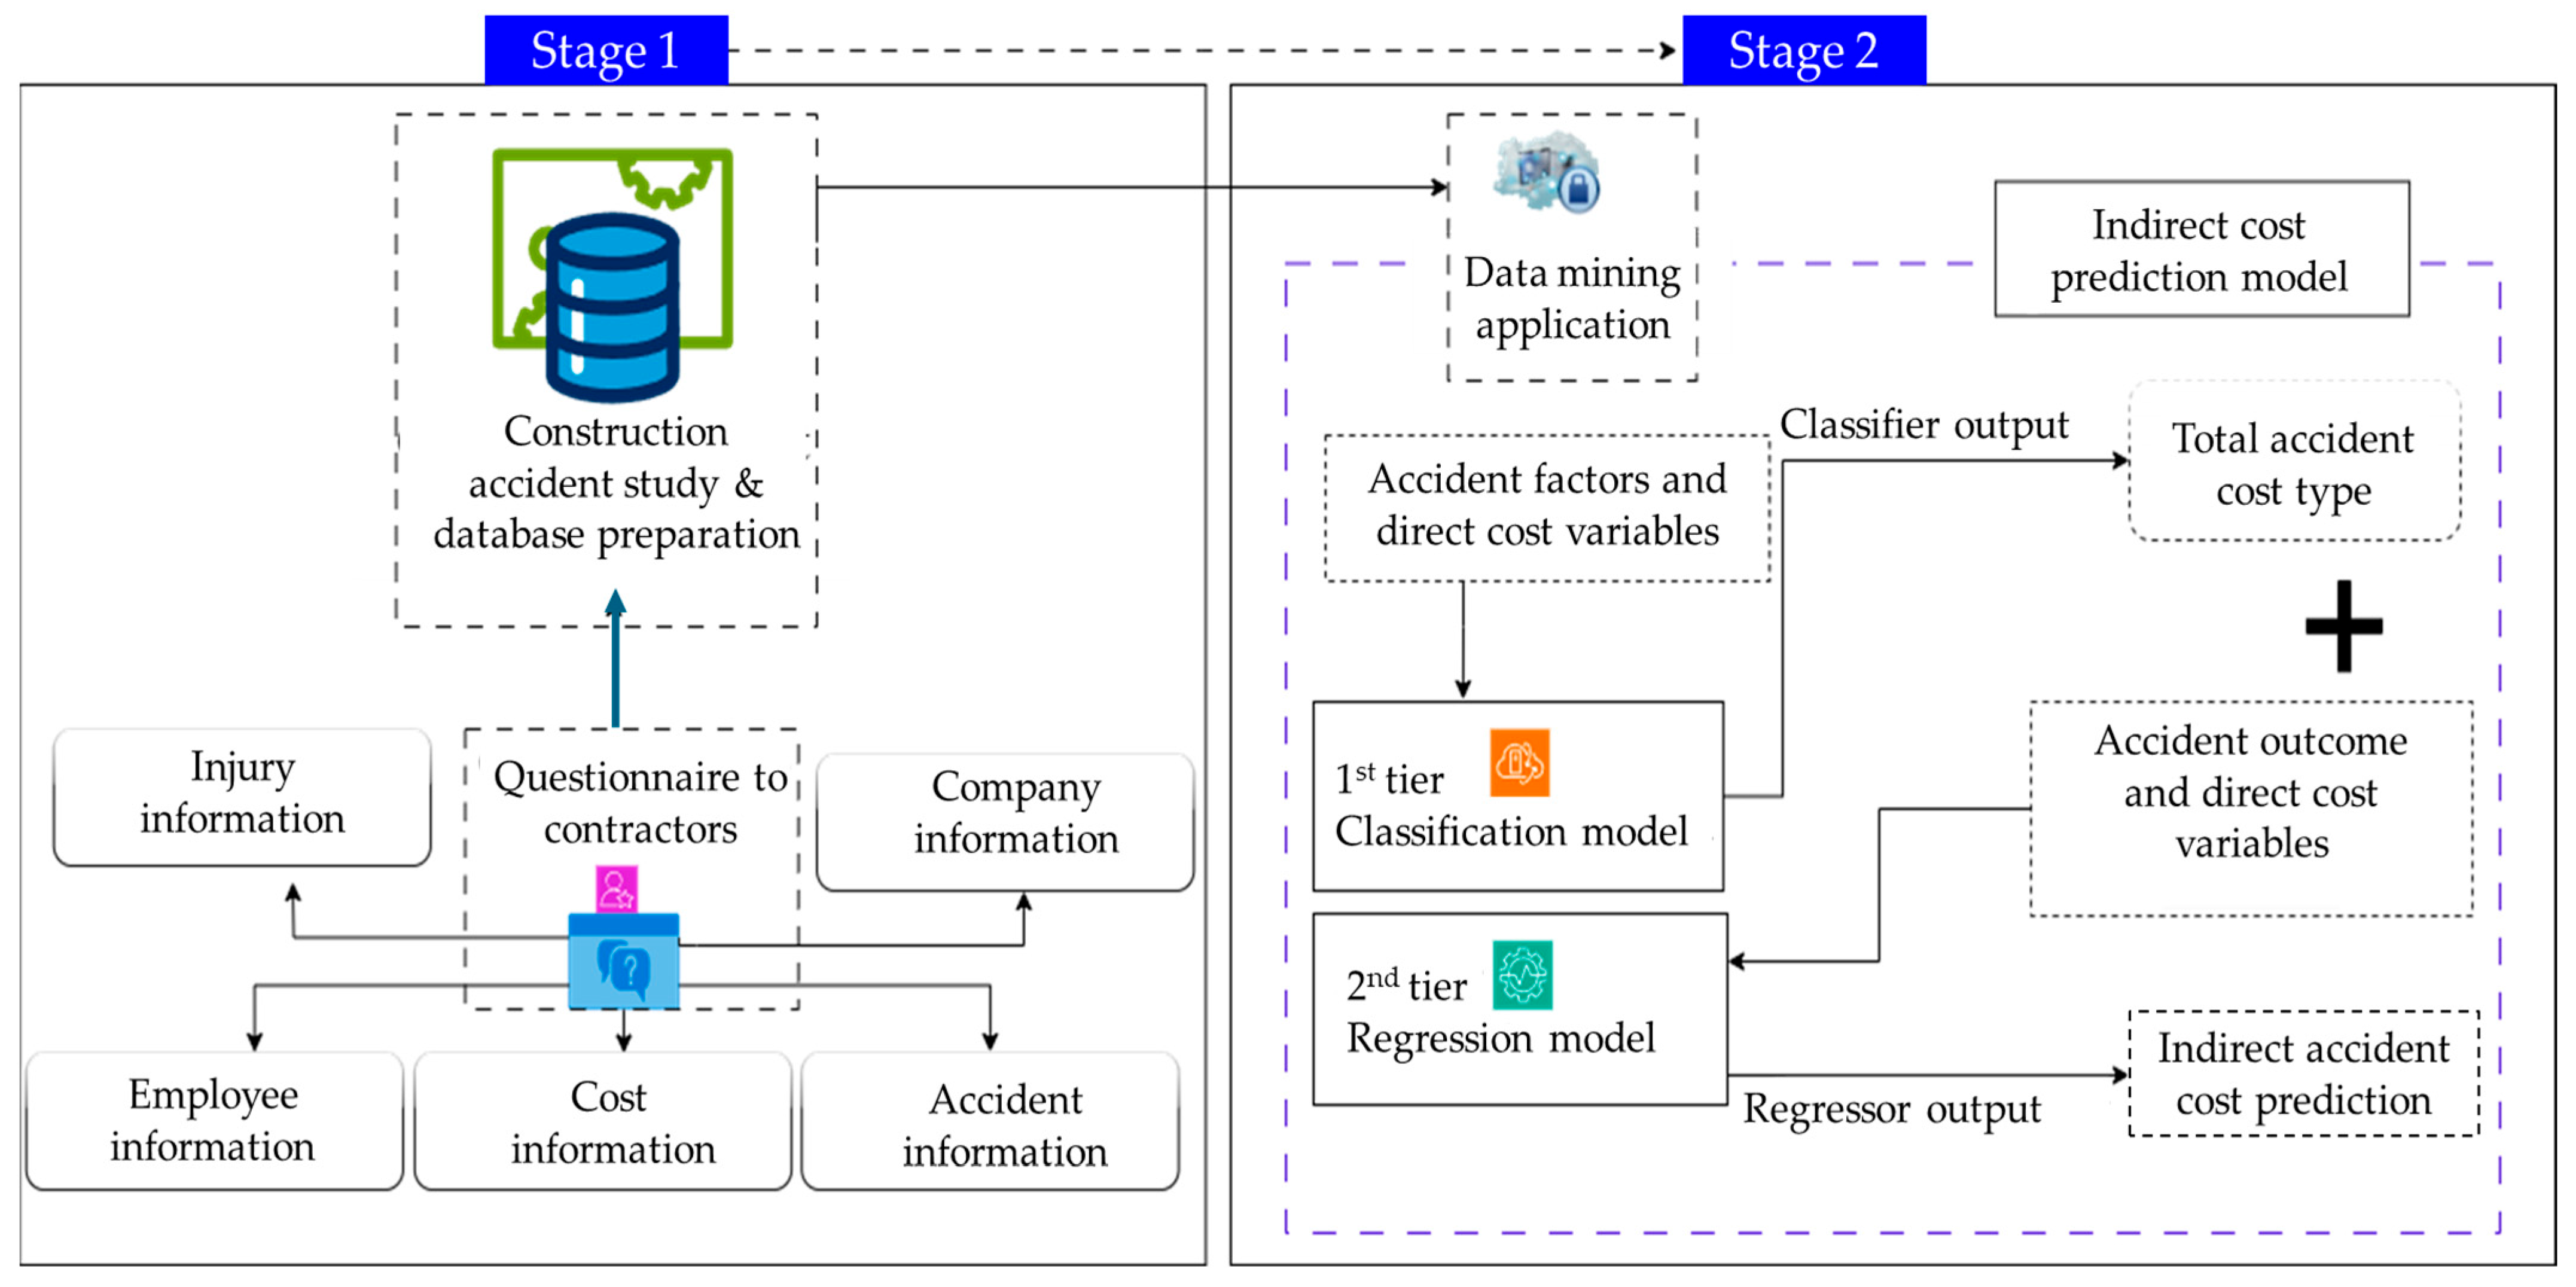
The research technique consists of two stages: the creation of the construction accident database and the implementation of data mining algorithms, as shown in Figure 1. In the first stage, a comprehensive accident cost questionnaire was formulated, which included information on companies, employees, accidents, injuries, and accident cost information and distributed to major contractors so that records of accident cost can be collected. In the second stage, data mining techniques are applied to the database to develop the best indirect cost prediction model for a construction project. We use a two-tiered machine learning framework to estimate the indirect costs arising from accidents on construction sites by leveraging the compiled dataset.
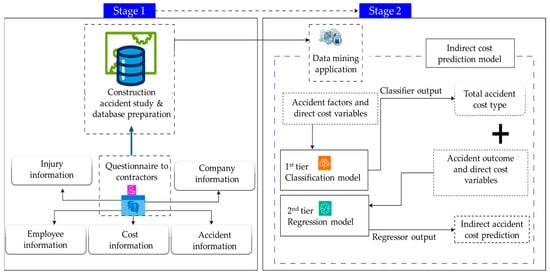
Figure 1.
Overview of the research process and methodology.
The first tier classifies the total accident cost to determine the total accident cost category (i.e., the total accident cost type in Figure 1), and the second tier uses this classification information as an additional input variable, together with the direct cost and the accident variables, to quantify the indirect cost, as indicated in Figure 1. The direct costs refer to the insurance costs, which are assumed to be identifiable at the time of the accident. In this section, the questionnaire design process is described, the types of accident-related information collected by the questionnaire are explained in detail, and the model development process is discussed in the next section.
3.1. Accident Cost Questionnaire Design
We’ve utilized industry standard accident survey tables and previous research frameworks to design a customized questionnaire to assess accident safety costs in the construction industry. The questionnaire consists of five parts. Part 1 collects basic project information, including the type of construction project, company name, construction cost, and duration. While company names are primarily used to identify survey participants, project type, cost, and duration provide insights into accident characteristics in different construction environments and thus influence the resulting indirect costs [24]. Part 2 describes the specific accident details for each project, such as the accident year, date, and day of the week, along with the project completion rate and the work operation the victim was involved in during the incident. The years and date are fundamental accident data, with the day of the week helping to identify possible correlations with increased accident rates, such as fatigue at the end of the week owing to consecutive days of labor-intensive tasks [36]. Certain work processes, such as working at heights, are also highlighted for their high risk of serious accidents, resulting in substantial indirect costs [37].
Part 3 provides detailed information on the employment of the individuals concerned, which includes variables such as age, occupation, organizational affiliation, length of service, and average wage. Studies have shown that older workers are often victims of fatal accidents [36], and that inexperienced workers are more prone to accidents [38]. The involvement of subcontractors, which increases uninsured costs, has also been reported [24]. The average wage reflects the skill level of workers, which is critical to understanding safety awareness in the workplace [38]. Part 4 includes information on injuries, such as the type of accident, details of injuries, and fatality information, which influence cost outcomes. For example, accidents, such as falls or hits, lead to higher days of lost productivity, which drives up indirect costs [39].
In part 5, the financial impact of safety incidents from Parts 1 to 4 is described in detail and divided into direct and indirect costs. These cost items were identified through literature review and consultations with accounting teams from leading contractors and construction firms in Korea. Direct costs include workers’ compensation insurance, temporary/lifelong disability insurance, medical expenses (hospitalization, treatment, medication, nursing, and caregiver costs), bereavement and funeral expenses, and property/material insurance.
Indirect costs refer to consequential expenses associated with construction accidents that are not directly covered by insurance. Specifically, the following cost categories are considered, as outlined in the studies by Jallon et al. [10] and Haupt and Pillay [15]: (1) compensation to victims for emotional distress and temporary or lifelong unemployment; (2) material loss costs; (3) hospital transport arrangements; (4) productivity losses, including work stoppages and reduced output due to injured workers performing only light-duty tasks; (5) potential loss of expertise and experience; (6) delay penalties and the cost of extending construction timelines; (7) uncovered medical expenses, such as diagnostic tests, prosthetics, and rehabilitation aids; (8) administrative investigation and reporting costs; (9) expenses for replacement workers, including recruitment and training; (10) equipment repair and damage costs; (11) third-party legal claims; and (12) reputational damage due to negative publicity.
Due to limitations in data collection, several indirect cost components could not be recorded during the survey period. The excluded items are: (1) lifetime unemployment benefits, (2) costs for training replacement personnel, (3) damage to the company’s reputation, (4) reduced productivity from injured workers performing light-duty tasks, (5) loss of expertise and experience, and (6) third-party legal claims. As these components were not trackable through available data sources, they were excluded from the final analysis. All other cost items listed in the previous section were included in the questionnaire. Each selected cost item was verified through face-to-face consultations with expert personnel, including construction safety managers and medical consultants, and was cross-validated with insurance companies to ensure data accuracy and transparency. For analysis purposes, direct and indirect costs were first calculated separately and then aggregated to determine the total accident cost.
For indirect costs, which are affected by inflation and evolving economic conditions over time, the Consumer Price Index (CPI) was applied to adjust all reported values to current monetary terms. The CPI served as a benchmark to standardize historical cost data, ensuring consistency with present-day economic conditions. This adjustment enhanced the accuracy and comparability of the indirect cost estimates, allowing for a more realistic and meaningful analysis aligned with contemporary financial standards.
3.2. Data Collection Process and Survey Overview
The survey took approximately one year and ten months (from July 2020 to April 2022) as the accident cost data was disorganized and rarely examined or collected by construction companies. Another problem was that this survey focused on collecting indirect cost items, which required a significant amount of time to follow up, up to two years depending on the severity of the accidents. To collect accident data, the researchers collaborated with the Ministry of Land, Infrastructure and Transport (MLIT) and the Korean Authority of Land and Infrastructure Safety (KALIS). An official letter with a detailed questionnaire was sent to the top 100 construction companies in Korea, ranked by annual construction capability. Twenty contractors and four public companies participated in this survey, including well-known large-scale firms typically ranked within the top 30, despite slight annual variations. These companies, with extensive experience in the construction industry, encompass both the building and civil engineering sectors. Supported by established safety management departments and robust regulations, safety and construction managers from these firms analyzed and provided accident cost data for completed or ongoing projects. To ensure consistency and minimize variations between surveyed organizations, a pre-forma questionnaire was utilized to automatically calculate the cost data in advance. Insurance-related costs were calculated using the Employment and Workers’ Compensation Insurance Total Service [40]. In total, 1036 accident records, including associated costs, were collected from accidents that occurred over 11 years, from 2011 to 2022.
Of these cases, 918 were non-fatal, whereas the remainder were fatal. Of the 1036 cases, only 912 included direct and indirect costs that could be used for data analysis, of which 57 were fatalities and 855 were injuries. Table 2 summarizes the detailed information collected from the survey. However, as some incidents occurred more than ten years ago, certain variable information could not be collected. Therefore, based on availability and relevance to accident events, 909 cases and 14 attributes (including ten categorical and four numerical) were selected for the development of the indirect cost prediction model. Each of the categorical variables and their respective categorical elements are described in the Supplementary Materials section.

Table 2.
The description of the accident cost data.
4. Two-Tiered Indirect Cost Prediction Model Development
4.1. Applied Training Strategies
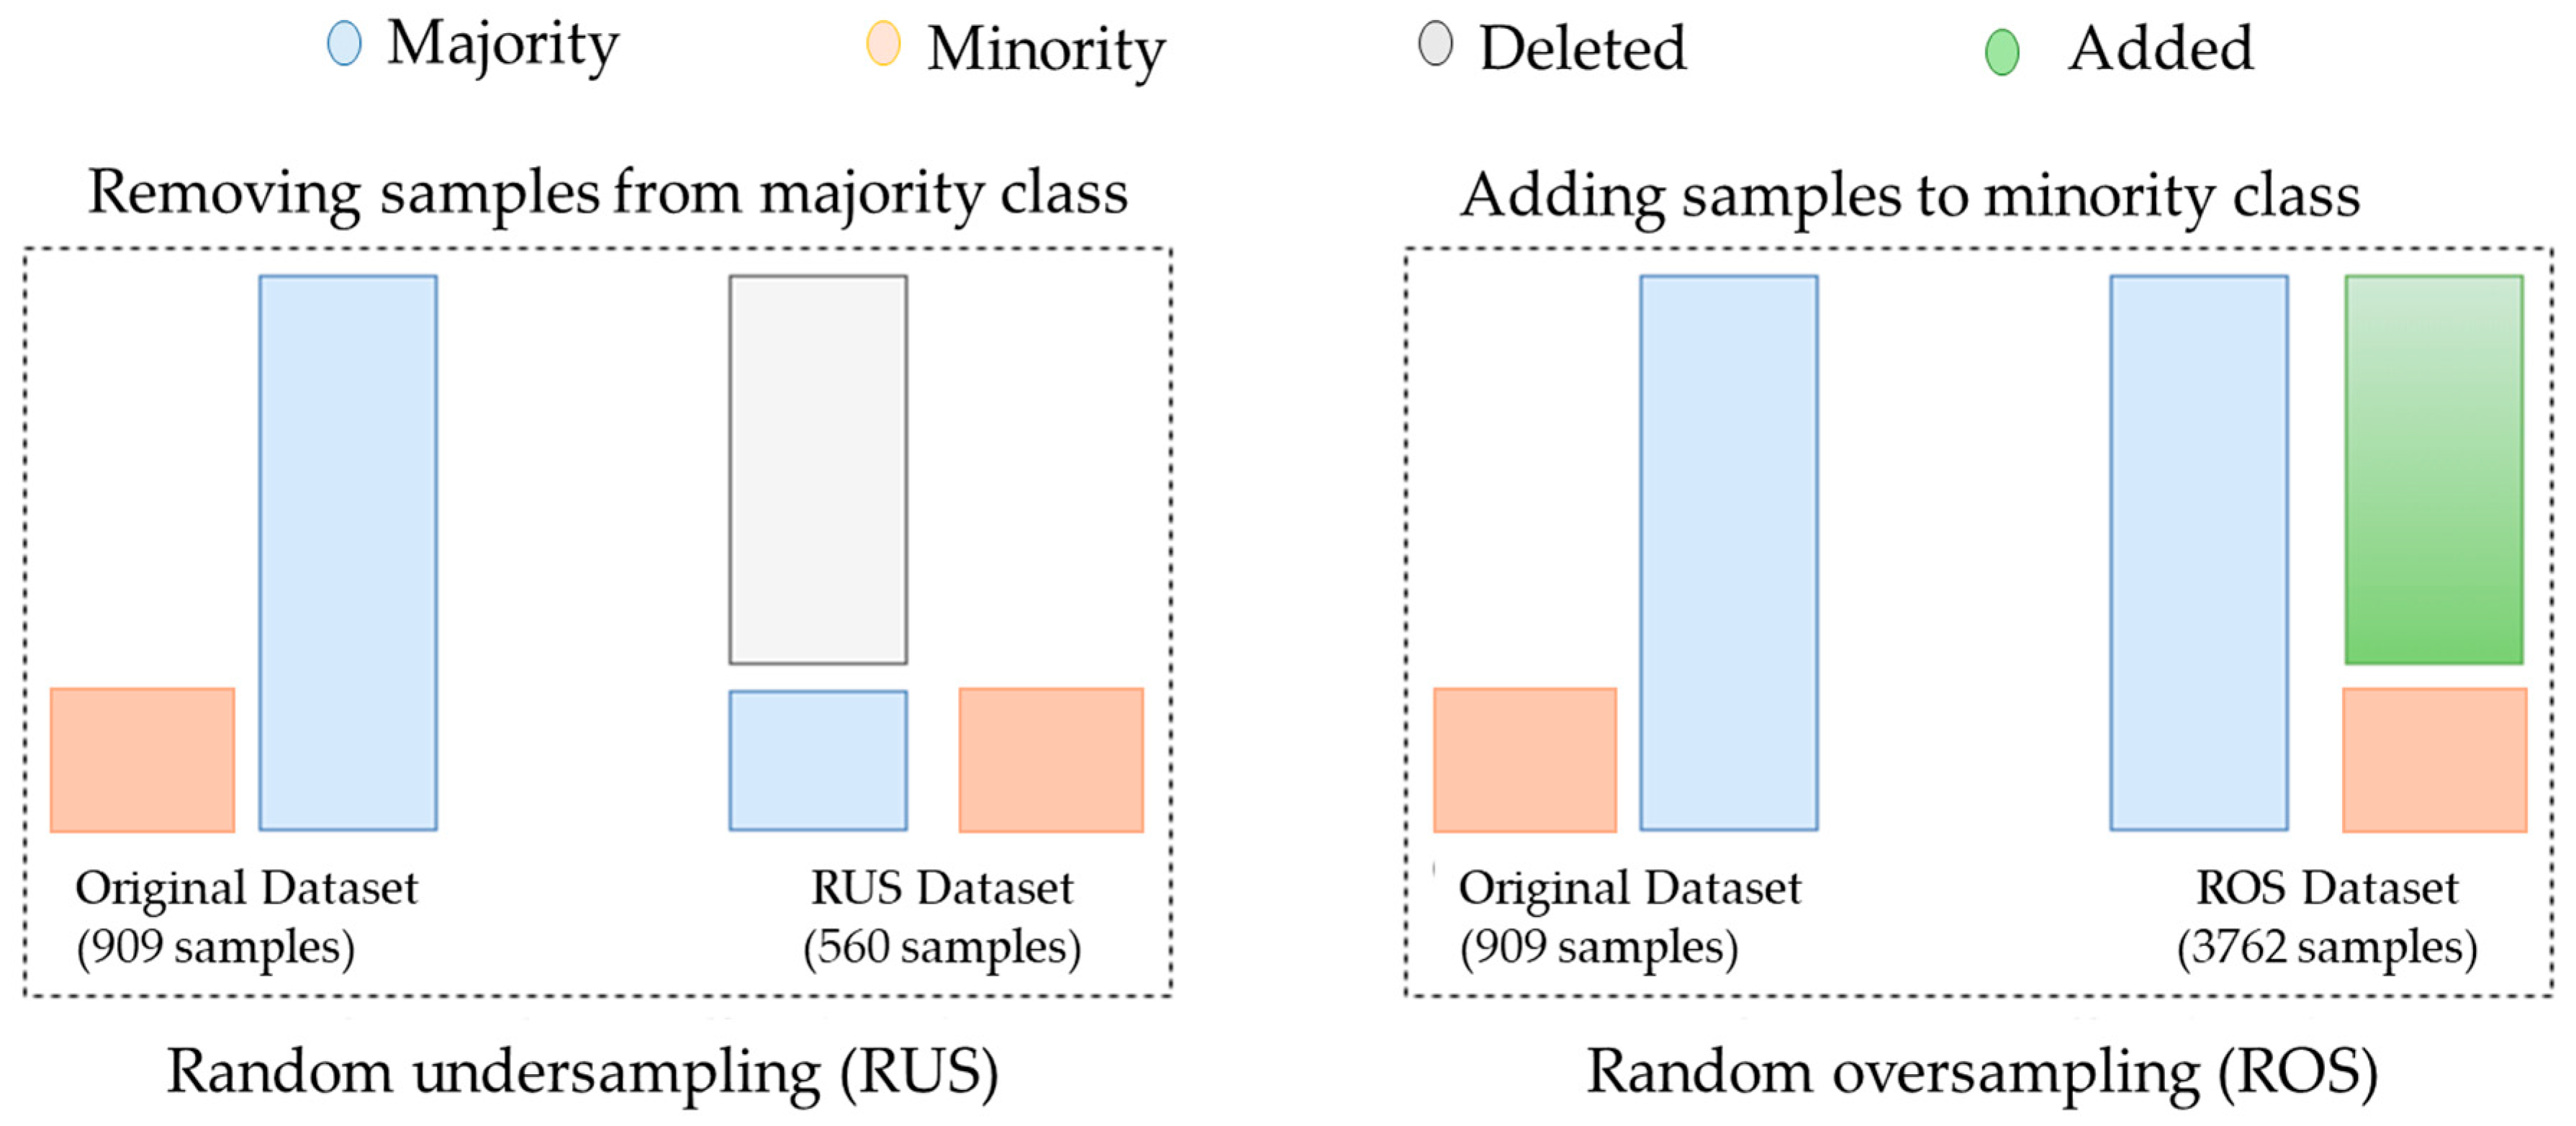
This section briefly describes the training methods used and the process of variable selection using statistical analysis. When analyzing the data prior to model development, it was found that the majority of the total cost (the sum of direct and indirect cost) type (404 out of 909, 45.6%) belonged to TAC4 (from USD10,000–50,000) (Table S10). The “Class imbalance” problem is a major challenge for machine learning classifiers, as it leads to biases favor the majority class [41]. Although they achieve high accuracy, such models may have limited generalization ability for minority classes. To address this imbalance, two strategies to resample the data were applied: random undersampling (RUS) and random oversampling (ROS). In the RUS technique, samples in the majority categories were randomly deleted (Figure 2 (left), whereas in the ROS technique, samples in the minority categories were randomly duplicated (Figure 2 (right)) [42].
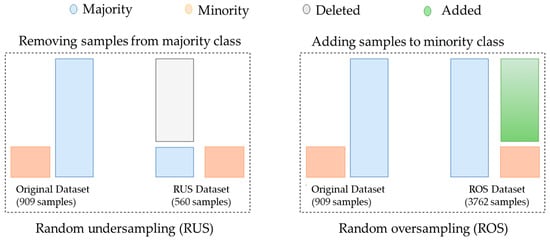
Figure 2.
Example of the RUS and ROS technique (adapted and revised from Vargas et al. [41]).
Resampling of data is a common practice in construction engineering research using data-mining methods [39,42,43]. Koc et al. [39] have shown that the RUS technique effectively mitigates the computational challenges associated with multiple categorical variables, and has been successfully used to predict permanent disability in construction workers involved in accidents. In addition, Koc et al. [42] argued that ROS is better suited for highly imbalanced datasets and advocated the combined use of RUS and ROS along with another data resampling approach to forecast workplace fatalities.
Given the alignment of the dataset with the specified criteria (highly imbalanced nature and the inclusion of multiple categorical variables), these methods were adopted in this study. The original dataset comprised 909 samples. After duplicating the minor classes using the ROS application process, the new dataset was expanded to 3762 samples. In contrast, after randomly deleting some samples using the RUS method, the dataset was reduced to 560, which can be observed in Figure 2. These three datasets were used independently to train each of the classification models.
4.2. Selection of Accident Cost Variables Using Statistical Analysis
Careful selection of variables is crucial in the development of machine-learning models to ensure optimal performance and to avoid including irrelevant variables that could affect the accuracy of the model. To achieve this, statistical analyses, such as the Kruskal–Wallis test, were used for categorical input variables, while a Pearson correlation matrix was used for numerical variables. These methods are widely accepted in construction engineering research [44,45]. The Kruskal–Wallis test was used to assess whether the distribution of the continuous target variable differs significantly across the categories of each predictor variable. This non-parametric method evaluates whether there are statistically significant differences in the median values of the target variable between groups defined by categorical variables. A p-value less than 0.05 indicates significant between-group variation, leading to rejection of the null hypothesis. Conversely, p-values greater than 0.05 suggest that group differences are not statistically significant [46]. Table 3 presents the categorical variables along with their corresponding p-values from the Kruskal–Wallis test. For instance, “day of the week” and “length of service” returned p-values of 0.0583512 and 0.06786, respectively, suggesting that these variables do not significantly differentiate the distribution of the target variable. In total, nine categorical variables were tested against the target variable “total cost type”.

Table 3.
p-values from the Kruskal–Wallis test.
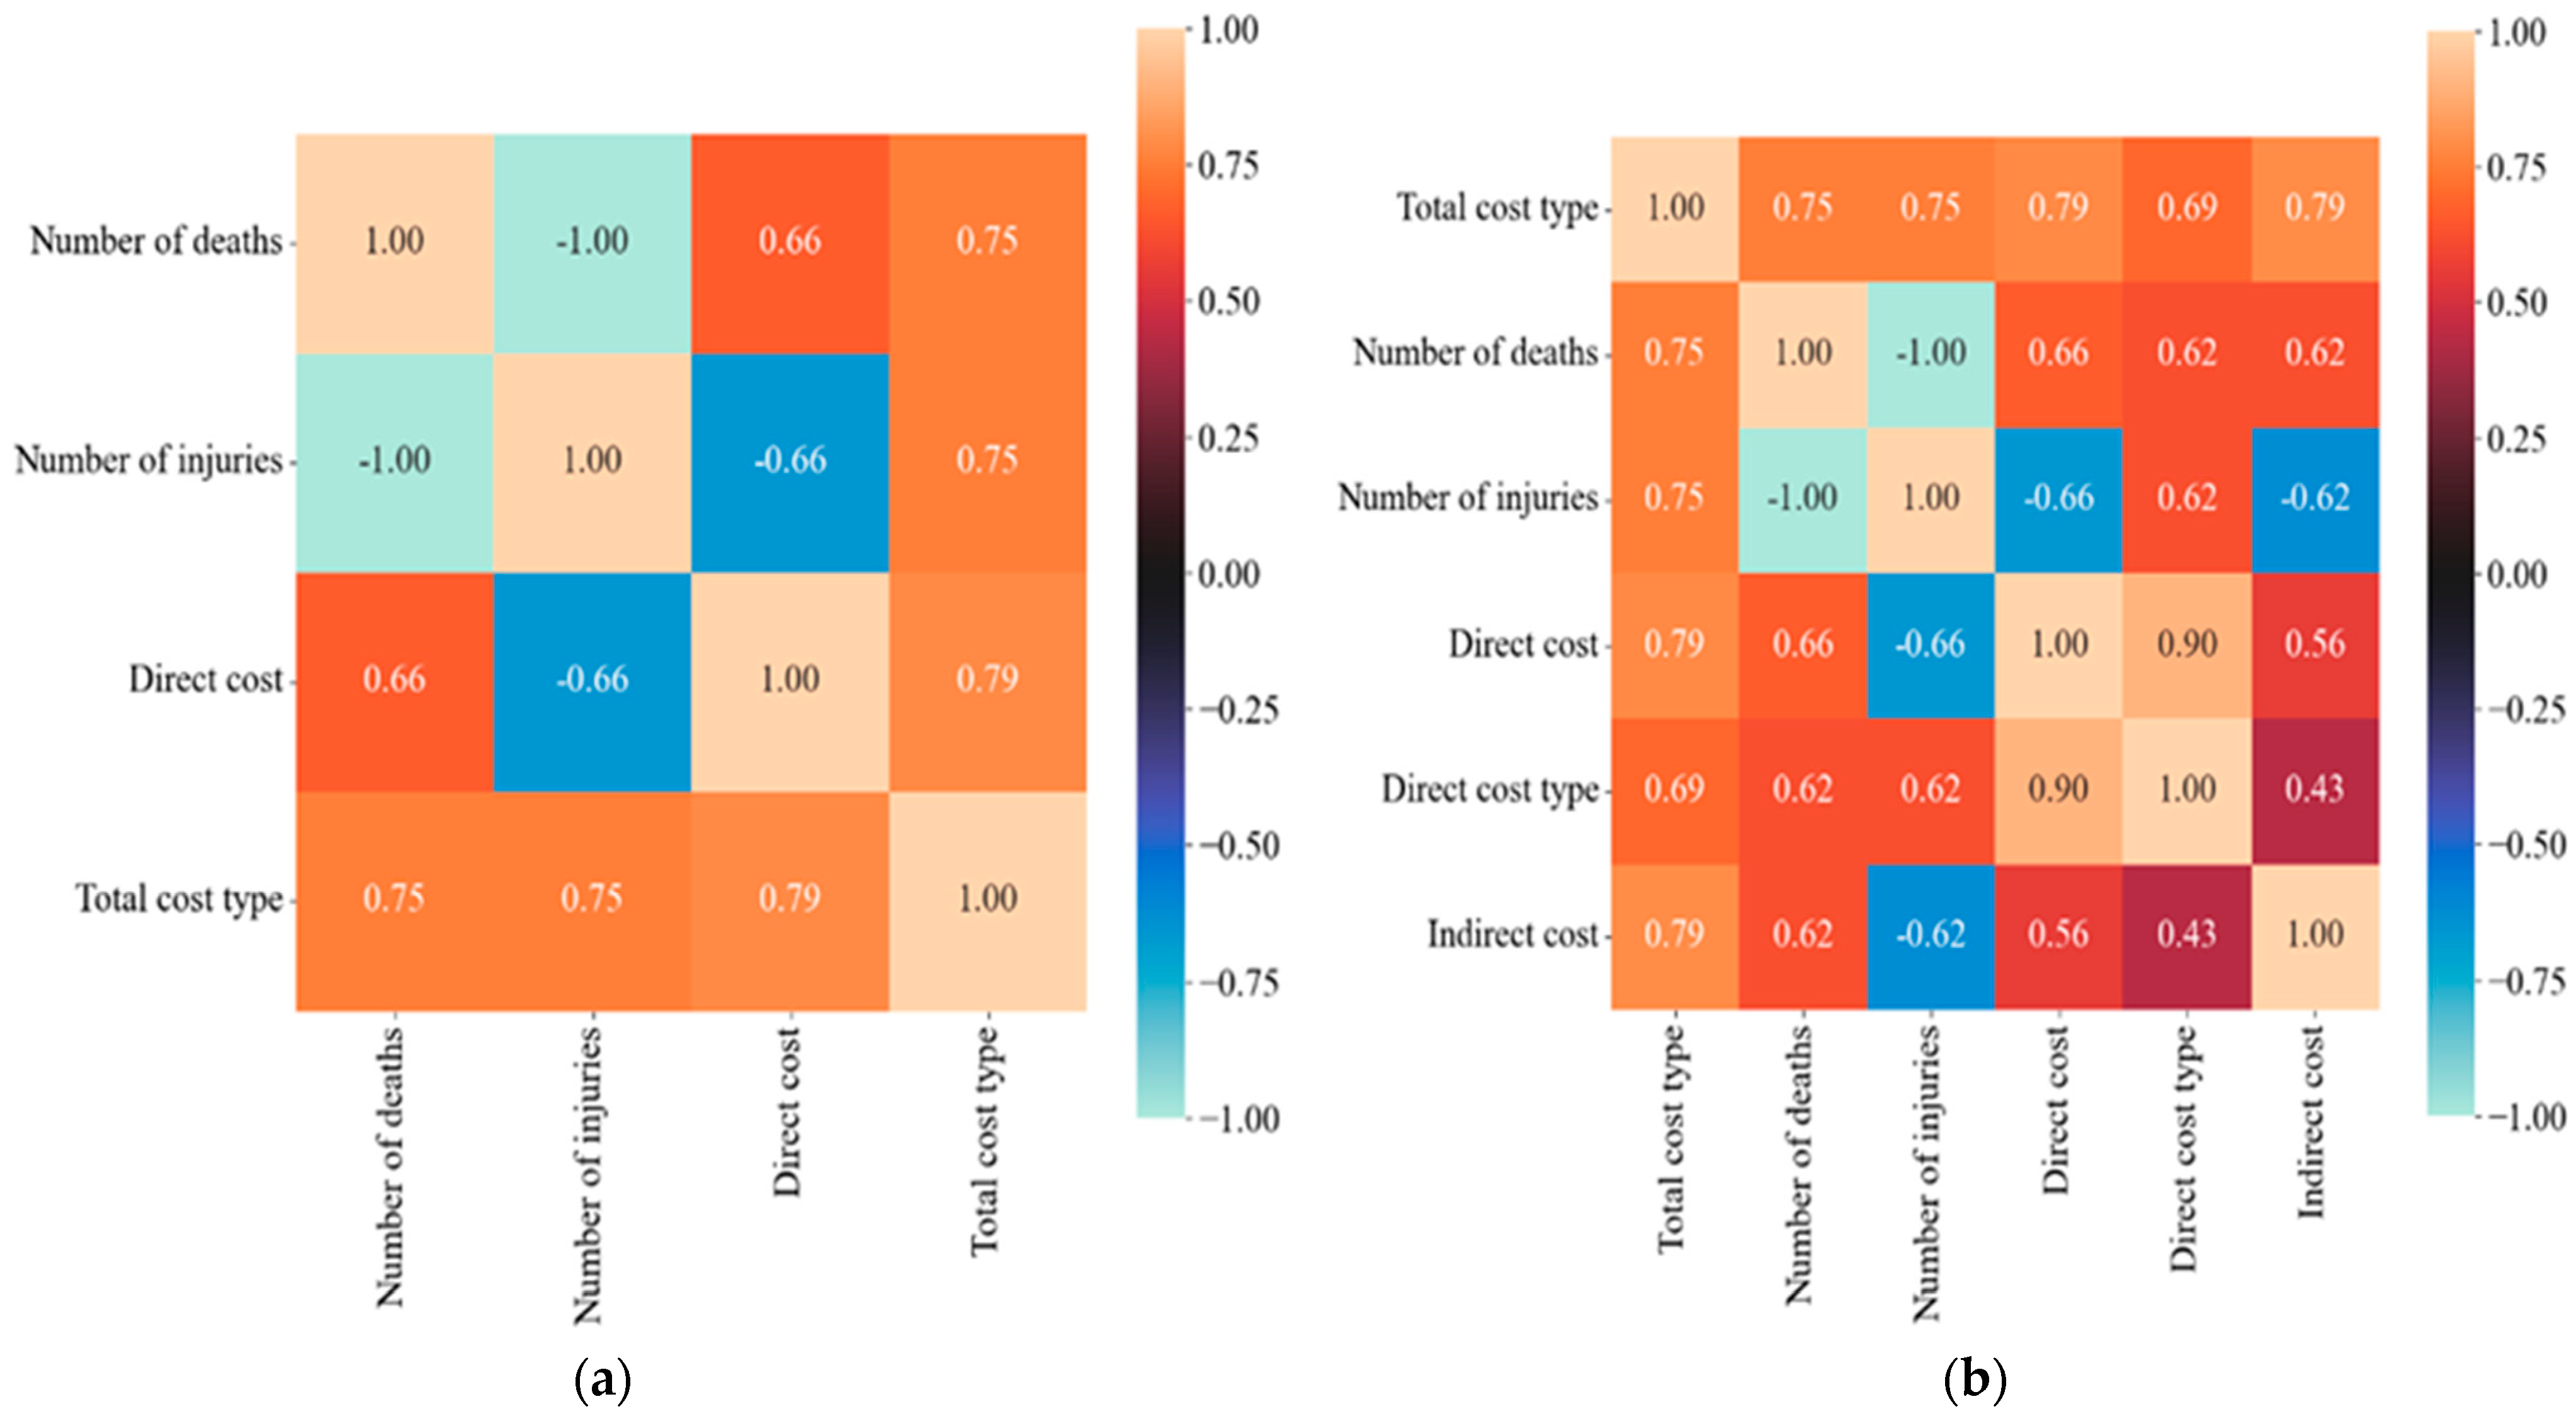
The Pearson correlation matrix evaluates the relationships between the variables, which are often visualized with a heatmap for the sake of clarity. A coefficient close to 1 indicates a strong positive correlation, while a coefficient close to −1 indicates a strong negative correlation, and a coefficient close to 0 indicates no correlation [45]. Figure 3a illustrates the significant correlations between numerical variables such as the number of fatalities, the number of injuries, and direct cost, which all approach a coefficient of 0.8 in relation to the total accident cost type. After analysis, the variables “day of the week” and “length of service” were deemed insignificant and removed from the variable list for the 1st-tier model. For the 2nd-tier regression model, all numerical variables were subjected to a Pearson correlation test. Figure 3b shows strong correlations (approximately 0.6) between the total accident cost type, number of fatalities, the number of injuries, and the direct and indirect costs. At 0.43, the type of direct costs also correlates with the indirect cost. As no coefficient was close to zero, these variables were deemed suitable for the intended use.
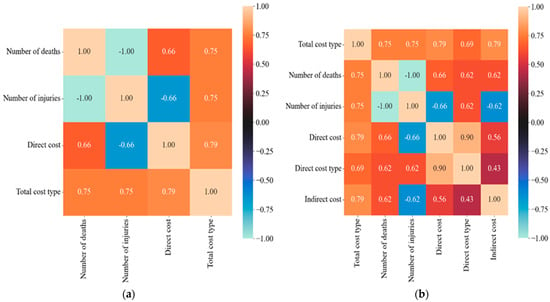
Figure 3.
Correlation between the input-output characteristics (numerical variables) (a) for 1st-tier (b) for 2nd-tier.
4.3. Two-Tiered Prediction Model Development Process
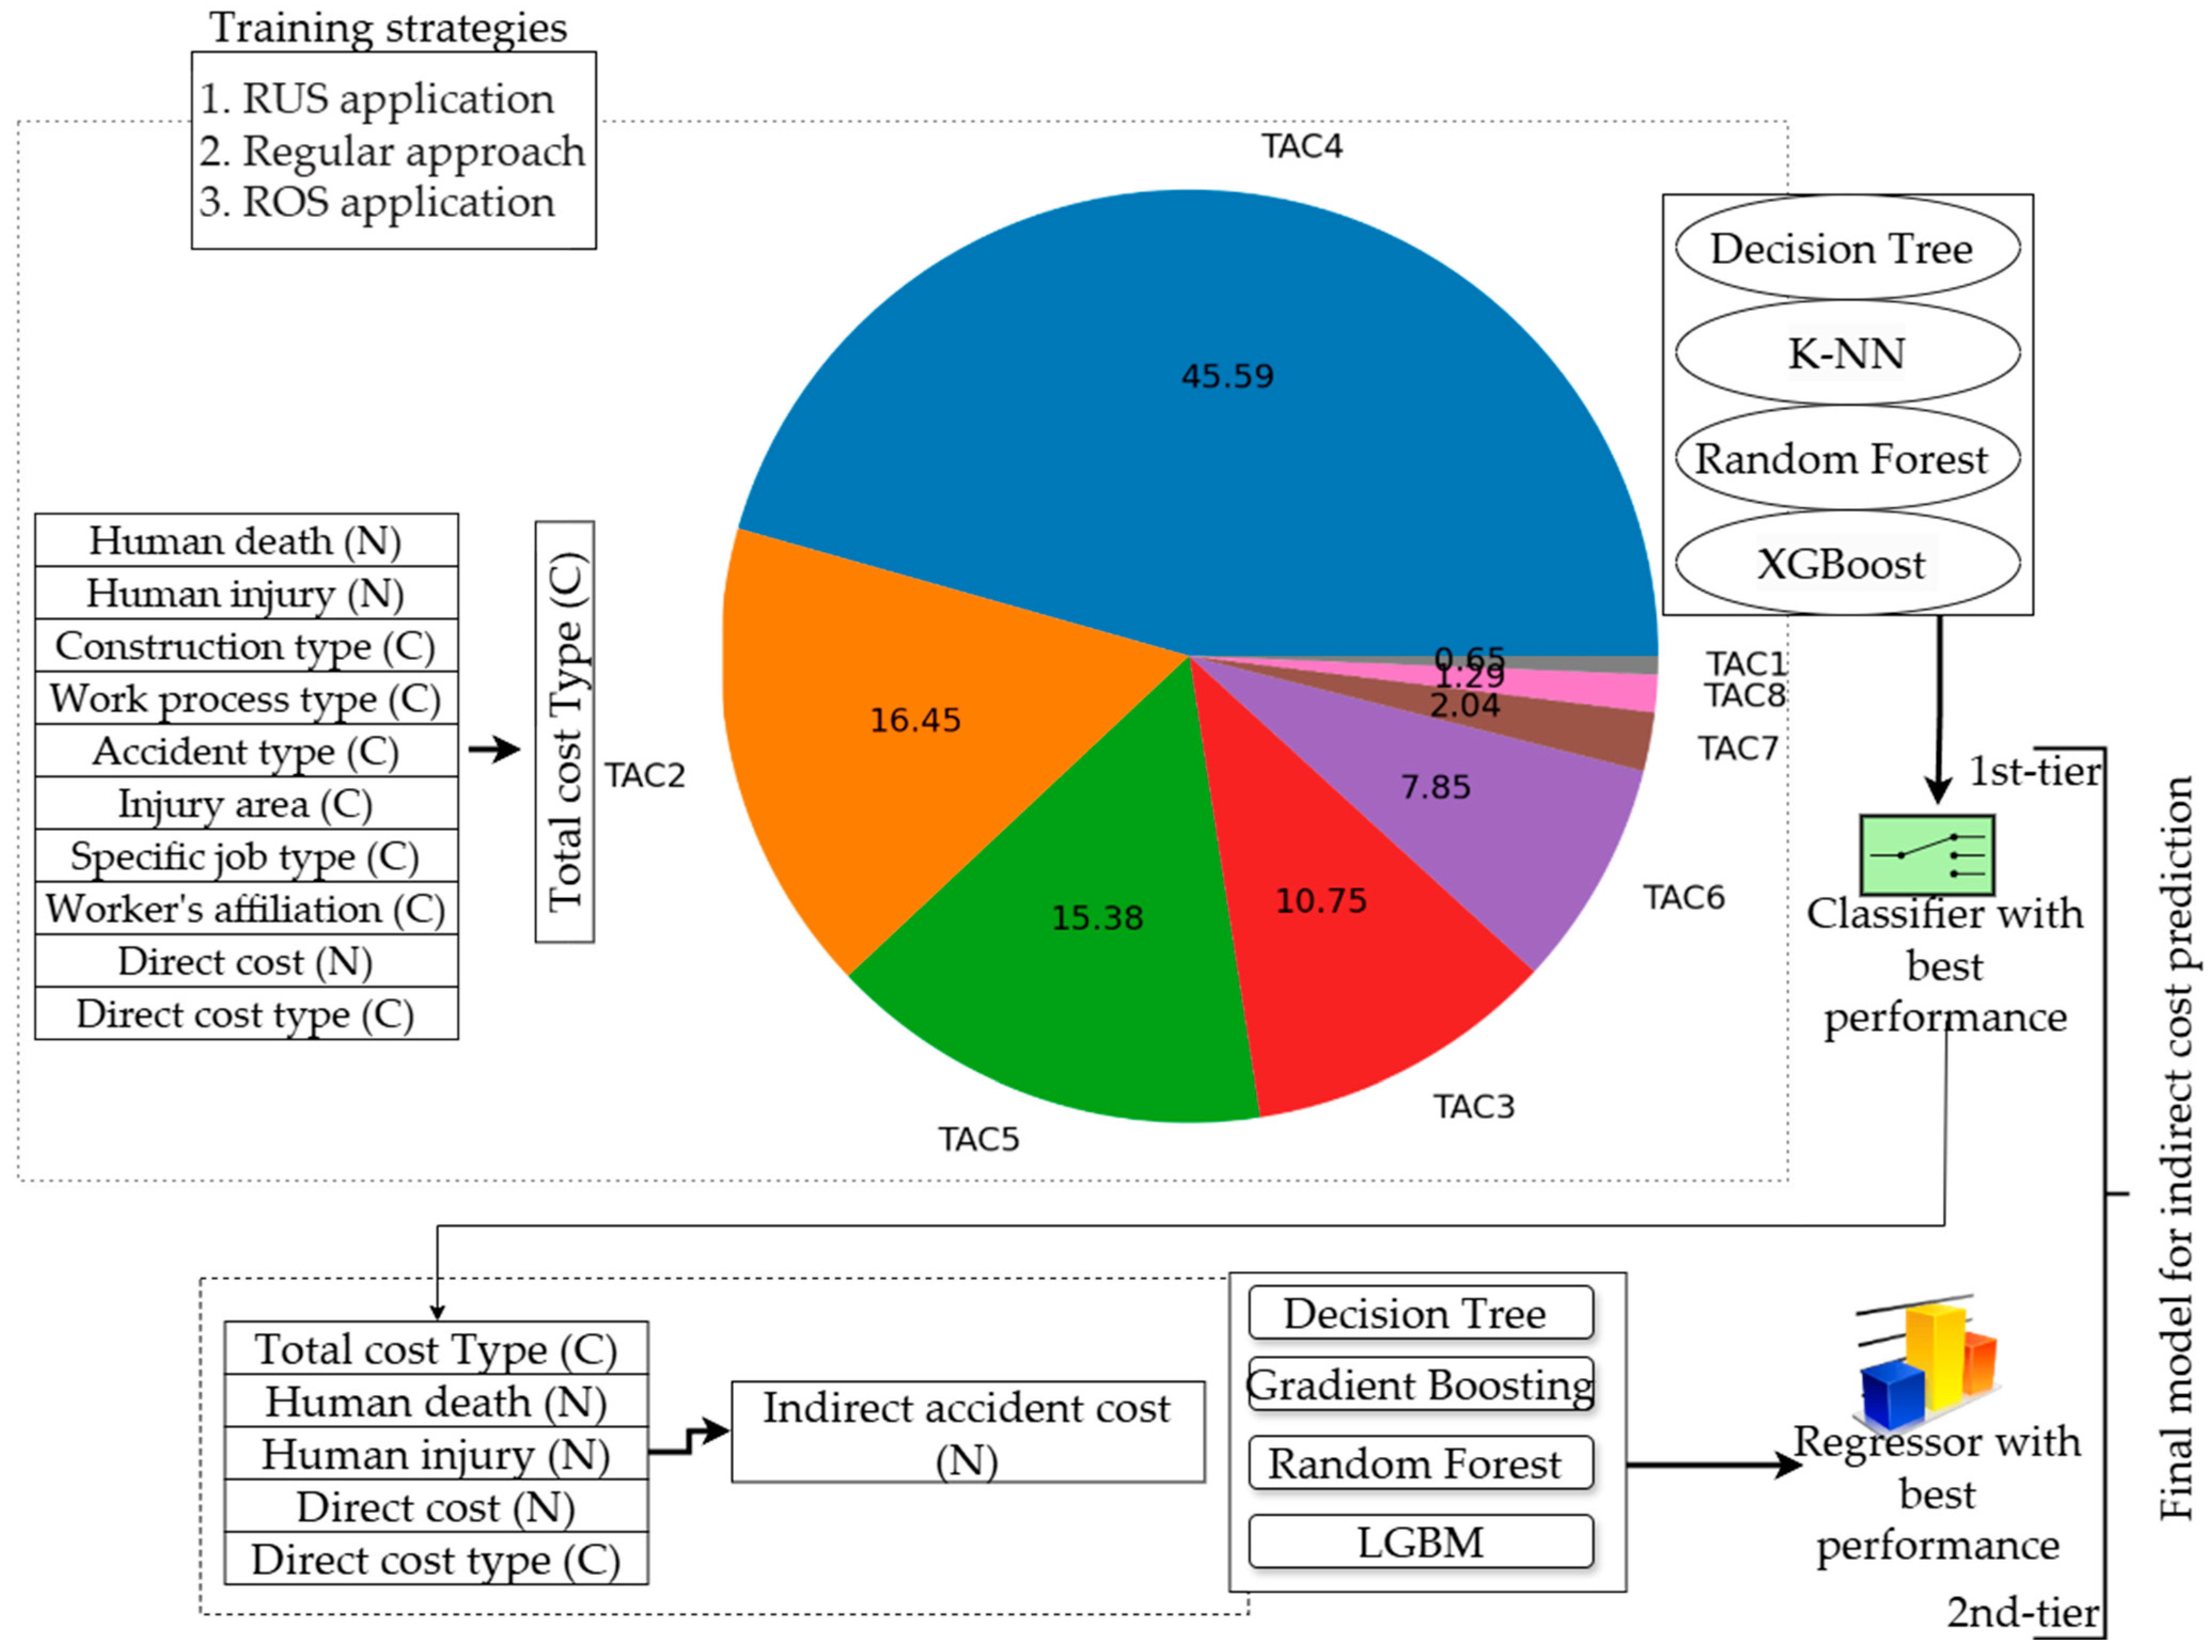
The proposed model with the applied machine learning algorithms and strategies is outlined in Figure 4. In the first tier (top right), four classifiers with three training strategies were used: regular, ROS, and RUS after data resampling. The pie chart in the middle displays the distribution of the output variables for the classifiers and illustrates an imbalance with the total-cost type TAC4 accounting for approximately half of the samples, as described in Section 4.1. Once the classifier has predicted the total cost type, the second tier incorporates this information together with variables such as the number of fatalities, injuries, direct cost, and cost type, to predict indirect cost. In the second tier, four regressors were used and the best regressor was combined with the classifier to form the final model. Additionally, the numerical attributes were marked with N and categorical attributes were marked with C.
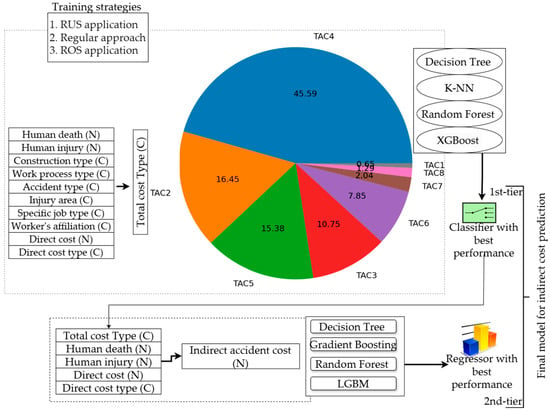
Figure 4.
Development of the two-tiered prediction model.
The machine learning model was trained in a Python 3.9 programming environment using the Jupyter Notebook console. Detailed code, including specific parameter information for each algorithm, is available in the GitHub repository, with a link provided in the Data Availability Statement section. The raw survey responses, collected via structured forms, were initially stored and managed using MySQL. SQL queries were employed to preprocess and organize the data, including the conversion of continuous variables into categorical training labels based on the classification schemes provided in Tables S1–S11. These categorical variables were subsequently encoded using Scikit-learn’s LabelEncoder to transform them into a numerical format suitable for model training. Numerical input features were normalized using StandardScaler to minimize the impact of scale differences. For the first-tier classification model, label-encoded class labels served as the output variable, while for the second-tier regression model, a transformed target regressor was applied to account for sparsity and improve predictive accuracy.
5. Results and Discussion
The selected machine learning-based classifiers and regressors were trained and validated using the corresponding performance metrics. The following sections describe the results for each model.
5.1. 1st-Tier Classification Model for the Total Accident Cost Prediction
In this stage, eleven variables were selected, ten input variables and one output variable (Figure 4), and a categorical prediction model for the total accident cost was developed using the aforementioned three strategies with four machine learning algorithms: DT, k-NN, RF, and XGBoost. The dataset was divided into two subsets: 80% for training, and 20% for testing. The trained models were evaluated using several performance metrics such as accuracy, cross-validation score, precision, recall, and F1-score, as in previous studies [42,47].
In cross-validation, a given dataset is divided into k subsets, and the model is trained and tested k times using a different subset for testing and the remaining folds for training. The final score was determined by calculating the mean of the k repetitions. Here, we’ve used 5-fold cross-validation.
The equation for precision is:
where TP represents true positives (correctly predicted positive instances) and FP represents false positives (incorrectly predicted positive instances).
Precision = TP/(TP + FP)
The equation for recall is:
where TP represents true positives (correctly predicted positive instances) and FN represents false negatives (positive instances that were incorrectly classified as negative) [48].
In contrast, the f1-score provides a balanced measure that accounts for both false positives and false negatives [49]. The equation for the f1-score is:
Accuracy is a measure of correctly classified instances [50] and is expressed as follows:
The higher the accuracy, precision, recall, and F1-score, the better the performance. Table 4 lists the accuracy and cross-validation scores in the training and testing phases for all the three methods. In the regular approach, the highest training and test accuracy was provided by the RF. After applying ROS, the k-NN classifier achieved the highest training and testing accuracy, as well as the highest cross-validation score. After applying RUS, the RF classifier had the highest training and test accuracy; however, the DT classifier had a slightly higher cross-validation score.

Table 4.
Performance of the classification model.
Table 5 lists the mean precision, recall, and F1-score of these methods. It is evident from the analysis of the f1-score that the ROS model significantly improves the generalization ability of the models. In contrast, a significant decrease in the F1-score was observed after the application of RUS, indicating that the reduction in the training subset size affects the performance. As shown in Table 4 and Table 5, the superior performance of K-NN and RF classifiers can be explained by their architectures. K-NN uses the distance between nearest-neighbor data points for classification and is therefore effective in detecting patterns and relationships in the data [51]. In contrast, RF is an ensemble of multiple DTs, making it less prone to overfitting and able to deal with noisy data [43]. Additionally, XGBoost builds decision trees sequentially and is more sensitive to noise, which is more evident from the learning curves in Figures S1d and S3d. Therefore, for construction industry-related research, especially in cases where noise in the data is common, such as in accident or risk management issues, K-NN or RF is more suitable. Based on the comparison of the performance metrics of the four classifiers, k-NN in the ROS approach was selected as the best classifier for the 1st-tier. The learning curves for the regular, ROS, and RUS approaches are presented in Figures S1–S3, respectively. As shown in Figure S2c, the k-NN classifier under the ROS strategy exhibits a robust learning pattern, characterized by consistently high training accuracy and only a modest decline in validation performance. This indicates strong generalization capability and minimal risk of overfitting.

Table 5.
Average precision, recall, and F1-score.
5.2. 2nd-Tier Regression Model for Indirect Cost Prediction
In this section, regression models are applied, and their performance compared to predict indirect accident cost based on the variables illustrated in Figure 4. Table 6 lists the training results for each regression model. The typical evaluation metrics for regression models are the R2 score, mean absolute error (MAE), and mean squared error (MSE) [52,53]. The training dataset was divided into 80% training and 20% test subsets during the training process, similar to that in the classification stage. In Table 6, R2 is the coefficient of determination that represents the similarities between the target and actual predictions in the regression model. An R2 value closer to 1 suggests a better fit of the model to the data. MAE is the average of absolute errors, whereas MSE is the average of the squared error between the target and the actual prediction [52,53].

Table 6.
Performance evaluation of the regression models.
For the GB regressor, R2 was highest at 0.95, accompanied by an MAE of 0.1 and an MSE of 0.21, reflecting a similar performance in the LGBM regressor. The decline in DT performance is attributed to its single-tree nature, as opposed to ensemble models such as GB and LGBM, which integrate multiple trees to improve accuracy. Boosting models leverage sequences of weak classifiers/regressors to construct robust models using iterative techniques [54]. In this tier, boosting models performed better compared to the 1st tier, which can be attributed to the absence of noise within the data. During the classification stage, multiple categorical variables were present, potentially introducing noise during the training process. However, in the regression stage, only two categorical variables were used, while the rest were numerical, allowing the boosting algorithms to perform better. For cost estimation processes or similar cases in the industry, boosting algorithms may offer better performance than ensemble algorithms.
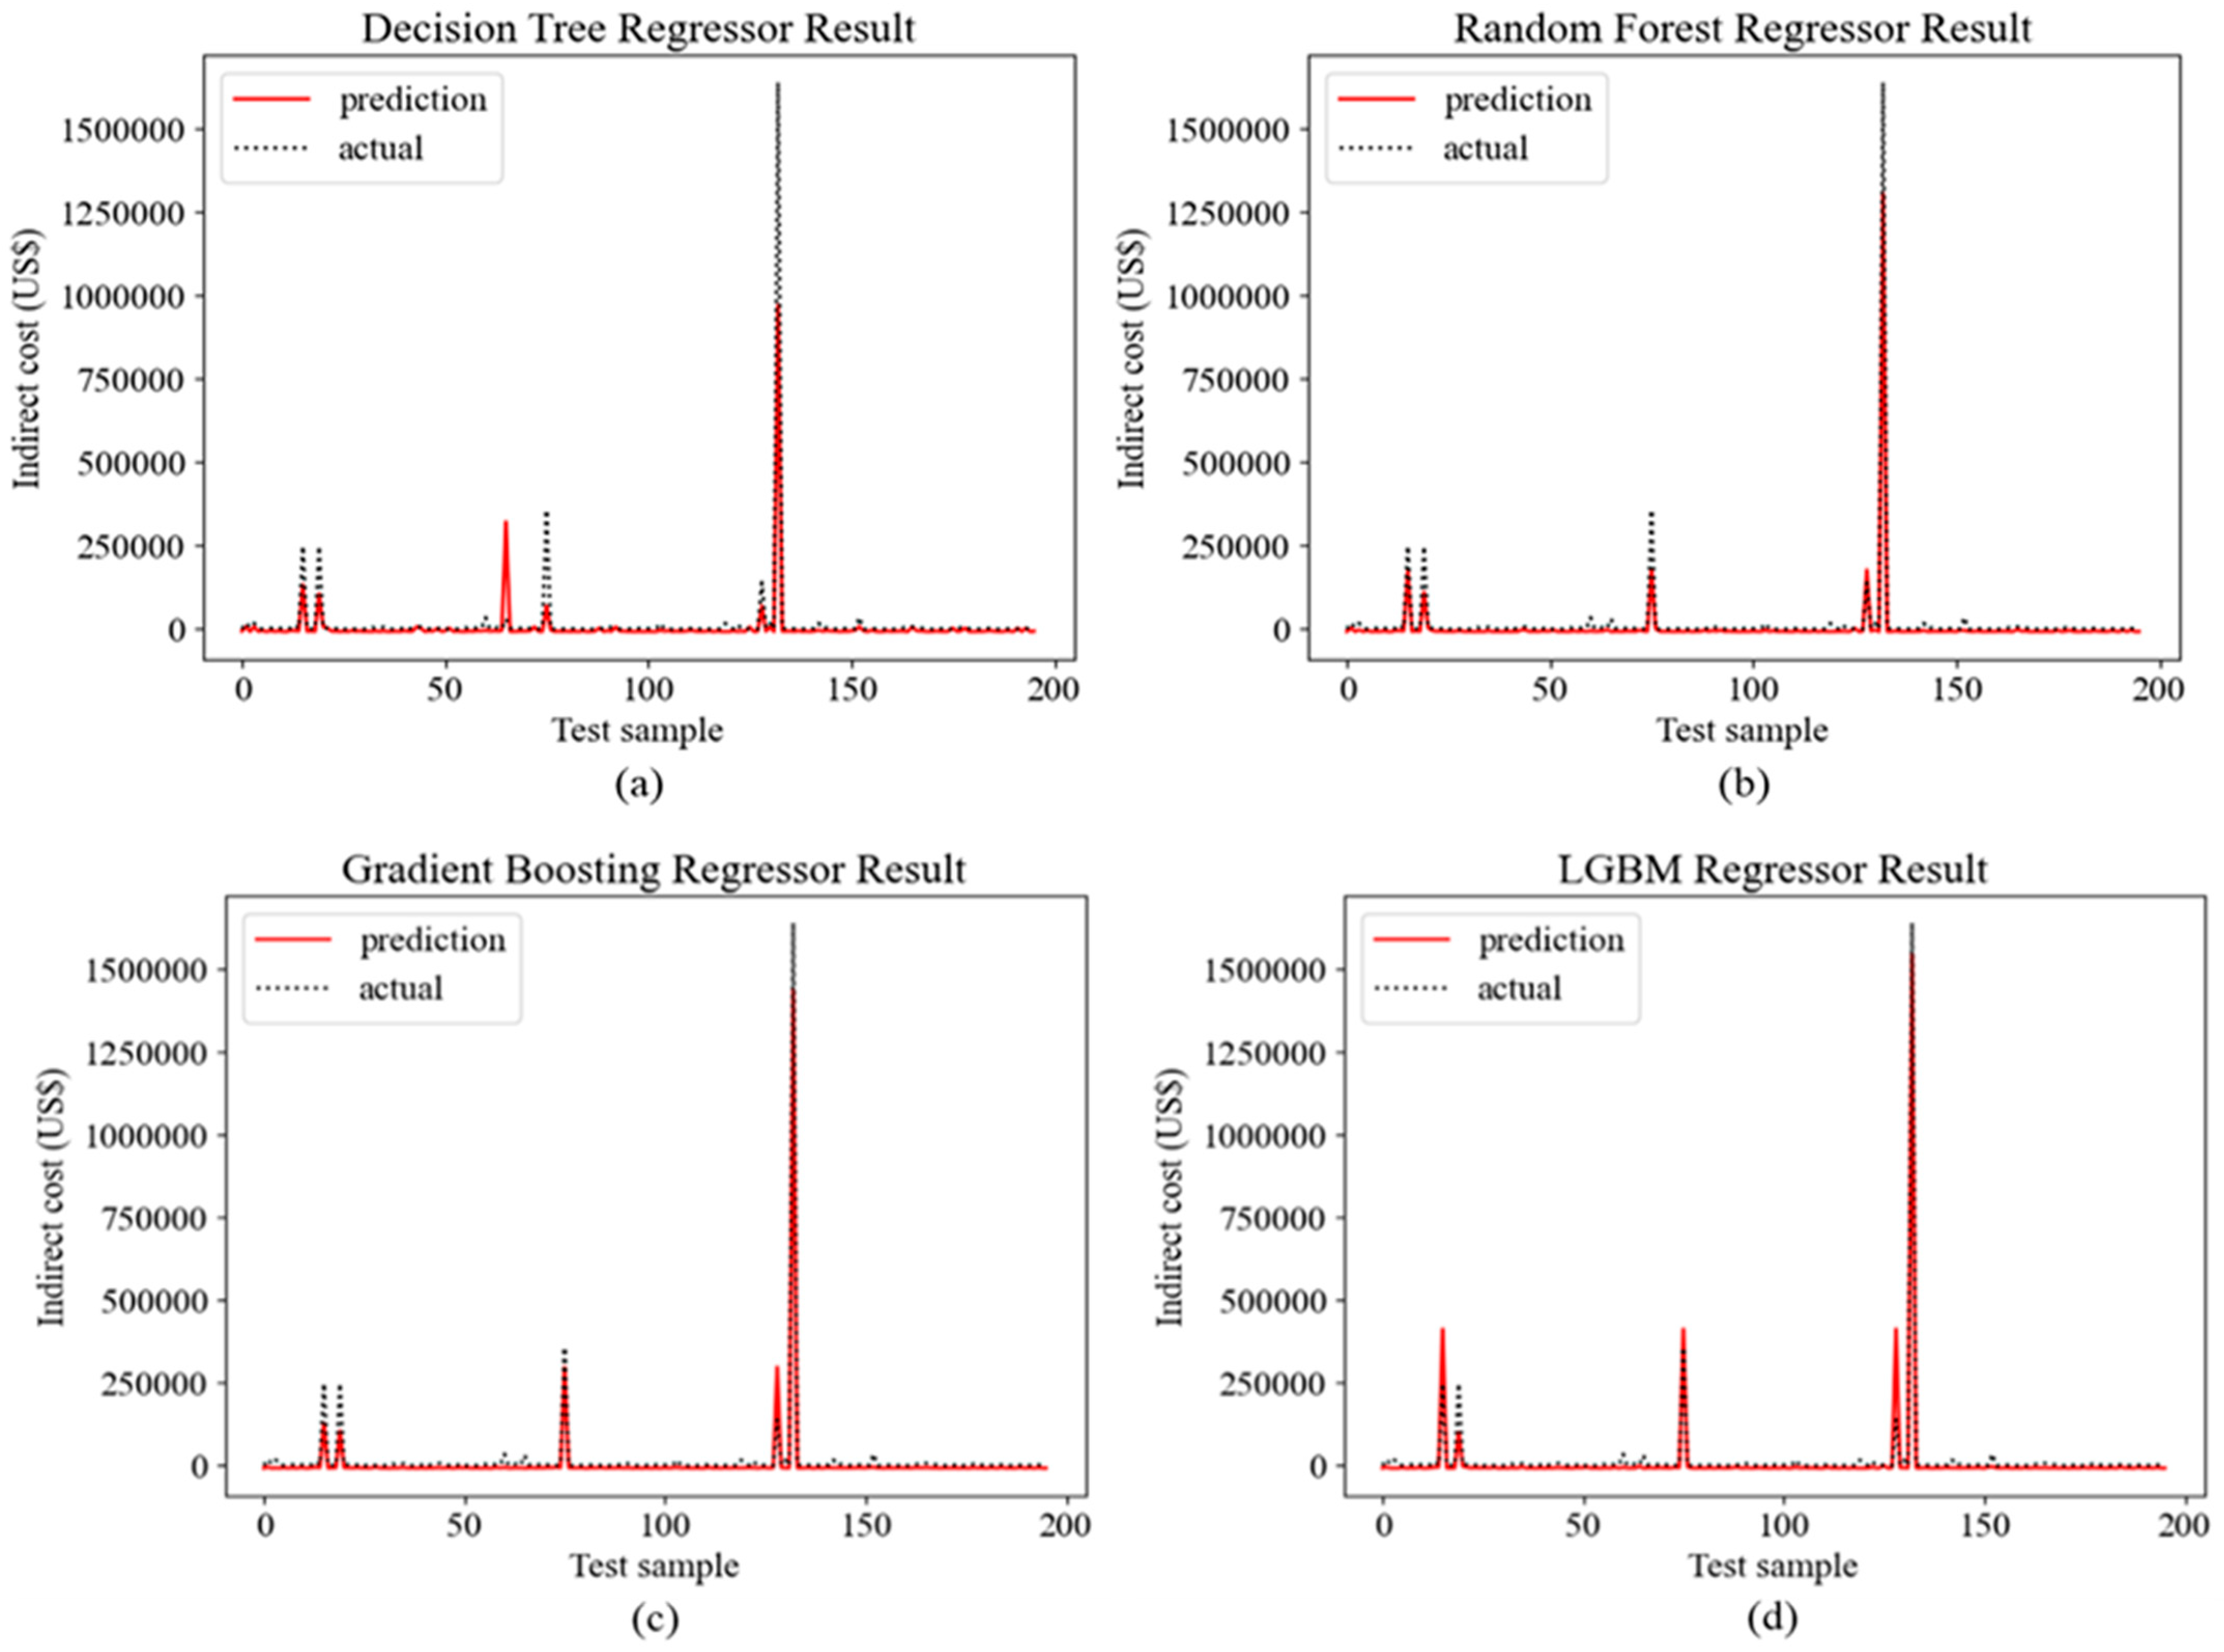
Figure 5 compares the actual and predicted indirect costs using regression models with the testing subset. The x-axis denotes the number of test samples and the y-axis represents the corresponding indirect costs. The red line shows the predicted costs, and the black dotted line represents the actual costs. Approximately 20% of the dataset, comprising 181 samples, was used for model testing and validation. Although Table 6 indicates a low MAE/MSE, the graphs reveal deviations in all models, which may be influenced by the transformed target regressor module used during training to scale the target values, as done by previous research [31]. The indirect cost data in Figure 5 varies widely, ranging from 0 to over 1.5 million USD. To mitigate the adverse effects of scattered data on the predictions, the module applies a logarithmic scaling to the target variable scales [55]. The MAE and MSE, calculated using the scaled values, were very low. Slight deviations were observed in the inverse transformation after training. However, these were within acceptable limits, indicating that the models did not overfit the training data. As is evident in Figure 5b, the RF regressor generally predicted lower values than the actual costs. The DT regressor also shows this trend, except for test sample number 67. The LGBM regressor does not show a clear trend, whereas the GB regressor tends to predict slightly higher values than actual costs, maintaining proximity when predicting indirect accident costs (Figure 5c). Based on these results, the GB regressor was found to be the best-performing model in the 2nd-tier of the proposed model. Thus, the final two-tiered prediction model is the k-NN classifier after applying the ROS in the 1st-tier and the GB regressor in the 2nd-tier.
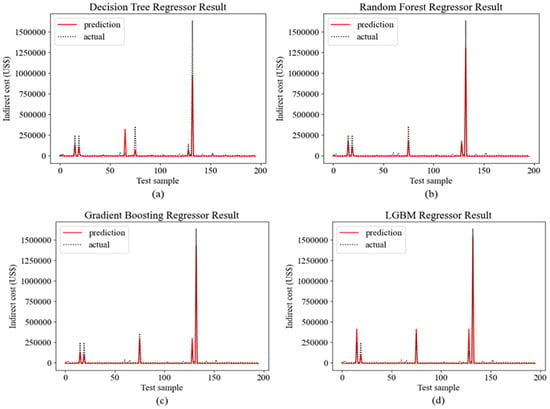
Figure 5.
(a) Decision Tree Regressor prediction performance (b) Random Forest Regressor prediction performance (c) Gradient Boosting Regressor prediction performance (d) LGBM Regressor prediction performance.
Finally, to validate the proposed two-tiered classification–regression model, we adopted a three-step validation process. First, we compared it with single-step machine learning regressors and a statistical regression model. Second, we compared it with conventional approaches for estimating indirect costs, such as ratio-based estimation for different types of construction projects. Lastly, we evaluated the cost–benefit by comparing the indirect cost estimations between the proposed approach and the conventional method. Table 7 lists the model comparison results in terms of R2, Table 8 presents examples of the ratio of direct to indirect accident costs for common types of construction projects, and Table 9 presents the cost–benefit comparison between the two approaches. In Table 7, It is evident that the proposed model outperforms both the single regressors and the statistical regression model. The machine learning regressors consider the same variables as the 2nd tier, except for the “total cost type,” as this information is derived from the 1st tier. This confirms the superiority of the two-tiered model for predicting indirect cost, with the data regarding the “total cost type” from the 1st tier having a significant influence on the outcomes.

Table 7.
Performance comparison with single regression models.

Table 8.
Comparison of ratio-based approach for different project types.

Table 9.
Comparative analysis between the two approaches.
In Table 8, five example ratios of direct to indirect accident costs are presented for different types of facility projects, including apartment buildings, business facilities, medical facilities, cultural and community spaces, and sewer systems. The highest number of accidents was recorded for apartment buildings, with an average ratio of 1:1.05 for 432 recorded events, which is higher than the 1.5:1 ratio reported by Teo and Feng [24]. Similarly, the other project types show varying ratios; the lowest is for business facilities (1:0.93), while the others exceed 1. Notably, cultural and community spaces have a ratio as high as 1:6.76, indicating significant risks. This may be due to their classification under Specialized Infrastructure (CT2), which often involves complex architectural and landscaping requirements that elevate accident severity and associated indirect costs. Additionally, the small number of cases (n = 23) in this category makes the average ratio more susceptible to outliers, leading to a higher observed value. What is particularly important is that the ratios vary considerably, as previously discussed, and thus, rather than relying on ratio-based estimation, the proposed data-mining-based method is more practical and accurate.
In Table 9, five cases are presented where the differences between the original indirect costs and the predicted indirect costs (third column) are compared, alongside the estimates obtained from the conventional ratio-based (1:4) method (fifth column). In all five cases, the predicted costs are notably closer to the original values, whereas the conventional method consistently overestimates the indirect costs. These results support the hypothesis that ratio-based estimation hinders accurate cost prediction and may negatively impact economic decision-making.
5.3. Research Findings, Significance and Practical Implementation Strategies
To further interpret the trained model, SHAP (SHapley Additive exPlanations) analysis was performed. SHAP is a model-agnostic interpretability technique that quantifies the contribution of each input feature to the model’s predictions. It attributes a “SHAP value” to each feature, indicating how much the feature pushes the prediction higher or lower relative to the model’s baseline output. Positive SHAP values imply that the feature increases the predicted value, while negative SHAP values indicate a reduction in the prediction. Figure S4 presents the SHAP analysis for the classification models, whereas Figure S5 presents the same for regression models.
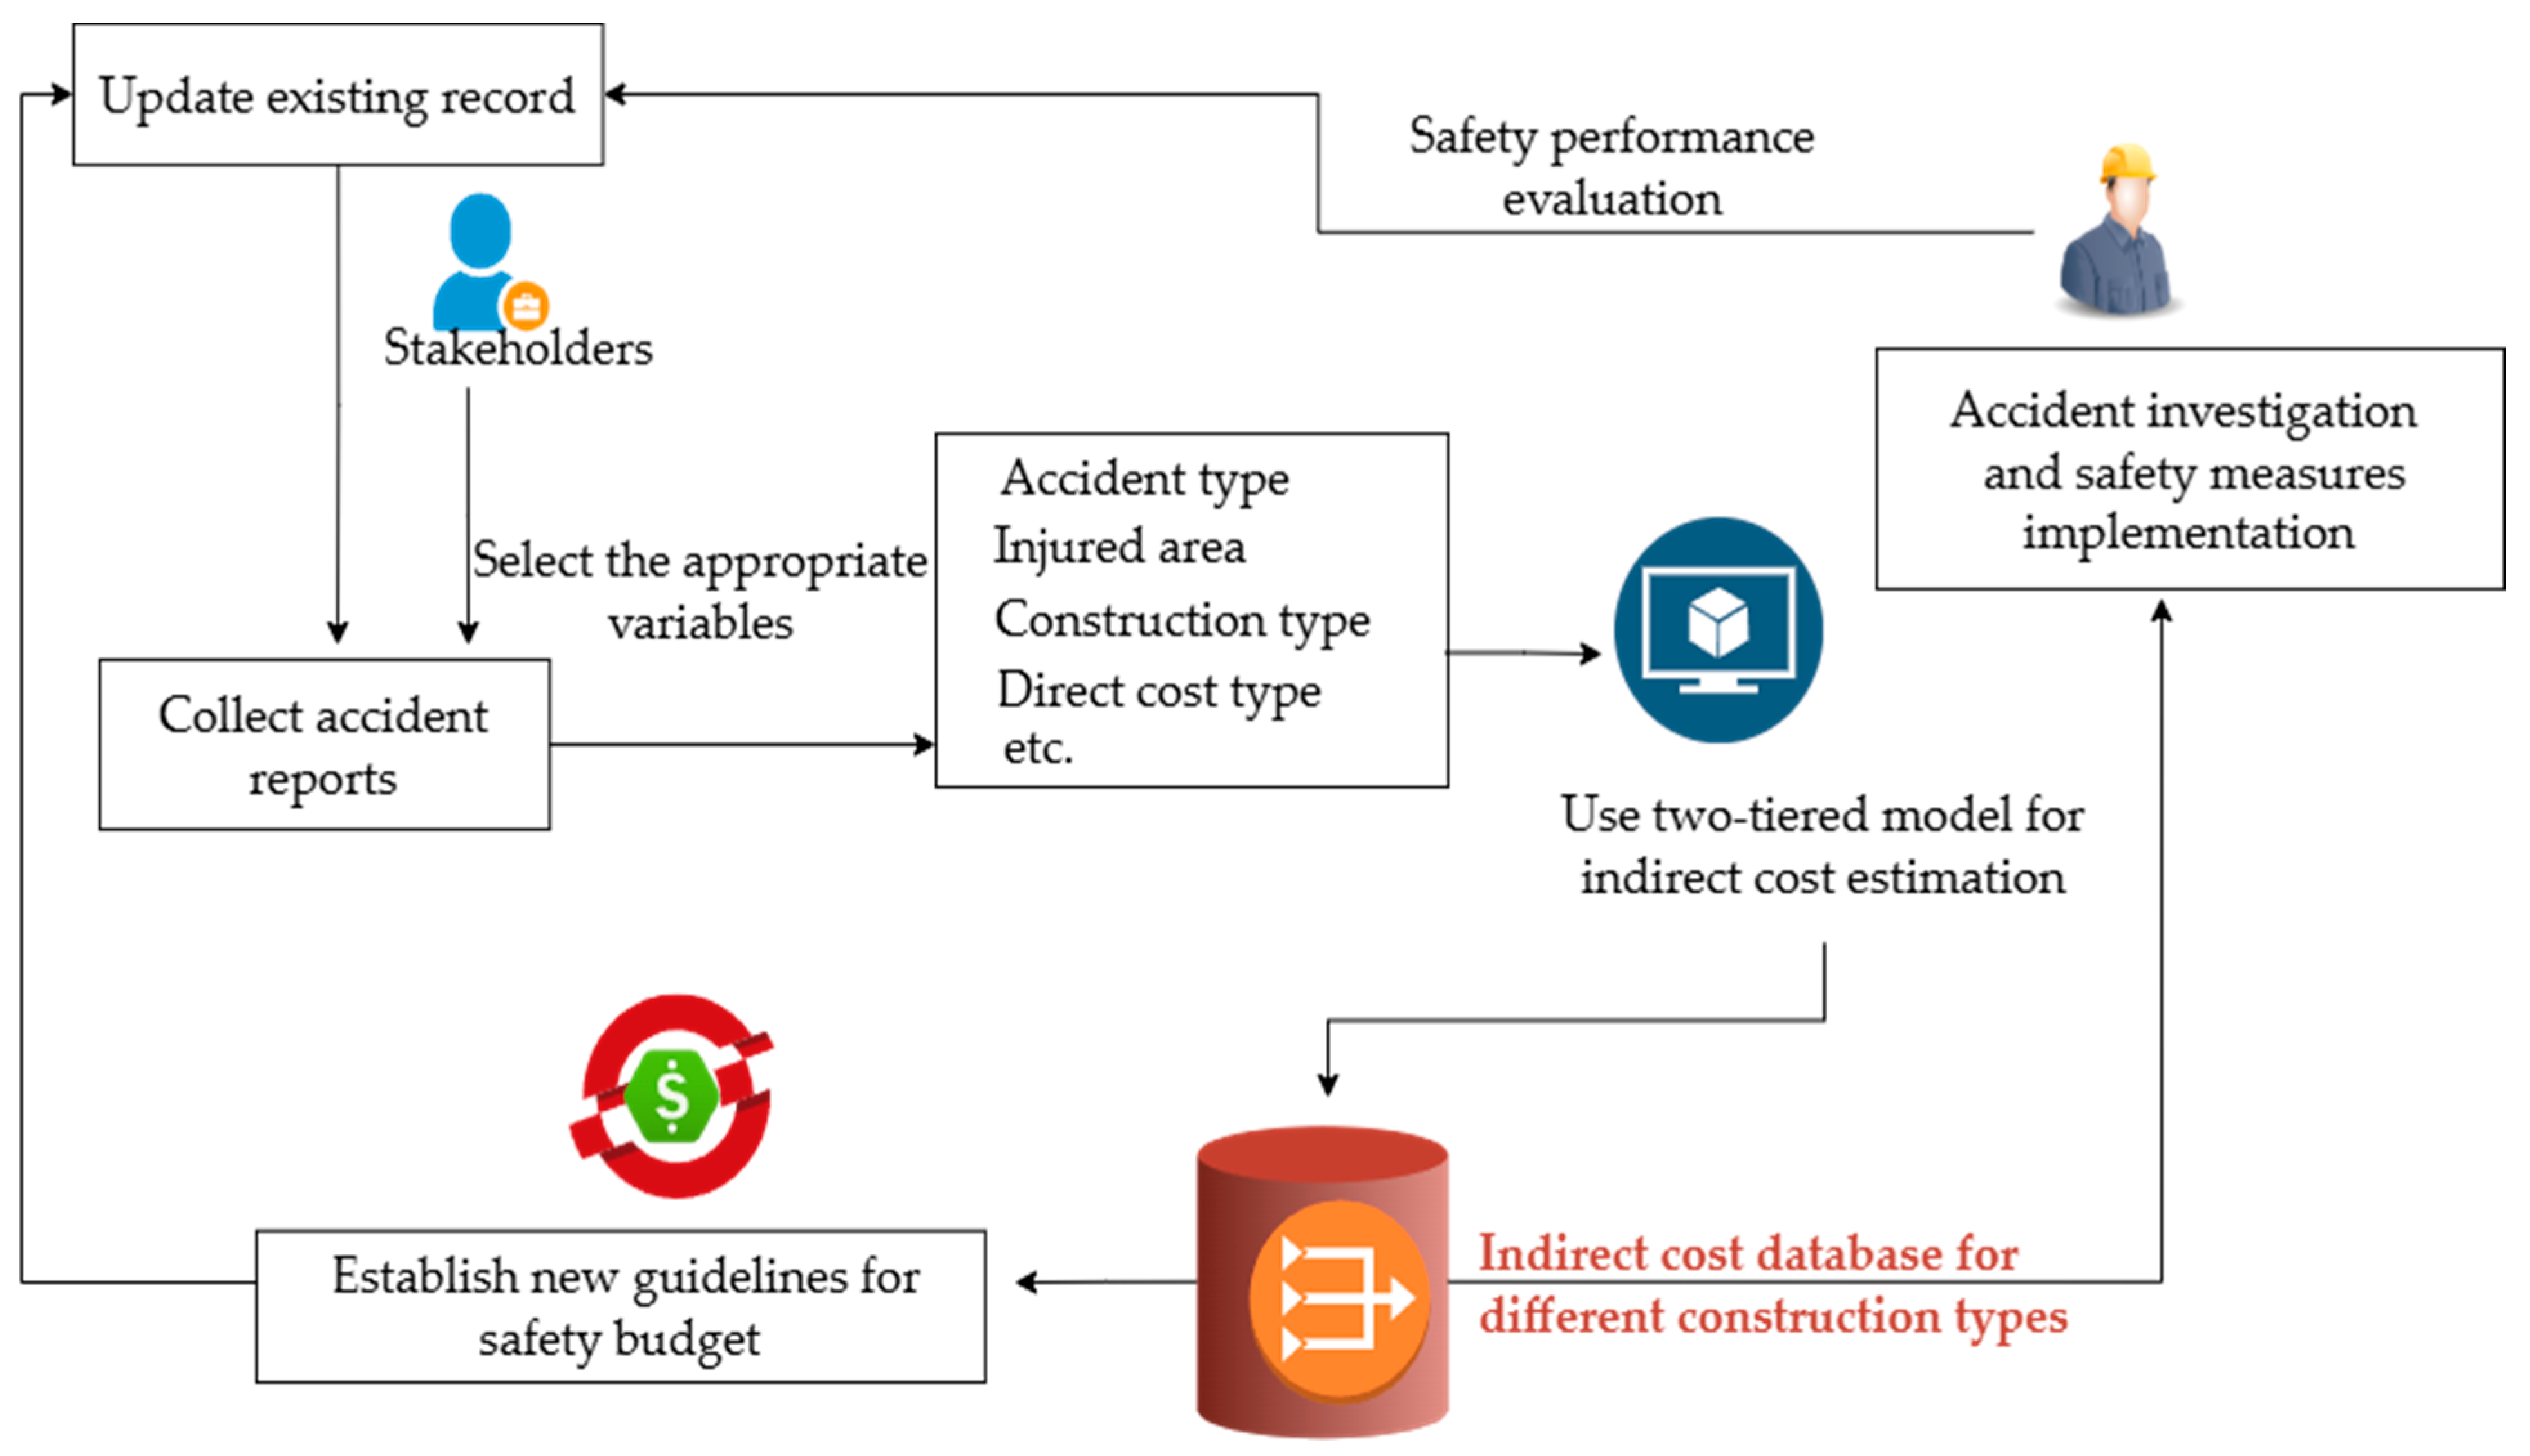
Based on the figures, direct costs was the most influential variable, consistently driving predictions of indirect costs higher when its value increased. Total cost type also had a major impact, with different categories associated with significant variations in predicted indirect costs. Number of injuries moderately influenced predictions, where a higher number of injuries tended to slightly raise the estimated indirect costs. In contrast, features such as direct cost type and number of deaths exhibited negligible or inconsistent influence. However, SHAP evaluates variables independently and does not capture potential interaction effects. Therefore, some variables that appear weak in isolation may still contribute meaningfully through interactions. These features should not be dismissed outright, and future research should investigate their combined effects to gain a more comprehensive understanding of their influence on indirect cost predictions. The results in Figure 5 show that it is possible to make predictions of indirect costs in near real time, thereby reducing the need for follow-up. The proposed method uses variables that are readily available in a company’s project reports, records, and accounting systems to predict the indirect cost, eliminating the need to follow up on indirect cost bills, which also saves time and resources significantly. Figure 6 shows the framework for the practical application of the proposed system.
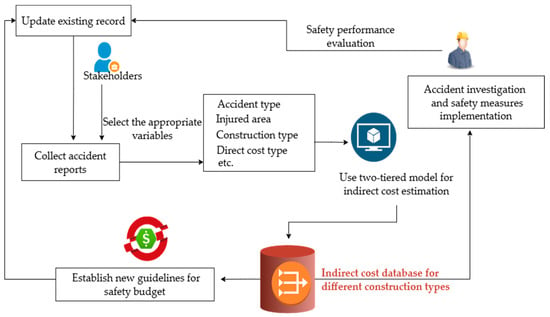
Figure 6.
Practical implementation in safety budget management.
When compared with conventional single-step statistical or regressor models, the proposed framework outperformed them, demonstrating that a single regressor is insufficient for estimating construction accident costs due to the complex relationships between accident variables. This finding suggests that a two-step or two-tiered approach is more suitable for accident research in the construction or related industries. Additionally, a ratio-based comparison revealed considerable variation in the established ratios reported in existing literature. This variation can be attributed to factors such as differences in cost components, the severity or type of accidents, project types, the number of victims, and other variables. A particularly important issue is the number of incidents used for ratio estimation; smaller sample sizes may result in inaccurate ratios. For instance, Teo and Feng [24] reported an indirect-to-direct cost ratio of 1.5:1 based on 47 building projects, whereas our study found a ratio of 1:1.05 based on 432 projects. This raises questions about the accuracy of ratio-based estimation methods. Table 8 further highlights the variability of ratios across different project types. As it is impractical to rely on different ratios for each project type, this underscores the necessity of a unified framework for indirect cost prediction.
Unlike previous methods based on historical ratios between direct and indirect costs, this approach provides immediate and practical insights that enables better budget management and resource allocation for indirect costs during an ongoing project as well as guide the development of new safety budget policies and provide insight into future construction projects, as illustrated in Figure 6. As managers, stakeholders, and owners prioritize cost figures, implementing the proposed accident cost model can keep them informed of the financial impact of accidents and encourage investment in workplace safety.
However, the proposed model is not fully automated and requires manual input at each iteration. Another limitation of this study is that the predicted indirect costs exclude some items due to data collection constraints. The proposed approach is a trial model for short-term prediction of indirect cost that focuses on the identifiable costs within the first few years after an incident. The present study identifies long-term social loss costs as a missing component in the current estimates. According to Allison et al. [18], long-term unemployment and fatality-related costs borne by stakeholders and employers can exceed 30%. In this regard, depending on the severity of the incident, the current model may underestimate the full extent of indirect losses by approximately 20–30%. Future iterations of the model will integrate additional data sources to capture these long-term impacts and enhance the accuracy and comprehensiveness of indirect cost predictions. Including these components will improve the model’s utility in strategic decision-making and policy development. The proposed model is adaptable to incremental learning, enabling partial fitting as new data become available. In practice, this involves using partial_fit()-capable models, continuously appending or streaming new accident records into the training pipeline, and validating model performance to ensure stability. Retraining frequency can be based on data availability, either at fixed intervals (e.g., quarterly) or after a threshold volume of new cases is reached.
The current model lacks inherent generalizability, as it was developed using data exclusively from Korean construction companies. While the framework is designed to be transferable across regions by retraining with localized datasets that reflect differences in labor laws, insurance systems, accident classification standards, and cost structures, several practical challenges may arise when applying the model internationally. First, the data collection process for this study required nearly two years, underscoring the time and resource demands for compiling comprehensive accident cost records. Moreover, variations in categorization practices across countries can impact model input compatibility. For example, some regions may only record corresponding work process types (Table S5) during the accident, without considering specific occupations of the worker (Table S6). Additionally, the classification schemes for construction project types may vary significantly across jurisdictions. Legal and regulatory differences, such as wage structures, insurance coverage policies, and the definitions of direct and indirect costs, also affect the model’s applicability. In the Korean context, higher reporting rates for construction accidents may result in cost structures that differ from those observed in countries with lower incident rates or alternative insurance systems. To mitigate issues related to how variations in cost item dynamics influence model outcomes, the proposed approach aggregates all relevant cost components into either direct or indirect categories, rather than analyzing individual items separately. Nonetheless, these contextual differences underscore the importance of carefully assessing whether the current model can be directly adapted or if a region-specific framework is warranted. In this regard, the outcomes of the SHAP analysis may offer valuable guidance; by identifying the relative importance of individual variables, regionally tailored models can be developed based on the availability and relevance of corresponding data. Once an appropriate structure is established, the model could be integrated into national databases to support continuous learning and adaptation. Therefore, this study provides an initial protocol for implementing advanced data-driven approaches to estimate indirect accident costs, offering a foundation for future research aimed at broader international applications.
6. Conclusions
Accidents and their associated costs not only harm the well-being of those affected but also jeopardize project success, company profits, and public reputation. Therefore, instead of relying on uniform ratios for direct and indirect accident costs, integrating predictive analytics is crucial. This approach enables policymakers and safety managers to accurately estimate costs, prioritize high-risk areas, allocate resources effectively, and implement proactive preventive measures.
In this context, we propose a two-tiered indirect cost prediction model proposed that uses multiple classifiers and regressors, based on the collection of 1036 accident cases. In the first tier, the k-NN classifier with ROS achieved over 90% accuracy, precision, recall, f1-score, and cross-validation score. In the second tier, the GB regressor outperformed the others, with an R2 of 0.95, a training MAE of 0.1, and a training MSE of 0.21. By combining these best-performing models, a final two-tiered predictive model was developed for estimating indirect accident costs. This approach outperforms conventional statistical regression models or ratio-based estimation and effectively captures the complex nonlinear relationships between different factors contributing to construction accidents and their costs.
The proposed methodology is applicable in real time, and offers an immediate and pragmatic approach. When an accident occurs on a construction site, the direct costs can be estimated almost immediately based on the medical expenses and immediate treatment of the injured. Therefore, this direct cost data shortly after an accident, along with other relevant variables, such as the number of fatalities, the number of injuries, the type of construction and accident, the specifics of the work process, the location of the injury, the type of workplace, and the workers’ affiliation, can be used in the proposed model to first categorize the nature of the total cost. This initial categorization provides an approximate range of total accident costs. However, a second-tier regression model was used to accurately determine indirect costs. This second-tier model leverages the predicted total cost category from the first tier, in conjunction with other known variables, such as the number of fatalities, number of injuries, direct costs, and the type of direct cost, to forecast the indirect costs in real time.
This study has made several important contributions. It collected a considerable amount of data on the indirect costs of construction accidents for in-depth analysis and insight generation. In this study, an innovative method was introduced for quantifying the indirect costs of construction accidents. This model is adaptable to incremental learning and allows for regular updates based on new data. A national accident database can be created on a countrywide scale, and the proposed model can be integrated with it to ensure continuous improvement. Accident cost is the most accurate indicator for risk assessment, and such integration can also significantly assist in risk quantification for specific construction project types based on existing records. Ultimately, the entire system can be utilized to formulate safety standards and policies from government, corporate, and academic perspectives. The problem of data imbalance was also tackled in this study, which is a notable problem in the construction industry, and improved generalization of the classifier was demonstrated through the implementation of ROS.
Despite careful efforts, this study has several limitations. Notably, it does not account for certain difficult-to-track cost items, potentially leading to indirect cost estimates that underrepresent actual expenses. Another limitation is the limited dataset size, due in part to the common practice among contractors of not systematically tracking indirect cost data. These factors suggest that some indirect costs and variability may not be fully captured in the model. Data preprocessing decisions also introduced constraints. In this analysis, no outlier detection or missing-data imputation was performed, under the assumption that survey responses were internally consistent and complete. However, given the self-reported nature of the financial data, such assumptions may have introduced unintended bias. To improve data integrity and predictive performance, future research should incorporate systematic preprocessing procedures, including robust outlier detection methods and appropriate handling of missing values. Although a low MSE was achieved on the scaled values, some deviations emerged when transforming the target and output values back to their original scale. Oversampling and undersampling were employed to create a more balanced training set; however, these techniques can alter the statistical distribution of the data. In some cases, resampling may lead to overfitting or the loss of important information, thereby affecting model robustness. Moreover, this study did not include a sensitivity analysis to examine how different random seeds or sampling proportions might influence model performance. To enhance robustness and generalizability, future research should investigate the model’s stability under varying conditions. For example, techniques such as repeated trials with different random splits or alternative balancing methods like SMOTE, ADASYN or stratified bootstrapping could be used to ensure the model’s performance is not an artifact of a particular sample or random seed.
A further limitation is the lack of external validation. All data used for training and testing originated from this single study, so the model’s effectiveness has not been confirmed on independent accident cost datasets. Therefore, future work should prioritize validating the model on an independent dataset of construction accident records to confirm its predictive accuracy and practical utility beyond the original sample. Additionally, visual examples of construction accidents with higher indirect costs could serve as useful illustrations to better convey the extent and impact of such incidents, and their inclusion is recommended in future research.
Finally, the study’s comparative scope was limited to conventional ratio-based estimates. However, multiple other cost-estimation approaches exist in the literature, including parametric models, expert judgment-based methods, capacity factor models, and frameworks based on Bayesian or fuzzy logic, as well as methods that incorporate dimensionality reduction techniques. Future iterations of this research should incorporate more comprehensive comparisons with alternative cost estimation techniques to better contextualize the proposed model within the broader landscape of estimation methodologies.
Additionally, future studies should consider incorporating hierarchical organizational structures to capture inter-company variations in safety culture, management practices, and decision-making processes that may significantly influence accident outcomes and associated costs. For instance, companies with centralized versus decentralized safety oversight may exhibit differing patterns in risk mitigation and cost recovery. Likewise, integrating contract-specific information, such as project delivery methods (such as, design-build vs. traditional), penalty clauses for delays, insurance coverage, or subcontractor involvement, could provide deeper insights into the financial repercussions of accidents. Such enriched modeling frameworks would better position the proposed methodology within the broader landscape of cost estimation research and clearly articulate its novel contributions.
Supplementary Materials
The following supporting information can be downloaded at https://www.mdpi.com/article/10.3390/buildings15213947/s1: Figure S1: Learning curves for 1st-tier classification models (Regular approach). Figure S2: Learning curves for 1st-tier classification models (ROS approach). Figure S3: Learning curves for 1st-tier classification models (RUS approach). Figure S4: SHAP analysis for 1st-tier classification models. Figure S5: SHAP analysis for 2nd-tier regression models. Table S1: Construction type codes and descriptions. Table S2: Worker affiliation codes and descriptions. Table S3: Victim work experience codes and descriptions. Table S4: Accident type codes and descriptions. Table S5: Work process codes and descriptions. Table S6: Occupation type of workers. Table S7: Day of the week codes. Table S8: Indirect cost type classifications. Table S9: Direct cost type classifications. Table S10: Total cost type classifications. Table S11: Injury code details.
Author Contributions
Conceptualization, A.M.C. and J.-H.C.; methodology, A.M.C. and E.-J.H.; software, A.M.C.; validation, A.M.C. and J.-H.C.; formal analysis, A.M.C. and E.-J.H.; investigation, A.M.C. and E.-J.H.; resources, J.-J.Y., J.-H.C. and S.I.P.; data curation, A.M.C. and E.-J.H.; writing—original draft preparation A.M.C. and J.-H.C.; writing—review and editing, A.M.C. and J.-H.C.; visualization, A.M.C.; supervision, J.-H.C.; project administration, J.-H.C. and J.-J.Y.; funding acquisition, S.I.P. All authors have read and agreed to the published version of the manuscript.
Funding
This research was supported by the Korea Agency for Infrastructure Technology Advancement (KAIA), funded by the Ministry of Land, Infrastructure, and Transport (RS-2020-KA156208).
Data Availability Statement
Data will be made available on request. The code for training the two-tiered machine learning model can be found in the following GitHub repository: https://github.com/AyeshaM67/Construction-accident-cost-prediction.git (accessed on 9 September, 2025).
Acknowledgments
During the preparation of this manuscript, the authors used ChatGPT for the purposes of grammatical correction.
Conflicts of Interest
The authors declare no conflicts of interest.
References
- Bang, S.; Jeong, J.; Lee, J.; Jeong, J.; Soh, J. Evaluation of Accident Risk Level Based on Construction Cost, Size and Facility Type. Sustainability 2023, 15, 1565. [Google Scholar] [CrossRef]
- Ministry of Employment and Labor. 2022 Industrial Accident Status Analysis Report. Republic of Korea. Available online: https://www.moel.go.kr/policy/policydata/view.do?bbs_seq=20231201612 (accessed on 8 May 2024).
- Safe Work Australia. Australian WHS Strategy 2023–2033: Baseline Report. Available online: https://www.safeworkaustralia.gov.au/sites/default/files/2023-02/Australian%20WHS%20Strategy%202023-33.pdf (accessed on 28 September 2025).
- Selleck, R.; Cattani, M.; Hassall, M. Proposal for and validation of novel risk-based process to reduce the risk of construction site fatalities (Major Accident Prevention (MAP) program). Saf. Sci. 2023, 158, 105986. [Google Scholar] [CrossRef]
- Jaselskis, E.J.; Anderson, S.D.; Russell, J.S. Strategies for achieving excellence in construction safety performance. J. Constr. Eng. Manag. 1996, 122, 61–70. [Google Scholar] [CrossRef]
- Hinze, J. Construction Safety, 2nd ed.; Prentice-Hall: Hoboken, NJ, USA, 2006; p. 63. [Google Scholar]
- Pellicer, E.; Carvajal, G.I.; Rubio, M.C.; Catalá, J. A method to estimate occupational health and safety costs in construction projects. KSCE J. Civ. Eng. 2014, 18, 1955–1965. [Google Scholar] [CrossRef]
- Heinrich, H.W. Industrial Accident Prevention: A Scientific Approach (1931 for the 1st ed.; 1941 for the 2nd ed.), 4th ed.; McGraw Hill: New York, NY, USA, 1959; p. 2. [Google Scholar]
- LaBelle, J.E. What do accidents truly cost? Determining Total Incident Costs. Prof. Saf. 2000, 45, 38–42. [Google Scholar]
- Jallon, R.; Imbeau, D.; de Marcellis-Warin, N. Development of an indirect-cost calculation model suitable for workplace use. J. Saf. Res. 2011, 42, 149–164. [Google Scholar] [CrossRef]
- Brody, B.; Létourneau, Y.; Poirier, A. An indirect cost theory of work accident prevention. J. Occup. Accid. 1990, 13, 255–270. [Google Scholar] [CrossRef]
- Hinze, J.; Appelgate, L.L. Costs of construction injuries. J. Constr. Eng. Manag. 1991, 117, 537–550. [Google Scholar] [CrossRef]
- Sun, L.; Paez, O.; Lee, D.; Salem, S.; Daraiseh, N. Estimating the uninsured costs of work-related accidents, part I: A systematic review. Theor. Issues Ergon. Sci. 2006, 7, 227–245. [Google Scholar] [CrossRef]
- Manuele, F.A. Accident Costs. Prof. Saf. 2011, 56, 39–47. [Google Scholar]
- Haupt, T.C.; Pillay, K. Investigating the true costs of construction accidents. J. Eng. Des. Technol. 2016, 14, 373–419. [Google Scholar] [CrossRef]
- Nik Mohd Ainul Azman, N.N.K.; Che Ahmad, A.; Mohd Derus, M.; Mohd Kamar, I.F. Determination of direct to indirect accident cost Ratio for railway construction project. MATEC Web Conf. 2019, 266, 03009. [Google Scholar] [CrossRef]
- Gavious, A.; Mizrahi, S.; Shani, Y.; Minchuk, Y. The costs of industrial accidents for the organization: Developing methods and tools for evaluation and cost–benefit analysis of investment in safety. J. Loss Prev. Process. Ind. 2009, 22, 434–438. [Google Scholar] [CrossRef]
- Allison, R.W.; Hon, C.K.; Xia, B. Construction accidents in Australia: Evaluating the true costs. Saf. Sci. 2019, 120, 886–896. [Google Scholar] [CrossRef]
- Turkyilmaz, A.H.; Polat, G. Risk-based completion cost overrun ratio estimation in construction projects using machine learning classification algorithms: A case study. Buildings 2024, 14, 3541. [Google Scholar] [CrossRef]
- Chen, L.; Xu, C.; Lim, W.H.; Sharma, A.; Tiang, S.S.; Chong, K.S.; El-kenawy, E.S.M.; Alhussan, A.A.; Eid, M.M.; Khafaga, D.S. Transparent and reliable construction cost prediction using advanced machine learning and explainable AI. Eng. Sci. Technol. Int. J. 2025, 70, 102159. [Google Scholar] [CrossRef]
- Jafary, P.; Shojaei, D.; Rajabifard, A.; Ngo, T. AI-augmented construction cost estimation: An ensemble natural language processing (NLP) model to align quantity take-offs with cost indexes. Int. J. Constr. Manag. 2025, 1–19. [Google Scholar] [CrossRef]
- Leopold, E.; Leonard, S. Costs of construction accidents to employers. J. Occup. Accid. 1987, 8, 273–294. [Google Scholar] [CrossRef]
- Choi, S.D. A survey of the safety roles and costs of injuries in the roofing contracting industry. J. Saf. Health Environ. Res. 2006, 3, 1–20. [Google Scholar]
- Teo, E.A.L.; Feng, Y. Costs of construction accidents to Singapore contractors. Int. J. Constr. Manag. 2011, 11, 79–92. [Google Scholar] [CrossRef]
- Chen, F.; Deng, P.; Wan, J.; Zhang, D.; Vasilakos, A.V.; Rong, X. Data mining for the internet of things: Literature review and challenges. Int. J. Distrib. Sens. Netw. 2015, 11, 431047. [Google Scholar] [CrossRef]
- Lee, M.J.; Hanna, A.S.; Loh, W.Y. Decision tree approach to classify and quantify cumulative impact of change orders on productivity. J. Comput. Civ. Eng. 2004, 18, 132–144. [Google Scholar] [CrossRef]
- Son, J.H.; Kim, C.Y. A study on the model of artificial neural network for construction cost estimation of educational facilities at conceptual stage. Korean J. Constr. Eng. Manag. 2006, 7, 91–99. [Google Scholar]
- Chou, J.S.; Tsai, C.F. Concrete compressive strength analysis using a combined classification and regression technique. Autom. Constr. 2012, 24, 52–60. [Google Scholar] [CrossRef]
- Tixier, A.J.P.; Hallowell, M.R.; Rajagopalan, B.; Bowman, D. Application of machine learning to construction injury prediction. Autom. Constr. 2016, 69, 102–114. [Google Scholar] [CrossRef]
- Ayhan, B.U.; Tokdemir, O.B. Predicting the outcome of construction incidents. Saf. Sci. 2019, 113, 91–104. [Google Scholar] [CrossRef]
- Pham, T.Q.D.; Le-Hong, T.; Tran, X.V. Efficient estimation and optimization of building costs using machine learning. Int. J. Constr. Manag. 2021, 23, 909–921. [Google Scholar] [CrossRef]
- Shahani, N.M.; Kamran, M.; Zheng, X.; Liu, C.; Guo, X. Application of gradient boosting machine learning algorithms to predict uniaxial compressive strength of soft sedimentary rocks at Thar Coalfield. Adv. Civ. Eng. 2021, 2021, 2565488. [Google Scholar] [CrossRef]
- Choi, J.W.; Kim, H.S. Predictive Analytics Model for Death Accidents in Building Projects by Trade—Based on Decision Tree. Korean J. Constr. Eng. Manag. 2021, 22, 55–65. [Google Scholar] [CrossRef]
- Wang, J.; Ye, A.; Wang, X. Quantifying Easy-to-Repair Displacement Ductility and Lateral Strength of Scoured Bridge Pile Group Foundations in Cohesionless Soils: A Classification–Regression Combination Surrogate Model. J. Bridg. Eng. 2023, 28, 04023080. [Google Scholar] [CrossRef]
- Devos, O.; Ruckebusch, C.; Durand, A.; Duponchel, L.; Huvenne, J.P. Support vector machines (SVM) in near infrared (NIR) spectroscopy: Focus on parameters optimization and model interpretation. Chemom. Intell. Lab. Syst. 2009, 96, 27–33. [Google Scholar] [CrossRef]
- Chiang, Y.H.; Wong, F.K.W.; Liang, S. Fatal construction accidents in Hong Kong. J. Constr. Eng. Manag. 2018, 144, 04017121. [Google Scholar] [CrossRef]
- Wong, L.; Wang, Y.; Law, T.; Lo, C.T. Association of Root Causes in Fatal Fall-from-Height Construction Accidents in Hong Kong. J. Constr. Eng. Manag. 2016, 142, 04016018. [Google Scholar] [CrossRef]
- Hatami, S.E.; Ravandi, M.R.G.; Hatami, S.T.; Khanjani, N. Epidemiology of work-related injuries among insured construction workers in Iran. Electron. Physician 2017, 9, 5841–5847. [Google Scholar] [CrossRef] [PubMed][Green Version]
- Koc, K.; Ekmekcioğlu, Ö.; Gurgun, A.P. Integrating feature engineering, genetic algorithm and tree-based machine learning methods to predict the post-accident disability status of construction workers. Autom. Constr. 2021, 131, 103896. [Google Scholar] [CrossRef]
- Korea Workers’ Compensation & Welfare Service. Industrial Accident Insurance Collection & Payment Status; Korea Workers’ Compensation & Welfare Service: Sejong, Republic of Korea, 2018. [Google Scholar]
- Vargas, W.; Aranda, S.; Costa, S. Imbalanced data preprocessing techniques for machine learning: A systematic mapping study. Knowl. Inf. Syst. 2023, 65, 31–57. [Google Scholar] [CrossRef]
- Koc, K.; Ekmekcioğlu, Ö.; Gurgun, A.P. Prediction of construction accident outcomes based on an imbalanced dataset through integrated resampling techniques and machine learning methods. Eng. Constr. Arch. Manag. 2023, 30, 4486–4517. [Google Scholar] [CrossRef]
- Choi, J.; Gu, B.; Chin, S.; Lee, J.S. Machine learning predictive model based on national data for fatal accidents of construction workers. Autom. Constr. 2020, 110, 102974. [Google Scholar] [CrossRef]
- Choudhry, R.M.; Hinze, J.W.; Arshad, M.; Gabriel, H.F. Subcontracting practices in the construction industry of Pakistan. J. Constr. Eng. Manag. 2012, 138, 1353–1359. [Google Scholar] [CrossRef]
- Nguyen, H.; Vu, T.; Vo, T.P.; Thai, H.T. Efficient machine learning models for prediction of concrete strengths. Constr. Build. Mater. 2021, 266, 120950. [Google Scholar] [CrossRef]
- Takyi-Annan, G.E.; Zhang, H. A Multivariate Analysis of the Variables Impacting the Level of BIM Expertise of Professionals in the Architecture, Engineering and Construction (AEC) Industries of the Developing World Using Nonparametric Tests. Buildings 2023, 13, 1606. [Google Scholar] [CrossRef]
- Vakharia, V.; Gujar, R. Prediction of compressive strength and portland cement composition using cross-validation and feature ranking techniques. Constr. Build. Mater. 2019, 225, 292–301. [Google Scholar] [CrossRef]
- Buckland, M.; Gey, F. The relationship between recall and precision. J. Am. Soc. Inf. Sci. 1994, 45, 12–19. [Google Scholar] [CrossRef]
- Prabowo, R.; Thelwall, M. Sentiment analysis: A combined approach. J. Informetr. 2009, 3, 143–157. [Google Scholar] [CrossRef]
- Attal, F.; Mohammed, S.; Dedabrishvili, M.; Chamroukhi, F.; Oukhellou, L.; Amirat, Y. Physical human activity recognition using wearable sensors. Sensors 2015, 15, 31314–31338. [Google Scholar] [CrossRef]
- Rico-Juan, J.R.; de La Paz, P.T. Machine learning with explainability or spatial hedonics tools? An analysis of the asking prices in the housing market in Alicante, Spain. Expert Syst. Appl. 2021, 171, 114590. [Google Scholar] [CrossRef]
- Moon, S.; Chowdhury, A.M. Utilization of prior information in neural network training for improving 28-day concrete strength prediction. J. Constr. Eng. Manag. 2021, 147, 04021028. [Google Scholar] [CrossRef]
- Peng, H.; Wu, H.; Wang, J.; Dede, T. Research on the prediction of the water demand of construction engineering based on the BP neural network. Adv. Civ. Eng. 2020, 1, 8868817. [Google Scholar] [CrossRef]
- Bentéjac, C.; Csörgő, A.; Martínez-Muñoz, G. A comparative analysis of gradient boosting algorithms. Artif. Intell. Rev. 2021, 54, 1937–1967. [Google Scholar] [CrossRef]
- Patel, R.S.; Akolekar, H.D. Machine-learning based optimization of a biomimiced herringbone microstructure for superior aerodynamic performance. Eng. Res. Express 2023, 5, 045065. [Google Scholar] [CrossRef]
Disclaimer/Publisher’s Note: The statements, opinions and data contained in all publications are solely those of the individual author(s) and contributor(s) and not of MDPI and/or the editor(s). MDPI and/or the editor(s) disclaim responsibility for any injury to people or property resulting from any ideas, methods, instructions or products referred to in the content. |
© 2025 by the authors. Licensee MDPI, Basel, Switzerland. This article is an open access article distributed under the terms and conditions of the Creative Commons Attribution (CC BY) license (https://creativecommons.org/licenses/by/4.0/).

