Abstract
By designing and conducting indoor model tests on single piles and 2 × 2 pile groups under four working conditions—underlying cave, overlying cave, pile penetrating underlying cave, and beaded caves—the failure mode of the roof was explored, and its ultimate bearing capacity was analyzed and compared. Unlike previous studies that focused on single piles in isolation, this paper combines scaled laboratory tests with validated 3D finite element analysis to systematically compare the bearing behaviors of single piles and pile groups under different karst roof conditions. After verifying the model in ABAQUS using the experimental parameters, the researchers established a 3D model of single piles and 2 × 2 pile groups, considering different roof thicknesses, roof spans, cave heights, pile-hole eccentricities, and roof inclination angles. The bearing capacities of single piles and pile groups were analyzed and compared, and the bearing-capacity-improvement factors of pile groups under various working conditions were proposed. The research results show that increasing roof thickness enhances the bearing capacity of both single piles and pile groups, with single piles experiencing more significant improvements. Pile groups boost roof bearing capacity by 455.6% compared to single piles. Conversely, larger roof spans reduce the bearing capacity of both pile types, though pile groups show greater vulnerability to span-related reductions. Notably, increasing pile-hole eccentricity significantly improves the bearing capacity of both configurations. When roof inclination increases, bearing capacity decreases for both systems, with single piles demonstrating greater susceptibility to inclination-induced weakening. These findings reveal distinct mechanical behaviors: pile groups offer stability advantages against span and inclination changes, while single piles benefit more from thickness increases. This divergence highlights the importance of aligning pile configuration with specific structural parameter requirements in engineering design; under different roof sensitivity factors, the bearing capacity improvement of 2 × 2 pile groups relative to single piles is different, and several pile group bearing-capacity-improvement coefficients for five roof sensitivity factors are summarized, and the corresponding and interpolated pile-group bearing-capacity-improvement coefficients are selected when selecting; the influence of the five sensitivity factors is ranked as follows: pile-hole eccentricity > roof thickness > inclination angle > roof span > cave height.
1. Introduction
Karst landforms are widely distributed in my country, especially in the central and western regions [1,2]. Karst cavities frequently exert substantial influence on foundation bearing capacity, posing significant challenges for engineering projects [3,4]. Pile foundations, however, have achieved widespread application across diverse construction types, primarily owing to their benefits of simplified installation procedures and robust adaptability to complex geological environments. This contrast underscores a practical engineering dynamic: while karst terrain introduces complications through cavity-induced bearing-capacity issues, pile foundations offer a versatile solution by balancing construction efficiency with geological resilience. The cited references likely elaborate on specific failure mechanisms of karstic foundations and the mechanical advantages of pile-supported systems in such contexts. They effectively bear the upper load and control settlement [5,6,7,8,9,10,11]. However, when pile foundations are constructed in karst areas, there may be underlying karst caves at the pile ends. Karst ground conditions often lead to catastrophic collapses, in which the bearing capacity of the roof significantly influences the overall load-bearing performance of the pile foundation system. Inadequate roof thickness can precipitate severe engineering safety hazards. Consequently, investigating the load-transfer mechanisms and capacity characteristics of both the pile foundation and roof holds critical importance for karst-area foundation design. Improper thickness design could compromise the entire system’s stability, making targeted research into their combined mechanical behavior essential for safe and economical karst construction projects.
In the research on karst pile foundations and roof conditions, scholars have adopted numerical simulation, indoor model tests, theoretical analysis, and other technical approaches to investigate the bearing capacity and stability of these structures from multiple perspectives. In model test research, Zhao et al. [12] designed experiments with simulated sub-pile cavities to examine the bearing capacity interplay between pile foundations and roofs. Li et al. [13] adopted a hybrid theoretical–numerical approach to investigate the lateral load-bearing behavior of pile foundations. Meanwhile, Zhao et al. [14] conducted physical model tests to analyze the shear performance of roofs across varying thickness–span ratios, successfully deriving empirical shear failure generatrix models specific to different ratio scenarios. Lei et al. [15] considered factors such as roof thickness and pile-hole eccentricity, obtained the roof bearing capacity and failure body morphology under various working conditions. In numerical simulation research, Chen et al. [16] explored the influence of factors such as roof thickness, span, and cave height on the roof bearing. Asgari et al. [17] developed three-dimensional finite element models to investigate how pile-group parameters—including pile count and spatial arrangement—influence load-bearing performance. Zheng et al. [18], meanwhile, focused on dynamic behavior, conducting numerical simulations of three-dimensional soil–pile vibration interactions. Wu et al. [19] considered the horizontal response of pile foundations under construction disturbance. He et al. [20] explored the dynamic response of pile groups adjacent to shield tunnels. Li et al. [21] reconstructed the soil granular medium based on a three-dimensional visual model. Sheng et al. [22] examined how karst cavity characteristics—specifically size and spatial positioning—influence pile foundation performance in karstic terrain. Gang et al. [23] used ABAQUS to conclude that the higher the pile diameter, roof thickness, and mechanical properties. In theoretical research, Cui et al. [24] considered the pile foundation bearing response of the incomplete bonding effect. Kong et al. [25] focused on the pile–soil characteristics of energy piles. Lei Y et al. [26] explored the calculation method of the roof safety thickness under bridge piles. Jiang et al. [27] proposed that increasing the rock embedding depth can improve the bearing capacity. Feng et al. [28] proposed the metabolic GM (1,1) model to predict the bearing capacity of piles. Zhao et al. [29] considered the deadweight of the overlying soil layer, used the complex variable function method to calculate the stress distribution, and obtained the results after superposition. Wang et al. [30] explored the influence of the cave on the pile side on the bearing capacity of the super-long pile. Jiang et al. [31] considered the side resistance of the rock-embedded section and changed the calculation model to a pile embedded in the roof to a certain depth, ignoring the span of the cave, and used the Griffith criterion to obtain the result. Gotman et al. [32] considered the cave damage to calculate the bearing capacity of bridge piles. He et al. [33] studied the ultimate bearing capacity of karst pile foundations based on the grey theory. Asgari et al. [34] studied the seismic dynamic response of pile–soil interaction in pile foundations. Nie et al. [35] conducted an in-depth study on the shear failure mode and proposed a method to calculate the safe thickness–span ratio of the roof. Chen et al. [36] calculated the safe thickness of the roof of karst pile foundations. Lei Yong et al. [37] considered the cave failure model when the cave span was greater than or less than the width of the shear body.
In summary, the current research of scholars focus on the bearing and stability of the roof under single pile karst. In actual engineering, pile groups are more widely used. However, the bearing performance, failure mode of the roof under pile-group loading remain unclear. Based on this, this paper first simulates the working conditions and rock material properties of the roof under karst pile foundations, then conducts indoor scaled model tests to study the bearing performance of the roof plate under the same working conditions for single piles and pile groups. Finally, a comparative analysis is performed to propose the bearing-capacity-enhancement coefficient of the roof plate under pile-group loading relative to single piles. While many studies have examined single pile–karst interactions, the performance of pile groups and the quantification of improvement coefficients remain underexplored, particularly in relation to varying roof geometries. Building on this foundation, the model test data were fitted using the ABAQUS finite element software (2020) package, followed by variable expansion analyses to validate the applicability of the proposed pile-group roof bearing-capacity-enhancement coefficient. This research framework aims to deliver practical reference insights for investigating the load-bearing behavior of the roof in pile group configurations. To validate the numerical simulation results, this study employed complementary physical model tests. The experimental approach likely involved scaled-down replicas of the karst–pile system, with controlled variables matching those in the numerical model. Additionally, two key research objectives were addressed: first, exploring the failure modes of the roof under pile groups, which differ from those under single piles; second, identifying the factor that exerts the most significant influence on the bearing capacity. The findings can inform foundation design in karst regions, providing engineers with guidance on when pile groups are necessary to ensure stability and safety.
2. Indoor Model Test of Single Piles and Pile Groups
To investigate and compare the load-bearing behaviors of the roof under single-pile versus pile-group loading, an indoor model test was designed specifically for karst pile foundation-supported roof systems. The model test block has dimensions of 1.5 m (length) × 1.5 m (width) × 1.24 m (height). Its soil layer consists primarily of 52 cm thick fine sand (simulating the upper soil layer) and 72 cm thick concrete (simulating the lower limestone layer). The model pile is embedded in the rock layer to a depth of 48 cm. The foam simulates the cave. The size of all caves is a cylinder with a height of 12 cm and a diameter of 40 cm. The model is placed in the model slot and loaded by a hydraulic jack, as shown in Figure 1. The similarity ratio C1 is 1:20. To simulate the actual karst distribution, this experimental scheme establishes four sets of working conditions as follows: (1) only an underlying cave exists; (2) an underlying cave exists, and pile penetrates the upper part of the cave; (3) an underlying cave exists, and pile penetrates the lower part of the cave; (4) an underlying cave exists, and the pile is surrounded by beaded caves.
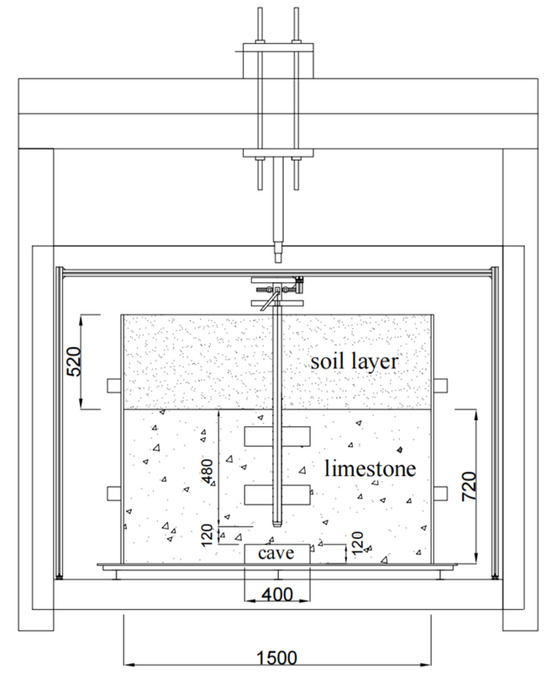
Figure 1.
Karst pile foundation roof test model (mm).
2.1. Test Materials
2.1.1. Model Piles and Caves
To study the failure mode of the roof, this paper assumes that the pile is a rigid pile and will not be damaged during loading to ensure that the failure of the system is the failure of the roof. Therefore, aluminum–magnesium alloy pipe piles are used, as shown in Figure 2. The pile length is 1 m and the pile diameter is 0.06 m. The cave is simulated by foam and fixed at the specified position before pouring, in Figure 3. The layout of the pile group is illustrated in Figure 4.
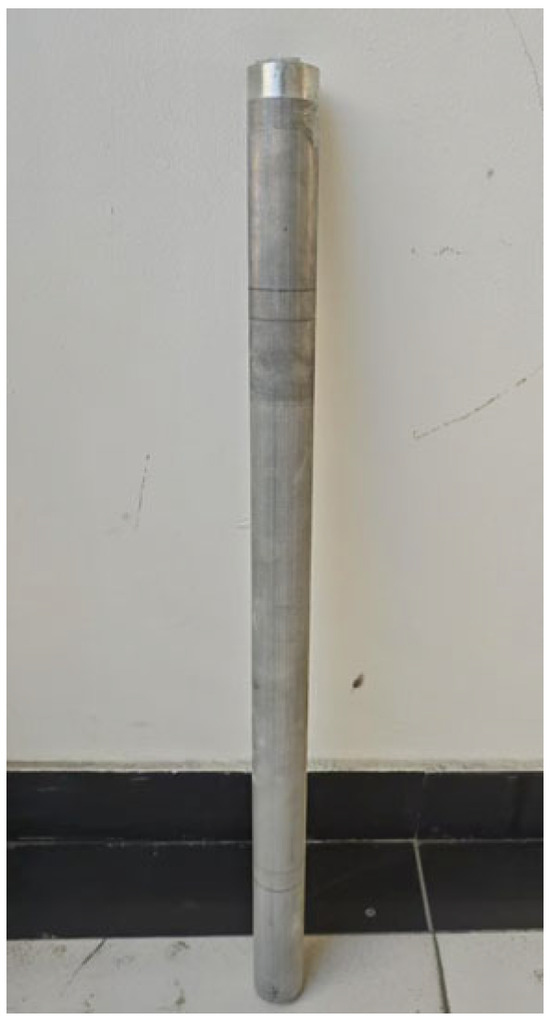
Figure 2.
Model pile.
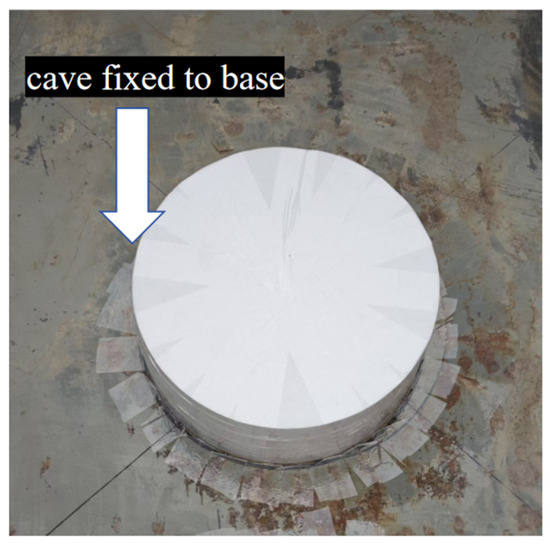
Figure 3.
Cave simulation.
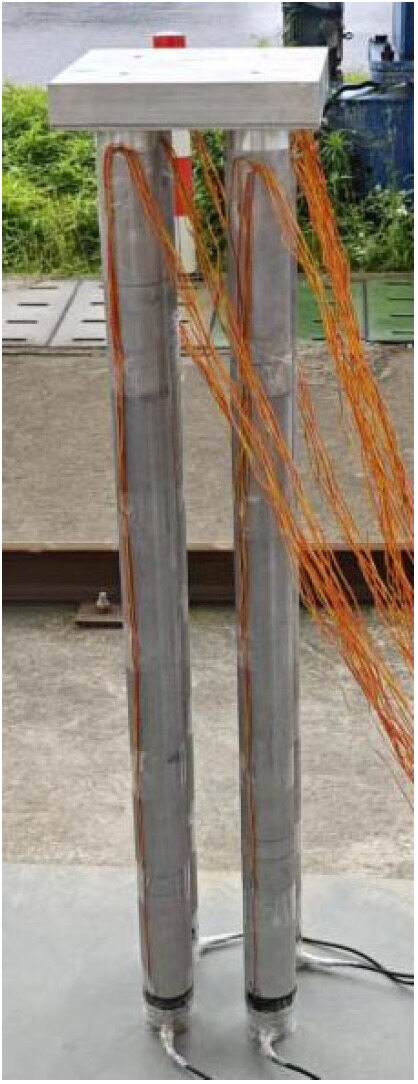
Figure 4.
2 × 2 pile groups.
2.1.2. Bedrock and Soil
In order to simulate the soluble limestone in karst areas, this paper adopts the following mix ratios: fine sand/cement/calcium carbonate/gypsum = 1:0.15:0.1:0.1; water–cement/concrete ratio of 0.25. The fine sand is golden river sand, and the cement is 42.5 cement.
2.2. Loading and Monitoring System
The loading equipment uses a hydraulic jack to place the test block in the model slot for loading. In order to measure the settlement of the pile end, a pile steel base is used to seal the pile end, as shown in Figure 5. The welded nut can be connected to the full-length screw to derive the pile-bottom settlement from the pile head. The single-pile and pile-group bottom-settlement monitoring system is shown in Figure 6. A force sensor is installed at the bottom of the model pile to measure the pile-bottom load. The load cell has an accuracy of ±1 N, and the laser displacement sensor has an accuracy of ±0.0001 mm.
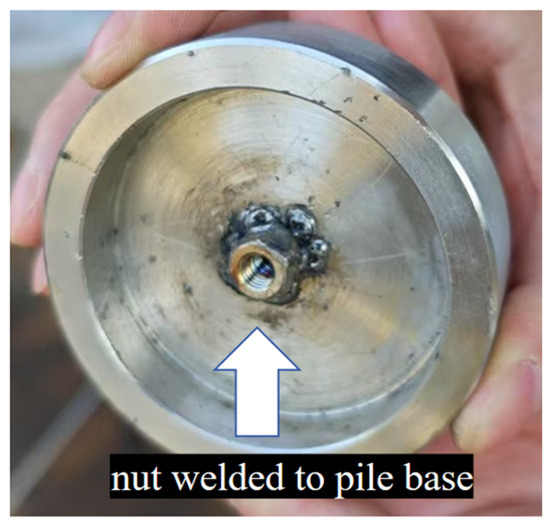
Figure 5.
Pile steel base.
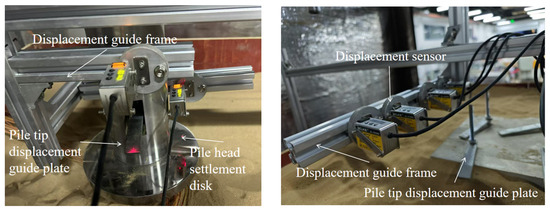
Figure 6.
Single-pile and pile-group bottom-settlement monitoring system.
2.3. Experimental Steps
The limestone part was poured in two steps. First, it was poured to the thickness of the roof. After it hardened slightly, the model pile was placed in the designated position and poured to 0.72 m for curing. Then, acrylic plates were placed around it and fine sand was filled. The displacement guide was adjusted and displacement sensors were arranged to measure the settlement of the pile top and bottom, in Figure 7. According to the Code for Design of Building Foundations (GB 50007-2011) [38], loading progression to the next stage was permitted when two displacement criteria were met: pile-top displacement variation under current load was less than 0.01 mm within any 5 min interval, or cumulative displacement change did not exceed 0.1 mm per hour. Destructive testing was conducted using the slow maintained load method with vertical group loading. Settlement values were recorded in real time via displacement sensors.
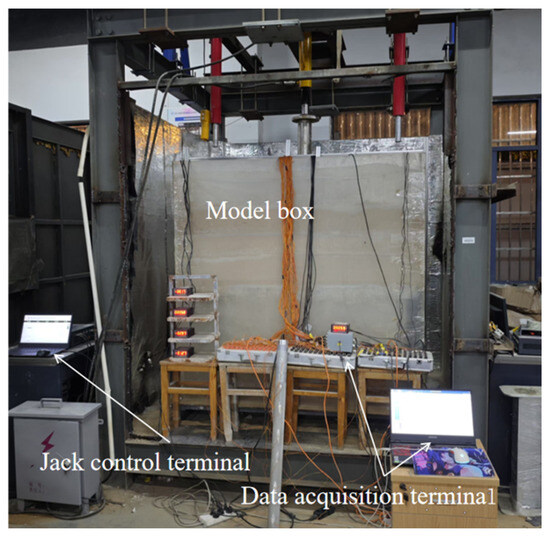
Figure 7.
Experimental implementation.
3. Model Test Results
3.1. Roof Failure Mode
After loading, the roofs of single piles and pile groups suffered shear failure, as shown in Figure 8. The damage range of single piles and pile groups covered the entire roof (diameter 40 cm), and the shear body is shown in Figure 9. The single pile damage body consisted of a cylindrical shear body in contact with the pile (section A to B) and a truncated cone extension that punched out of the roof (section B to C). The cylindrical shear body of the single pile was about 8 cm high, and the average radius was about 3.5 cm. The connection between the cylindrical shear body and the truncated cone extension was steep, and then the generatrix of the cone was gentle. The height of the truncated cone extension was about 4 cm, and the average radius was about 20 cm; the pile group damage body consisted of a cylindrical shear body in contact with the pile (section D to E) and a truncated cone extension that punched out of the roof (section E to F). The height of the cylindrical shear body of the pile group is about 5 cm, and the average radius is about 5 cm. The connection between the shear body and the cone extension is slow, and then the generatrix of the cone is steeper. The height of the cone extension is about 7 cm, and the average radius is about 20 cm. The cylindrical shear zone of single piles extends longer than that of pile groups, while exhibiting a smaller radius. Both pile configurations develop cone-shaped failure extensions with nearly identical radii, yet pile-group cones feature steeper generatrices and consequently mobilize a greater volume of surrounding rock and soil. This distinct failure morphology of pile groups appears to stem from the limited roof span employed in the experimental setup, which constrained the full development of their potential failure mechanism. The diameter of the cone extension should have been larger than the span of the roof of this test. The excess diameter of the cone extension was sheared by the bearing layer, resulting in a steeper cone generatrix.
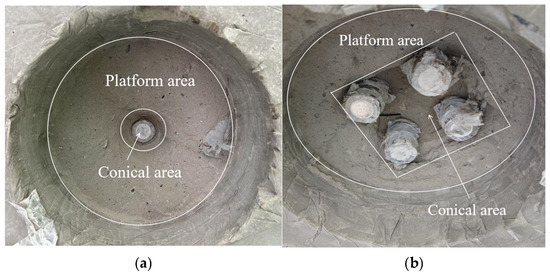
Figure 8.
Punching failure of the roof. (a) Single pile. (b) Group of piles.
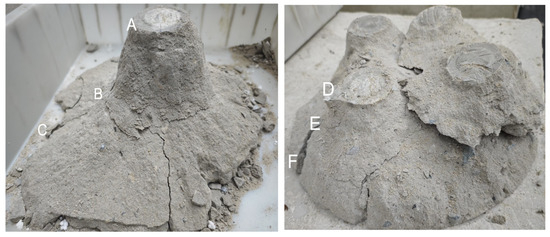
Figure 9.
Shearing body of single pile and pile group.
3.2. Ultimate Bearing Capacity of Roof
During loading process, pile-top load readings, pile-bottom load readings, and pile-top settlement readings are read when the settlement at each loading level is stable, so as to obtain the pile-top load, pile-top settlement, pile-end load, and pile-end displacement under each load level, that is, the Q-S curve and the roof displacement curve, as shown in Figure 10 and Figure 11. In the diagram, working conditions A, B, C, and D correspond to the cave beneath the pile, the pile penetrating the cave upwards, the pile penetrating the cave downwards, and pile in beaded caves, respectively. The data error is around 1 N.
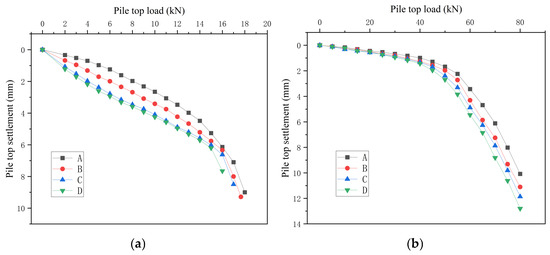
Figure 10.
Q-S curve. (a) Single pile. (b) Pile group.
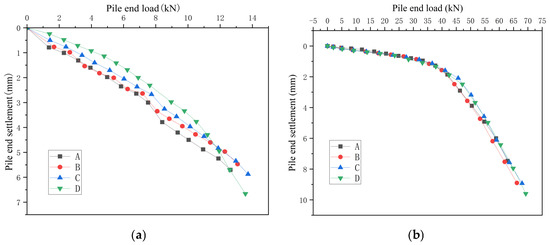
Figure 11.
P-S curve. (a) Single pile. (b) Pile group.
In Figure 10, in the single-pile condition, As the load on the roof increases, pile-end settlement exhibits a dual trend: settlement magnitude grows steadily, while the rate of settlement acceleration also increases progressively. When the pile-bottom load ranges from 0 to 7.5 kN, the pile-end settlement is relatively slow and exhibits linear behavior. Once the pile-bottom load exceeds 7.5 kN, the settlement increases rapidly until the roof fails and a shear body forms. Notably, the ultimate bearing capacity of the roof under the four single-pile working conditions and the corresponding settlement before failure are nearly identical, at approximately 18 kN and 5.7 mm, respectively. In Figure 11, the settlement at the pile end increases progressively as the load applied to the roof rises. For pile groups, the settlement at the pile base develops slowly until the base load reaches 45 kN, showing an obvious linear trend; after the pile-bottom load reaches 45 kN, the settlement begins to develop rapidly until the destructive body rushes out; the ultimate bearing capacity and the corresponding settlement before destructiveness of the roof of the pile group under the four working conditions are almost the same, both about 80 kN and 9.1 mm.
3.3. Comparison of Single Pile and Pile Group Test Results
Figure 12 presents a comparison of the ultimate bearing capacities for single piles versus pile groups across four distinct working conditions. Notably, under identical conditions, pile-group configurations enhance roof bearing capacity by approximately 455.6% compared to single-pile systems.
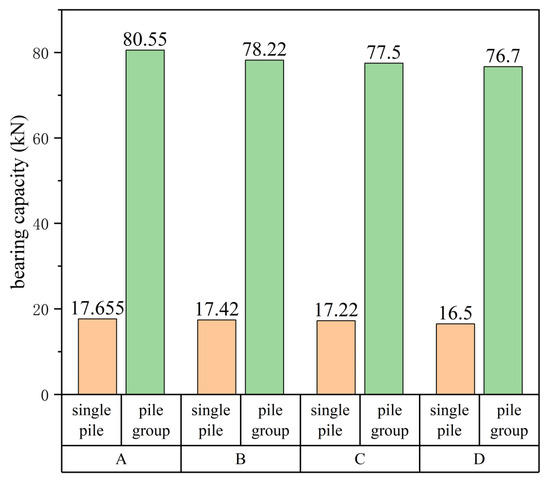
Figure 12.
Comparison of ultimate bearing capacity of single piles and pile groups.
Analysis of ultimate bearing capacity across four single-pile and pile-group test scenarios reveals a distinct pattern: pile-group capacities averaged approximately five times those of single piles. From these results, a pile group enhancement coefficient (ψ = 512.6%) was derived as the mean percentage increase in bearing capacity when comparing pile groups to single piles under identical conditions. This coefficient quantifies the amplified load-bearing performance of the roof in pile group configurations.
4. Three-Dimensional Numerical Simulation
4.1. Numerical Calculation Model
Three-dimensional modeling and numerical simulation have become established research methods in geotechnical engineering [39,40]. In this study, the Abaqus 3D software (2020) package was employed to construct a full-scale (1:1) numerical model replicating the exact boundary conditions and loading scenarios of the indoor physical tests. Taking the single pile beaded condition as an example, as shown in Figure 13, it includes four working conditions: (1) only an underlying cave exists; (2) an underlying cave exists, and pile penetrates the upper part of the cave; (3) an underlying cave exists, and pile penetrates the lower part of the cave; (4) an underlying cave exists, and the pile is surrounded by beaded caves.
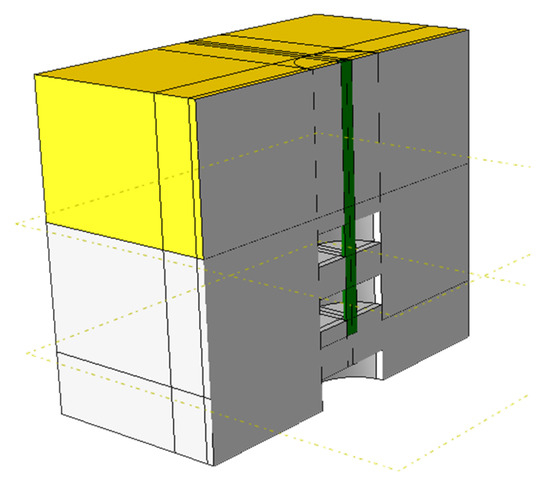
Figure 13.
Three-dimensional modeling of the cave beneath a single pile. (Yellow for fine sand; grey for soluble limestone).
The numerical model was assigned material properties identical to those used in the physical model test. For boundary conditions, the horizontal displacements (X and Y directions) are constrained, and the base is fixed to constrain displacements in the X, Y, and Z directions. The ground stress application was split into two sequential steps to account for pile–soil interaction effects. First, the natural soil state is simulated, and then the state after the pile is inserted into the soil layer is simulated. The pile–soil surface is set, and the tangential, normal, and geometric contact behaviors are set. The analysis step setting is the same as that of the test loading, divided into 17 levels of loading, and a uniform force is applied to the pressure plate. For a single pile, each level is 1 kN; for a group of piles, each level is 5 kN. For the division of the grid, the pile group bead condition is shown in Figure 14a, the grid attribute is defined as sweeping, the unit shape is mainly hexahedron, and about 62,000 soil units and about 9800 model piles are divided. Specifically, the mesh generation method used is sweeping, with hexahedral elements as the primary element type. The boundary conditions and loading settings are shown in Figure 14b.
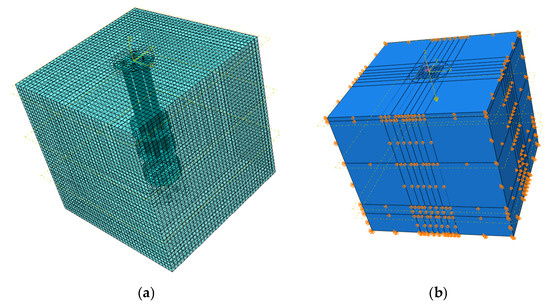
Figure 14.
(a) Mesh division and boundary conditions. (b) Boundary conditions and loading settings.
4.2. Comparison and Verification of Test Results
After the modeling is completed, run the model to obtain the ultimate bearing capacity and Q-S curve of single piles and pile groups in various working conditions, and compare them with the Q-S curve of the model test, as shown in Figure 15 and Figure 16.
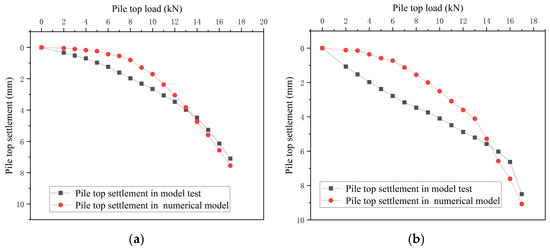
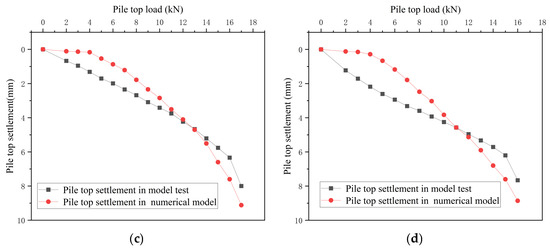
Figure 15.
(a) Q-S curve of the cave beneath a single pile. (b) Q-S curve of single-pile beaded cave. (c) Q-S curve of a single pile passing through a cave downwards. (d) Q-S curve of a single pile passing through a cave upwards.
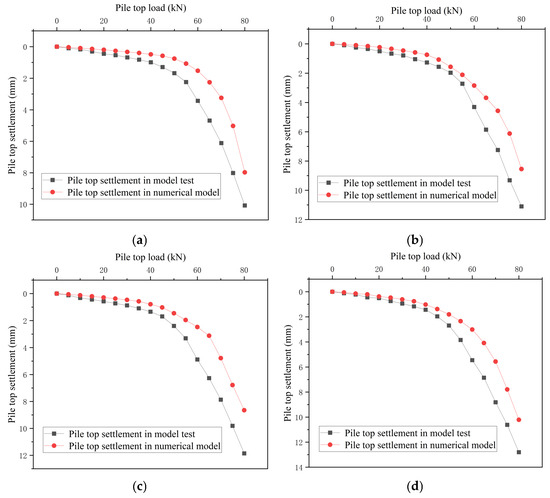
Figure 16.
(a) Q-S curve of the cave beneath pile group. (b) Q-S curve of pile group passing through a cave upwards. (c) Q-S curve of pile group passing through a cave downwards. (d) Q-S curve of pile-group beaded cave.
Visual comparison of Figure 15 and Figure 16 reveals strong alignment between numerical and experimental results: the bearing capacities calculated by the numerical model closely match the failure loads observed in physical tests, with consistent overall trendlines in load–displacement curves. The difference in bearing capacity and settlement between the experiment and the numerical model does not exceed 10%.
4.3. Comparison of Ultimate Bearing Capacity of Roof of Single Pile Groups Under Different Working Conditions
In Section 4.2, the correctness of numerical modeling and parameter selection was verified by comparing the Q-S curve. Therefore, it is scientific to expand the experimental variables using the parameter model in Section 4.2. To isolate the impact of roof parameter variations on the bearing capacity of karst cave-supported pile foundations, the analysis focuses exclusively on working conditions involving roof parameter adjustments. Concurrently, to validate the correctness and applicability of the pile group load enhancement coefficient, this section employs Abaqus finite element software to conduct extended parametric investigations. The research ranges established in this study (e.g., the research range for roof thickness is 1d–5d) are based on the intervals generally recognized in academic circles where significant changes in bearing capacity occur. It should be mentioned that finite element software cannot simulate the cracking situation of rock mass, which is a limitation of this study.
4.3.1. Different Roof Thicknesses
Taking the working condition with only underlying karst caves as an example, finite element models of single piles and 2 × 2 pile group with 1d, 2d, 3d, and 4d roof thicknesses were established. Compared with Section 4.2, only the roof thickness was changed.
The computed load–settlement (Q-S) curves are presented in Figure 17. Analysis of these curves reveals a clear trend: increasing roof thickness significantly enhances model bearing capacity. Notably, thickness increases from 1d to 2d produce the most substantial improvement, while subsequent thickness increments result in progressively diminishing gains in bearing capacity. Among them, the model bearing capacity improvement of single piles is more obvious than that of pile groups. After the roof thickness is increased from 1d to 2d, the bearing capacity is increased by 230.88%. Although the bearing capacity improvement of pile groups with increased roof thickness is large, it is not as much as that of single piles. The most substantial improvement occurred when roof thickness increased from 1d to 2d, enhancing bearing capacity by 94.17%. This effect stems from the limited contact area between single piles and the roof: under identical roof dimensions and loading, insufficient thickness restricts load transmission compared to pile groups, resulting in notably lower single-pile roof capacity. Thicker roofs facilitate more effective force distribution to surrounding supports and bearing layers, explaining the pronounced enhancement in load-bearing performance. It can be seen that when the thickness of the roof is large (≥4d), the efficiency of improving its bearing capacity is poor. In practical engineering, economic considerations should be taken into account instead of simply limiting the thickness of the roof, which can cause engineering waste.
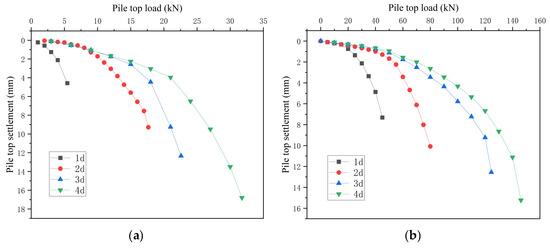
Figure 17.
(a) Q-S curves of single pile with different roof thickness. (b) Q-S curves of pile groups with different roof thickness.
A comparison of single-pile versus pile-group bearing capacities across varying thicknesses yielded Figure 18. The figure demonstrates significant bearing capacity enhancements for pile groups relative to single piles under identical conditions. This improvement stems from multiple mechanisms: increased pile count boosts side friction and pile-rock integrity; soil layers contribute additional bearing capacity during bottom pile cap settlement; and larger pile-end bearing areas facilitate more efficient load transfer. These capacity differences result in distinct enhancement coefficients (ψ) across different roof thicknesses. As presented in Figure 18, these coefficients vary with roof dimensions, necessitating separate tabulation and interpolation-based selection in engineering applications. This thickness-dependent behavior highlights the importance of tailoring foundation design to structural geometry, as the synergistic effects of pile groups interact differently with roof of varying stiffness and load-distribution capabilities.
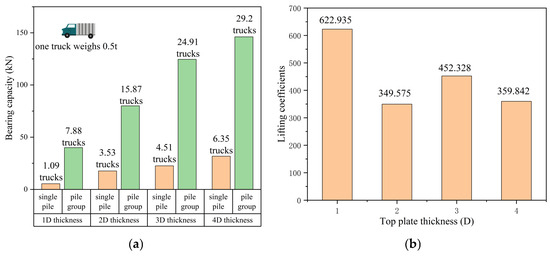
Figure 18.
(a) Comparison of the bearing capacity of single piles and pile groups with different thicknesses. (b) The lifting coefficient of a pile group with different roof thicknesses.
4.3.2. Different Roof Spans
Taking as an example the working condition where only the underlying karst cave exists, the finite element model of single piles and 2 × 2 pile groups under the roof spans of 5d, 6d, 7d, and 8d is established. Compared with Section 4.2, the model establishment here only changes the roof span.
The calculated Q-S curve comparison can be seen in Figure 19. As the roof span decreases, the bearing capacity of the single pile group gradually increases. However, the reduction in span is not as obvious as the increase in thickness for the increase in bearing capacity, with an average increase of 19.55%. Analysis indicates that roof thickness exerts a more significant influence on bearing capacity than roof span—a finding consistent with prior scholarly research. Additionally, increasing the span enhances pile-group bearing capacity more effectively—most notably when reducing the span from 6d to 5d, which yielded a 48.74% total improvement. The reason is that as the span becomes smaller, the rock mass range affected by the pile ends of the pile groups remains unchanged. This discrepancy may stem from differences in the load transfer mechanism (localized stress concentration for single piles vs. stress distribution and pile–pile interaction for pile groups). Smaller caves mean that more rock mass ranges at the pile ends are provided with bearing capacity by the bearing layer. When the span reaches a certain threshold of the influence range, the bearing capacity will be greatly improved. The influence zone around the single pile’s tip remains relatively confined, however. This restricted stress distribution area at the pile end implies that even with small cave spans, the structure cannot effectively transmit additional load to the underlying bearing stratum. Briefly, an increase in thickness enables more rock mass to participate in load-bearing, whereas a reduction in span is less efficient in enhancing the load-bearing capacity of the rock mass compared to thickness. In practical engineering, the span of the roof is a relatively overlooked factor, and different sizes of caves can also have varying degrees of impact on the bearing capacity. It is recommended to consider the span of the roof as a major factor in determining the size of the karst cave during actual design.
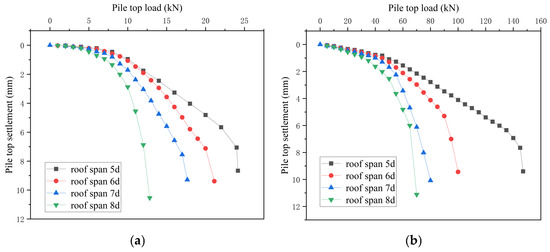
Figure 19.
(a) Q-S curves of single piles with different roof spans. (b) Q-S curves of pile groups with different roof spans.
The bearing capacity of single piles and pile groups under different spans is compared, and Figure 20 is obtained. It can be seen from the figure that the bearing capacity of pile groups under the same working condition is significantly improved compared with that of single piles. The difference in the bearing capacity of single piles and pile groups leads to large differences in the lifting coefficients under different cave spans. The lifting coefficients under different roof spans are listed as shown in Figure 20, so they should be listed separately and interpolated.
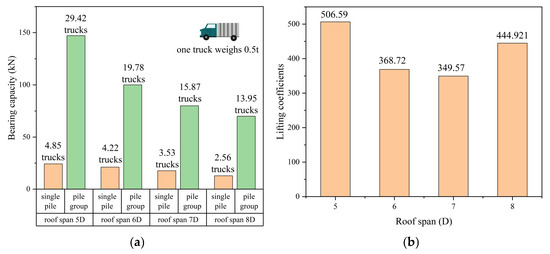
Figure 20.
(a) Comparison of bearing capacity of single piles and pile groups with different roof spans. (b) Lift coefficient of pile groups with different roof spans.
4.3.3. Different Cave Heights
Taking the working condition where only the underlying karst cave exists as an example, the model of single piles and 2 × 2 pile groups at 1d, 2d, 3d, and 4d karst cave heights was established. The model establishment here only changed the karst cave height compared with Section 4.2.
Figure 21 presents comparative Q-S curves illustrating the relationship between karst cave height and pile-group bearing capacity. Notably, reducing cave height correlates with a gradual increase in single pile-group bearing capacity, though this effect is less pronounced than changes in roof thickness or span—yielding an average improvement of only 13.14%. This aligns with findings from existing literature, confirming that roof dimensions (thickness and span) exert a more significant influence on bearing capacity than karst cave height. The observed trend arises from load transfer mechanics: increased cave height extends the path for stress transmission to the underlying bearing layer, complicating load distribution and reducing overall bearing efficiency. A critical threshold emerges when cave height decreases from 2d to 1d, triggering a noticeable jump in pile-group capacity. This discontinuity stems from the broader contact area between group piles and the roof, which facilitates more effective load transmission to the bearing layer. In contrast, single piles—with their smaller roof contact area—concentrate stress within the plate itself, making their performance less sensitive to cave height variations. These findings highlight the importance of cave height as a secondary but still relevant design consideration, particularly for optimizing pile-group configurations in karstic terrain.
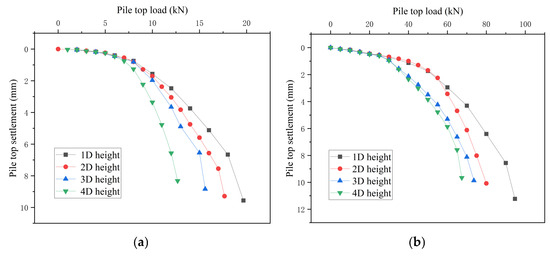
Figure 21.
(a) Q-S curves of single piles at different roof heights. (b) Q-S curves of pile groups at different roof heights.
A comparative analysis of single-pile and pile-group bearing capacities across varying heights yielded Figure 22. The visualization demonstrates that, under identical conditions, pile groups consistently exhibit substantially higher bearing capacities than single piles. This disparity in load-bearing performance between single piles and pile groups directly results in significant variations in enhancement coefficients across different cave height scenarios. The lifting coefficients at different roof spans are listed as shown in Figure 22, so they should be listed separately and selected by interpolation.
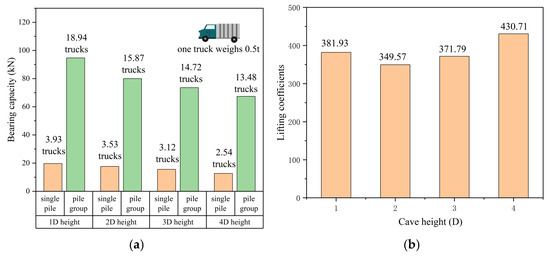
Figure 22.
(a) Comparison of the bearing capacity of single piles and pile groups at different cave heights. (b) Lifting coefficient of pile groups at different cave heights.
4.3.4. Different Cave Eccentricity Distances
Taking the working condition with only an underlying cave as an example, models of single piles and 2 × 2 pile groups under cave eccentricities of 0d, 4d, 5d, 6d, and 7d were established. In the 4d eccentricity scenario, the single-pile base becomes fully enclosed within the cave boundary, while half the pile-group bases (two piles) lie within the cave zone and the other half rest on intact ground. Here, eccentricity denotes the horizontal offset between pile centerlines and the cave’s geometric center. Unlike the models in Section 4.2, modifications were limited to adjusting the cave’s spatial position relative to the pile foundation.
Figure 23 presents comparative load–settlement (Q-S) curves showing the influence of eccentric distance on bearing capacity. Notably, increasing eccentricity correlates with gradual capacity enhancement for both single piles and pile groups. For single piles, the improvement plateaus at an eccentricity of 7d, while pile groups exhibit more pronounced gains before similarly approaching a threshold at the same 7d spacing. Eccentricity emerges as a more impactful parameter than thickness, span, or cave height—particularly when pile positioning shifts completely away from the cave opening. This pronounced effect likely arises from reduced stress concentration above the void: piles placed eccentrically relative to the karst cave experience altered load paths that bypass weakened zones, transferring forces to more competent rock mass. The convergence of threshold behavior at 7d for both configurations suggests an optimal eccentricity range where further spacing yields minimal structural benefit, guiding efficient foundation layout in karst terrain. It can be analyzed that when a cave appears under the pile, the bearing capacity will be greatly reduced; when the pile and the cave are eccentric to the outside of the cave, the bearing capacity will be greatly improved compared to the inside, and as the eccentric distance increases, the bearing capacity gradually increases, but more and more slowly. It can be seen that if a cave appears near the pile end, the bearing capacity of the pile will still be weakened relative to the rock-embedded pile.
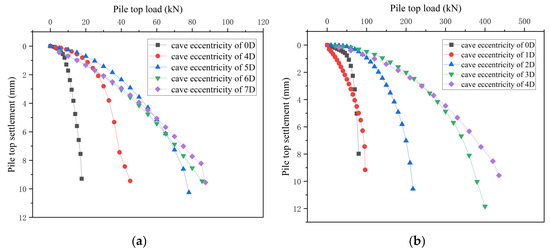
Figure 23.
(a) Q-S curves of single piles at different cave eccentricity distances. (b) Q-S curves of pile groups at different cave eccentricity distances.
The bearing capacities of single piles and pile groups under different eccentric distances are compared, and Figure 24 is obtained. It can be seen from the figure plots that the bearing capacity of pile groups under the same working condition is significantly improved compared with that of single piles. The bearing difference in single piles and pile groups leads to large differences in the lifting coefficients under different eccentricities. The lifting coefficients under different roof spans are listed as shown in Figure 24, so they should be listed separately and selected by interpolation.
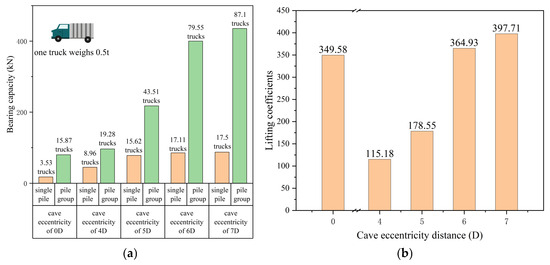
Figure 24.
(a) Comparison of bearing capacity of single piles and pile groups with different eccentric distances from caves. (b) Lift coefficient of pile groups with different eccentric distances.
4.3.5. Different Tilt Angles
In nature, karst caves generally do not have regular shapes, and the tilting problem at the top of the cave affects the load-bearing capacity. Based on the exploration of scholars [40], this article sets working conditions of 30° and 45° for exploration. Compared with Section 4.2, the model here only changed the horizontal inclination angle of the roof.
Figure 25 presents comparative load–settlement (Q-S) curves, which demonstrate a consistent inverse relationship: increasing horizontal inclination angles correspond to progressive reductions in single pile group bearing capacity. The reason is that the transmission of force of the inclined roof relative to the horizontal roof will be asymmetric, and the stability will be greatly weakened; under the inclined roof working condition, the bearing capacity provided by the higher height of the cave is small, and due to the lack of rock mass, the force transmission will be biased upward relative to the other side, and finally the higher height of the cave will be destroyed first, so that the bearing capacity under this roof thickness cannot be exerted. Among them, the weakening of the single pile is more obvious, with an average reduction of 176.5%. The reason is that the pile-end bearing provided by the inclined roof is unstable; in particular, the single pile has less contact surface with the rock layer, and its bearing capacity will be greatly weakened.
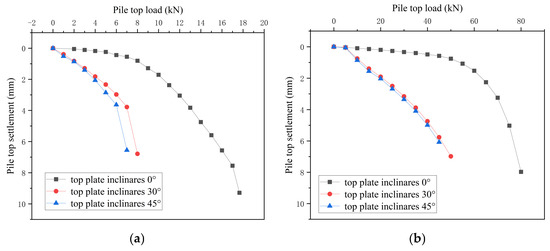
Figure 25.
(a) Q-S curves of single piles with different roof inclination angles. (b) Q-S curves of pile groups with different roof inclination angles.
A comparison of load-bearing performance between single piles and pile groups under various horizontal inclination angles is illustrated in Figure 26. The results indicate that the bearing capacities of the pile groups approximates a multiple of those exhibited by the single piles. By summarizing and analyzing it, it can be concluded that the lifting coefficient of the pile group under the changing horizontal inclination angle of the cave roof is 624.24%.
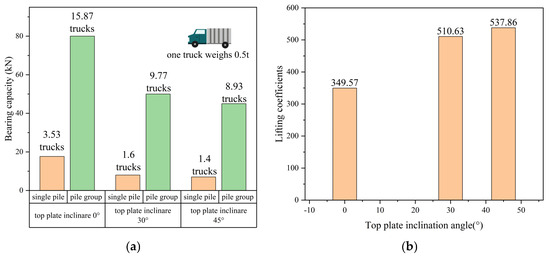
Figure 26.
(a) Comparison of bearing capacity of single piles and pile groups with different roof inclination angles. (b) Lift coefficient of pile groups with different inclination angles.
4.4. Discussion
Based on the analysis in this chapter, the bearing characteristics of the 2 × 2 low-pile-cap pile group used in this paper are slightly different from those of the single pile. The main reason is that the soil under the low-pile cap is squeezed by the cap and bears some load; the pile group has a larger contact area with the roof, affects a larger range of rock mass, and is more conducive to the transmission of pile end force; the pile group has more piles, more friction with the soil, and stronger bearing capacity. Therefore, factors such as different roof thickness, roof span, cave height, pile-hole eccentricity, and roof inclination have different influences on single pile and pile group. This leads to a large difference between the bearing increase coefficients proposed in Section 4.3.
Based on the analysis in Section 4.3, the enhancement in bearing capacity offered by a 2 × 2 pile group over a single pile varies significantly depending on different roof sensitivity factors. The differences in single piles and pile groups lead to different lifting effects under the same factor. Therefore, it is not enough to propose only one lifting coefficient in Section 3.3. When the actual working conditions are mixed with changes in roof height, span, etc., this lifting coefficient is very poorly considered.
This paper conducts a comparative analysis of the bearing capacity and load-bearing characteristics between single piles and pile groups in karst geology. However, the bearing-capacity-improvement factors proposed in Section 4.3 are quite different. Therefore, the bearing-capacity-improvement factor under the working conditions in Section 4.3 can be selected according to the actual working conditions to obtain the bearing-capacity-improvement factor of pile groups under multiple factors with reference values. Given that practical engineering involves complex interactions among multiple factors, we propose a method for calculating the pile-group bearing-capacity-improvement factor to comprehensively account for the interactions between the factors discussed above. Select the coefficients for each factor based on the actual working conditions, such as roof thickness, roof span, cavern height, eccentric distance, and inclination angle. Multiply them together to obtain the final coefficient for your specific working conditions.
The mesh division method is the same, so no mesh sensitivity analysis was conducted. This is a limitation of this study [41]. Future research can explore the impact of mesh sensitivity on bearing results using different mesh division methods to clarify the reliability of three-dimensional numerical model results.
5. Conclusions
This study conducted a series of scaled indoor model tests to investigate the failure mechanisms of cave roofs and evaluate the ultimate bearing capacities of both single piles and pile groups under four consistent working conditions. A comparative analysis was performed, leading to the proposal of a bearing-capacity-improvement coefficient for pile groups in karst areas relative to single piles. To complement the experimental work, a three-dimensional numerical model was developed using the ABAQUS finite element software package. The model’s parameters were validated by comparing their predicted values with the physical test results, confirming the reliability of the numerical approach. The validated model was then employed to systematically analyze and compare the bearing performance of single piles and pile groups under the influence of several key geometric parameters. These parameters included roof thickness, roof span, cave height, eccentricity distance between the pile and the cave, and roof inclination angle. The investigation yielded several significant conclusions regarding how these factors affect the foundational support in karst terrain.
- (1)
- Both single piles and pile groups exhibit enhanced load-bearing performance with increasing roof thickness. The most substantial improvement occurs during the transition from 1d to 2d thickness, where single-pile capacity surges by approximately 230.9%—representing the most pronounced gain across all measured intervals. This is because single piles have a smaller contact area with the roof: under the same roof area and applied load, if the roof plate is too thin, force transmission becomes more difficult for single piles than for pile groups. Thus, increasing the roof thickness enhances the single-pile bearing capacity more significantly than it does for pile groups. The efficiency of improving the bearing capacity through the thickness of the roof should also be taken into account. Blindly increasing the thickness of the reserved roof may result in engineering waste.
- (2)
- With the increase in the roof span, the bearing capacity of single piles and pile groups decreases. The influence of the roof span on the bearing capacity of the pile foundation is not as great as that of the roof thickness. As the span decreases, the rock mass range affected by the pile end of the pile group remains unchanged. In smaller caves, more rock mass ranges at the pile end are provided with bearing capacity by the bearing layer. However, the influence range of the pile end of a single pile is limited. A smaller pile-end bearing area means that even if the cave span is small, it cannot transfer more load to the bearing layer. Therefore, the reduction in the roof span improves the pile group more than the single pile. In actual engineering, the efficiency of improving the bearing capacity through the span of the roof should also be taken into account. A smaller roof span may significantly increase its load-bearing capacity, and excessive reservation of roof thickness at this time can easily lead to engineering waste.
- (3)
- An inverse correlation exists between karst cave height and the bearing capacity of both single piles and pile groups. Specifically, greater cave heights correspond to diminished load-bearing performance in foundation piles. However, the influence of roof height on bearing capacity is less pronounced compared to other geometric parameters, such as roof thickness and span. This suggests that while roof height plays a role in foundation design, variations in roof thickness and span exert a stronger effect on the overall stability and load-bearing behavior of pile foundations in karst terrain. The increase in the height of the cave will make the path for load transfer to bearing layer longer, increasing the difficulty of load transfer; the contact surface between the pile end and the roof is wider, and the load transfer is easier to transfer to the bearing layer, while the contact surface between the single pile and the roof is small, and the force transfer is more concentrated in the roof. Therefore, the reduction in the height of the cave has a greater impact on the pile group than on the single pile.
- (4)
- Increasing pile-hole eccentricity significantly enhances the bearing capacity of both single piles and pile groups. Notably, eccentricity exerts a more pronounced influence on load-bearing performance than thickness, span, or cave height—with the most dramatic improvements occurring when eccentricity shifts the pile entirely away from the cave zone. This performance boost arises from reduced stress concentration on compromised (cave-affected) rock masses. However, even with optimal eccentricity, piles near subsurface cavities still exhibit lower bearing capacity than fully rock-embedded piles, as residual proximity to the cave introduces potential failure paths. The findings highlight eccentricity as a critical design lever—engineers should prioritize centering piles over intact rock formations when possible, though complete cave avoidance remains the gold standard for maximizing foundation stability in karst terrain.
- (5)
- Increasing the roof’s inclination angle reduces the bearing capacity of both single piles and pile groups, with this parameter exerting a more pronounced influence than either roof span or cave height. The sloped surface creates unstable load-transfer conditions at the pile tip, particularly compromising single piles—their limited rock-layer contact area leads to significantly diminished stability, preventing full utilization of the bearing capacity otherwise available for that plate thickness. Consequently, roof inclination weakens single piles more severely than pile groups. This differential response arises from the pile group’s ability to distribute stress across multiple contact points, partially offsetting the instability introduced by slope angles. In contrast, single piles concentrate all load at a single inclined interface, amplifying the risk of slippage and load redistribution failure. The finding that inclination outweighs span and height effects challenges conventional design priorities, suggesting that roof geometry—specifically planarity—may be the most critical factor in karst foundation performance after thickness. For engineering practice, these results emphasize the need for strict control over roof inclination during construction, especially when designing single-pile foundations in karst terrain.
- (6)
- Under different roof sensitivity factors, the bearing capacity increase of 2 × 2 pile groups relative to single piles is different. The bearing-capacity-increase coefficients for each pile group for the five roof sensitivity factors considered in this paper are summarized. According to the possible combination of multiple factors in actual working conditions, the bearing-capacity-increase coefficient of the pile group can be selected by interpolation.
Author Contributions
Conceptualization, X.W.; data curation, H.C.; formal analysis, H.H.; methodology, H.H.; funding acquisition, X.W.; investigation, H.C.; software, H.C.; project administration, X.W.; resources, X.W.; supervision, Y.T.; validation, C.L.; visualization, J.H.; writing—original draft, H.C.; writing—review and editing, H.H. All authors have read and agreed to the published version of the manuscript.
Funding
This research was supported by the National Natural Science Foundation of China (52278373) and Hangzhou city University Scientific Research Cultivation Fund Project (204000-58162509).
Data Availability Statement
The data presented in this study are available upon request from the corresponding author. The raw/processed data needed to reproduce these findings cannot be shared publicly at this time, as they are also part of ongoing study.
Conflicts of Interest
The authors declare no conflicts of interest.
References
- Xia, C.; Shi, Z.; Kou, H.; Meng, S.; Liu, M. Sensitivity analyses of random cave groups on karst tunnel stability based on water–rock interaction using a novel contact dynamic method. Undergr. Space 2024, 18, 162–186. [Google Scholar] [CrossRef]
- Feng, Z.; Xu, B.; Chen, H.; Xia, C.; Cai, J. Study on the influence of different treatment measures for karst caves on bearing characteristics of pile foundation. J. Archit. Civ. Eng. 2024, 41, 151–158. (In Chinese) [Google Scholar]
- Khalid, E.; Shuilong, S.; Yong, T.; Cheng, W.C. Investigation into performance of deep excavation in sand covered karst: A case report. Soils Found. 2018, 58, 1042–1058. [Google Scholar] [CrossRef]
- Kang, Y.; Geng, Z.; Lu, L.; Chen, L.; Liu, X.; Liu, B.; Huang, X. Compound Karst Cave Treatment and Waterproofing Strategy for EPB Shield Tunnelling in Karst Areas: A Case Study. Front. Earth Sci. 2021, 9, 761573. [Google Scholar] [CrossRef]
- Lu, W.; Yang, C.; Xianpeng, L.; Zhihua, C.; Zhichao, N. Experimental study on negative skin friction characteristics of double-sleeve pile. Sci. Rep. 2024, 14, 26194. [Google Scholar] [CrossRef]
- Cui, C.; Meng, K.; Xu, C.; Liang, Z.; Li, H.; Pei, H. Analytical solution for longitudinal vibration of a floating pile in saturated porous media based on a fictitious saturated soil pile model. Comput. Geotech. 2021, 131, 103942. [Google Scholar] [CrossRef]
- Li, L.; Wu, W.; Liu, H.; Lehane, B. DEM analysis of the plugging effect of open-ended pile during the installation process. Ocean Eng. 2021, 220, 108375. [Google Scholar] [CrossRef]
- Peng, Y.; Liu, H.; Li, C.; Ding, X.; Deng, X.; Wang, C. The detailed particle breakage around the pile in coral sand. Acta Geotech. 2021, 16, 1971–1981. [Google Scholar] [CrossRef]
- Moradshahi, A.; Faizal, M.; Bouazza, A.; McCartney, J.S. Effect of nearby piles and soil properties on thermal behaviour of a field-scale energy pile. Can. Geotech. J. 2021, 58, 1351–1364. [Google Scholar] [CrossRef]
- Pham, T.A.; Akan, R.; Tabaroei, A. A simplified soil-structure interaction model for load-settlement analysis of piles. Can. Geotech. J. 2025, 62, 1–24. [Google Scholar] [CrossRef]
- Feng, Z.; Hu, H.; Dong, Y.; Wang, F.; Jia, M.; Zhao, Y.; He, J. Effect of Steel Casing on Vertical Bearing Characteristics of Steel Tube-Reinforced Concrete Piles in Loess Area. Appl. Sci. 2019, 9, 2874. [Google Scholar] [CrossRef]
- Zhao, X.; Melentijevic, S.; Shen, Y.; Sun, Z.; Wang, K.; Xu, J.; Li, Z. Experimental study of the effects of the void located at the pile tip on the load capacity of rock-socketed piles. Sci. Rep. 2024, 14, 15795. [Google Scholar] [CrossRef]
- Li, L.; Liu, X.; Liu, H.; Wu, W.; Lehane, B.M.; Jiang, G.; Xu, M. Experimental and numerical study on the static lateral performance of monopile and hybrid pile foundation. Ocean Eng. 2022, 255, 111461. [Google Scholar] [CrossRef]
- Zhao, M.H.; Tang, X.L.; Xiao, X. Model tests on punching properties of karst cave roof under pile tip considering different thick-span ratios. Rock Soil Mech. 2018, 39, 1159–1167. [Google Scholar]
- Lei, Y.; Li, P.; Liu, Z.; Li, J.; Hu, W.; Chen, G.; Liu, S. Experimental study on ultimate bearing capacity and failure mode of pile foundation crossing karst cave in karst areas. Chin. J. Appl. Mech. 2023, 40, 1343–1353. [Google Scholar]
- Chen, H.; Feng, Z.; Wu, M.; Zhou, G.; Chen, L.; Zhang, C. Study on the vertical bearing performances of piles on karst cave. Sci. Rep. 2023, 13, 4944. [Google Scholar] [CrossRef]
- Asgari, A.; Ranjbar, F.; Bagheri, M. Seismic resilience of pile groups to lateral spreading in liquefiable soils: 3D parallel finite element modeling. Structures 2025, 74, 108578. [Google Scholar] [CrossRef]
- Zheng, C.; Kouretzis, G.; Ding, X.; Luan, L. Vertical vibration of end-bearing single piles in poroelastic soil considering threedimensional soil and pile wave effects. Comput. Geotech. 2022, 146, 104740. [Google Scholar] [CrossRef]
- Wu, W.; Yang, Z.; Liu, X.; Zhang, Y.; Liu, H.; El Naggar, M.H.; Xu, M.; Mei, G. Horizontal dynamic response of pile in unsaturated soil considering its construction disturbance effect. Ocean Eng. 2022, 245, 110483. [Google Scholar] [CrossRef]
- He, S.; Lai, J.; Li, Y.; Wang, K.; Wang, L.; Zhang, W. Pile group response induced by adjacent shield tunnelling in clay: Scale model test and numerical simulation. Tunn. Undergr. Space Technol. 2022, 120, 104039. [Google Scholar] [CrossRef]
- Li, R.; Yin, Z.-Y.; He, S.-H. 3D reconstruction of arbitrary granular media utilizing vision foundation model. Appl. Soft Comput. 2025, 169, 112599. [Google Scholar] [CrossRef]
- Sheng, M.; Lu, F.; Jiang, N.; Guo, P.; Li, X.; An, R.; Wang, Y. Bearing behavior of pile foundation in karst region: Physical model test and finite element analysis. Appl. Rheol. 2024, 34, 20230115. [Google Scholar] [CrossRef]
- Han, G.; Zhang, H.; Wang, Z.; Wang, Y.; Geng, N.; Guo, P.; Li, X.; Zhao, Y.; Lin, H.; Wang, Y. Bearing behavior of rock socketed pile in limestone stratum embedded with a karst cavity beneath pile tip. Case Stud. Constr. Mater. 2023, 18, e02203. [Google Scholar] [CrossRef]
- Cui, C.; Meng, K.; Xu, C.; Wang, B.; Xin, Y. Vertical vibration of a floating pile considering the incomplete bonding effect of the pile-soil interface. Comput. Geotech. 2022, 150, 104894. [Google Scholar] [CrossRef]
- Kong, G.; Fang, J.; Lv, Z.; Yang, Q. Effects of pile and soil properties on thermally induced mechanical responses of energy piles. Comput. Geotech. 2023, 154, 105176. [Google Scholar] [CrossRef]
- Lei, Y.; Chen, Y.S.; Tan, H.; Li, P.J.; Liu, Y.S.; Yu, Y.L. Calculation method of ultimate bearing capacity for rock layer of pile tip of bridge pile groups with underground karst cave. Rock Soil Mech. 2023, 44, 3339–3348. [Google Scholar]
- Jiang, C.; Liu, L.; Wu, J.P. A new method determining safe thickness of karst cave roof under pile tip. J. Central S. Univ. 2014, 21, 1190–1196. [Google Scholar] [CrossRef]
- Feng, Z.; Chen, H.; Xia, C.; Li, S.; Cai, J.; He, J. Prediction of bearing capacity of pile foundation in karst area based on model of metabolic GM (1, 1). IOP Conf. Ser. Earth Environ. Sci. 2018, 189, 042012. [Google Scholar] [CrossRef]
- Zhao, M.H.; Xiao, Y.; Xu, Z.J.; Yang, C.W.; Hu, Q.; Liu, J.H. Stability analysis of cavity under rock-socketed pile in karst areas based on Griffith criterion. China J. Highw. Transp. 2018, 31, 31–37. [Google Scholar]
- Wang, P.; Ding, H.; Zhang, P. Influence of Karst Caves at Pile Side on the Bearing Capacity of Super-Long Pile Foundation. Math. Probl. Eng. 2020, 2020, 4895735. [Google Scholar] [CrossRef]
- Jiang, C.; Zhao, M.-H.; Cao, W.-G. Stability analysis of subgrade cave roofs in karst region. J. Central S. Univ. Technol. 2008, 15, 38–44. [Google Scholar] [CrossRef]
- Gotman, N.Z.; Evdokimov, A.G. Calculation of Bridge-Support Pile Foundations Taking Karst Deformations Into Account in the Base. Soil Mech. Found. Eng. 2023, 60, 401–409. [Google Scholar] [CrossRef]
- He, J.; Feng, Z.; Dong, Y.; Chen, H.; Huang, Z.; Xia, C.; Zhao, Y.; Hu, H. Grey theory study on the influence of karst-pile-soil coupling on the ultimate bearing capacity of pile foundation in karst development area. IOP Conf. Ser. Earth Environ. Sci. 2019, 218, 012025. [Google Scholar] [CrossRef]
- Asgari, A.; Bagheri, M.; Hadizadeh, M. Advanced seismic analysis of soil-foundation-structure interaction for shallow and pile foundations in saturated and dry deposits: Insights from 3D parallel finite element modeling. Structures 2024, 69, 107503. [Google Scholar] [CrossRef]
- Qingke, N.; Xilai, L.; Wei, Y.; Anli, W.; Wei, W.; Xiangxin, J.; Weidong, S. Calculation Method for the Critical Thickness of a Karst Cave Roof at the Bottom of a Socketed Pile. Adv. Mater. Sci. Eng. 2021, 2021, 1669410. [Google Scholar] [CrossRef]
- Chen, J.; Wu, J.; Wu, Y.; Gao, Q.; Wu, B. Studying Bearing Characteristics and Calculation Models of Karst Cave Roof Utilizing Digital Modeling. Geotech. Test. J. 2025, 48, 399–416. [Google Scholar] [CrossRef]
- Lei, Y.; Yin, J.F.; Chen, Q.N. Experimental Study on Ultimate Bearing Capacity and Failure Modes of Pile-tip Bedrock in Karst Area. Chin. J. Appl. Mech. 2017, 34, 774–780+822. [Google Scholar]
- JGJ 106-2014; Technical Code for Testing of Building Foundation Piles. Architecture Building Press: Beijing, China, 2014.
- Bagheri, M.; Jamkhaneh, M.E.; Samali, B. Effect of Seismic Soil–Pile–Structure Interaction on Mid- and High-Rise Steel Buildings Resting on a Group of Pile Foundations. Int. J. Geomech. 2018, 18, 04018103. [Google Scholar] [CrossRef]
- Zhang, J. Study on Bearing Mechanism and Stability Evaluation of Pile Foundation in Karst Cave Areas with Inclined Roof. Ph.D. Thesis, Shandong University, Jinan, China, 2019. (In Chinese). [Google Scholar]
- Bagheri, M.; Malidarreh, N.R.; Ghaseminejad, V.; Asgari, A. Seismic resilience assessment of RC superstructures on long–short combined piled raft foundations: 3D SSI modeling with pounding effects. Structures 2025, 81, 110176. [Google Scholar] [CrossRef]


Disclaimer/Publisher’s Note: The statements, opinions and data contained in all publications are solely those of the individual author(s) and contributor(s) and not of MDPI and/or the editor(s). MDPI and/or the editor(s) disclaim responsibility for any injury to people or property resulting from any ideas, methods, instructions or products referred to in the content. |
© 2025 by the authors. Licensee MDPI, Basel, Switzerland. This article is an open access article distributed under the terms and conditions of the Creative Commons Attribution (CC BY) license (https://creativecommons.org/licenses/by/4.0/).