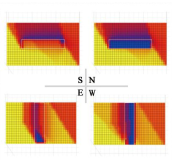
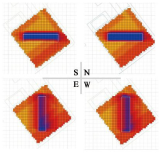
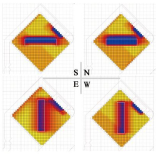
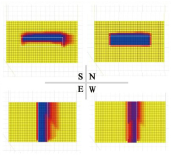
Abstract
Global warming and urban expansion impose far-reaching, negative implications on the quality of the outdoor thermal environment in residential areas. Due to its potential for microclimate regulation and easy configuration with less site restrictions, the transitional space is an effective mitigation measure to transform existing outdoor spaces for thermal discomfort. The point of this article is to explore the optimum design parameters of the transitional space for increasing outdoor thermal comfort, with a focus on its orientation, aspect ratio (H/W), plan aspect ratio (L/W), and enclosure degree. The ENVI-met micro-meteorological model is adopted to visualize the environmental parameters after field measurement whereas the Ecotect is applied to validate the thermal performance under different design variants. The simulation results show that the thermal performance of geometry and orientation for the transitional space is seasonally discordant. On account of giving consideration to balance the double demands of solar shading in summer and solar gain in winter, a south-oriented transitional space with the windward side enclosure, length-width ratio of 2:1, and aspect ratio with 1.2 produces a greater thermal environment in Tianjin, China. Combined with the previous literature, south-oriented transitional spaces have a comparative advantage in balancing year-round thermal comfort for most cases; the deviation of the preferred orientation in the corresponding cities from the due south orientation is within 90° of a counterclockwise rotation. The lower aspect ratio (approximately below 1), deeper shape, and lower enclosure of the transitional spaces is appropriate for tropical and subtropical areas to avoid excessive sunshine; for temperate climates with hot summers and cold winters, such as in Tianjin, the reverse happens.
1. Introduction
Although a predictable moderation in the pace of urbanization is accompanied with slower growth in both the absolute size and proportion of urban dwellers, the overall global urban population will still rise substantially and is expected to account for 68 percent of the world’s population towards the mid-century [1]. China’s urbanization process of high-speed take-off indicates the more remarkable achievements compared with the worldwide urbanization process during the corresponding period [2]. The climate environment within cities is particularly vulnerable to rapid urban expansion; enlarging the scale of construction land has produced a large number of buildings and impervious surfaces that take the place of open ground, green areas, water bodies, and vegetations. This intense land-use plan for construction, a symbol of increased urbanization level, is the primary driver for urban thermal environment deterioration and human thermal discomfort [3,4,5,6]. In reaction to this phenomenon, people living in cities are accustomed to stay indoors most of the time and count on the action of heating and refrigeration equipment more than before, tending to neglect the climate regulation of natural factors such as sunshine, wind, plants, etc. This situation is undoubtedly negative to human health and building energy efficiency [7,8,9]. Due to intensifying urban heat islands, the public is giving increasing weight to the availability of open urban spaces, in particular through improving thermal environmental quality [10,11,12,13].
The residential area is a major contributor to the urban heat island effect, and there is a pronounced correlation between the construction density and heat island intensity [14,15,16]. Space for outdoor activities in the residential community, a carrier of daily exercise, neighborhood communication, entertainment, and recreation for the residents, is an important component of urban living environment; its comfort-based optimization offers more opportunities for contacting with nature and establishing social interactions, thus improving the quality of life [17,18,19]. Unlike unavoidable daily tasks, optional activities such as leisure walking and sunbathing are generally carried out on the grounds that people have the inclination, spare time, and available space rather than necessarily participating in them to varying degrees, so this range of activities depends on weather conditions. Outdoor activity space will present with a zero-activity condition upon meeting or exceeding the thermal threshold [20,21]. Taking stock renewal as theme, prospects for urbanization involve a huge transition from the horizontal increment of the new construction project to the vertical development of the existing stock [22], so the overall design direction of inspiring residents to spend more time outdoors for their physical-mental health is supposed to focus on optimizing the environment of existing activity spaces, in particular with respect to its thermal controllability [12,20].
Completely open outdoor spaces fully exposed to the complicated and changeable physical environment are highly susceptible to weather conditions; thermal comfort conditions correlate closely with the microclimatic variables, especially air temperature and mean radiant temperature [23,24]. Compared with a fully open space, the outdoor transitional space, which can be identified as a sheltered area connected to the outside by at least one side without enclosure and vertical interfaces made up of the building elements like walls, glass, and colonnades, is more advantageous when seeking to offer relatively stable thermal conditions due to its greater controllability of daylight levels and wind conditions [25,26]. The outdoor transitional space can be divided into two categories according to the position: one is connected to the existing building and the other is not attached to any building and situated outside separately; its specific spatial forms concretely embrace the arcade, canopy, open balcony, covered street, bus station, the overhead ground floor of buildings, and so on [27]. The semi-open attribute of the outdoor transitional spaces generates a stronger thermal connection to the external environment and provides a buffer zone between interior and exterior to help people accommodate the changing thermal conditions in the surrounding environment. Not only that, but these spaces are able to alleviate adjacent indoor energy demand [28,29,30]. The area under the transitional space can be used as an extended space, offering some protection for people from direct exposure to the harsh sunshine, rain showers, or strong winds, providing a sheltered environment similar to an indoor space but at the same time enabling users to enjoy the outdoor natural conditions and giving the spatial opportunity to carry out a series of activities [31,32,33]. Due to its potential for microclimate regulation and easy configuration with less site restrictions, the transitional space is an effective mitigation measure for relieving thermal discomfort and to improve the environmental quality of the existing outdoor spaces.
Residential areas are places where people are highly concentrated, and their outdoor activity spaces are closely connected with residents’ daily lives. So, the positive benefits that a favorable thermal environment can produce are of great significance in the long run. It is particularly well suited to provoke the interests of more local residents to walk out of the house and engage with their communities by offering a highly efficient, comfortable outdoor public space for the residential quarter. With such site support, residents tend to replace staying indoors most of the time with taking part in a series of outdoor activities. More frequent outdoor pursuits alleviate energy needs by avoiding the long-time use of heating and refrigeration equipment, thus contributing to the development of human health and building energy efficiency to a certain degree. This study takes the optimization design of the thermal environment in outdoor spaces as the starting point. Transitional spaces are subsequently introduced into the current conditions because of their potential for microclimate regulation and easy configuration with less site restrictions, serving as an effective mediator of improving thermal comfort. The study mainly explores the optimum design parameters of the transitional spaces for increasing outdoor thermal comfort under the local climate of Tianjin, with a focus on the effectiveness of changes for its orientation, aspect ratio (H/W), plan aspect ratio (L/W), and enclosure degree in terms of improving the microclimate. Additionally, the use of the transitional spaces in different climates zones is discussed, and some generalizations about the appropriate geometrical proportion and orientation of a transitional space for a given climate have also been summed up.
2. Background Study
2.1. Studies About Effects of Design Parameters of Transitional Spaces on Microclimate Under Different Climate Zones
The integration between receiving the moderate amount of solar radiation and improving the availability of air movement by modifying the geometrical relationship and orientation of transitional spaces is capable of maximizing its potential for the shading effect and ventilation. The impact that design parameters of transitional spaces can have on the microclimate of open spaces has been studied in various urban environments and climate regions.
2.1.1. Studies About Effects of Orientations of Transitional Spaces on Microclimate
Through the literature review summarized in Table 1, it can be discovered that the outdoor transitional space is widely used in regions with a tropical, subtropical, and temperate climate. For some reason, its unique architectural form, which provides a sheltered but not enclosed environment, similar to an indoor space, means that this type of space can permit proper air circulation in addition to shade from solar radiation and shielding against the rain [34]. As such, the outdoor transitional space is especially useful in cities where local climatic patterns have characteristics of high temperature, intense sun radiation, or high levels of rain [35]. Such climates share a particular need to consider defending against overheating in summer by partly blocking solar radiation [36]. Compared with situations where no sheltering roof and enclosing structure are provided in the outdoor space, any orientation of transitional spaces generally improves the current thermal environment, thereby displaying better thermal comfort conditions [37]. Studies investigating the optimum orientation of transitional spaces in different climate conditions and urban contexts have shown variability due to the varied requirements of solar radiation reception, shading extent, and the control of ventilation performance. Even if the relevant conclusions contain discrepancies, the deviation of the preferred orientation in the corresponding cities from the due south orientation is within 90° of a counterclockwise rotation [38,39].

Table 1.
Design studies on orientations of transitional spaces in different climatic zones.
2.1.2. Studies About Effects of Aspect Ratio and Plan Aspect Ratio of Transitional Spaces on Microclimate
Orientation is not the only variable that governs particular outdoor environments. What the effect of adjusting microclimate from the transitional spaces under the specific environment produces is the result of the multiple factors to which they have been exposed. There are a set of complex interactions between various design parameters of transitional spaces, and the microclimate regulation of these interactions differs from region to region because of the varied climate. This synergistic effect determining the comfort level in open spaces can be mainly attributed to the combinatorial availability of the transitional space geometry and orientation [36]. The two significant incentives are closely associated with solar access, shadow control, and ventilation conditions; it comes from the fact that altering the geometric scale of the transitional spaces by looking at local demands have an immediate effect on the solar radiation fluxes and distributing pattern of wind flow, and then modify the radiative and convective heat exchange within urban open spaces at the pedestrian level [44]. The geometrical morphology of a transitional space can be characterized by means of its aspect ratio (ratio of width to height) and plan aspect ratio (ratio of length to width) [45]. According to the past research findings listed in Table 2, Changes to the aspect ratio imply the degrees of sky exposure, so integrating shadow range analysis in the shape finding of transitional spaces can induce reasonable settings for controlling the duration of the thermal discomfort period inside the transitional spaces. Excessive sunshine in summer will likely cause overheating and will deteriorate the environment in street [46].

Table 2.
Design studies on aspect ratios of transitional spaces in different climatic zones.
2.1.3. Studies About Effects of Enclosing Degree of Transitional Spaces on Microclimate
The semi-open spatial form may create more superior thermal advantages over the fully exposed urban open space due to its effective shading, but there are also differences of thermal performance in various areas within the transitional space itself. From the contents listed in Table 3, it can be seen that the edge of the transitional spaces has a weaker thermal stability compared to the central areas due to more exposure and less shadow [51]. This finding points out that the major shortcoming of high openness is that it brings in more solar radiation, which causes deteriorating thermal conditions and then brings down the effective availability of the entire space. This situation is undoubtedly negative to relieve the level of thermal discomfort in hot regions with high thermal stress during summer. The more open the space form, the more exposed it is to wind [52], so transitional spaces with different degrees of openness reflect different ventilation potential. As such, the air temperature and wind velocity is inversely associated with the enclosure degree of the transitional spaces, while for relative humidity, the opposite is true [53,54,55].

Table 3.
Design studies on enclosure degree of transitional spaces in different climatic zones.
2.2. Summary of Background Information
According to background information in the study, previous studies have shown that climatic condition is a prerequisite for research in thermal comfort of outdoor transitional spaces. The optimal geometry for outdoor transitional spaces differs across climate conditions because each specific place has its corresponding requirements of solar access, shading extent, and ventilation effect. The thermal regulation performance of semi-outdoor transitional spaces varies significantly depending on several design parameters. The extended solar exposure duration in east-west oriented linear urban open spaces compared to north-south configurations results in significantly higher thermal stress, particularly in summer months. So, in hot climates, orienting semi-outdoor transitional spaces away from east-west alignment proves more thermally advantageous. But in temperate zones, east-oriented layouts of these spaces show certain advantages with higher thermal comfort frequency. Research indicates that in humid or dry hot climates, outdoor transitional spaces with higher aspect ratios are at a disadvantage in thermal environmental improvements as they permit excessive solar radiation penetration, thereby deteriorating the thermal conditions. In solar-sensitive hot regions where east and west exposures are inherently disadvantageous, thermal performance improvements from aspect ratio reduction will remain seriously limited. Paradoxically, lower aspect ratios may restrict airflow, compromising ventilation efficiency and heat dissipation in such spaces. However, strategic adjustment to the enclosing degree of openness is expected to compensate for these ventilation limitations in this case. Outdoor transitional spaces with side enclosures demonstrate enhanced solar shading efficiency, significantly mitigating adverse effects caused by direct sunlight. While increased openness improves wind exposure, in tropical and subtropical regions, where solar radiation control is paramount for preventing overheating, highly open configurations seem to disagree with this requirement. Finding the right balance between these two conflicting goals is serving a need. In temperate climates, the demand for warmth in cold winters should be given the same status as solar shading. Therefore, location of side structures becomes particularly influential, as winter winds create cold discomfort. Positioning the structures on the windward side can generate sheltered zones, expanding available areas for outdoor activities.
As with most studies of thermal comfort, the interpretation related to their own thermal performance of geometrical parameter variations for outdoor transitional spaces generally focuses myopically on one given location, and the variable always contains a single parameter. Despite the differences, the appropriate design parameters for outdoor transitional spaces in various climatic regions share some things in common, a factor that is too often ignored. In subsequent sections, the effectiveness of the geometry manipulation in thermal environmental quality enhancement under the temperate climate of Tianjin is reported. In addition, this article makes a comparative analysis of the similarities and differences between temperate regions and other climatic regions and the suitable parameter design for such spaces in order to propose relevant design recommendations for various climates.
3. Methodology
3.1. Study Areas
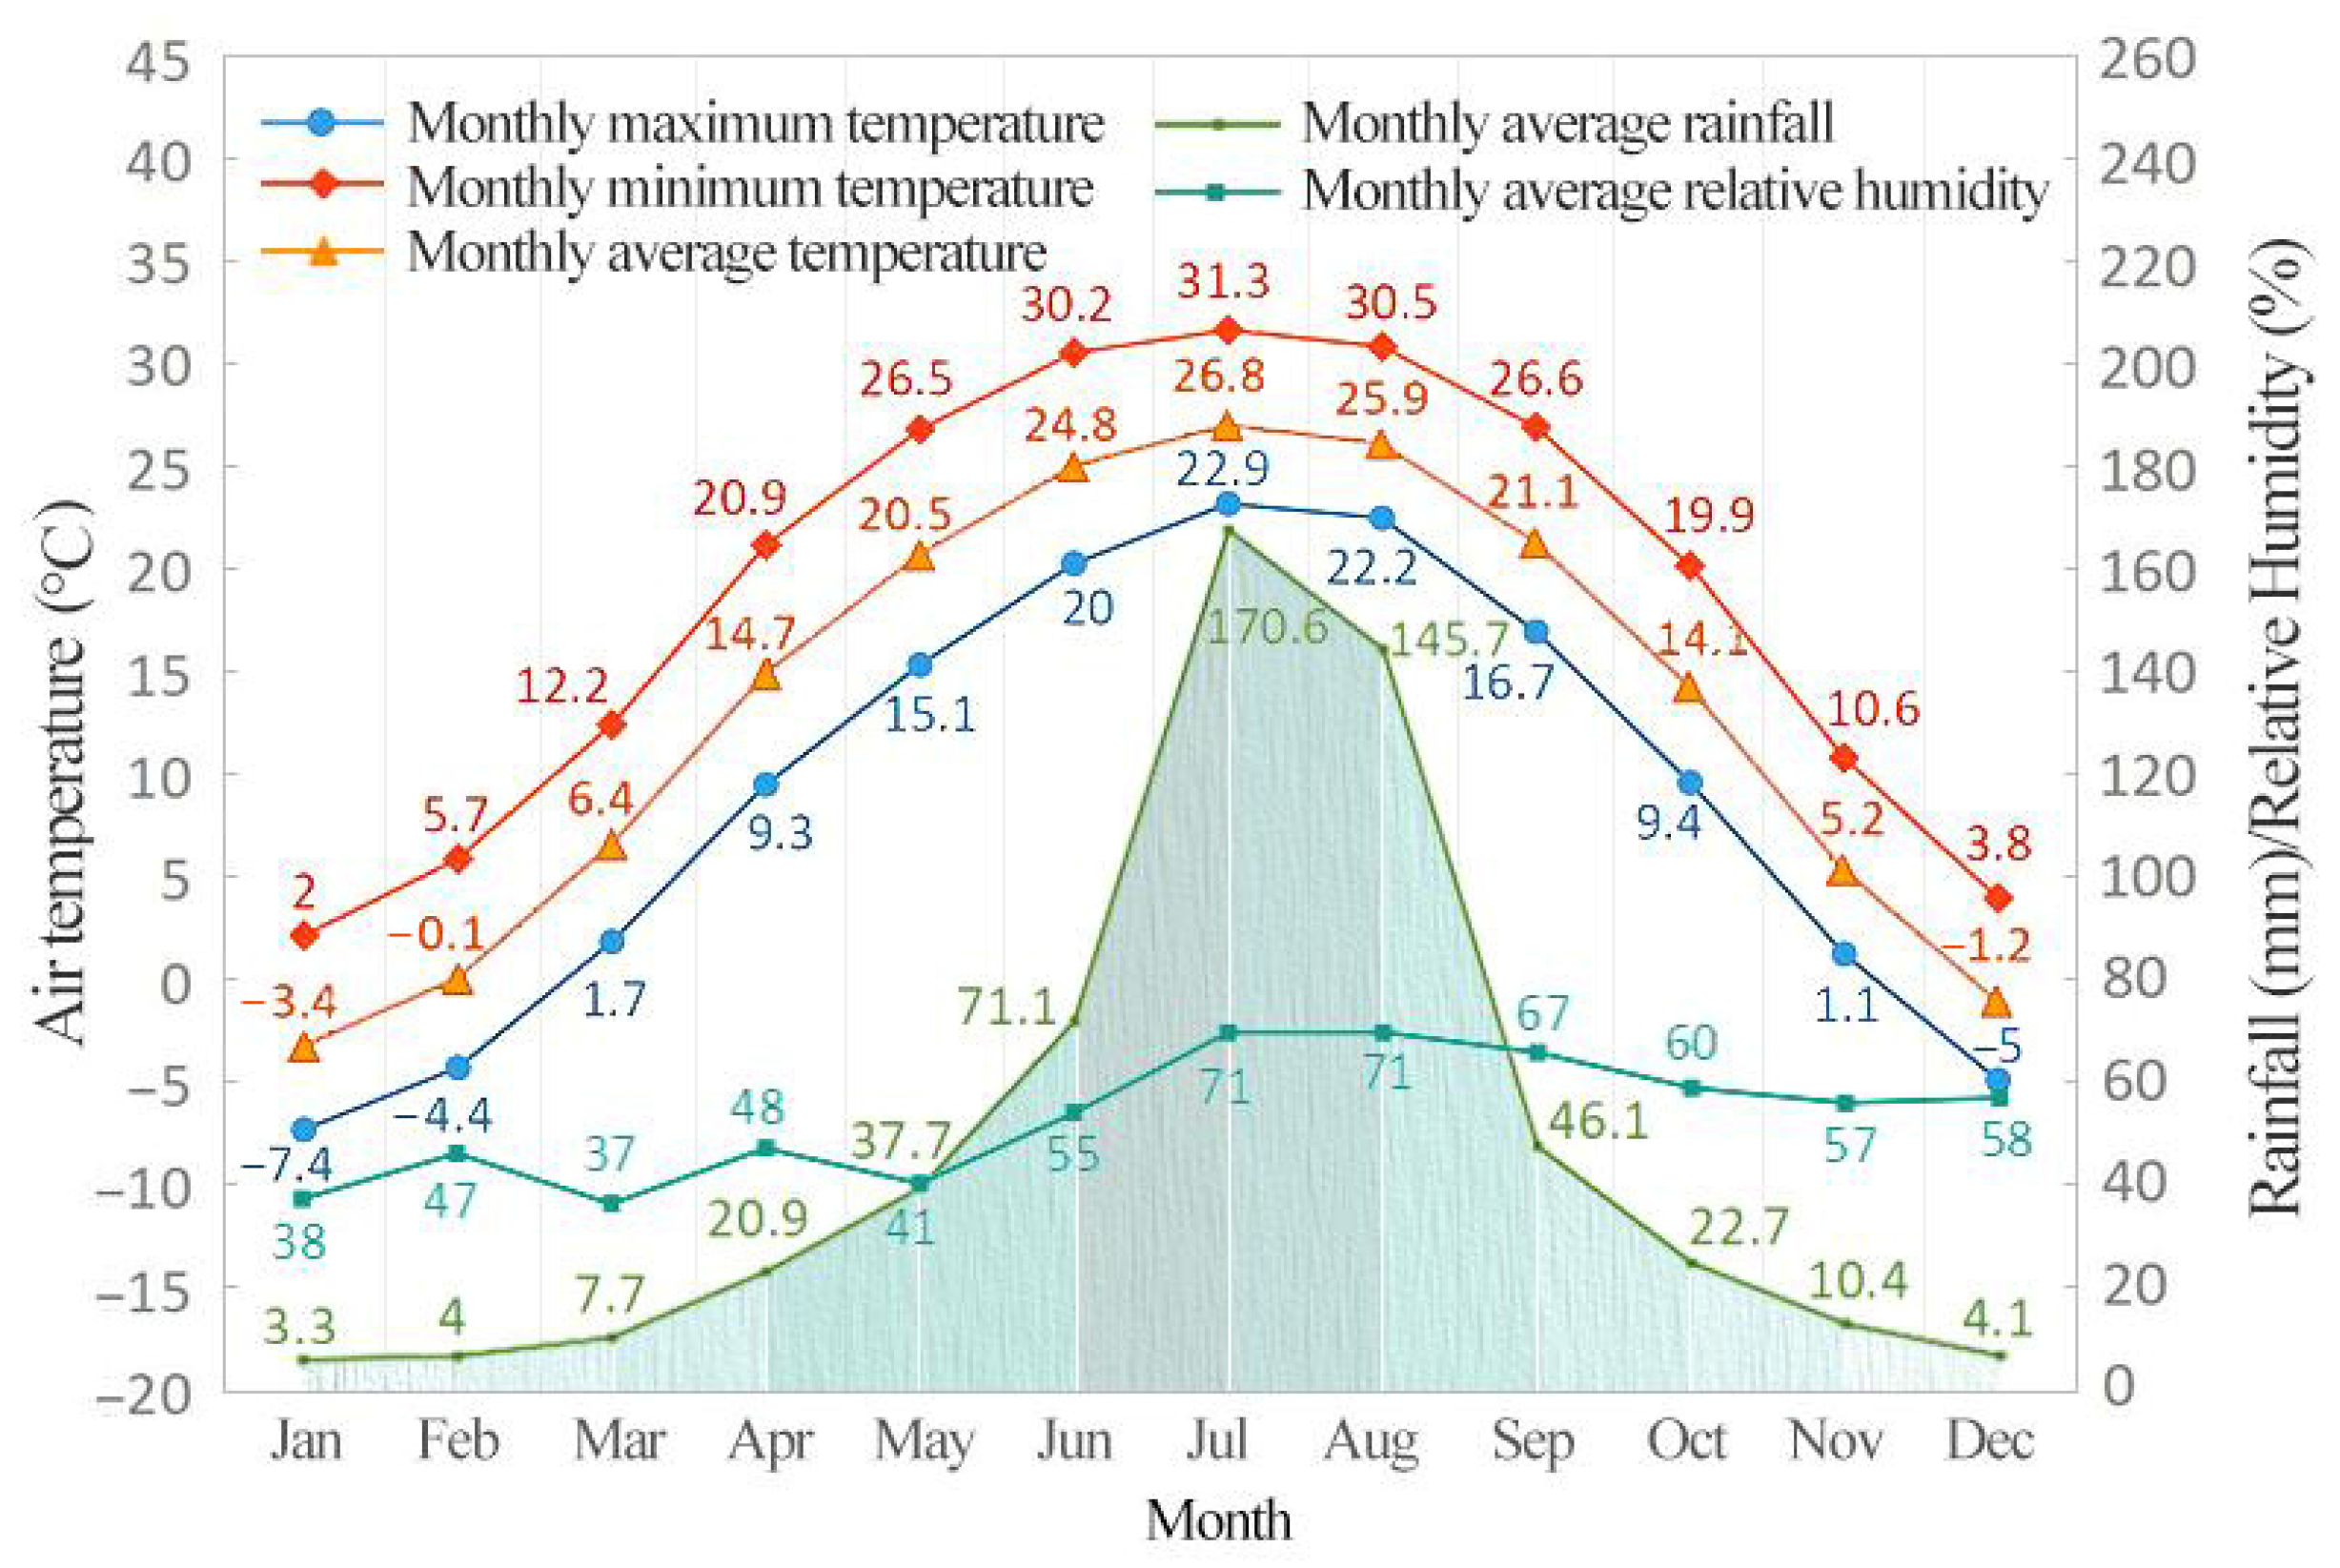
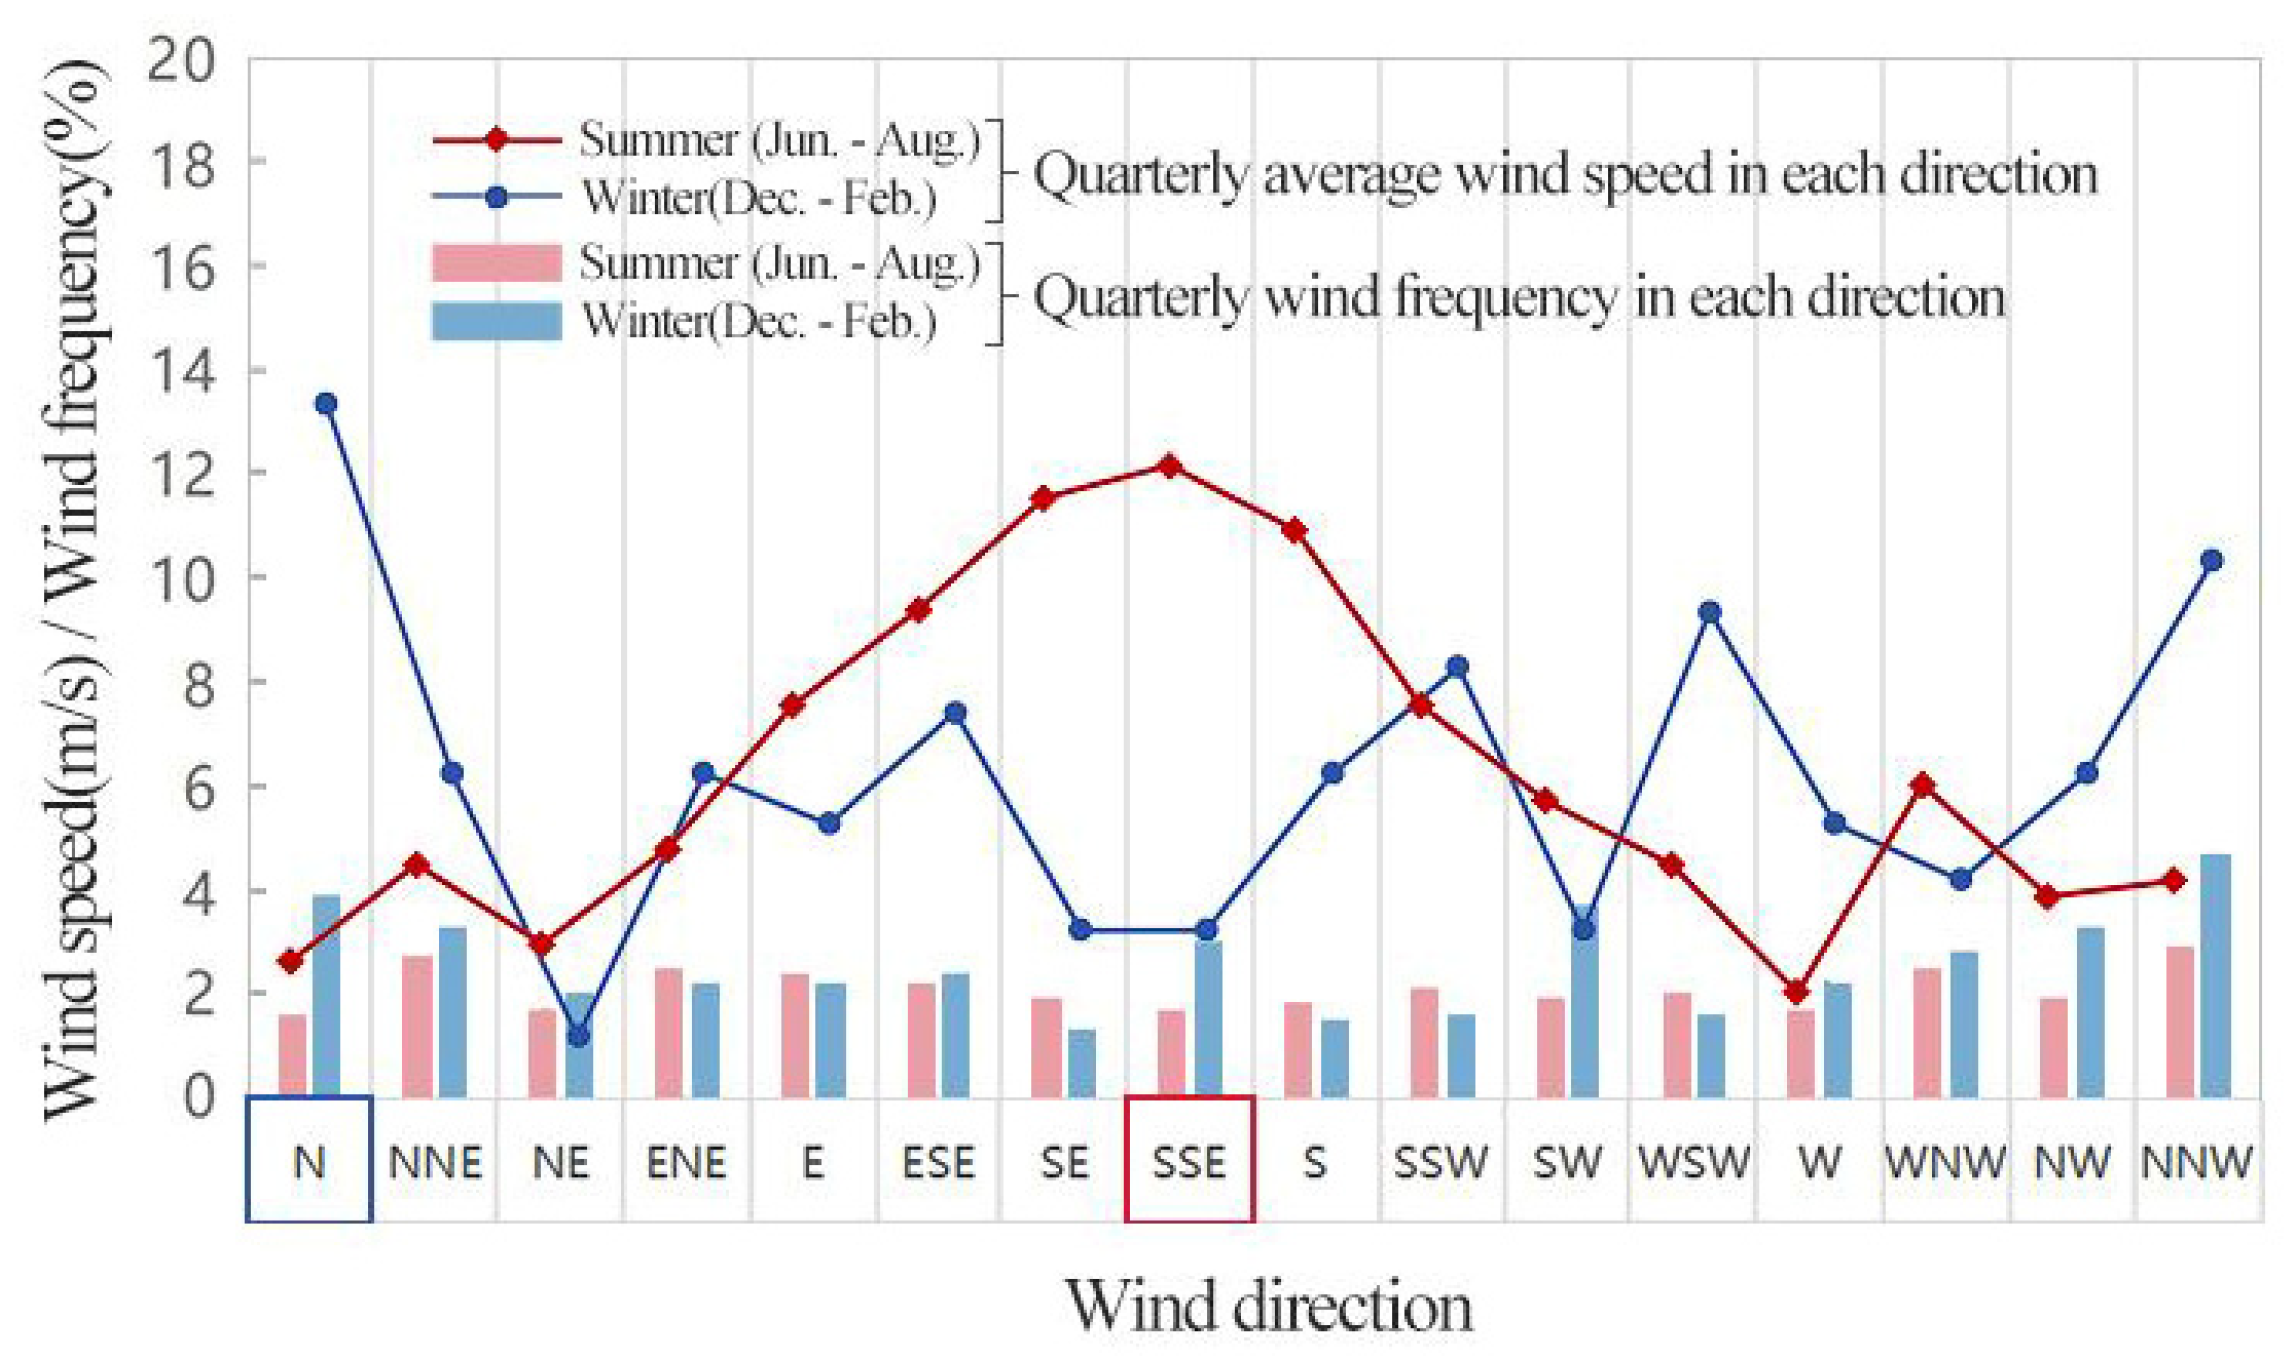
This study was conducted in Tianjin (38°34′–40°15′ N, 116°43′–118°4′ E), a harbor city in the northern coastal part of China. On the basis of the Koppen-Geiger climate classification [57], it belongs to the Dwa climatic type (can be explained as the warm temperate semi-humid continental monsoon climate), which is characterized by four distinct seasons, synchronous rain and heat, remarkable monsoon conditions, and relatively abundant solar radiation. The radiant energy received by any area of the earth’s surface from the sun varies periodically; in Tianjin city, the total amount of solar radiation in spring and summer is much larger than that in winter. Based on the monthly average values of various meteorological factors in Tianjin during the past two decades (see Figure 1), the monthly mean temperature and rainfall have a sharp seasonal contrast. The coldest weather comes in January, with a prominent decreasing trend of the average relative humidity, while the highest temperature appears in July, with the relative average humidity reaching a peak of 71%. The prevailing wind direction has great variation from season to season (see Figure 2). The perennial dominant wind direction in summer is south-southeast, but when winter comes, this region blows mainly northerly.
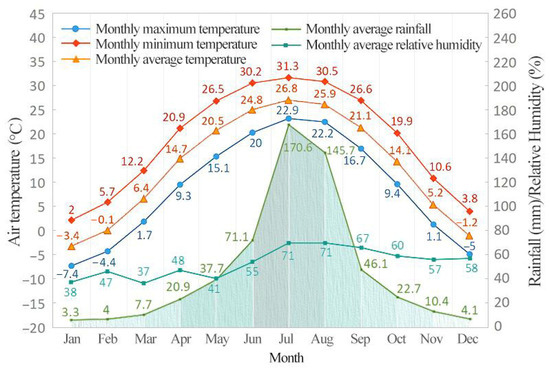
Figure 1.
Monthly average values of various meteorological factors in Tianjin during the past two decades. Source: Dedicated meteorological database for thermal environment analysis of Chinese buildings.
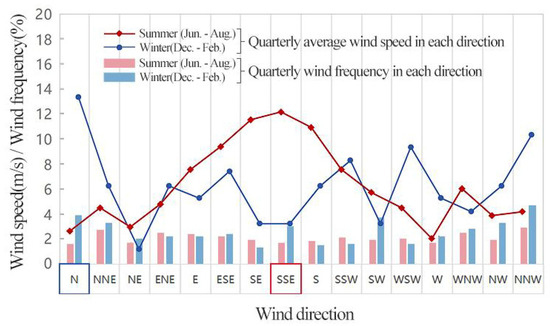
Figure 2.
Quarterly average wind speed and frequency of each direction in Tianjin during the summer and winter. Source: Dedicated meteorological database for thermal environment analysis of Chinese buildings.
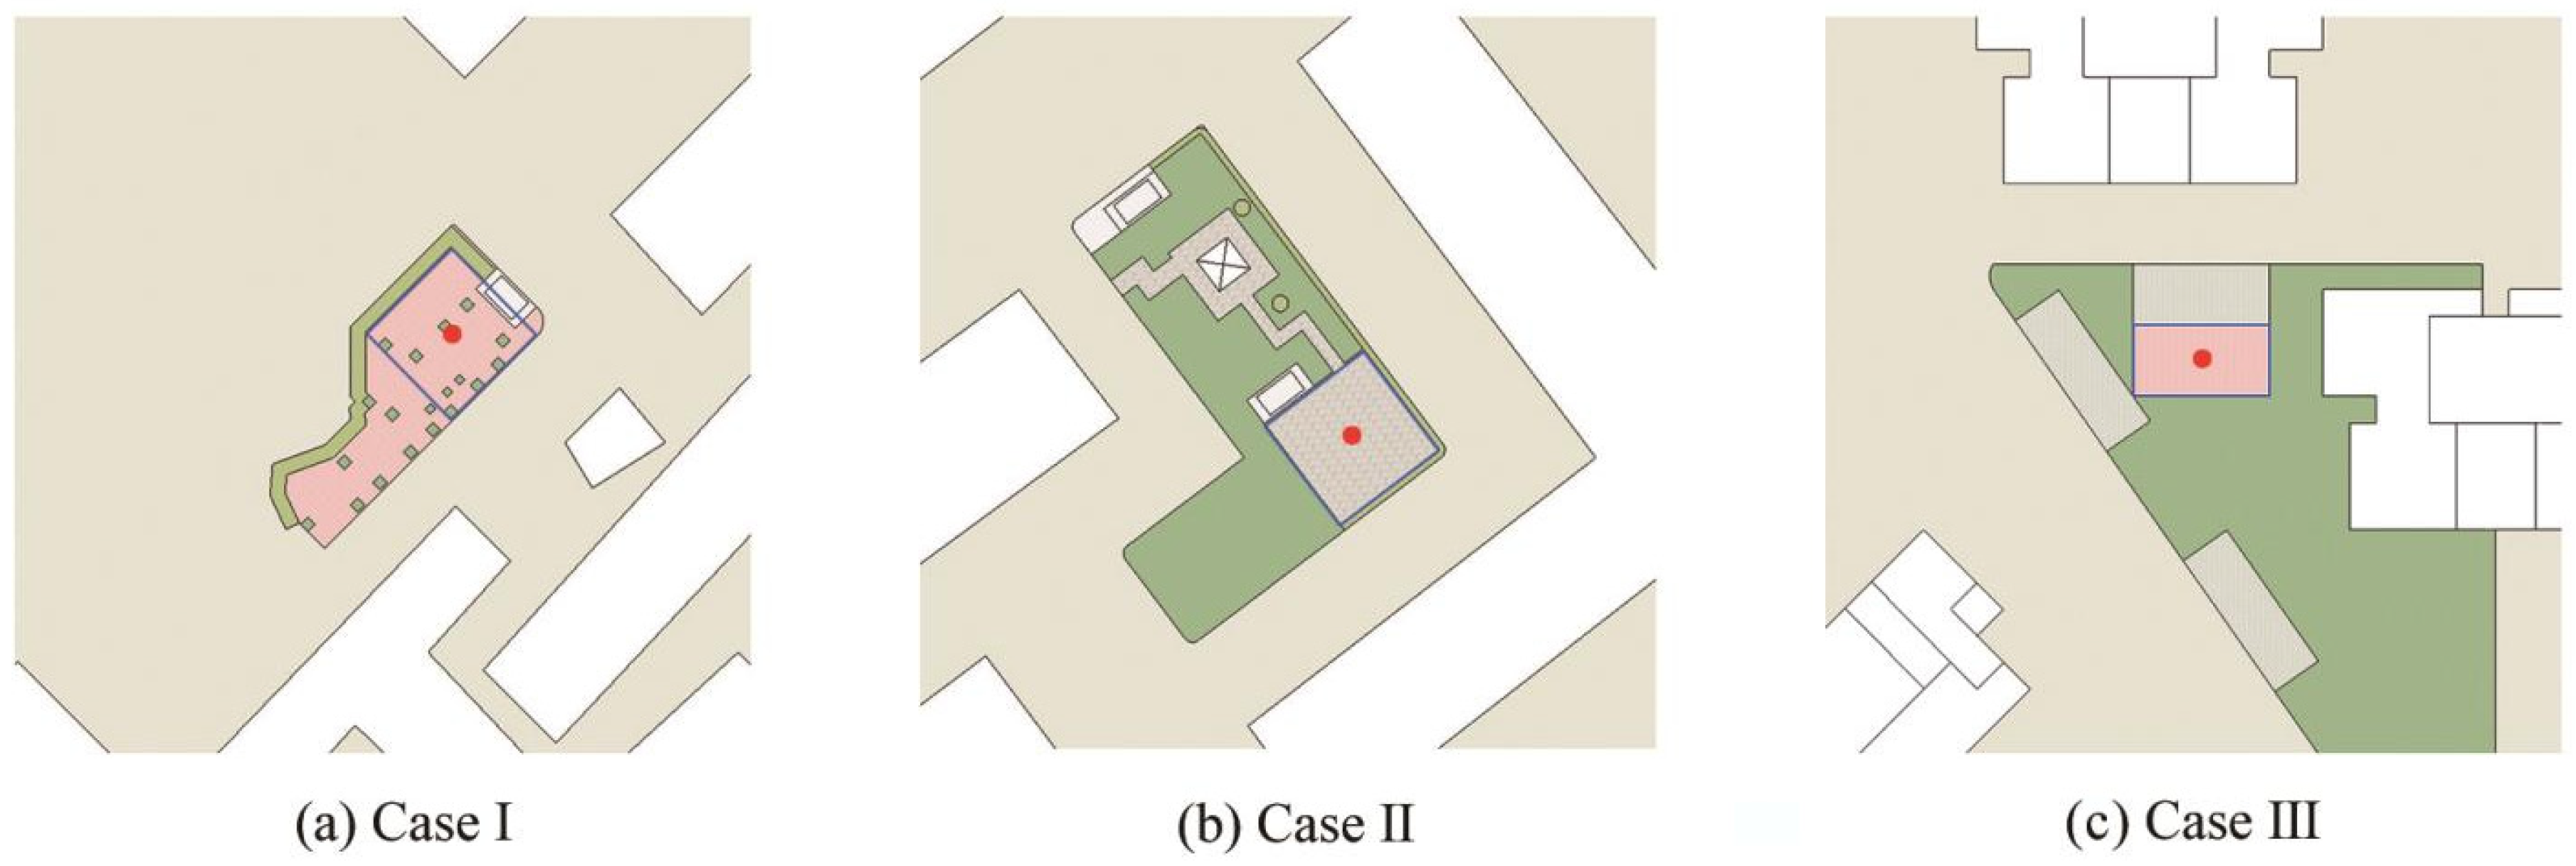
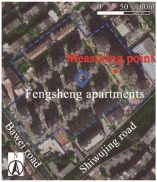
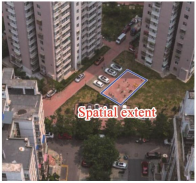
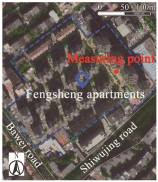
The simulation process for various optimum design parameters can become computationally challenging due to the countless and diversified outdoor activity spaces. To simplify the work of the simulation result acquisition, we select three typical outdoor activity spaces in residential areas as representative for exploring the thermal impact of different spatial patterns of transitional spaces on outdoor activity spaces. The simulation results can then be compared to identify similarities between them and to catch the common information. Finally, extending the optimum design parameters of outdoor transitional spaces applicable to all the measured sites to the whole Tianjin area for improving the outdoor thermal comfort is possible and feasible. The research method for the extension of a single-zone application to a multi-zone application has been recognized in previous studies [58,59]. Therefore, three existing apartments, namely Longhong, Zhigu, and Fengsheng, were selected in the section from Shierjing Road to Dazhigu 8 in Hedong District, Tianjin. The basic information of the investigated apartments and measurement sites are presented in Table 4, which highlights the factors that have an impact on the thermal environment of the outdoor activity spaces, including the layout, ground materials, and plant configurations.

Table 4.
Basic information of the investigated residential area and corresponding outdoor activity spaces.
3.2. Physical Measurement
According to Zhang’s method for season division using pentad averages of local temperature in 1934, the average temperature of five days in succession reducing steadily to under 10 °C is considered as the beginning of winter, while this value rising to higher than 22 °C is considered as the beginning of summer [60]. Based on the monthly mean temperature trend graph shown in Figure 1, it can be seen that Tianjin has a great time span of both winter and summer, among which winter is the most prolonged, lasting for more than five months from early November until mid-March, followed by summer, which starts from mid-May and lasts for about three months until mid-August. In view of the fact that spring and autumn are short and quite pleasant, residents’ outside activity is less influenced by weather conditions, so the survey will be carried out on typical summer and winter days. The field survey was conducted in August 2022 and January 2023, with four meteorological parameters (including air temperature, relative humidity, wind velocity, and global temperature) recorded every thirty minutes using a hand-held instrument in the center and sunlit region without shadow of the measurement site during the period from 8 am to 6 pm. The instruments for monitoring the micrometeorological parameters are shown in Table 5. The measuring point is placed in the center of the open area in the corresponding site rather than its peripheral areas for the purpose of obtaining the overall spatial microclimate characteristics and avoiding the local extreme values caused by disturbance due to the proximity to buildings, trees, or roads in its peripheral areas. If temporary interference cannot be avoided, such as the variations of the shade from other objects, the measurement point can be slightly dynamically adjusted. Direct sunlight must be avoided when taking the air temperature measurement. In the whole measurement process, no human activities should be carried out around the measuring point to avoid man-made interference. In consideration of the two activity states of the residents when they are standing or sitting in daily life, the instrument was placed at a vertical distance of 1.5 m from the ground in order to represent the gravity center position when a person standing up and the position flush with the head or shoulder when a person sitting. All measurements were performed on clear and cloudless days.

Table 5.
Measuring Instruments used for micrometeorological parameters and their accuracy.
3.3. Simulation
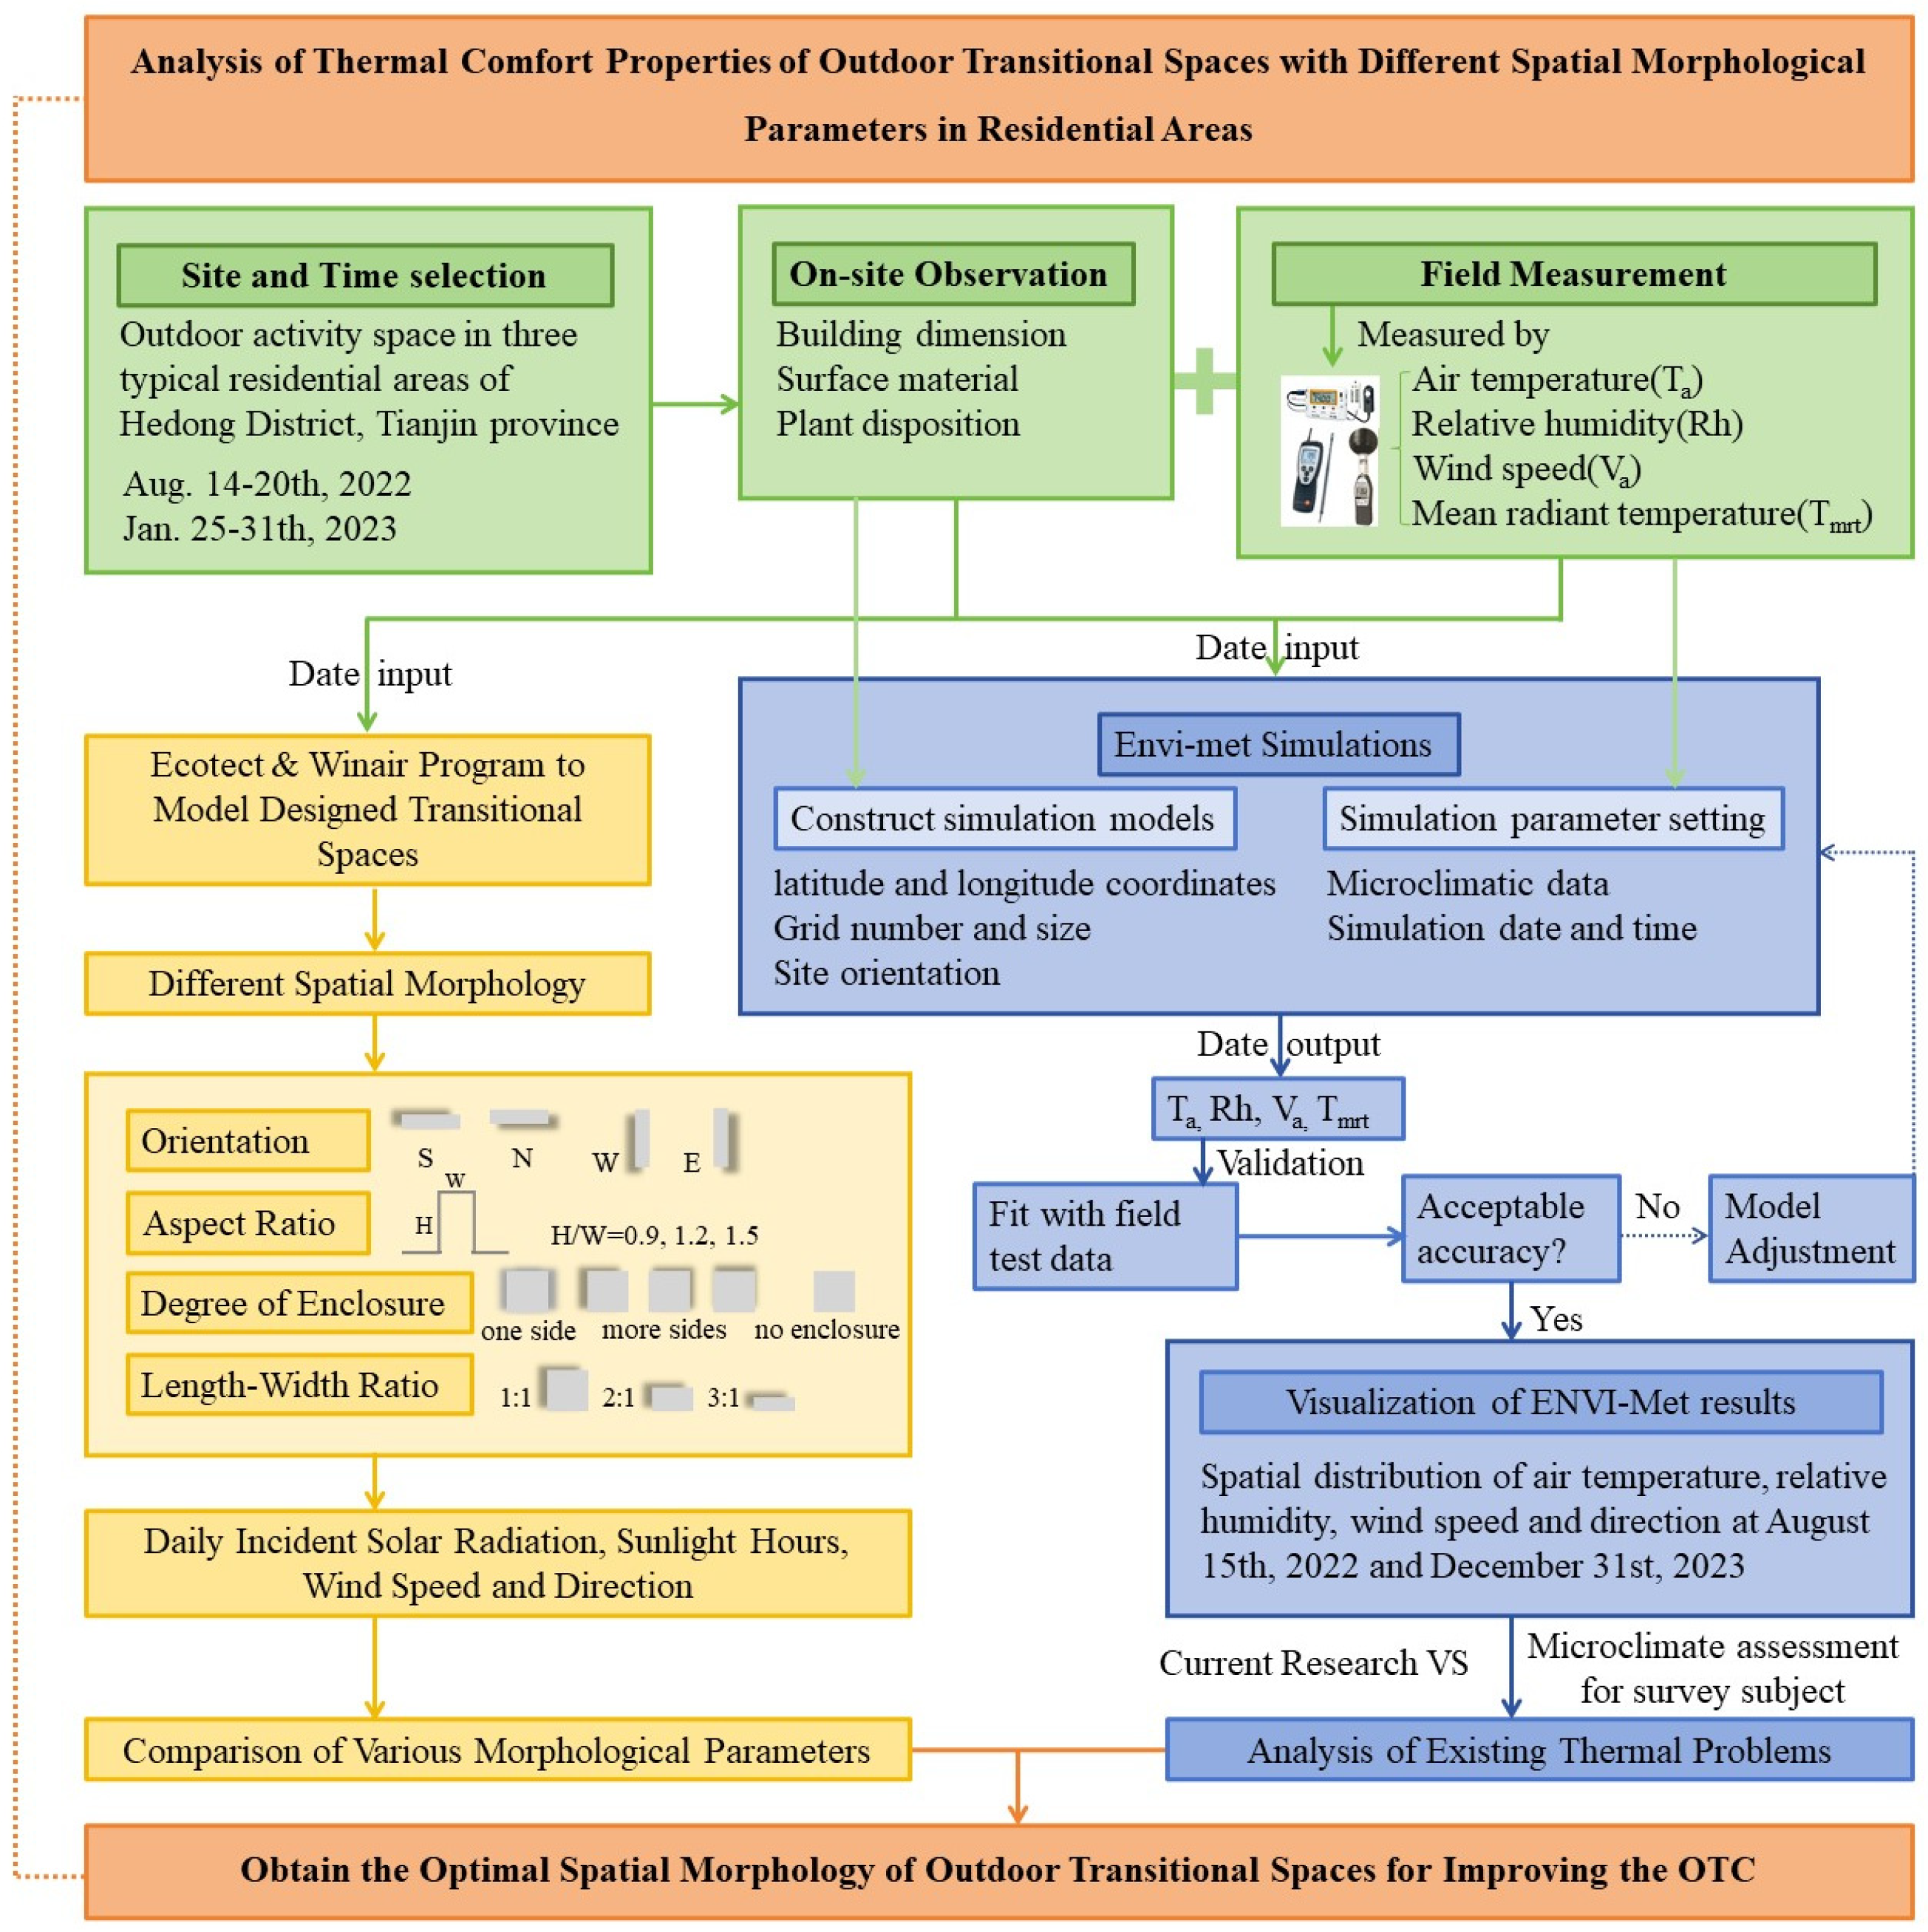
ENVI-met is relatively sensitive to small scale changes, thus better simulation of microscale interactions between urban surfaces, vegetation, and the atmosphere can be realized [61]. The measurements collected from the specific measuring sites in each area are used as the original entered value for simulations, and then using ENVI-met micro-meteorological software to model three typical outdoor activity spaces and its surrounding environmental conditions in residential areas and, from point to plane, visualizing the thermal environment to compensate for the inability of field monitoring to directly reflect the spatial distribution of microclimatic parameters in outdoor spaces. To verify that the ENVI-met can simulate the micro-meteorological parameters of the given areas, the results of real measurements is compared with those of the simulation. Second, simulation experiments are carried out in Ecotect and Winair on the various orientations and geometric shapes of outdoor transitional space in Tianjin through the variable-controlling approach to help explore the relationship between thermal environment comfort and outdoor transitional space with different design parameters. Finally, the results obtained from the simulations are used to examine the thermal regulation level of the outdoor transitional space under different optimization strategies. The basic frameworks of this study are as follows in Figure 3:
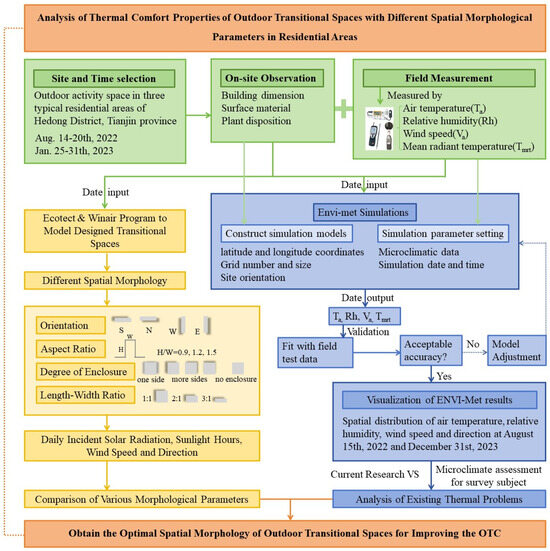
Figure 3.
Methodology framework.
4. Results
4.1. Field Experiment Results
Table 6 summarizes the values of each meteorological parameter measured in the research field for the hot and cold seasons, where the difference can reflect the wide range of changes to the weather conditions in these data. These high-frequency climate fluctuations throughout the study period are consistent with the typical climate patterns of hot-summer and cold-winter in Tianjin. The highest temperature measured in August exceeds 36 °C, which is approaching the limits of the physiological endurance of the residents. The changing trend of relative humidity is similar with that of air temperature; when the temperature rises, the relative humidity also rises significantly, so the hot season is more humid, but the cold season is quite the opposite. In general, the microclimate conditions of the measurement sites are concentrated in low humidity zones below 10 °C and high humidity zones above 25 °C. The acquisition to solar radiation intensity in the field research was not conducted by direct measurement, but by measuring the global temperature and calculating the difference with the air temperature to reflect it indirectly. The larger the difference, the stronger the solar radiation. This phenomenon is particularly prominent during summer days, thus indicating that the solar radiation intensity is prone to maximize during temperature rising stage, which shows the importance of shade in the summer. The wind speed in winter is generally higher than that in summer, which is not conducive to the thermal demand for heat preservation in winter.

Table 6.
Characteristics of each meteorological parameter at the measuring points.
4.2. Numerical Simulation
4.2.1. Establishment of Measuring Site Model
To visually represent the characteristics of the microclimate environment and thermal conditions of the outdoor activity spaces in the selected residential areas, ENVI-met was selected for performance simulation. On the basis of establishing the simulation area, the boundary parameters and related attributes of the model were set in ENVI-met. On the basis of simplified representations of site conditions, the SPACES module is used to depict the main spatial morphological characteristics and key thermal environment influencing factors of the selected study area as much as possible. The specific coordinates of 39°12′ N and 117°2′ E were set according to the geographical location of Tianjin. To simulate the specific scenarios, ENVI-met requires a regional model that digitally represents the study subject, incorporating the geographic position, meteorological information, three-dimensional model for buildings, land covering material, and vegetation. The input data regarding the morphology and physical characteristics of the study sites were obtained through on-site inspection. The model is constructed in a three-dimensional framework, featuring two horizontal axes (x and y) and one vertical axis (z). The computational domain consists of grid cells that determine the model’s spatial resolution. Within this domain, various elements such as buildings, vegetation, and surface types are assigned to their respective grid cells. For this research, the horizontal dimensions of the three studied cases were carefully configured to accurately represent outdoor activity space proportions and to ensure appropriate resolution for vegetation placement. The horizontal grid resolution was specifically aligned with a common divisor of the side length of the three selected outdoor activity spaces. The vertical grid resolution was defined in correspondence with the floor height of the building units. Both resolutions were set to 3 m. To reduce the effects of model borders on grid generation results, for the horizontal layer, the core modeling regions (i.e., the portions of outdoor activity spaces) were along the edge away from the computational domain, while in the vertical layer, the simulation employed a total domain height of 150 m (divided into 50 cells), which was twice as tall as the tallest building height (75 m in this study). Specifically, the number of grids was set to 50 (x-axis) × 40 (y-axis) × 30 (z-axis) for Case III model, and 50 (x-axis) × 50 (y-axis) × 30 (z-axis) for Case I and II models; nested grids with a resolution of 3 m (x-axis) × 3 m (x-axis) × 3 m (x-axis) were selected to represent a site of 150 m × 120/150 m. The actual space was generated to correspond to the actual space in the site of 150 m × 120/150 m. After generating the grids, the visualization model was created by identifying the type of the underlying surface, the spatial location and shape of the surrounding buildings, and the configuration of the plants, corresponding to the actual space (see Figure 4).

Figure 4.
The model of three typical outdoor activity spaces and its surrounding environmental conditions.
4.2.2. Simulation Parameter Setting
We set the parameter values for simulation in the ENVI-guide module according to the measured data. The simulations required meteorological boundary conditions, which could be supplied either manually or via a weather file. With air temperature and relative humidity data available, a simple forcing method was employed to define boundary conditions for the model in our study. Accordingly, the simulated temperature results were evaluated against recorded values. Given the complex calculation and long operation time of ENVI-met simulations, conducting full-scale analyses of all cases across the entire summer and winter period was impractical. To address this, a representative day was selected for the hottest and coldest month, constructed by calculating hourly arithmetic average values of air temperature, wind speed, and relative humidity in the measuring points to provide a mean condition of the month. By simulating this synthesized day instead of each individual day, the computational demand is significantly reduced while still capturing the essential climatic characteristics of the period. Based on this method, two typical days in different seasons are selected to calculate the hourly average temperature and humidity as well as the wind speed for the whole day as the initial climatic parameters for simulation. Since the research day is chosen as the clear days when residents have the intention to go out, the simulation does not consider the effect of cloudiness, so this parameter is set to 0. The result is to generate a set of data every 1 h, and the output includes physical environment parameters such as air temperature, solar radiation, relative humidity, wind speed, and so on. The specific values of the basic parameter settings are shown in Table 7.

Table 7.
Basic parameter settings of the simulation.
4.2.3. Validation of the Numerical Results
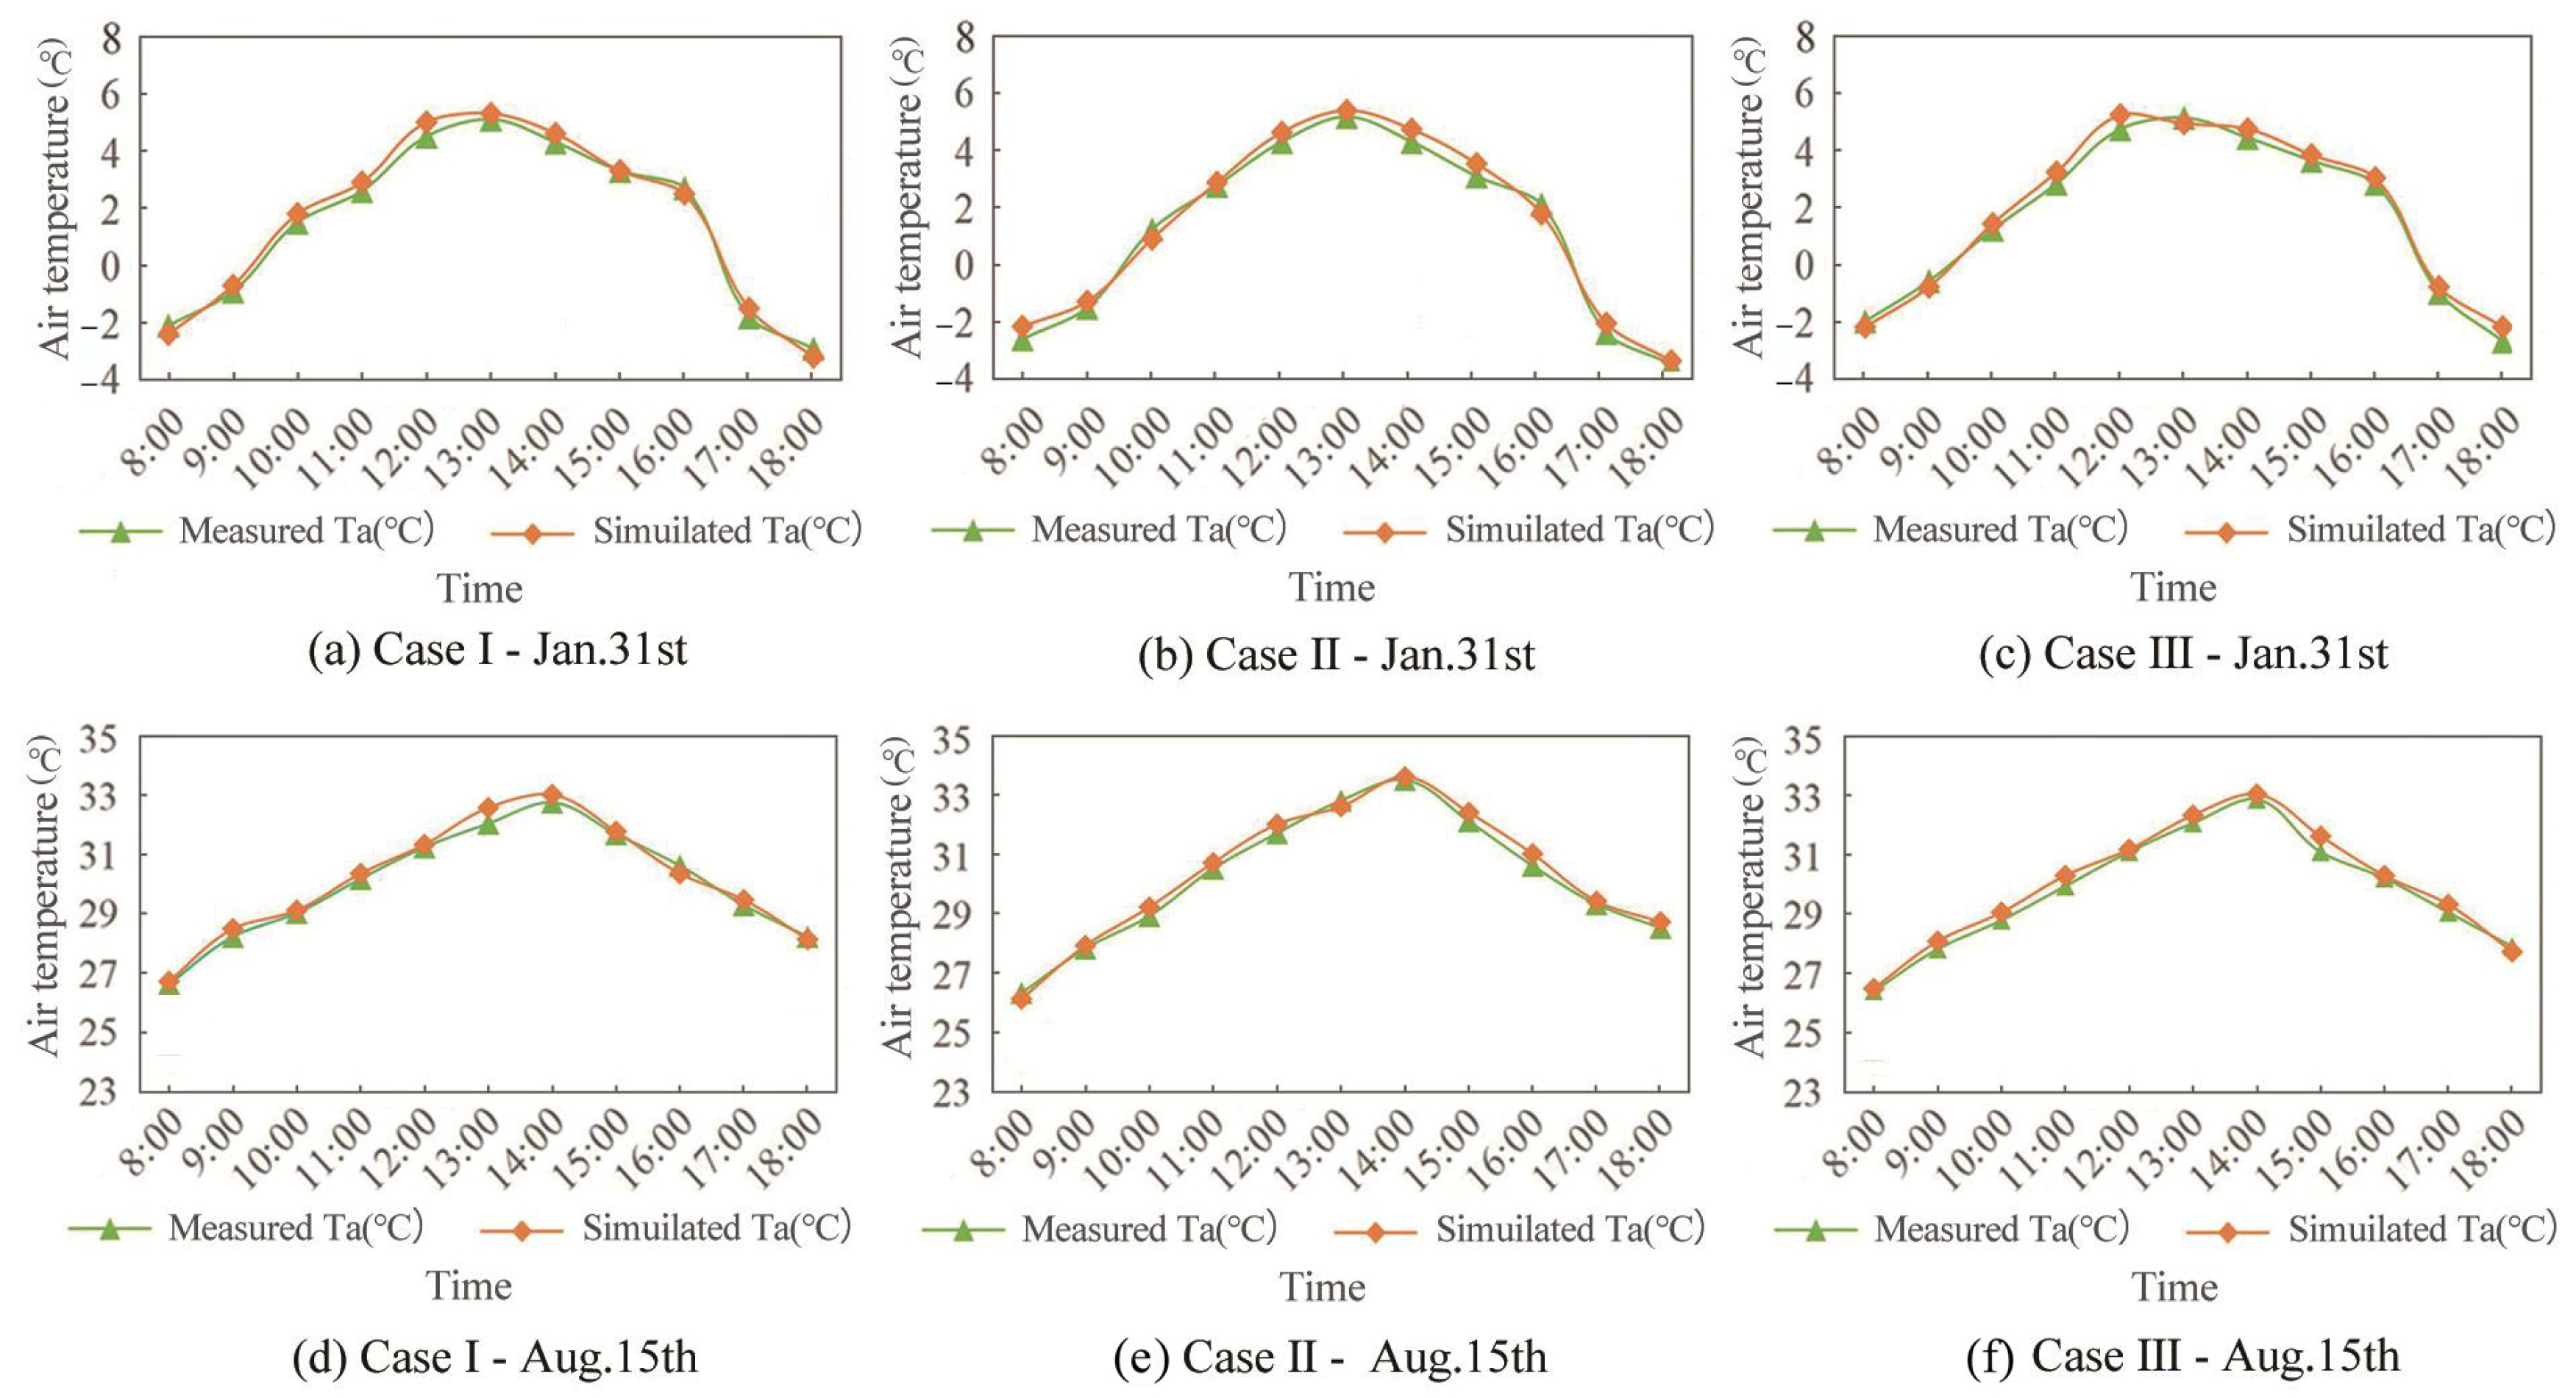
Air temperature (Ta) is the most commonly adopted variable for model validation in existing studies [62]. Since the meteorological data obtained were at a vertical distance of 1.5 m from the ground, ENVI-met outputs the simulated temperatures on 15 August and 31 January at the same height as the actual monitoring sites for comparison and analysis. Although Figure 5 shows that the calculated values of ENVI-met are slightly higher than the measured values, the trend is more consistent, and the error is basically controlled within 0.5 °C. To go a step further and validate the accuracy of the numerical simulation, the simulated data at 1.5 m height were validated against field measurements taken between 8:00 and 18:00 on 31 January and 15 August by the coefficient of determination (R2). R2 provides an intuitive measure of model performance, with better fitting effect and prediction accuracy of the established model as its values approach 1. As an error assessment technique, RMSE shows enhanced model reliability with values that are closer to zero. The value of R2 for Ta is 0.986 while the RMSE for Ta is 0.272 °C. It has also proved a high concordance of the predicted values with the experimental ones, meaning that the model is relatively reliable and reasonably describes the experimental results. The reason for the error may be due to the interweaving of incidental and human factors in the measured environment, which makes the micro-environment of the site a complex measurement object, while the software simulation process cannot consider the influence of this uncertainty. Furthermore, ENVI-met V5.6.1 adopts open boundary conditions, which are unable to consider the overall influence of everything in the vicinity. An initial set of meteorological simulation parameters is based on the 1-h arithmetic average value of the field records, but the weather conditions can change on a dime. As the outdoor space is a complex collection of various elements, the three-dimensional solid modeling has inherent limitations in comprehensively representing the realistic nature of actual buildings, plant structures, ground surface characteristics, and so on, meaning that it is impossible for modeling to cover all facets here. Despite this, ENVI-met is appropriate in simulating the microclimate environment of outdoor spaces in Tianjin.
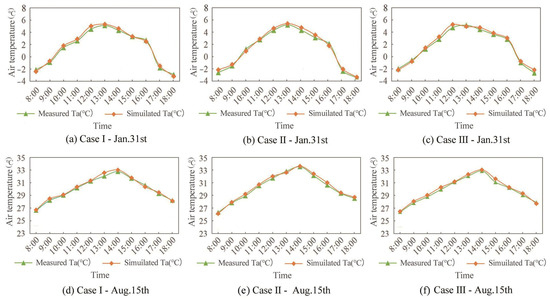
Figure 5.
Comparison of measured and simulated hourly temperatures at measurement sites.
4.2.4. Analysis of Thermal Environment at Measuring Sites
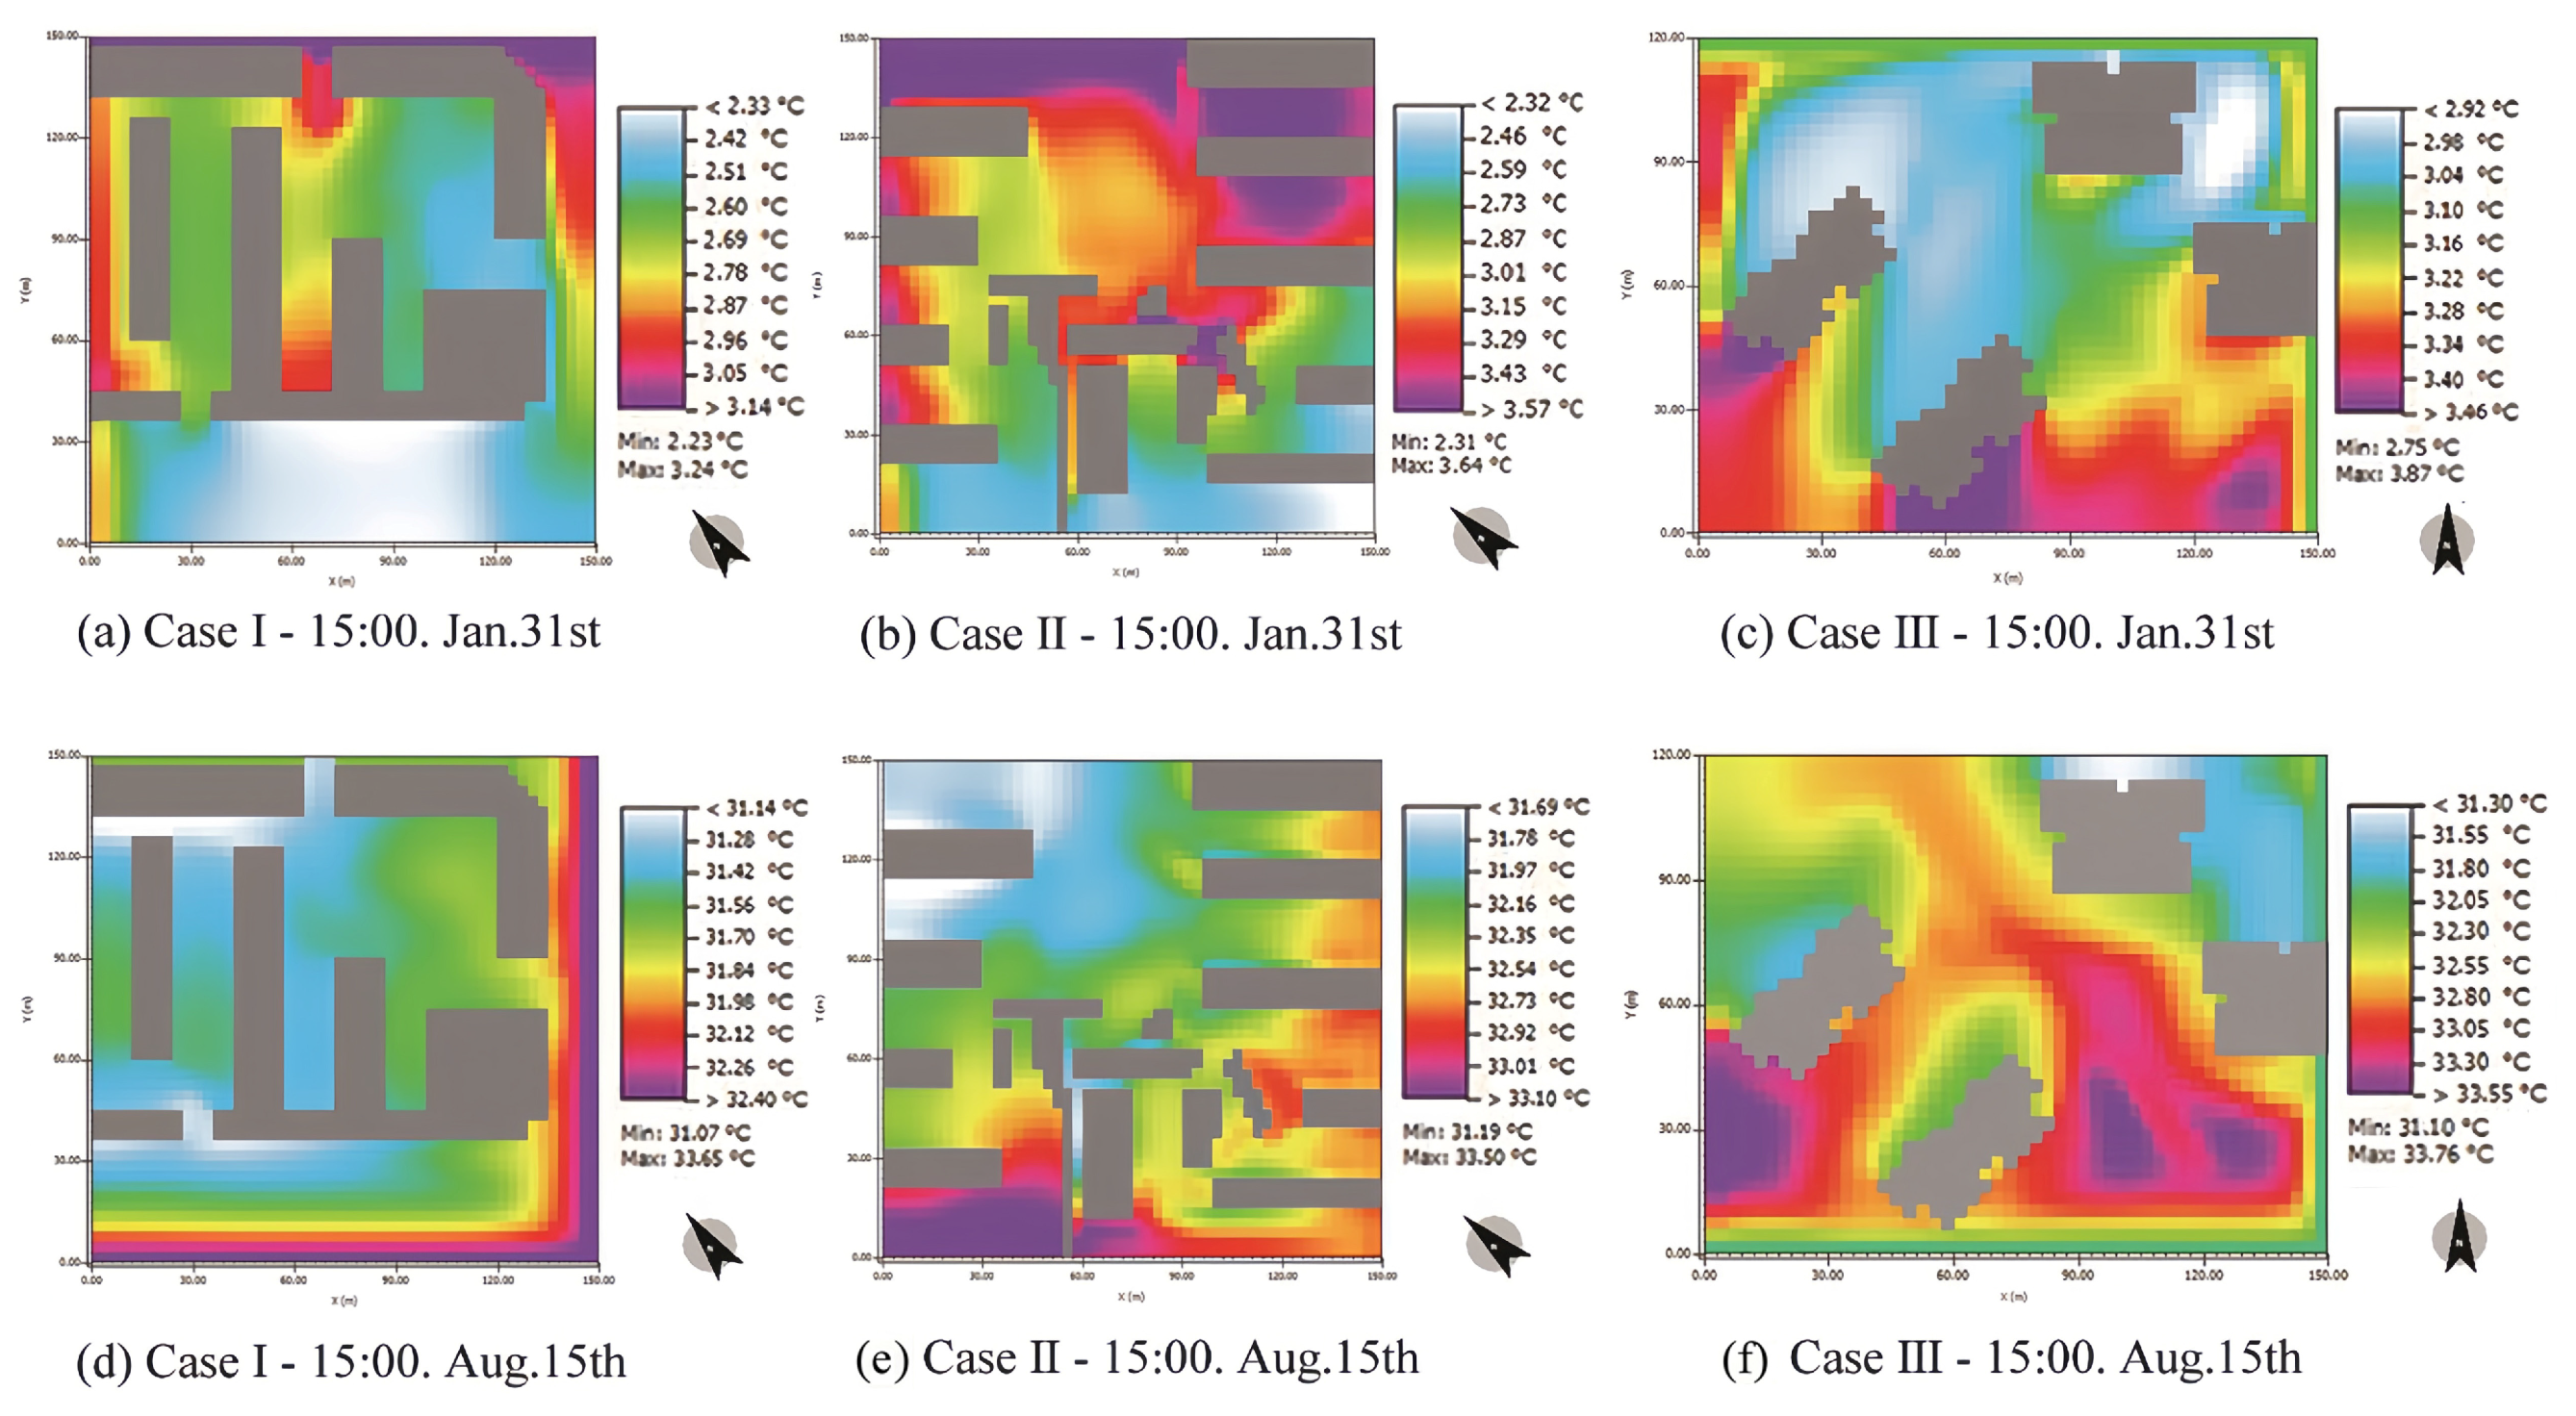
Figure 6 shows that the time-dependent temperature trends in a typical day in both winter and summer are similar; the hottest period occurred around noon with a one-peak curve. As residents have a strong desire to prevent over-exposure at times of peak solar radiation during the summer days, the process reverses with low temperatures causing the human body heat loss and driving them to soak up sunshine in winter. Since evaluating the all-day microclimate of outdoor spaces is time-consuming, time periods with a high usage rate are highly preferred for research. A previous survey taken in Tianjin for residents’ life patterns indicates that outdoor activity space has relatively high attendance levels at 15:00 and 16:00 during both hot and cold seasons [63]. Through the comprehensive consideration of the seasonal demands for the residents, 15:00 is selected as a representative of the discussion on the thermal environmental actuality in the outdoor activity spaces. The ENVI-met micro-meteorological model software is utilized to visualize the temporal-spatial distribution schematics in relation to air temperature, relative humidity, mean radiant temperature, wind speed, and wind direction from a height of 1.5 m of the chosen moment in the research areas.
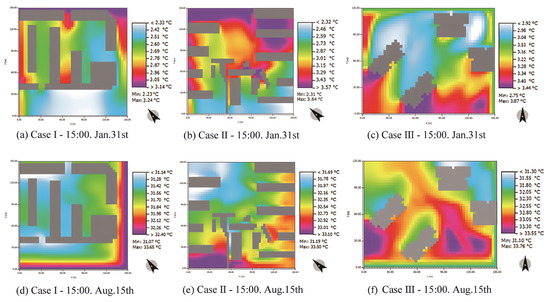
Figure 6.
Spatial distribution of the air temperature.
Air temperature is an important indicator of comfort in outdoor spaces, and the simulated field at 15:00 in summer shows a large variation in air temperature over space (see Figure 6), with the highest areas occurring in the open area and above the main road of the residential areas. Trees and lawns absorb some of the heat through their own transpiration, which reduces the near-surface temperature compared to the unshaded hard paving area. The cooling effect of the green space is only in the range of 0.5 °C due to the limited lawn, trees, and the small leaf area index, which makes the cooling effect of the green space less obvious. The low-temperature areas are mainly located in the areas shaded by residential buildings, and the sunny side of the building has a difference in temperature from the darker side due to the lack of effective shading of solar radiation. It can be seen that the shaded areas can always reduce the ambient air temperature to some extent, whether it is buildings or plants.
The simulated temperature field at 15:00 in winter shows that the air temperature is generally low (Figure 6), and the lower solar elevation angle makes the shadows of the residential buildings elongated to enlarge the low temperature area, especially in Case I, which is enclosed by the L-shaped apartments. The low temperatures at each measurement point resulted in poor thermal comfort for residents in the space, reducing their willingness to go outside. At this point, the reception of solar radiation is more in line with the psychological expectations of residents than focusing on shading in summer.
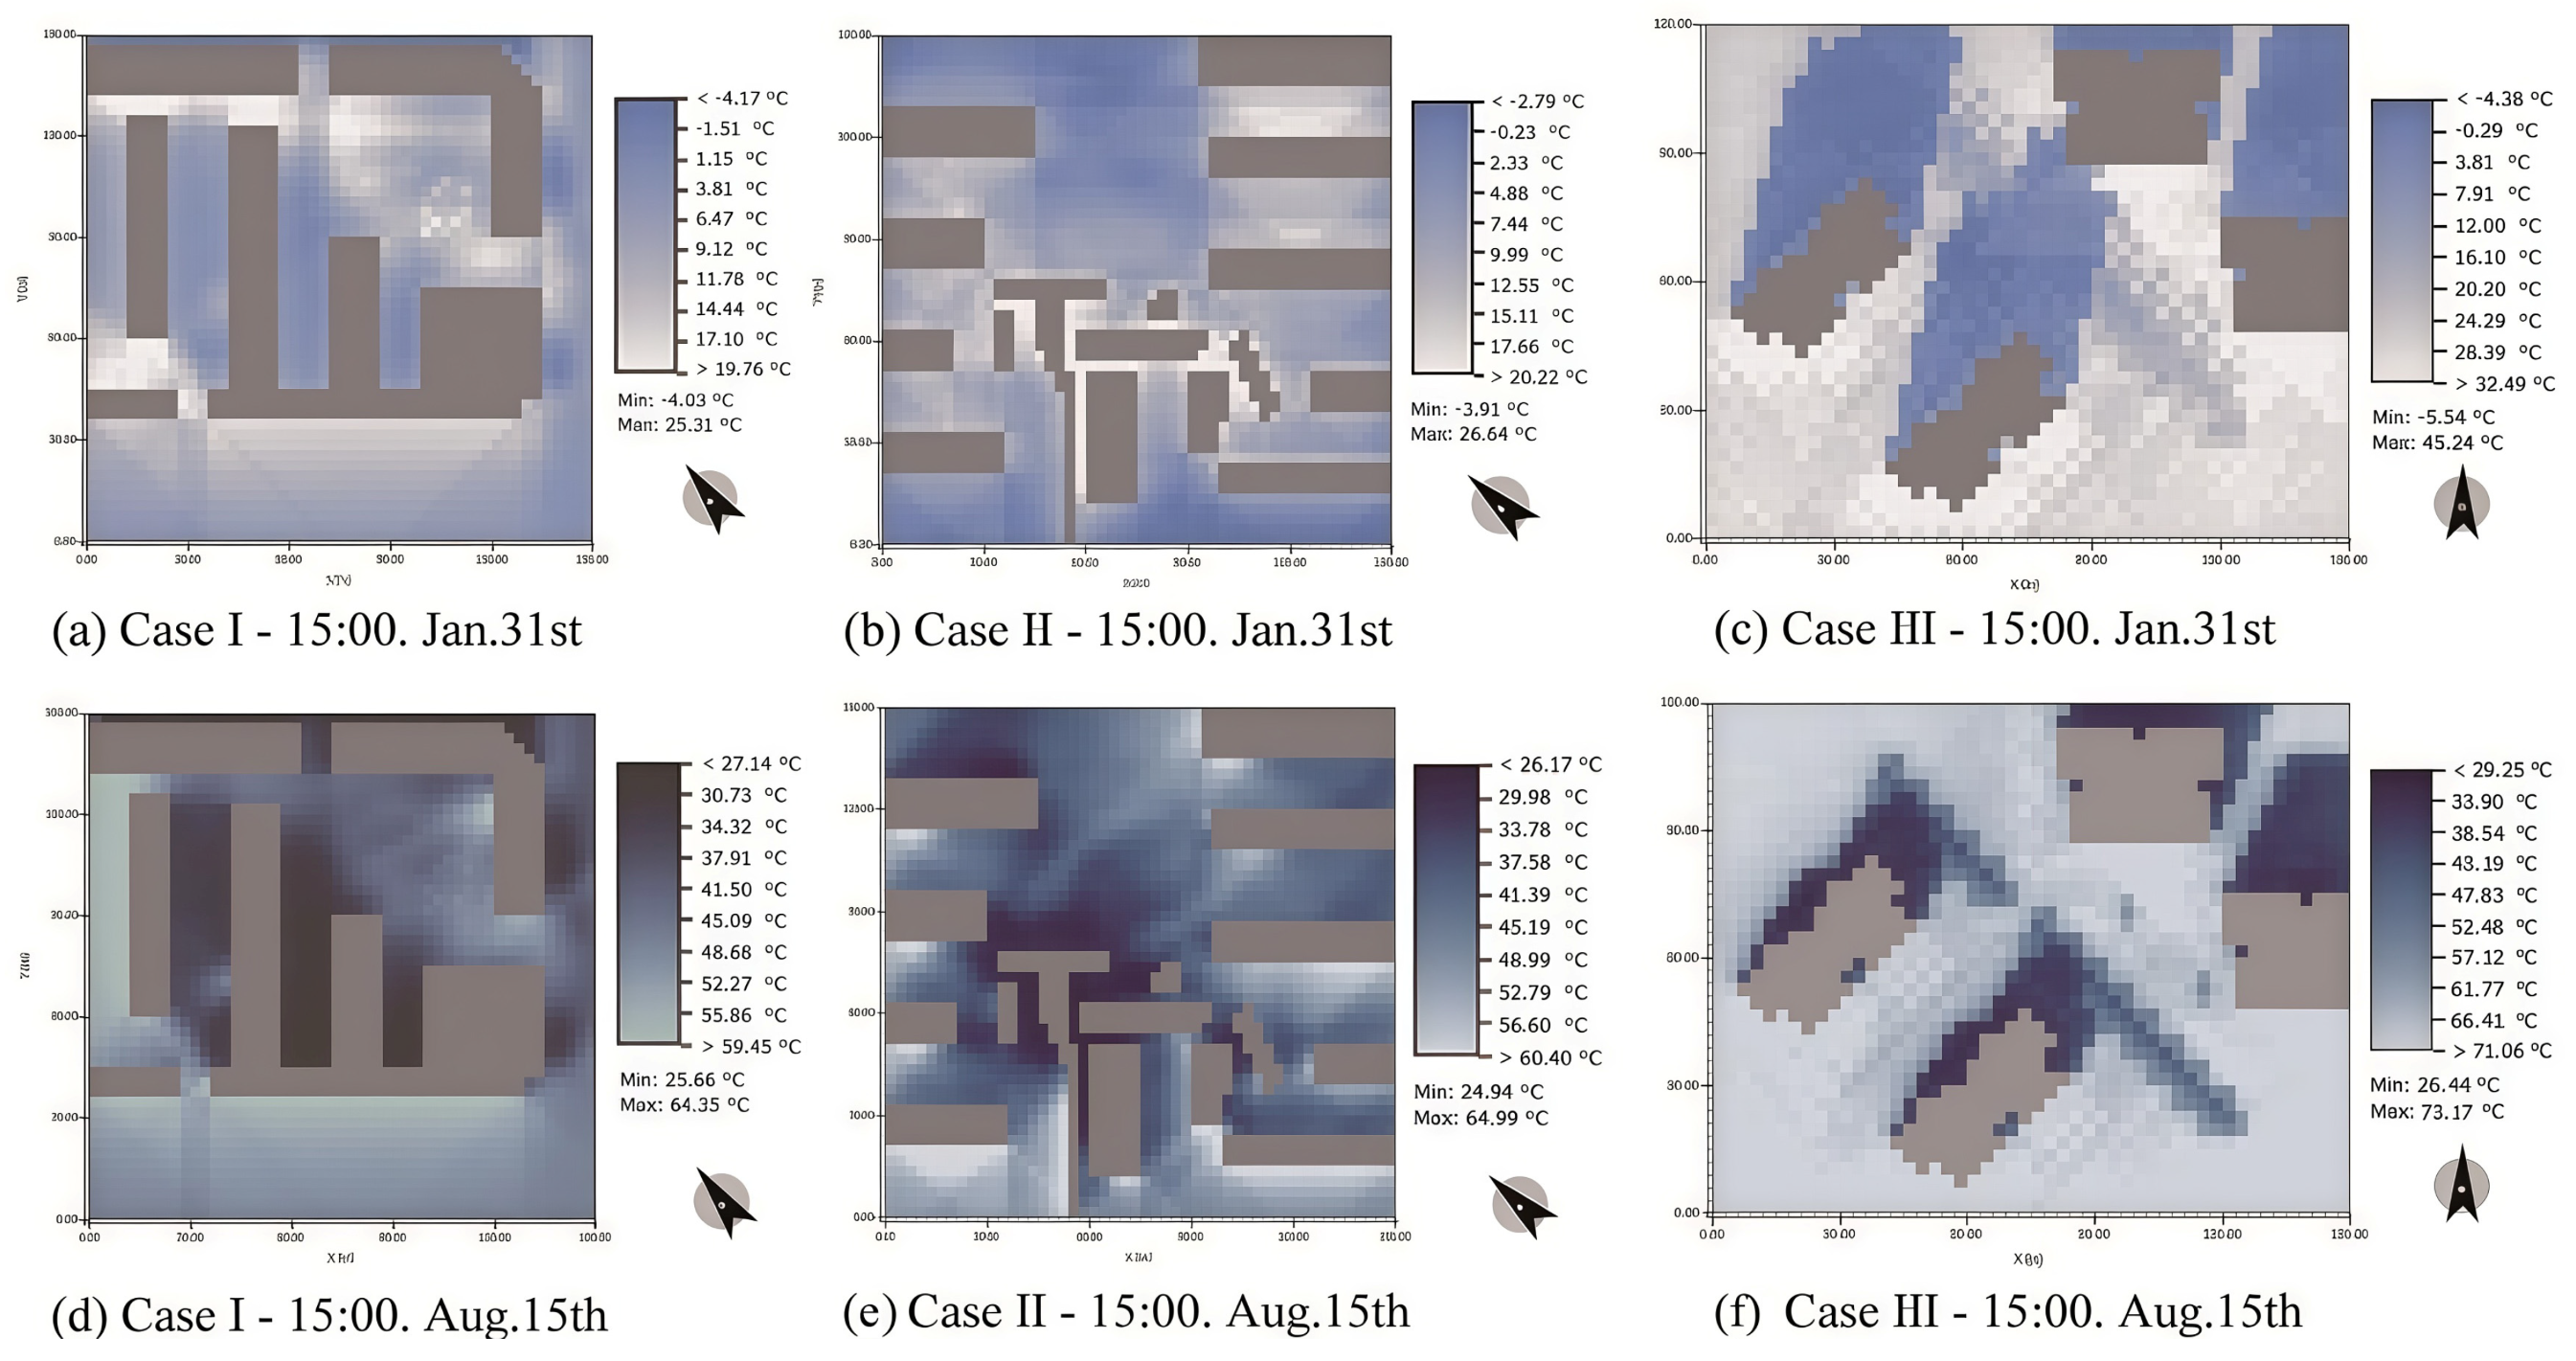
The lowest mean radiant temperatures at 15:00 in summer of the simulation range, shown in Figure 7, occur on the dark side of residential buildings, mainly because the shadow from the surrounding buildings in this area avoids a large amount of direct solar radiation. The mean radiant temperature in the area with trees is lower than that with the bare hard surface or open lawn. Since the mean radiant temperature indirectly indicates the radiant heat felt by the human body to the surrounding environment, the baking sensation brought about by the heat accumulation of the intense solar radiation is the cause of thermal discomfort when residents are exposed to the sun; therefore, it is necessary to avoid direct sunlight in the summer.
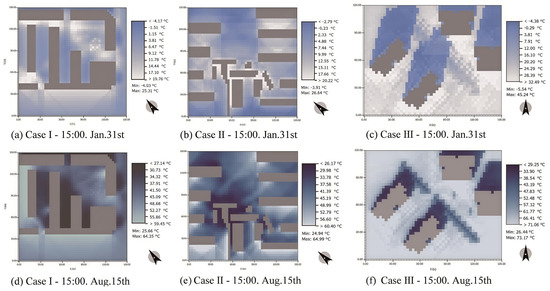
Figure 7.
Spatial distribution of the mean radiant temperature.
A large dark blue area appears in the picture at 15:00 in winter, indicating that the mean radiant temperature is generally low at this time (see Figure 7). The lowest values also occur around the buildings and plants. In winter, the thermal sensation of the residents varies considerably in different environments with and without sunlight, so on a cold winter day, that extra heat from sun would be helpful.
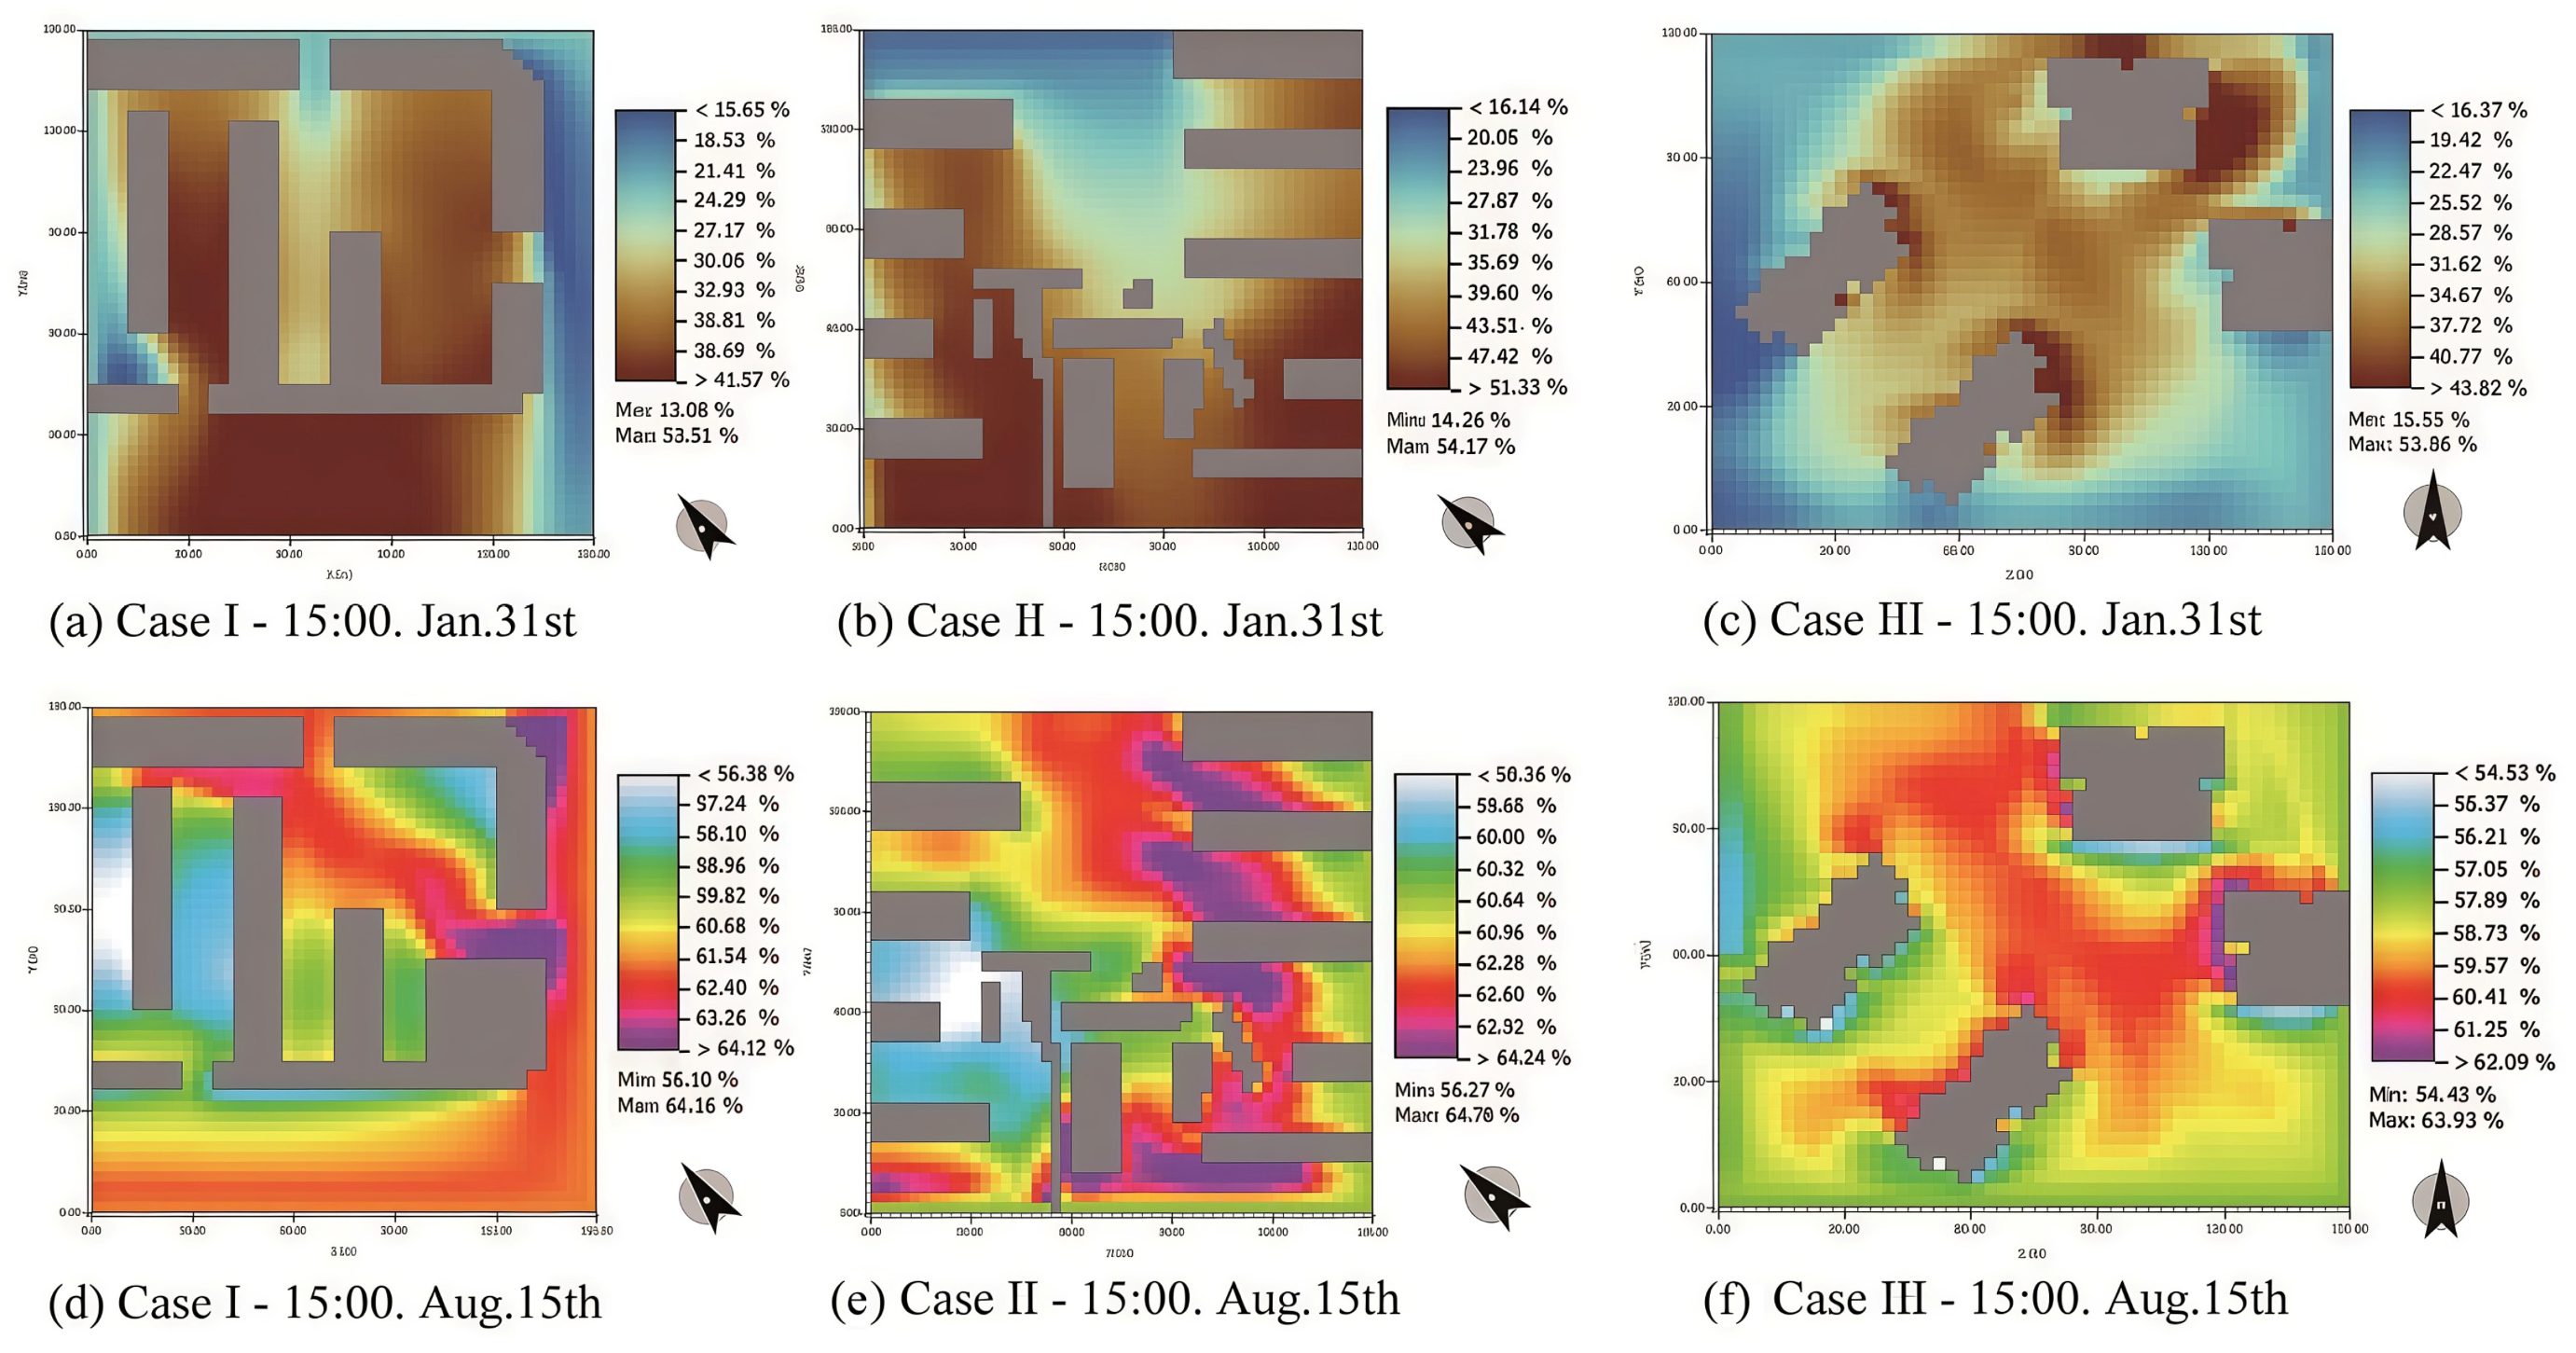
From the simulated relative humidity at 15:00 in summer (see Figure 8), the overall presentation is high humidity. Combined with the temperature distribution plot, there is a mirror-image relation between the humidity and temperature; the higher the temperature, the lower the humidity. The relative humidity distribution shows the obvious regional characteristic. The higher relative humidity values are concentrated in the locations covered with trees or lawns, and the humidity increase is around 1.2% compared with the surrounding areas. Relative humidity is lower above the hard-paved road and at the air ducts, but it is still at a higher level. High moisture will reduce the evaporation rate of skin water and exacerbate the negative effect of the high temperature on thermal comfort.
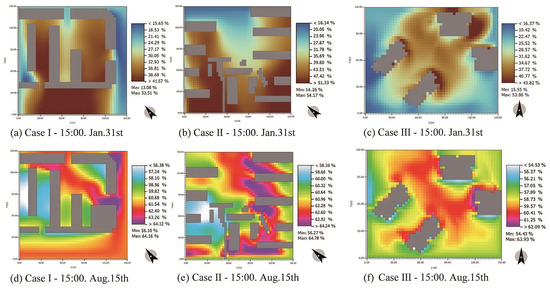
Figure 8.
Spatial distribution of the relative humidity.
The simulated relative humidity at 15:00 in winter indicated drier conditions (see Figure 8). Relative humidity was generally higher in summer than that in winter in all study areas, confirming the positive correlation between temperature and humidity.
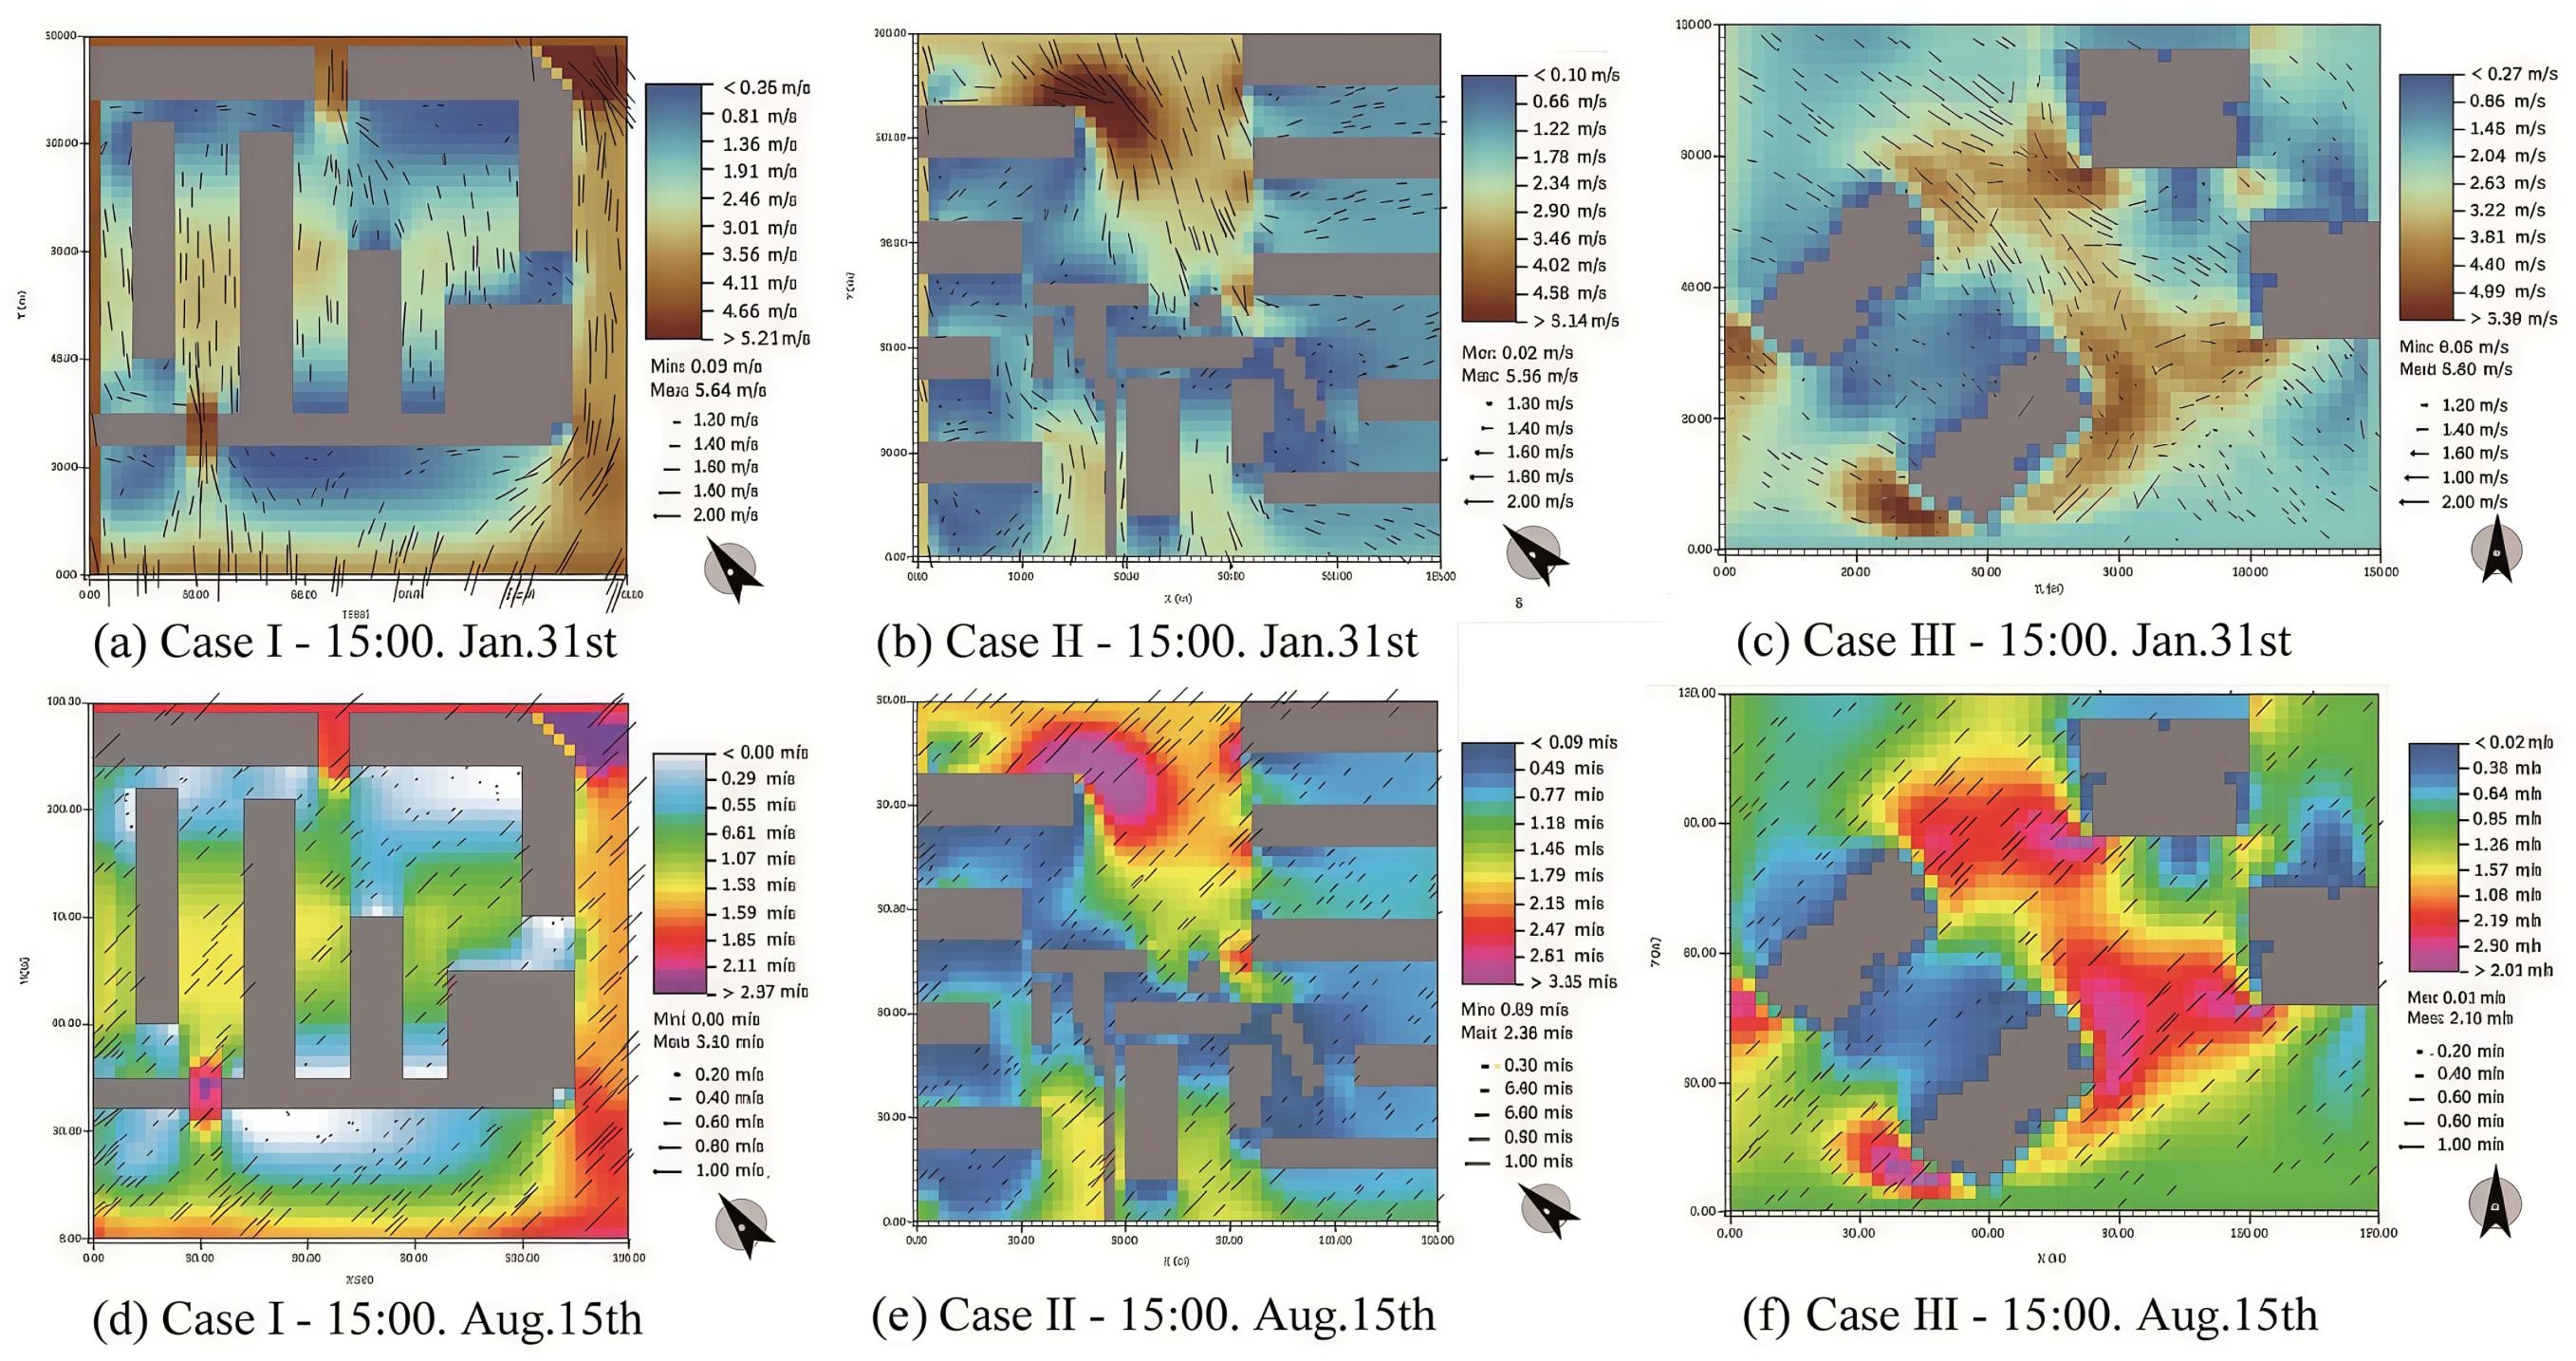
Figure 9 shows the distribution of wind speed at 15:00 in summer and winter in the simulation range. From the wind direction arrow, it can be seen that the dominant wind in summer is north-westerly. The main roads and open green areas running through the residential area play the role of the wind channel, and due to the canyon effect, the wind speed in these areas is significantly larger compared with the areas between the two rows of the residential buildings and street trees. Due to the lack of a blocking effect from trees and the surrounding residential buildings, wind speeds of measurement sites in Case II and Case III increase, and these speeds can offset some of the thermal discomfort response brought about by the heat and humidity.
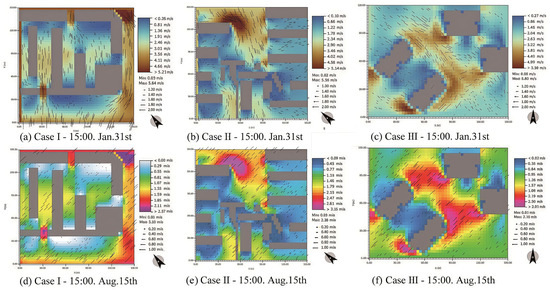
Figure 9.
Spatial distribution of the wind speed and wind direction.
The dominant wind direction on the typical day in winter was south-east, with a large difference in wind speed. The wind speed in the middle area of the building is smaller due to the shielding. The wind speed at each measurement site is at a medium level due to the blocking effect of the residential buildings. Despite this, in cold weather conditions, even low wind speeds will increase thermal discomfort, and solar heat gains in winter are more critical than solar shading in summer for Tianjin. As such, it is necessary to take measures to reduce the wind speed of the measurement site in winter.
4.2.5. Existing Problems and Optimization Points of the Thermal Environment in the Study Sites
The microclimate of urban open spaces mainly depends on the variable weather conditions in Tianjin. Compared with the building interior, the transient changes of the external natural climate factors, as well as the irregularity and random distribution of shadows coming from buildings, structures, plants, and other objects, have a synergistic effect on the thermal comfort of the residents. Outdoor weather conditions and design elements are closely related to outdoor thermal comfort. Even though a single environmental parameter is insufficient to explain the overall state of outdoor thermal comfort, the sensitivity of human thermal sensation to each meteorological parameter has the order of their relative importance. With reference to previous studies about outdoor thermal comfort conditions in Tianjin, the size of the contribution to thermal sensation from several meteorological parameters undergo seasonal changes [64]. Under various air temperature ranges, the biggest influence coefficient is always air temperature, while relative humidity shows the minimum effect. Ta = 20 °C is a major turning point for changes to the relative weights of solar radiation and wind speed. When the temperature is below 20 °C, the thermal effect of wind and solar radiation are equivalent; conversely, the impact of solar radiation extends far beyond the impact of wind. For Tianjin, residents’ preferences in wind speed are positively associated with air temperature, but their preferences for the other two parameters have an anti-correlation with air temperature [10]. Combined with the previous analysis in 4.2.4, on hot days, the existing activity sites in Tianjin share problems of high temperature and water vapor pressure, intense sun radiation, and low wind speed. This is opposite for the cold days. This situation is at variance with residents’ preferences for the thermal environment in Tianjin. Furthermore, the average energy consumption of the same units in winter is more than six times as much as that in summer [65], which illustrates that solar access in winter is much more important than sun protection in summer. To sum up, the focus to resolve this problem of physical environment optimization for Tianjin is on shading in summer and on solar access and wind protection in winter.
When Tianjin residents can no longer maintain thermal comfort based solely on responses of their own thermoregulatory system to thermal environments and adaptive adjustments to the clothing thermal resistance, design factors need to intervene in improving the current unpromising thermal environment. The mitigation of outdoor thermal discomfort can be achieved by controlling sunshine duration, amount of solar radiation, and degree of wind protection through planning of building density, greening configuration, reflective surface, and so on [12]. Since the selected study sites are existing residential areas where buildings and streets absolutely cannot be moved, in these cases of restricted plots and low variability, outdoor transitional spaces as sitting areas with sunshades and windbreaks offer the possibility of local thermal regulation similar to the role of buildings, streets, and plants.
4.3. Performance Simulation of Outdoor Transitional Space with Different Parameters
Outdoor transitional spaces with man-made structures and open-plan configuration can partially regulate the outdoor environmental conditions compared to the completely open outdoor spaces. The thermal regulation of the local microclimate in outdoor transitional spaces deserves further investigation. The corresponding thermal performance of a variety of morphological outdoor transitional spaces is analyzed in terms of a classification of the design parameters including the orientation, aspect ratio (Height-to-width ratio), plan aspect ratio (Length-to-width ratio), and enclosure degree. Sunshine hours are the optimal proxy and determining factor for solar radiation intensity; the degree of solar access and the alteration of wind conditions is responsible for significant spatial variations of thermal comfort within urban areas [36,66,67]. In the software Ecotect, each spatial form is applied to the overall layout of the outdoor activity spaces in residential areas to simulate the distribution of average daily sunshine hours, solar radiation, and wind environment from 8:00–18:00 in both summer and winter. The visible results reflect the effect of the transitional spaces with the different parameter units on the outdoor local thermal conditions.
4.3.1. Orientation
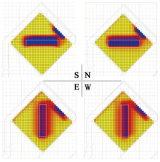
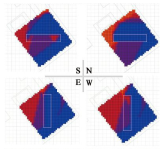
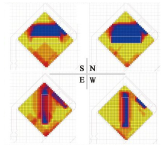
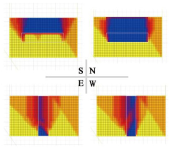
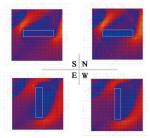
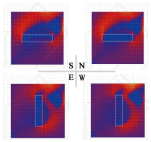
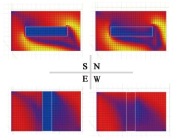
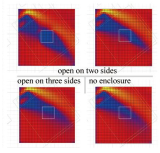
A box space was used as the base unit to be placed in the measurement sites, ensuring that the center of the space was always located at the selected fixed point (see Figure 10). With regard to size setting, the longer sides of spatial units should be adapted to the size of the three survey regions. To highlight the effect of orientation on thermal performance of the outdoor transitional space, the longer sides were adaptively set to the maximal length (9 m). Since such spaces do not offer human habitation other than for a transient rest, their size design should conform to the sort of small-scale nodical space, such as bus stations. The final size setting is determined as 9 m × 2 m × 2.4 m. The long axis of the unit was placed in the direction of a single study and only the side enclosure is extracted from this direction; the results are presented in Table 8. The distribution related to average daily sunshine hours, solar radiation, and wind environment for outdoor transitional spaces with different orientations from 8:00–18:00 on the representative day of two seasons was output in turn on the basis of grid analysis.
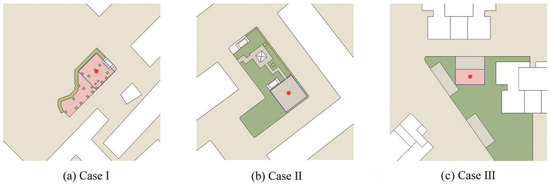
Figure 10.
The selected center points for reference to place the transitional spaces.

Table 8.
Thermal effects of orientation variations for transitional spaces.
Solar radiation and air movement are the primary determinants affecting the thermal performance of outdoor transitional spaces, and orientation is one of the most important parameters determining the solar access and wind condition in transitional spaces. In summer, the west-oriented transitional spaces have the worst thermal conditions during the day, with relatively higher sunshine hours and solar radiation leading to prolonged heating of the air and its surfaces, which makes it difficult to achieve good thermal acceptability in this direction most of the time. This extra packet of heat accumulation will have increased the likelihood of heatwaves during the hot days. The north-oriented transitional spaces are almost always in shadow during the daytime in both seasons and receive only diffuse radiation due to the shading effect of themselves and the nearby apartments, which is contrary to the desire for sunlight in winter by Tianjin residents. The adverse directions should be avoided during the planning phase. From a time perspective, the south-oriented transitional space generates a better thermal response in both winter and summer. Not only does it provide shelter from solar radiation in the summer except at the edges, most of them also have more than 5 h of sunshine and avoid the adverse effects of the dominant north winds in winter in Tianjin.
4.3.2. Aspect Ratio
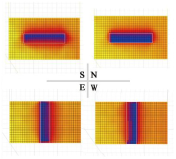
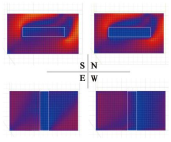
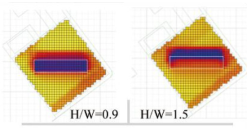
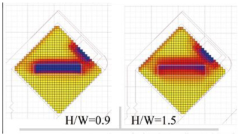
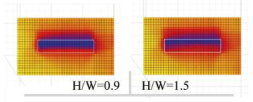
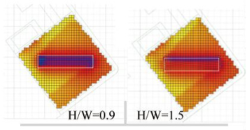
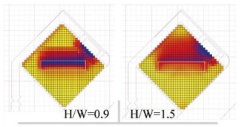
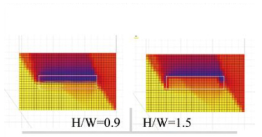
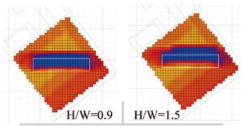
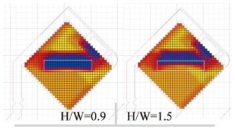
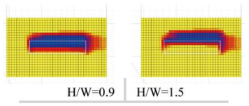
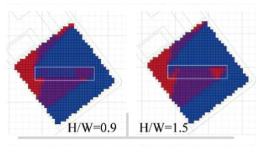
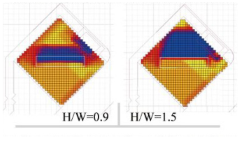
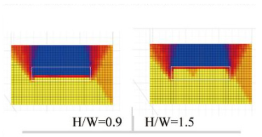
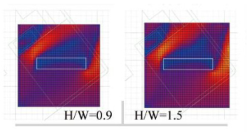
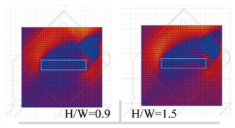
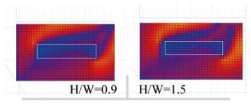
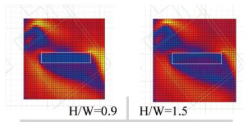
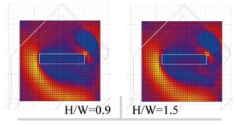
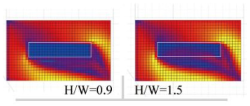
One of the key parameters that determines the geometry of an outdoor transitional space is the aspect ratio, i.e., the ratio between the height (H) and width (W) of that space. In order to investigate its effect on the thermal performance of the outdoor transitional space, the E–W elongated base spatial unit (9 m × 2 m × 2.4 m, H/W = 1.2) in Section 4.3.1, open to the southern façade, is placed in the center of the sites, its width is kept constant, and the thermal environment conditions with H/W = 0.9 and 1.5 are investigated by changing the height of this space. The results are presented in Table 9.

Table 9.
Thermal effects of aspect ratio variations for transitional spaces.
The geometric configuration of outdoor transitional spaces is governed by key dimensional ratios—notably height-to-width (H/W) and length-to-width (L/W) proportions. These ratios directly determine the sky view factor at any given point, thereby adjusting the solar access and radiation exposure [68,69]. The integration analysis of sunlight condition with the shading pattern therefore enables us to optimize spatial geometries that effectively reduce the thermal discomfort periods. The aspect ratio of transitional spaces is positively correlated with solar radiation, sunshine duration, and wind speed. Low-height shapes have the potential to reduce radiant heat and relieve residents of the burning sensation caused by the blazing sun during the summer months. The reasons for this are that low-height shapes give better control of the sky view factor (SVF) and the increased degree of occlusion is realized. The amount of direct sunlight available in the near-surface layer decreases with the limitation of solar access. In addition, the lower solar elevation in winter makes up for the reduction in solar heat gain to some extent under conditions of the transitional space with a higher aspect ratio. Therefore, the height of the outdoor transitional space should not be too high, otherwise the residents will not be able to withstand the thermal stress caused by the intense solar radiation in summer and the cooling effect caused by the higher wind speeds in winter due to the loss of protection from the roof and enclosing structures. With increasing aspect ratio, the inside of outdoor transitional spaces shows more hours of sunlight and the consequent slightly warming trend in both winter and summer. For spaces with H/W = 1.5, the thermal environment of the spaces appears to be related to the phenomenon of overexposure to sunlight during most of the day. Despite the high structural enclosure, the side walls are only effective in shading the area on either end of the spaces. A moderate aspect ratio (i.e., H/W = 1.2) clearly highlights the positive impact of south-oriented space on outdoor thermal comfort.
4.3.3. Length-to-Width Ratio
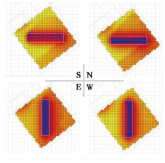
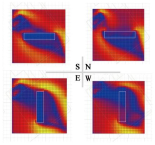
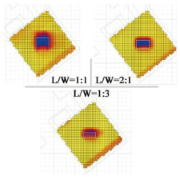
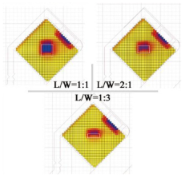
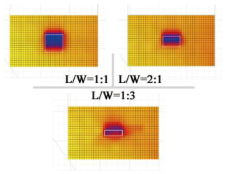
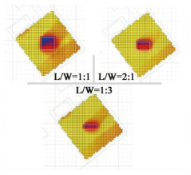
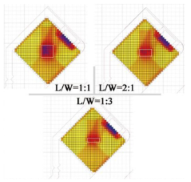
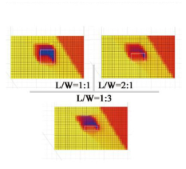
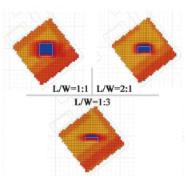
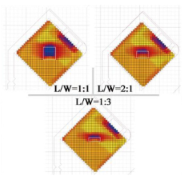
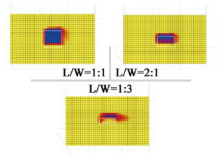
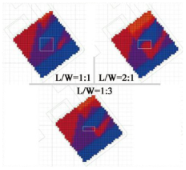
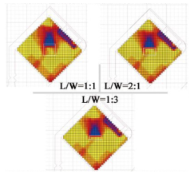
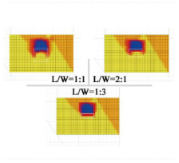
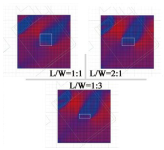
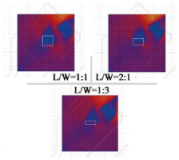
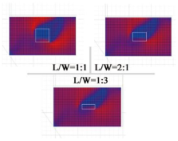
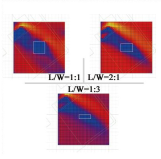
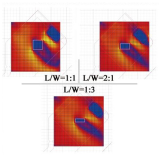
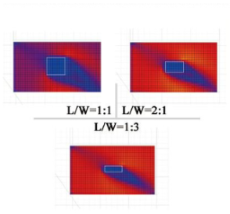
In order to investigate the effect of plan aspect ratio on the thermal performance of the outdoor transitional space, a box space of 3 m × 3 m × 2.4 m (1:1) without the south enclosure was taken as the base unit. Comparable cases with aspect ratios of 2:1 and 3:1 are designed for analysis, and the results obtained are listed in Table 10.

Table 10.
Thermal effects of plan aspect ratio variations for transitional spaces.
Outdoor transitional spaces with larger plan aspect ratios are shallower and have poor shading conditions, allowing sunlight to easily enter the interior most of the time. The sun heats the air continually in these spaces, reducing the available parts of the transitional space, especially during hot periods. On the contrary, the deeper the outdoor transitional space, the less likely the floor and walls are to receive sunlight, meaning that its shading effect is more significant than a shallow space. For the summer months, deeper spaces have a relatively homogeneous thermal environment and create comfortable exterior microclimate conditions. However, too deep a shape will prevent air circulation inside, causing water vapor to stagnate and exacerbating the difficulty of heat dissipation in summer. For the Tianjin area, the thermal performance of the transitional space with a 2:1 plan aspect ratio is more balanced in winter and summer.
4.3.4. Enclosing Degree
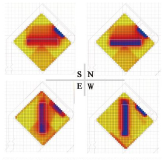
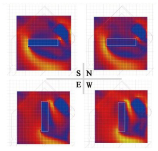
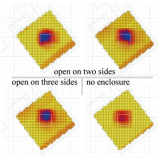
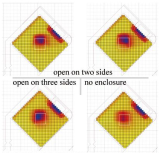
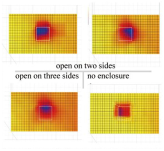
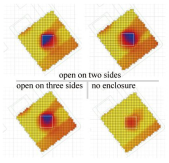
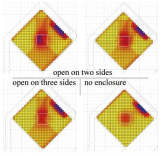
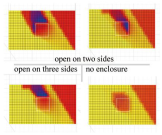
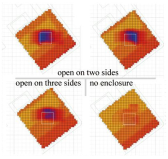
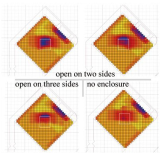
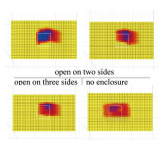
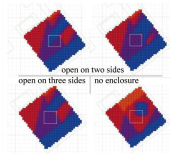
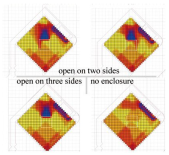
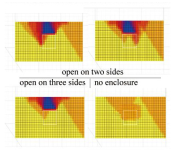
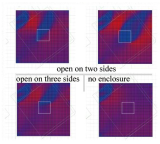
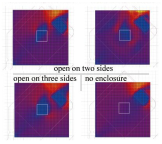
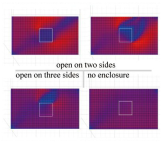
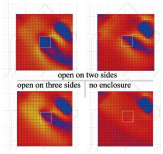
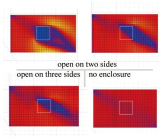
In order to investigate the influence of the enclosing degree on the thermal performance of the outdoor transitional space, the spatial unit (3 m × 3 m × 2.4 m) with a square shaped plan in Section 4.3.3 was taken as the base unit, and the thermal environment conditions were analyzed by sequentially extracting single and multiple sides; the results are presented in Table 11. The results of the single-sided opening of the transitional space can be referred to L/W = 1 in Table 10.

Table 11.
Thermal effects of enclosing degree variations for transitional spaces.
The enclosure degree is negatively correlated with solar radiation, sunshine duration, and wind speed, and the higher openness of the outdoor transitional space can promote the flow of air to achieve excellent heat dissipation. In the case of higher enclosure degree, transitional spaces can form a wider range of sheltered areas. Therefore, based on setting the enclosure in the dominant wind direction in the winter, open the side boundaries of the transitional space as much as possible to ensure that the level of shading and ventilation in the summer and the decline in the wind speed during winter. For outdoor transitional spaces, the center of the space has thermal advantages in summer over the edges and fully exposed open space surrounding them, but lightweight canopies and plants can help to improve the thermal environment at the less shaded edges of the transitional space.
5. Discussion
The suitability of a transitional space for a given region is achieved through designs from the geometrical proportion control. Related studies show that all these design parameters responsible for microclimate change and fluctuation in open areas and surrounding spaces are not negligible; they directly influence the accessibility of solar radiation, shading resistance, wind conditions, and thus thermal comfort for pedestrians. The effect of various geometrical parameters for transitional spaces on urban microclimate is disparate, with its embodied thermal performance being strongly dependent on geographical location and the corresponding climate. This section compares and explores the adaptation design strategies for improving the thermal comfort of the outdoor transitional spaces under different climatic zones, combining with the foregoing background study and research results.
Regardless of how different climate zones may be, there is a commonality of the preferential choice about orientation for transitional spaces, that is, south orientation has a comparative advantage in mitigating summer heat stress for most cases. Our findings in Tianjin are in agreement with these parallel studies. The northern and southern hemispheres take turns in pointing toward or away from the sun depending on the time of year, varying the amount of light they receive and causing the seasons. So, in the southern hemisphere, orientation advantage will be changed from south-facing orientation to north-facing orientation. The preferential choice about orientation can be united to be expressed as equatorial-facing orientation. Since receiving the direct sunlight of the east-west orientation lasts for about 12 h a day, it is more than four times the total duration of solar radiation that the north-south orientation provides; the east–west orientation suffers from a long-lasting period of sun exposure during the summer [52]. In view of the fact that transitional spaces should not be directly exposed to the sun’s radiation, deviation of the transitional spaces from the west orientation particularly may tend to be a desirable scheme at the design stage for areas with hot summers [41]. Despite this, outdoor transitional spaces at the edge of the building are recommended for unfavorable orientations, especially in hot climates; its shading effect reduces cooling demand and thus decreases air conditioning energy consumption [70]. In Tianjin’s temperate climate, east-facing orientations demonstrate secondary optimal thermal performance after south-facing configurations. This phenomenon aligns with findings from other studies in temperate regions, where east-oriented outdoor transitional spaces exhibit the second-highest annual thermal comfort frequency [25]. Furthermore, orientation is frequently planned to take major advantage of daily and seasonal variations of sunlight, the solar altitude angle, and the duration of direct sun. Prevailing winds are distinctly seasonal, so it is well worth considering a trade-off between hot and cold seasons in temperate regions. If we are to take winter solar gains into consideration at the same time, the intermediate orientations such as southeast-oriented spaces can, to some extent, offer exposure to the sun, although this is not as ideal as the south orientation in summer. This, after all, is another kind of compromise [39]. Variable transparency roofs can also be used to improve the problem of solar access in winter [25].
It was found that the high aspect ratio (approximately greater than 1) is inappropriate for hot humid and hot arid regions in order to avoid excessive sunshine and the consequent deteriorating thermal comfort [47,50]. The paradox is that lower aspect ratio intercepts a great deal of the inflowing air; weakening of ventilation performance would similarly cause the resistance of heat dissipation [33,44,48,71]. To make up for this, adjusting the enclosing degree of transitional spaces is recommended. Although the sun-angle altitude decreases in winter, for temperate regions such as Tianjin with cold winters, the aspect ratio of the transitional space being less than 1 will seriously affect the solar heat gain in winter. In addition, the deeper transitional spaces (lower ratio of length to width) feature a relatively uniform thermal environment in each orientation due to its shading effect [41], so they may be more suitable for hot climates. In temperate climates with hot summers and cold winters, heat demand in winter is more critical than solar shading in summer, meaning that shallower transitional spaces are more appropriate for balancing year-round thermal comfort.
In hot summer days, lower openness for overheating avoidance seems to be contradictory to higher openness for air circulation and moisture dissipation. In response to this problem, some scholars have put forward the opinion that the opposite-two-sided position and 0.75–0.5 openness degree of the side interface is optimal (set the completely wide open to 1 of the transitional spaces, which both sides accept the most) [44]. This is a positive point during the hot summer days but will be disadvantageous in cold winters. The priority request coming from the temperate zones with hot summers and cold winters is cold-proof. The enclosure degree should not be too low under these circumstances [56], especially on the windward side.
Of course, the overall thermal condition is not manipulated by an individual parameter; it is a powerful combination of orientation and geometric scale that gives outdoor transitional spaces a great deal of control over their thermal environment and enables either of the two factors to better display the respective superiority. Outdoor transitional spaces, with their induced thermal performance, depend a good deal on the multi-effects of various design parameters. This synergism, which determines the thermal condition level in open spaces, depends largely on the combinatorial efficiency of the geometric shape and orientation of the semi-outdoor transitional space. As the long-axis alignment of outdoor transitional spaces trends closer to east-west, time spent in the direct sunlight is extended, whereas spaces with a north-south elongation show substantially less accumulated solar radiation and shorter sunshine durations. For solar-sensitive hot humid or dry climates where east and west oriented configurations are thermally inappropriate, thermal performance improvements from aspect ratio reduction will be severely limited in these two orientations. Similarly, in cold winters of temperate regions, windward-orientations create thermal discomfort from the bitter wind that cannot be mitigated through the aspect ratio (height-to-width ratio) adjustments alone. Conversely, even in thermally optimal orientations, extreme aspect ratios (either excessively high or low) are inevitable to degrade thermal performance of outdoor transitional spaces. Setting too high an aspect ratio value can lead to the loss of sun protection offered by the roof for such spaces and the subsequent excessive sunshine permeation. With this ratio decreasing, a reduction in wind inflow poses a threat to ventilation performance and heat dissipation. Consequently, in hot climates, even when outdoor transitional spaces are ideally oriented in the south direction, their aspect ratio should not exceed 1. The resultant diminution in ventilation efficacy, attributable to a reduced aspect ratio, can be compensated for by adjusting the enclosing degree.
Due to the different sky visibility, the edge areas of outdoor transitional spaces get more exposure to sun and less extra protection from spatial facade or roof, so these parts exhibit greater thermal fluctuations. Plan aspect ratio (Length-to-width ratio) determines the depth of the outdoor transitional spaces; this means that deeper spaces can offer more internal zones with thermal stability advantages. Some adjustments should be put on enclosing degree of outdoor transitional spaces to strike a state of equilibrium between openness and enclosure and thus effectively manage sunlight exposure and airflow distribution. Lateral structures are responsible for airflow inlet, outlet, and direction, as well as degree and angle of solar radiative permeability. In hot climates, adjusting lateral openness based on wind field features can enhance the combined cooling effect of shading and ventilation. Simulation studies indicate that configurations with side structures or buildings placed on opposite sides often yield a more favorable natural ventilation effect [44]. This may be attributed to the certain shading quality while enabling the formation of cross-ventilation to improve convective cooling. For temperate regions with distinct seasonal variations, the spatial arrangement of outdoor transitional spaces should combine summer cooling with winter wind protection, which can be realized by orienting the open side toward summer prevailing winds to encourage natural ventilation, while placing the enclosed side on winter dominant wind direction. In addition to the above design parameters, variable transparency roofs, detachable lightweight shading devices, operable side walls, and reasonable configuration of vegetation or water elements can further meet seasonal dynamic demands for hot-summer and cold-winter temperate regions.
The effective design of outdoor transitional spaces requires a synthesis and coordination of multiple spatial parameters to achieve seasonal balance in shading, daylighting, and ventilation targeted at specific climate zones, thereby optimizing thermal comfort and energy efficiency all year round.
This article mainly probes into the interaction effects of design parameter variations around space itself on its thermal performance, but there are also other factors, such as human activity states, that have an impact on thermal comfort experienced within the outdoor transitional space. For instance, variations in the static posture of the human body can also influence thermal comfort, as different positions alter the degree of exposure to meteorological factors. In outdoor transitional environments, a seated person tends to experience higher physiological equivalent temperature (PET) values compared to someone standing [72]. This is because a seated posture exposes a significantly larger body surface area to direct solar radiation than a standing one, particularly around midday, while also enhancing heat absorption from warmed surfaces due to a greater view factor toward the ground. In terms of dynamic movement state, people will suffer the remarkable disturbance that comes from wind velocity in the process of walking. Such a process primarily makes a difference to increasing convective cooling enhancement and skin temperature reduction. Failing to account for turbulent wind effects could lead to an approximate 20% overestimation of body heat storage [26]. We are planning to further incorporate the evapotranspiration from vegetation, material properties of spaces and pavements, and anthropogenic heat flux into simulation framework in a future study.
In the actual construction of outdoor transitional spaces, cost control should be achieved through systematic material selection, construction technology optimization, and life cycle cost management. A classification type material use should be adopted, with structural components utilizing cost-effective materials, like using anticorrosive wood instead of hardwood, or steel-aluminum composite columns instead of pure stainless steel, while decorative elements are selectively allocated based on visual priority, and higher-cost materials should only be employed in visually focal areas. Prefabricated and modular construction methods should be applied to enhance component reusability through standardized design, thereby minimizing inefficiencies and material waste from on-site fabrication. It is at the phase of module design that the proportion relationship of the module unit needs to be considered in some detail based on suitable geometric parameters. Additionally, a lifecycle cost evaluation system must be established to balance initial construction expenses with long-term maintenance costs, ensuring the selection of technically and economically optimal solutions. This multi-layered cost management approach enables efficient allocation of construction budgets while maintaining functional and aesthetic requirements. When the outdoor transitional space is applied to an actual residential area renovation project, the fusion of outdoor transitional space and the surrounding environment is important, such as the consistency with paving material use and the visual connectivity between space roof and building border; the boundaries between indoors and outdoors are blurred in this scenario. Outdoor transitional spaces are transformed into key links of the overall streamline organization rather than isolated facilities. It will enhance both psychological and functional usability of outdoor transitional spaces. The follow-up study will be more dedicated to addressing the shortcomings of this study to find more possibilities of design.
6. Conclusions
With the intense sun radiation and high frequency of high-temperature weather during summer days in Tianjin, it means that shading-oriented design strategies of the outdoor spaces are of great importance to improve thermal comfort efficiency. The situation in the cold winter is in direct contradiction, as some exposure to the sun is what the residents want. Due to the comparative lack of solar radiation in winter, unfavorable wind environment, as another critical issue to be solved, occupies the leading position in the design direction for outdoor thermal comfort, so decreasing wind speed is the most effective way to extend the comfort range of outdoor environments in the residential areas during winter.
Outdoor transitional spaces contribute to reducing the intensity and duration of thermal discomfort compared to the surrounding open spaces, with the sheltered roofs providing significant relief from intense or extreme thermal stress in summer, and its lateral structures breaking the cold wind in winter. The effect of the given geometry and orientation for the transitional spaces on outdoor thermal comfort shows a discordance in terms of seasonality: it is a hard decision to make to determine the preferred orientation, especially in Tianjin, which faces a trade-off associated with thermal performance between hot and cold seasons. From this point of time, the south-oriented transitional space generates a more favourable thermal response in both winter and summer because of the solar trajectory and solar zenith angle. The aspect ratio is positively correlated with solar radiation, sunshine duration, and wind speed. Its value should not be too high, otherwise the thermal performance of the transitional spaces will be degraded greatly, and then the residents will have difficulty in withstanding the thermal stress caused by intense solar radiation in summer and the cooling effect brought by higher wind speed in winter. The too-deep transitional spaces are very unfavourable for solar access, air circulation, and moisture dissipation; this means that the suitable available area is reduced significantly. The transitional space with a 1.2 aspect ratio and 2:1 scale aspect ratio balances the demands of solar access, shading needs, and ventilation in the Tianjin area. On the basis of setting the lateral structure on the side of prevailing wind direction in winter, the other side boundaries of the transitional space should be opened as much as possible, which can not only ensure the ventilation level and shading area in summer, but also achieve a wind speed decline in winter.
In some cases, transitional spaces with specific geometric scale and orientation are inadequate to guarantee the applicability for each season; the different requirements of solar access, shadow control, and ventilation conditions in summer and winter cannot be satisfied simultaneously. Under the circumstances, lightweight canopies, plants, or water bodies can play a larger auxiliary function in microclimate adjustment for transitional spaces. For example, replacing the closed roof with a grill while planting vines that thrive in summer and drop its leaves in winter on it, or planting evergreen trees on the side of prevailing wind direction in winter to function as a wind shield with due consideration to sunlight prevention in summer. Furthermore, water bodies can have a cooling effect in hot months.
Several previous studies have been explored to investigate the design parameters of transitional spaces on the microclimate adjustment of open spaces in different urban environments and climatic regions. Transitional spaces are particularly useful for certain climates, which include tropical, subtropical, and temperate areas. The unique architectural form of the sheltered roof and part vertical structures has a combination of solar radiation reception, shading demand, and natural ventilation, so all these features are better equipped to deal with high temperature, intense sun radiation, or high humidity. The south-oriented transitional spaces have a characteristic of wide application scope. Therefore, as the preferential choice for most of climate zones, the deviation of the preferred orientation in the corresponding cities from the due south orientation is within 90° of a counterclockwise rotation. According to the duration of receiving the direct sunlight, tropical and subtropical areas should be particularly deviating from west orientation. Optimal configuration of choosing the intermediate orientations such as southeast-oriented transitional spaces are recommended on the basis of different requirements for solar heat gains in winter and summer. On account of giving consideration to balance the overheating avoidance, air circulation, and moisture dissipation, tropical and subtropical areas should use the low aspect ratio (approximately greater to 1), deeper form, and the 0.75–0.5 lateral openness degree of transitional spaces. For temperate regions such as Tianjin with hot summers and cold winters, winter protection is more critical than solar shading in summer, meaning that shallower form and lower openness of the transitional spaces are more appropriate for balancing year-round thermal comfort.
Author Contributions
Conceptualization, G.H.; methodology, G.H., Y.K. and X.L.; software, Y.K. and X.L.; validation, P.S.; formal analysis, Y.K.; investigation, G.H. and Y.K.; resources, G.H.; data curation, Y.K. and X.L.; writing—original draft, G.H. and Y.K.; writing—review & editing, G.H. and S.W.; visualization, G.H.; supervision, P.S. and S.W.; project administration, P.S. and S.W. All authors have read and agreed to the published version of the manuscript.
Funding
This research received no external funding.
Data Availability Statement
No data was used for the research described in the article.
Conflicts of Interest
The authors declare no conflict of interest.
Nomenclature
| OTC | Outdoor thermal comfort |
| SVF | Sky view factor |
| Ta | Air temperature (°C) |
| Tg | Globe temperature (°C) |
| RH | Relative humidity (%) |
| Va | Wind speed (m/s) |
| Tmrt | Mean radiant temperature (°C) |
| W | Width |
| H | Height |
| L | Length |
| AR, H/W | Aspect ratio, Height-to-width ratio |
| L/W | Length-width ratio |
References
- Ritchie, H.; Samborska, V.; Roser, M. Urbanization; Our World in Data: Oxford, UK, 2024. [Google Scholar]
- Guan, X.; Wei, H.; Lu, S.; Dai, Q.; Su, H. Assessment on the urbanization strategy in China: Achievements, challenges and reflections. Habitat Int. 2018, 71, 97–109. [Google Scholar] [CrossRef]
- Van Hove, L.; Jacobs, C.; Heusinkveld, B.; Elbers, J.; Van Driel, B.; Holtslag, A. Temporal and spatial variability of urban heat island and thermal comfort within the Rotterdam agglomeration. Build. Environ. 2015, 83, 91–103. [Google Scholar] [CrossRef]
- Morris, K.I.; Chan, A.; Morris, K.J.K.; Ooi, M.C.; Oozeer, M.Y.; Abakr, Y.A.; Nadzir, M.S.M.; Mohammed, I.Y.; Al-Qrimli, H.F. Impact of urbanization level on the interactions of urban area, the urban climate, and human thermal comfort. Appl. Geogr. 2017, 79, 50–72. [Google Scholar] [CrossRef]
- Mahmoud, S.H.; Gan, T.Y. Long-term impact of rapid urbanization on urban climate and human thermal comfort in hot-arid environment. Build. Environ. 2018, 142, 83–100. [Google Scholar] [CrossRef]
- Ren, Z.; Fu, Y.; Dong, Y.; Zhang, P.; He, X. Rapid urbanization and climate change significantly contribute to worsening urban human thermal comfort: A national 183-city, 26-year study in China. Urban Clim. 2022, 43, 101154. [Google Scholar] [CrossRef]
- Wong, S.-K.; Lai, L.W.-C.; Ho, D.C.-W.; Chau, K.-W.; Lam, C.L.-K.; Ng, C.H.-F. Sick building syndrome and perceived indoor environmental quality: A survey of apartment buildings in Hong Kong. Habitat Int. 2009, 33, 463–471. [Google Scholar] [CrossRef]
- Hwang, R.-L.; Lin, C.-Y.; Huang, K.-T. Spatial and temporal analysis of urban heat island and global warming on residential thermal comfort and cooling energy in Taiwan. Energy Build. 2017, 152, 804–812. [Google Scholar] [CrossRef]
- Giridharan, R.; Emmanuel, R. The impact of urban compactness, comfort strategies and energy consumption on tropical urban heat island intensity: A review. Sustain. Cities Soc. 2018, 40, 677–687. [Google Scholar] [CrossRef]
- Lai, D.; Guo, D.; Hou, Y.; Lin, C.; Chen, Q. Studies of outdoor thermal comfort in northern China. Build. Environ. 2014, 77, 110–118. [Google Scholar] [CrossRef]
- Martinelli, L.; Lin, T.-P.; Matzarakis, A. Assessment of the influence of daily shadings pattern on human thermal comfort and attendance in Rome during summer period. Build. Environ. 2015, 92, 30–38. [Google Scholar] [CrossRef]
- Lai, D.; Liu, W.; Gan, T.; Liu, K.; Chen, Q. A review of mitigating strategies to improve the thermal environment and thermal comfort in urban outdoor spaces. Sci. Total Environ. 2019, 661, 337–353. [Google Scholar] [CrossRef] [PubMed]
- Manavvi, S.; Rajasekar, E. Evaluating outdoor thermal comfort in urban open spaces in a humid subtropical climate: Chandigarh, India. Build. Environ. 2022, 209, 108659. [Google Scholar] [CrossRef]
- Jusuf, S.K.; Wong, N.H.; Hagen, E.; Anggoro, R.; Hong, Y. The influence of land use on the urban heat island in Singapore. Habitat Int. 2007, 31, 232–242. [Google Scholar] [CrossRef]
- Li, J.; Song, C.; Cao, L.; Zhu, F.; Meng, X.; Wu, J. Impacts of landscape structure on surface urban heat islands: A case study of Shanghai, China. Remote Sens. Environ. 2011, 115, 3249–3263. [Google Scholar] [CrossRef]
- Lin, P.; Lau, S.S.Y.; Qin, H.; Gou, Z. Effects of urban planning indicators on urban heat island: A case study of pocket parks in high-rise high-density environment. Landsc. Urban Plan. 2017, 168, 48–60. [Google Scholar] [CrossRef]
- Huang, S.-C.L. A study of outdoor interactional spaces in high-rise housing. Landsc. Urban Plan. 2006, 78, 193–204. [Google Scholar] [CrossRef]
- Lai, D.; Zhou, C.; Huang, J.; Jiang, Y.; Long, Z.; Chen, Q. Outdoor space quality: A field study in an urban residential community in central China. Energy Build. 2014, 68, 713–720. [Google Scholar] [CrossRef]
- Li, K.; Zhang, Y.; Zhao, L. Outdoor thermal comfort and activities in the urban residential community in a humid subtropical area of China. Energy Build. 2016, 133, 498–511. [Google Scholar] [CrossRef]
- Huang, J.; Zhou, C.; Zhuo, Y.; Xu, L.; Jiang, Y. Outdoor thermal environments and activities in open space: An experiment study in humid subtropical climates. Build. Environ. 2016, 103, 238–249. [Google Scholar] [CrossRef]
- Sharifi, E.; Boland, J. Limits of thermal adaptation in cities: Outdoor heat-activity dynamics in Sydney, Melbourne and Adelaide. Archit. Sci. Rev. 2018, 61, 191–201. [Google Scholar] [CrossRef]
- Haowei, P. Research on Public Space Design in Old Communities Based on the Perspective of Micro-Renewal. 2023. Available online: http://pea.lib.pte.hu/handle/pea/34995 (accessed on 13 October 2024).
- Nikolopoulou, M.; Lykoudis, S. Thermal comfort in outdoor urban spaces: Analysis across different European countries. Build. Environ. 2006, 41, 1455–1470. [Google Scholar] [CrossRef]
- Peng, S.; Maing, M. Influential factors of age-friendly neighborhood open space under high-density high-rise housing context in hot weather: A case study of public housing in Hong Kong. Cities 2021, 115, 103231. [Google Scholar] [CrossRef]
- Kwon, C.W.; Lee, K.J. Outdoor thermal comfort in a transitional space of canopy in schools in the UK. Sustainability 2017, 9, 1753. [Google Scholar] [CrossRef]
- Zhang, Y.; Liu, J.; Zheng, Z.; Fang, Z.; Zhang, X.; Gao, Y.; Xie, Y. Analysis of thermal comfort during movement in a semi-open transition space. Energy Build. 2020, 225, 110312. [Google Scholar] [CrossRef]
- Chun, C.; Kwok, A.; Tamura, A. Thermal comfort in transitional spaces—Basic concepts: Literature review and trial measurement. Build. Environ. 2004, 39, 1187–1192. [Google Scholar] [CrossRef]
- Chun, C.; Tamura, A. Thermal comfort in urban transitional spaces. Build. Environ. 2005, 40, 633–639. [Google Scholar] [CrossRef]
- Jiao, Y.; Yu, Y.; Yu, H.; Wang, F. The impact of thermal environment of transition spaces in elderly-care buildings on thermal adaptation and thermal behavior of the elderly. Build. Environ. 2023, 228, 109871. [Google Scholar] [CrossRef]
- Yung, E.H.K.; Wang, S.; Chau, C.-k. Thermal perceptions of the elderly, use patterns and satisfaction with open space. Landsc. Urban Plan. 2019, 185, 44–60. [Google Scholar] [CrossRef]
- Kwon, C.W.; Lee, K.J. Investigation of the environmental performance of a transitional space in a UK nursery school. Int. J. Sustain. Build. Technol. Urban Dev. 2016, 7, 153–164. [Google Scholar] [CrossRef]
- Chang, S.; He, W.; Yan, H.; Yang, L.; Song, C. Influences of vernacular building spaces on human thermal comfort in China’s arid climate areas. Energy Build. 2021, 244, 110978. [Google Scholar] [CrossRef]
- Sözen, İ.; Oral, G.K. Outdoor thermal comfort in urban canyon and courtyard in hot arid climate: A parametric study based on the vernacular settlement of Mardin. Sustain. Cities Soc. 2019, 48, 101398. [Google Scholar] [CrossRef]
- Huang, X.; Qu, C. Research on indoor thermal comfort and age of air in Qilou street shop under mechanical ventilation scheme: A case study of Nanning traditional block in southern China. Sustainability 2021, 13, 4037. [Google Scholar] [CrossRef]
- Juan, Y.-H.; Yang, A.-S.; Wen, C.-Y.; Lee, Y.-T.; Wang, P.-C. Optimization procedures for enhancement of city breathability using arcade design in a realistic high-rise urban area. Build. Environ. 2017, 121, 247–261. [Google Scholar] [CrossRef]
- Huang, X.; Li, C.; Zhuang, Z. Analysis of height-to-width ratio of commercial streets with arcades based on sunshine hours and street orientation. Appl. Sci. 2021, 11, 1706. [Google Scholar] [CrossRef]
- Andreou, E. Thermal comfort in outdoor spaces and urban canyon microclimate. Renew. Energy 2013, 55, 182–188. [Google Scholar] [CrossRef]
- Rodríguez-Algeciras, J.; Tablada, A.; Nouri, A.S.; Matzarakis, A. Assessing the influence of street configurations on human thermal conditions in open balconies in the Mediterranean climate. Urban Clim. 2021, 40, 100975. [Google Scholar] [CrossRef]
- Ali-Toudert, F.; Mayer, H. Numerical study on the effects of aspect ratio and orientation of an urban street canyon on outdoor thermal comfort in hot and dry climate. Build. Environ. 2006, 41, 94–108. [Google Scholar] [CrossRef]
- Ali-Toudert, F.; Mayer, H. Effects of asymmetry, galleries, overhanging facades and vegetation on thermal comfort in urban street canyons. Sol. Energy 2007, 81, 742–754. [Google Scholar] [CrossRef]
- Yin, S.; Lang, W.; Xiao, Y.; Xu, Z. Correlative impact of shading strategies and configurations design on pedestrian-level thermal comfort in traditional shophouse neighbourhoods, Southern China. Sustainability 2019, 11, 1355. [Google Scholar] [CrossRef]
- Chan, A. Investigation on the appropriate floor level of residential building for installing balcony, from a view point of energy and environmental performance. A case study in subtropical Hong Kong. Energy 2015, 85, 620–634. [Google Scholar] [CrossRef]
- Yin, S.; Wang, F.; Xiao, Y.; Xue, S. Comparing cooling efficiency of shading strategies for pedestrian thermal comfort in street canyons of traditional shophouse neighbourhoods in Guangzhou, China. Urban Clim. 2022, 43, 101165. [Google Scholar] [CrossRef]
- Weng, J.; Luo, B.; Xiang, H.; Gao, B. Effects of bottom-overhead design variables on pedestrian-level thermal comfort during summertime in different high-rise residential buildings: A case study in Chongqing, China. Buildings 2022, 12, 265. [Google Scholar] [CrossRef]
- Zhu, J.; Feng, J.; Lu, J.; Chen, Y.; Li, W.; Lian, P.; Zhao, X. A review of the influence of courtyard geometry and orientation on microclimate. Build. Environ. 2023, 236, 110269. [Google Scholar] [CrossRef]
- Savvides, A.; Michael, A.; Malaktou, E.; Philokyprou, M. Examination and assessment of insolation conditions of streetscapes of traditional settlements in the Eastern Mediterranean area. Habitat Int. 2016, 53, 442–452. [Google Scholar] [CrossRef]
- Su, Y.M.; Chang, H.T. Influence of summer outdoor pedestrian wind environment comfort with height-to-width ratios of arcade in Taiwan. Appl. Mech. Mater. 2016, 851, 633–638. [Google Scholar] [CrossRef]
- Hang, J.; Luo, Z.; Sandberg, M.; Gong, J. Natural ventilation assessment in typical open and semi-open urban environments under various wind directions. Build. Environ. 2013, 70, 318–333. [Google Scholar] [CrossRef]
- Kim, T.; Kim, K.; Kim, B.S. A wind tunnel experiment and CFD analysis on airflow performance of enclosed-arcade markets in Korea. Build. Environ. 2010, 45, 1329–1338. [Google Scholar] [CrossRef]
- Yin, S.; Xiao, Y. Scale study of traditional shophouse street in south of China based on outdoor thermal comfort. Procedia Eng. 2016, 169, 232–239. [Google Scholar] [CrossRef]
- Malaktou, E.; Philokyprou, M. Summer thermal comfort conditions in shopping arcades and their adjoining streets in hot and dry climates. The case of the Nicosia’s historic centre. Proc. IOP Conf. Ser. Earth Environ. Sci. 2020, 410, 012093. [Google Scholar] [CrossRef]
- Taleghani, M.; Kleerekoper, L.; Tenpierik, M.; Van Den Dobbelsteen, A. Outdoor thermal comfort within five different urban forms in the Netherlands. Build. Environ. 2015, 83, 65–78. [Google Scholar] [CrossRef]
- Omrani, S.; Garcia-Hansen, V.; Capra, B.; Drogemuller, R. On the effect of provision of balconies on natural ventilation and thermal comfort in high-rise residential buildings. Build. Environ. 2017, 123, 504–516. [Google Scholar] [CrossRef]
- Munawaroh, A.S.; Damayanti, E.; Prasetyo, Y.A. A Field Measurement of Thermal Comfort in Semi Outdoor Space in Hot-Humid Climate. Proc. IOP Conf. Ser. Earth Environ. Sci. 2021, 738, 012066. [Google Scholar] [CrossRef]
- Yilmaz, S.; Külekçi, E.A.; Mutlu, B.E.; Sezen, I. Analysis of winter thermal comfort conditions: Street scenarios using ENVI-met model. Environ. Sci. Pollut. Res. 2021, 28, 63837–63859. [Google Scholar] [CrossRef] [PubMed]
- Yuan, X.; Ryu, Y.; Sekartaji, D. Effect of balcony forms difference on indoor thermal environment and energy saving performance of multiple-dwelling house. Front. Energy Res. 2022, 10, 891946. [Google Scholar] [CrossRef]
- Peel, M.C.; Finlayson, B.L.; McMahon, T.A. Updated world map of the Köppen-Geiger climate classification. Hydrol. Earth Syst. Sci. 2007, 11, 1633–1644. [Google Scholar] [CrossRef]
- Moroşan, P.-D.; Bourdais, R.; Dumur, D.; Buisson, J. Building temperature regulation using a distributed model predictive control. Energy Build. 2010, 42, 1445–1452. [Google Scholar] [CrossRef]
- Álvarez, J.; Redondo, J.L.; Camponogara, E.; Normey-Rico, J.; Berenguel, M.; Ortigosa, P. Optimizing building comfort temperature regulation via model predictive control. Energy Build. 2013, 57, 361–372. [Google Scholar] [CrossRef]
- Zhao, J.-h.; Feng, G.-l.; Zhi, R. Progresses and prospects in research on season division and seasonal changes in China. J. Trop. Meteorol. 2013, 19, 28. [Google Scholar]
- Bruse, M.; Fleer, H. Simulating surface–plant–air interactions inside urban environments with a three dimensional numerical model. Environ. Model. Softw. 1998, 13, 373–384. [Google Scholar] [CrossRef]
- Tsoka, S.; Tsikaloudaki, A.; Theodosiou, T. Analyzing the ENVI-met microclimate model’s performance and assessing cool materials and urban vegetation applications–A review. Sustain. Cities Soc. 2018, 43, 55–76. [Google Scholar] [CrossRef]
- Lai, D.; Chen, B.; Liu, K. Quantification of the influence of thermal comfort and life patterns on outdoor space activities. In Building Simulation; Tsinghua University Press: Beijing, China, 2020. [Google Scholar]
- Liu, K.; Lian, Z.; Dai, X.; Lai, D. Comparing the effects of sun and wind on outdoor thermal comfort: A case study based on longitudinal subject tests in cold climate region. Sci. Total Environ. 2022, 825, 154009. [Google Scholar] [CrossRef] [PubMed]
- Wang, L.; Chen, T.; Yu, Y.; Wang, L.; Zang, H.; Cang, Y.; Zhang, Y.o.; Ma, X. Impacts of Vegetation Ratio, Street Orientation, and Aspect Ratio on Thermal Comfort and Building Carbon Emissions in Cold Zones: A Case Study of Tianjin. Land 2024, 13, 1275. [Google Scholar] [CrossRef]
- Acero, J.A.; Herranz-Pascual, K. A comparison of thermal comfort conditions in four urban spaces by means of measurements and modelling techniques. Build. Environ. 2015, 93, 245–257. [Google Scholar] [CrossRef]
- Du, K.; Ning, J.; Yan, L. How long is the sun duration in a street canyon?—Analysis of the view factors of street canyons. Build. Environ. 2020, 172, 106680. [Google Scholar] [CrossRef]
- Li, G.; Ren, Z.; Zhan, C. Sky View Factor-based correlation of landscape morphology and the thermal environment of street canyons: A case study of Harbin, China. Build. Environ. 2020, 169, 106587. [Google Scholar] [CrossRef]
- Miao, C.; Yu, S.; Hu, Y.; Zhang, H.; He, X.; Chen, W. Review of methods used to estimate the sky view factor in urban street canyons. Build. Environ. 2020, 168, 106497. [Google Scholar] [CrossRef]
- Chan, A.; Chow, T.T. Investigation on energy performance and energy payback period of application of balcony for residential apartment in Hong Kong. Energy Build. 2010, 42, 2400–2405. [Google Scholar] [CrossRef]
- Juan, Y.-H.; Wen, C.-Y.; Li, Z.; Yang, A.-S. A combined framework of integrating optimized half-open spaces into buildings and an application to a realistic case study on urban ventilation and air pollutant dispersion. J. Build. Eng. 2021, 44, 102975. [Google Scholar] [CrossRef]
- Pagliarini, G.; Rainieri, S. Thermal environment characterisation of a glass-covered semi-outdoor space subjected to natural climate mitigation. Energy Build. 2011, 43, 1609–1617. [Google Scholar] [CrossRef]
Disclaimer/Publisher’s Note: The statements, opinions and data contained in all publications are solely those of the individual author(s) and contributor(s) and not of MDPI and/or the editor(s). MDPI and/or the editor(s) disclaim responsibility for any injury to people or property resulting from any ideas, methods, instructions or products referred to in the content. |
© 2025 by the authors. Licensee MDPI, Basel, Switzerland. This article is an open access article distributed under the terms and conditions of the Creative Commons Attribution (CC BY) license (https://creativecommons.org/licenses/by/4.0/).

