Abstract
The increasing demand for sustainable development and carbon neutrality highlights the need to improve the energy efficiency of infrastructure, particularly in highway service areas. This study explores the application of green roofs as a low-carbon technology to reduce energy consumption across buildings located in different climate zones in China. A combination of theoretical modeling and simulation-based analysis was used to evaluate various green roof configurations in five representative cities: Harbin, Beijing, Wuhan, Guangzhou, and Kunming. The results show that green roofs can reduce annual building energy consumption by up to 2.02%, depending on climate and plant species. For example, fern roofs in Guangzhou reduced heating demand by 16.35%, while grass roofs in Wuhan lowered the daytime roof surface temperature by 31.82 °C. Furthermore, optimizing the building orientation to 60° led to energy savings of up to 7.73% in Kunming. These findings suggest that tailored greening strategies based on regional climate can effectively improve building energy performance and support the development of sustainable service infrastructure.
1. Introduction
Global climate change has become one of the most critical environmental challenges facing contemporary society. The primary driver of this phenomenon is the large-scale emission of greenhouse gases (GHGs), particularly carbon dioxide, resulting from extensive fossil fuel consumption [1,2,3]. In response to the urgent need for emission reduction, the international community has reached agreements such as the Paris Climate Accord, which aims to limit the global average temperature increase to below 1.5 °C [4]. Achieving these targets requires not only reductions in carbon emissions but also enhancements in carbon sink capacity [5,6,7].
Urban green infrastructure is increasingly recognized as an effective approach for mitigating the environmental impact of urbanization. Green spaces can improve air quality, regulate microclimates, reduce energy demand, and enhance the carbon sink capacity of cities [8,9,10,11]. Vegetation contributes to atmospheric carbon removal through photosynthesis and biomass accumulation, and its presence modifies the thermal environment, thereby reducing energy consumption in buildings [12,13,14]. Studies have demonstrated that the carbon sink potential varies significantly among plant species, with tree height, diameter at breast height (DBH), and leaf area index playing key roles [15,16,17]. In addition to trees, grass systems also contribute to urban carbon sinks and can serve as effective components in designed landscapes [18,19].
Among the various forms of green infrastructure, green roofs have attracted substantial attention due to their multifunctional benefits. These systems consist of layered assemblies that support plant growth on building rooftops, thereby providing thermal insulation, enhancing evapotranspiration, and improving overall building energy performance [20,21,22,23]. As the roof surface accounts for a significant portion of heat exchange in buildings, green roofs offer a practical solution for reducing indoor temperature fluctuations and Heating, Ventilation, and Air Conditioning (HVAC) energy loads. For instance, vertical and rooftop greening systems have been shown to lower indoor temperatures by up to 2.1 °C, reduce peak wall surface temperatures, and achieve annual energy savings of up to 8.9% in some cases [24,25,26]. Additionally, green roofs contribute to stormwater management, biodiversity conservation, and urban esthetics [27,28,29].
Despite the demonstrated benefits of green roofs, their effectiveness is highly influenced by climatic conditions. The thermal performance of vegetated roofs depends on a range of factors, including plant species selection, substrate properties, and local environmental parameters such as solar radiation, humidity, and temperature [21]. In hot and arid regions, drought-resistant species and moisture-retaining substrates are essential, while in cold climates, thermal insulation and frost-resistant vegetation are critical for effective performance. Failure to adapt green roof designs to regional conditions can significantly reduce their energy-saving and carbon sink efficacy.
Previous research has often treated green roof systems as generalized solutions, with limited consideration of climatic variability. This lack of regional adaptation constrains the scalability and practical implementation of green roofs in diverse contexts, particularly in countries like China, where climatic conditions vary significantly from north to south and from inland to coastal areas [30]. Furthermore, few studies have systematically examined the interaction between green roof design parameters and building characteristics, such as orientation, in relation to energy performance and carbon mitigation outcomes.
Highway service areas represent a critical yet understudied category of public infrastructure. These facilities, which support transportation networks and provide rest, retail, and service functions, are widely distributed and characterized by consistent energy demand due to their 24 h operational schedules [31,32]. Given their substantial roof surface area and standard building configurations, service areas offer considerable potential for the application of green roofs as a means of reducing energy consumption and supporting environmental goals.
To address the limited climatic responsiveness and typological specificity in existing green roof research, this study investigates the performance of green roofs in reducing building energy consumption and enhancing carbon sinks across five representative climate zones in China. The selected cities—Harbin, Beijing, Wuhan, Guangzhou, and Kunming—represent severe cold, cold, hot summer and cold winter, hot summer and warm winter, and temperate climate zones, respectively [33]. Through a combination of theoretical modeling and simulation-based analysis, the study evaluates the energy performance of different plant species and substrate configurations under varying climatic conditions. In addition, the influence of building orientation on energy use is assessed to support the development of integrated, climate-responsive greening strategies for service area buildings.
This research aims to propose scientifically grounded, regionally tailored design recommendations for green roof implementation in highway service areas. The findings contribute to the advancement of sustainable transportation infrastructure and provide empirical evidence for the broader adoption of low-carbon technologies in the built environment.
2. Methodology
2.1. Simulation Framework and Software
This study adopts a simulation-based approach to evaluate the energy-saving performance of green roofs in expressway service area buildings located in five representative climate zones in China. The building energy simulations were conducted using EnergyPlus 9.2. EnergyPlus allows detailed customization of building geometry, envelope construction, internal loads, HVAC operation, and advanced components such as green roofs through surface property modification and customized material layers. Simulations were performed on an hourly time step over an annual cycle, integrating local weather conditions and vegetation-specific parameters.
The simulation process consisted of the following steps:
Model Setup: The architectural and thermal model of the case study building was developed, including zoning, construction layers, occupancy, and HVAC profiles.
Climate Input: Weather data were obtained from the EnergyPlus official database (https://energyplus.net/weather, accessed on 30 September 2024), using China Standard Weather Data (CSWD) files. These datasets include 8760 h of detailed information on air temperature, solar radiation, humidity, wind speed, precipitation, and cloud cover, etc. CSWD files were applied for Harbin, Beijing, Wuhan, Guangzhou, and Kunming, each representing a distinct climate zone.
Green Roof Configuration: Green roof assemblies were defined using layered constructions for substrate and plant characteristics, embedded into the EnergyPlus material and surface property inputs.
HVAC and Internal Loads: HVAC operations were modeled in accordance with national building energy codes, including occupancy-based temperature setpoints, lighting, and equipment loads.
Post-Processing and Analysis: The simulation outputs included annual, seasonal, and hourly data on energy consumption for heating, cooling, and total loads under various green roof and orientation scenarios.
2.2. Case Study
This study focuses on the North Zone Complex of the Liangzihu Service Area, situated along the Ezhou-Xianning Expressway in Ezhou City, Hubei Province, China. The Liangzihu Service Area is strategically located between Liangzi Lake and Baoan Lake in Liangzihu Town, Ezhou City, Hubei Province, along the Ezhou–Xianning Expressway. As a key auxiliary facility of this expressway, its central site is positioned at K30 + 400. The area is surrounded by abundant ecological and cultural resources, including the Liangzi Lake Provincial Wetland Nature Reserve, Baoan Lake National Wetland Park, Baoan Lake Mandarin Fish Conservation Area, and Zaoshan Provincial Forest Park. Its construction reflects an integrated approach to balancing transportation demands with ecological preservation, aiming to enhance the environmental and cultural identity of the region.
Covering a net area of 189.8 acres, the Liangzihu Service Area is divided into two zones, a southern zone of 96.3 acres and a northern zone of 93.5 acres, with a total building area of 14,603 m2, including 3471.14 m2 of wooden structures. The structure of Liangzi Lake Express Service Area is shown in Figure 1. The facility features 412 small vehicle parking spaces, 20 bus parking spaces, 19 medium vehicle spaces, 48 large vehicle spaces, and 88 charging stations. With a building density of 6.49% and a greening rate of 41.23%, the service area embodies sustainable design principles. Its development integrates the “Service Area+” commercial model, leveraging local natural and cultural resources to establish a multifunctional hub encompassing dining, lodging, transportation, recreation, shopping, and entertainment.
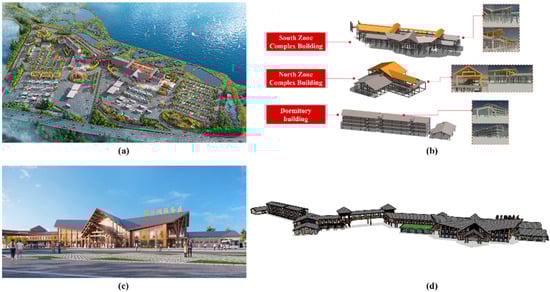
Figure 1.
Schematic diagram of Liangzi Lake service area: (a) aerial view; (b) structural model; (c) perspective view of the complex building; and (d) site model.
The architectural model of the North Complex is shown in Figure 2. The total building area is 1554 m2, with 963 m2 designated as air-conditioned spaces. The zoning of the various functional areas of the North Complex is shown schematically in Figure 3. The building consists of two levels, with the ground floor accommodating a lobby, supermarket, restrooms, and storage facilities. The second floor houses a dining area. This functional zoning supports diverse service demands, enhancing operational efficiency and user experience.
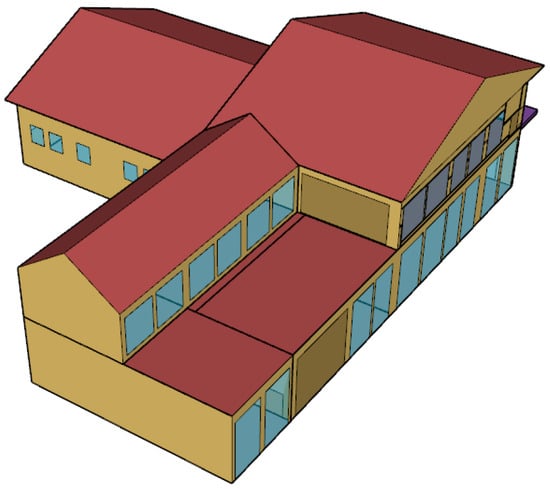
Figure 2.
The North Zone Complex building model.
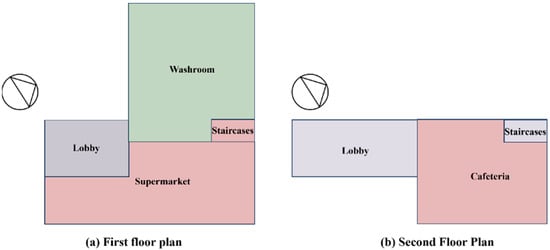
Figure 3.
Floor plan of the North Complex Building (Circles and triangles indicate the direction of north).
The building has a window-to-wall ratio of 30%, aligning with energy-saving considerations in architectural design. The construction of the various levels of the envelope of the North Complex is shown in Table 1. Table 2 shows the detailed parameters of each material. The performance parameters of each enclosure structure are shown in Table 3. The relatively moderate WWR helps balance natural lighting and thermal performance, reducing reliance on artificial lighting and HVAC systems. The parameters of the transparent enclosure are shown in Table 4. This ratio, combined with the building’s functional layout, offers an opportunity to analyze energy performance under typical operational conditions in a high-traffic service area.

Table 1.
The construction of the layers of envelopes.
Table 2.
Material parameters of the construction layer.
Table 3.
The performance of opaque envelopes.
Table 4.
The performance of transparent envelopes.
The probability of human presence is shown in Table 5 [34]. The HVAC operation hours were consistent with the building occupancy schedule. The distribution of internal heat sources, based on relevant energy conservation codes, and the results from the building research are shown in Table 6 [35]. The room was temperature-controlled using a single air conditioner. The cooling temperature was set at 22 °C, and the heating temperature at 25 °C [36].
Table 5.
Probability of people being present at different times.
Table 6.
The distribution of internal heat sources on typical weekdays.
The green roof is a form of green landscaping according to the structural characteristics of the building roof, the load, and the ecological conditions on the roof. The roof greening construction layer from bottom to top is usually divided into the anti-leakage layer, root barrier layer, moisture layer, drainage layer, filtration layer, planting soil layer, vegetation layer, etc. The schematic construction of the green roof is shown in Figure 4. In real applications, slope-adapted green roof systems with anti-slip and lightweight substrate configurations would be required, and this has been acknowledged as a design assumption in our modeling process. While these construction layers make up the green roof, they also further increase the thermal resistance of the roof. The green roofs used in this study have green planting parameters as shown in Table 7 [37,38,39].
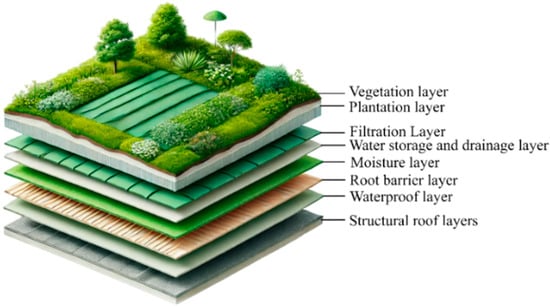
Figure 4.
Schematic construction of a green roof.
Table 7.
Green planting parameters [37,38,39].
The topography of China varies markedly across latitudes and longitudes. The climate varies greatly from region to region. The Uniform Standard for Design of Civil Buildings divides the country into five climate zones [33]. To explore the performance of green roofs in service areas in different climate zones, Harbin, Beijing, Wuhan, Guangzhou and Kunming are selected as five typical cities. The location of the study cities in the climate zone is shown in Figure 5. The information representing the cities is shown in Table 8.
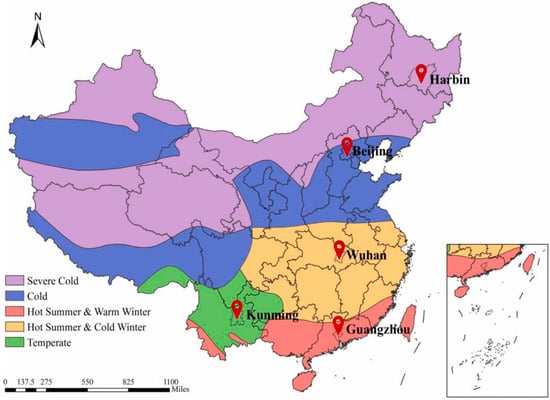
Figure 5.
Location of the study city in climate zones [40].
Table 8.
Information of the representative cities.
2.3. Mathematical Methods
The energy balance of a green roof is primarily driven by solar radiative forcing. This radiation is offset by sensible heat flux through convection and latent heat flux via evaporation. The surface energy balance is used to describe and interpret the physical processes by which green roofs influence heat transfer between the building envelope and the surrounding environment. Specifically, we decompose the net surface energy into sensible heat, latent heat, and ground heat flux components.
The EnergyPlus simulation engine computes these quantities internally based on the building geometry, material definitions, weather inputs, and vegetation parameters. Therefore, the Fast All Season Soil Strength (FASST) model was used to supplement the EnergyPlus outputs with a physically grounded interpretation [41,42]. The FASST model is referenced to support the theoretical framework, but no separate data manipulation tool was applied outside of EnergyPlus. The model was selected for this study because it offers a well-validated and computationally efficient approach to modeling surface energy balance in vegetated systems under a wide range of environmental conditions.
The foliage energy balance is expressed as
The heat flux can be reasonably estimated using the following equation:
The measurement unit is unit/m, expressed as
The resistance to moisture exchange offered by the boundary layer formed on the leaf surface is known as aerodynamic resistance. It is measured in units of (s/m) and is influenced by wind speed, surface roughness, and atmospheric stability. It is formulated as
The overall energy balance at the soil surface is
Sensible heat flux between the soil surface and the air in its vicinity depends on the temperature difference between them and the wind speed within the canopy. It is given as
In order to solve the foliage and soil heat budget equations, the fourth-order terms and as well as the mixing ratio terms and are linearized as given:
The saturation mixing ratios at the ground and leaf surface temperatures are given as
After linearization, the final equations take the following forms:
The surface energy balance of an exposed roof is as follows:
The green roof generates additional energy fluxes due to vegetation cover and growth [43]. The surface energy balance of the green roof is as follows:
3. Results and Analysis
The simulation operation results of the North District Complex were obtained according to the setup in the previous section. Harbin, Beijing, Wuhan, Guangzhou, and Kunming were taken as examples to analyze the application effect of green roofs.
3.1. The Impact of Green Roofs on Total Building Energy Consumption
The analysis in Figure 6 indicates that the implementation of green roofs on buildings in different regions of China has a notable impact on reducing annual energy consumption. The highest energy savings were achieved by grass green roofs in Beijing, Wuhan, Guangzhou, and Kunming, with 1.5%, 1.32%, 0.77%, and 2.02%, respectively. The energy efficiency of shrub green roofs was the highest in Harbin, with 1.64%, and that of grass green roofs was 1.49%. The type of green roof has a significant effect on energy-saving potential. The energy savings of shrub and grass roofs were generally better than those of other roofs. These findings suggest that the type of green roof is pivotal in determining energy-saving potential, and regional climate should be a critical factor in the selection process. The climate zone plays a significant role, as the thermal properties and insulation provided by green roofs can influence the building’s energy demand. Grasses, ferns, and shrubs have different growth habits, leaf areas, and transpiration rates, which can affect the roof’s ability to cool the building through evapotranspiration. The interaction between the green roof and the building’s HVAC system can also affect energy consumption. These factors collectively determine the effectiveness of green roofs in reducing a building’s energy consumption.
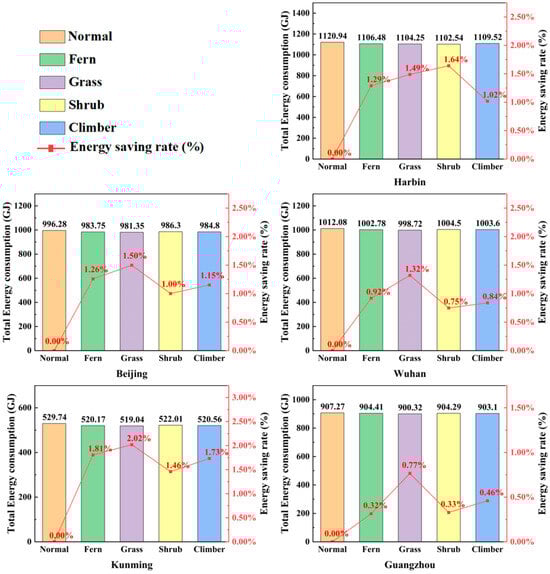
Figure 6.
The effect of different green roofs on the annual energy consumption of the operation of the building.
The effect of various green roof types on the cooling energy consumption of buildings in different climate zones in China is analyzed in detail in Figure 7. The energy consumption of green roof cooling in Beijing decreased slightly from 405.59 GJ to 402.31 GJ, with an energy saving rate of 0.81%. The energy consumption of green roof cooling in Harbin was reduced from 213.52 GJ to 212.73 GJ, with an energy saving rate of 0.37%. The energy consumption of grass green roof cooling in Wuhan was reduced from 552.79 GJ to 546.89 GJ, with an energy saving rate of 1.07%. The energy consumption of grass green roof cooling in Guangzhou was reduced from 577.98 GJ to 573.87 GJ, with an energy saving rate of 0.71%. The energy consumption for green roof cooling in Kunming was reduced from 156.03 GJ to 152.78 GJ. The energy saving rate was 2.08%. However, shrub roofs showed negative savings for the cooling energy consumption of buildings in areas other than Harbin. The impact of other plants on the cooling energy consumption of a building varies. The overall energy-saving rate is positive. These findings suggest that the implementation of green roofs can effectively reduce dependence on artificial cooling systems, thereby enhancing the sustainability of building operations. However, the cooling performance of green roofs varies significantly depending on the type of vegetation and the climatic context. Plant species differ in growth patterns, leaf area index, and transpiration capacity, all of which influence the roof’s ability to dissipate heat through evapotranspiration. Consequently, the selection of appropriate vegetation must consider regional climatic conditions to maximize cooling efficiency.
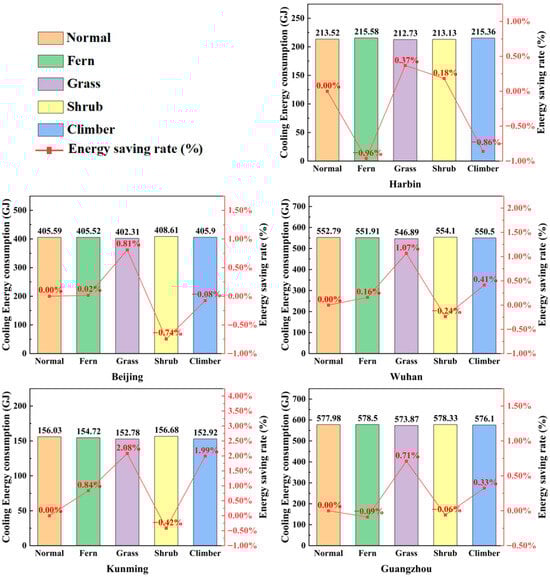
Figure 7.
The energy consumption of building cooling operation by different green roofs.
The effect of different types of green roofs on the heating energy consumption of buildings in different climate zones in China is analyzed in Figure 8. The energy consumption of shrub roof heating in Harbin decreased from 598.4 GJ to 580.39 GJ, with an energy saving rate of 3.01%. The energy consumption of shrub roof heating in Beijing was reduced from 284.26 GJ to 271.25 GJ, with an energy saving rate of 4.58%. The energy consumption of shrub roof heating in Wuhan was reduced from 141.97 GJ to 133.07 GJ, with an energy-saving rate of 6.27%. The energy consumption of fern roof heating in Guangzhou was reduced from 20.73 GJ to 17.34 GJ, with an energy saving rate of 16.35%. The energy consumption of shrub roof heating in Kunming was reduced from 58.51 GJ to 50.13 GJ, with an energy-saving rate of 14.32%. The various plants showed good heating and energy efficiency in all regions. The shrubs showed relatively better results. The high heating energy savings for all green roof types suggest that green roofs can significantly reduce reliance on artificial heating systems. The green roof provides an additional layer of insulation that reduces heat transfer from the building in winter. This was especially effective in colder climates, and the type of vegetation on a green roof affects its energy-saving potential.
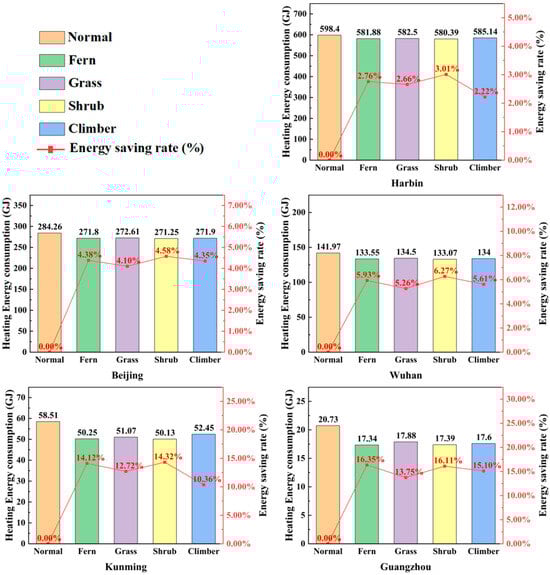
Figure 8.
Energy consumption of building heating operation by different green roofs.
3.2. The Effect of Orientation on Total Building Energy Consumption
The actual orientation of the Liangzi Lake Service Area North Complex is taken as the reference. Rotate the building orientation clockwise as the forward direction and anticlockwise as the reverse direction. The relationship between building energy consumption and building orientation is obtained. The effect of building orientation on the annual operational energy consumption of the roof at different rotation angles is analyzed in Figure 9. The energy saving rate fluctuates with the rotation angle, indicating that the orientation of the building can have a significant impact on its energy efficiency.
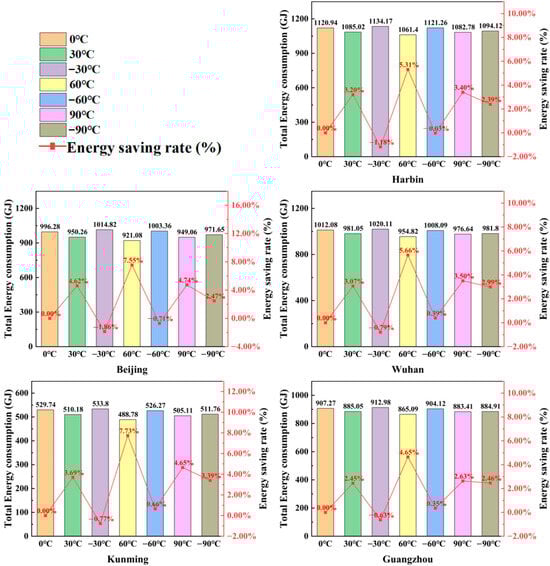
Figure 9.
The effect of building orientation on the annual operational energy consumption of roofs.
The building exhibits energy savings in all areas of forward rotation and achieves optimal energy savings at a 60° rotation. The buildings were in Harbin, Beijing, Wuhan, Guangzhou, and Kunming and had optimal energy savings of 5.31%, 7.55%, 5.66%, 4.65%, and 7.73%. Each building was in a north–south orientation, which allowed it to receive more light and reduce direct sunlight. The −30° rotation showed negative energy savings in all regions and reached energy savings at a −90° rotation. Whether or not energy was saved at a rotation of −60° varied from region to region. The solar altitude angle and radiant illumination vary in different climatic zones. This leads to differences in energy savings for the same angle of rotation in each region.
The effect of building orientation on roof cooling energy consumption is shown in Figure 10. The cooling energy consumption of the building was reduced in all zones in the case of positive rotation. However, the angle of rotation at which the energy saving rate peaks is not the same. The buildings’ cooling energy consumption in the case of counter-rotation shows a decreasing trend as the angle is rotated, and the cooling energy saving rate increases step by step. The best refrigeration energy-saving angles in Harbin, Beijing, Wuhan, Guangzhou, and Kunming were −90°, 60°, 90°, 60°, and 60°, and the maximum energy-saving rate was 5.31%, 7.55%, 5.66%, 4.65%, and 7.73%. This was due to the different levels of shielding from solar radiation at different angles in different regions.
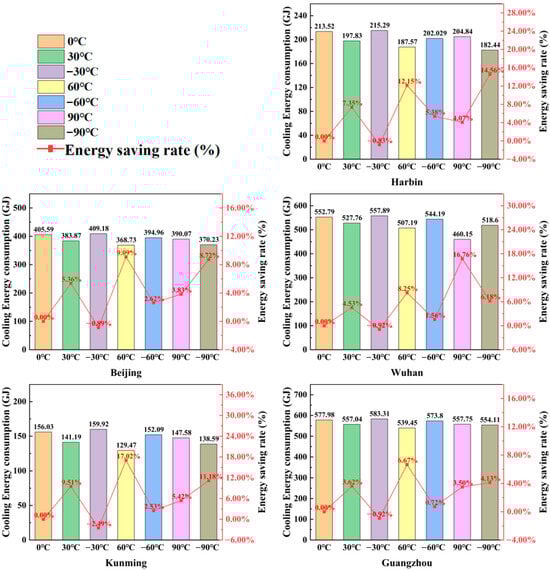
Figure 10.
The effect of building orientation on cooling energy consumption of roofs.
The effect of building orientation on roof heating energy consumption is shown in Figure 11. The heating energy consumption of the building was reduced in all regions under positive rotation. In cold places such as Harbin and Beijing, the best heating energy saving rate was achieved when rotating 60°, with 5.57% and 13.31%, respectively. However, in warm places such as Wuhan, Guangzhou and Kunming, the best heating energy saving rate was achieved when rotating 90°, with 19.19%, 16.88% and 27.79%, respectively, and the heating energy consumption increased in the case of reverse rotation, except for the case of rotating −90° in Kunming. This was since buildings receive different solar radiation in different areas with different orientations.
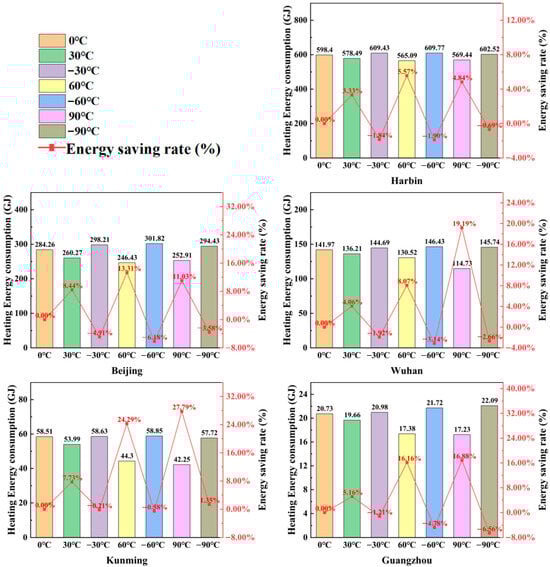
Figure 11.
The effect of building orientation on heating energy consumption of roofs.
3.3. The Effect of Green Roofs on Temperature
The roof surface temperature on a typical day in summer is shown in Figure 12. The roof covered with grass was used as an example to analyze the temperature changes on the inner and outer surfaces of the roof. The representative day of summer (1 July) and the representative day of winter (1 January) were selected. The internal surface temperature (Tgin) and external surface temperature (Tgout) of a green roof with grass and the internal surface temperature (Trin) and external surface temperature (Trout) of a normal roof were analyzed for the same outdoor temperature (Tout). The green roof with grass could make Tgin slightly lower than Trin in summer due to the effect of HVAC under high temperatures outside at noon. In other cases, the Tgin was almost the same as the Trin. The Tgout was higher than the Trout at night due to the heat storage effect of the soil and the effect of grass on air convection. The shading effect and transpiration of plants can effectively reduce the external surface temperature during daytime. The maximum reduction of Tgout relative to Trout was 31.82 °C during the day in Wuhan.
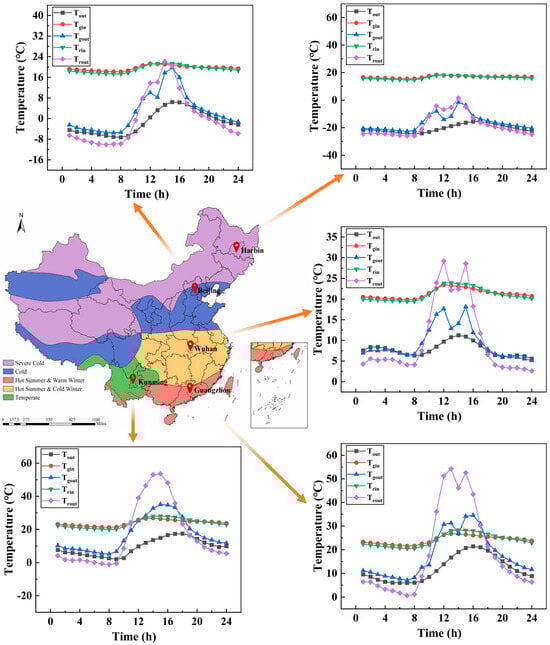
Figure 12.
The surface temperature of roofs on a typical day in summer.
The roof surface temperature on a typical day in winter is shown in Figure 13. Tgin was slightly higher than Trin at night in winter, due to HVAC, and slightly lower than Trin during the day, while in Tgin was slightly lower than Trin during the day. Tgout was higher than Trout at night. Tgout and Trout during the daytime in the relatively cold areas of Beijing and Harbin were almost the same. In the warmer areas of Wuhan, Guangzhou, and Kunming, daytime Tgout was lower than Trout. This was due to the fact that the outer surface receives more solar radiation. Tgout could be higher than Trout by 7.22 °C at night in the Kunming area. This was caused by soil heat storage as well as the combined effect of plants.
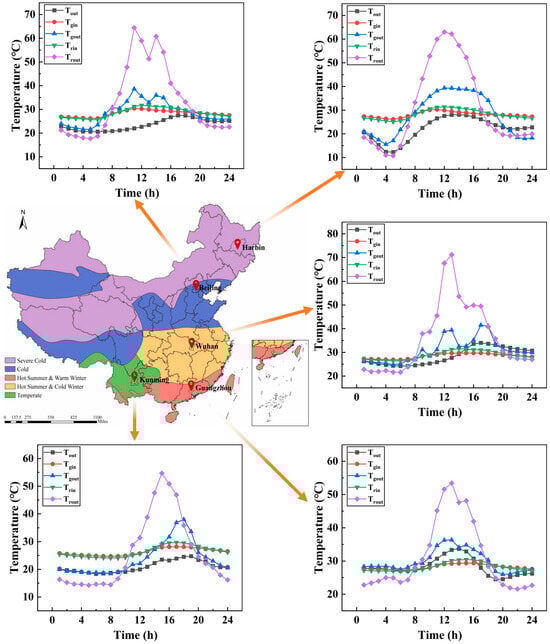
Figure 13.
The surface temperature of roofs on a typical day in winter.
4. Discussion
This study explored the energy-saving potential of green roofs and building orientation adjustments in expressway service area buildings across five distinct climate zones in China.
The performance of green roofs varied with vegetation type and climate. Grass and shrub roofs showed better results in temperate and cold regions such as Kunming and Harbin. This aligns with prior studies indicating that vegetation adapted to regional climates enhances insulation and energy performance [22,38].
In contrast, fern roofs proved more effective in warm and humid climates like Guangzhou. Their ability to reduce heating energy use is consistent with findings by Sailor, who emphasized the role of high leaf reflectivity and evapotranspiration [39]. This highlights the importance of selecting vegetation not only for esthetics or availability but also for physiological traits like leaf area index and stomatal resistance [21].
Building orientation had a clear impact on energy use, with a 60° rotation from the baseline orientation offering consistent savings across all cities. This corresponds with findings by Bhamare et al., who noted that passive strategies like orientation and solar exposure management can significantly influence energy efficiency [23].
There is also potential in combining orientation adjustments with vegetation design. For example, aligning plant shading with solar angles may improve cooling in hot months. Similar integrated approaches have been discussed in earlier research on green infrastructure multifunctionality [27].
From a practical standpoint, the vegetation types modeled in this study are generally accessible in landscaping across China. However, in regions with low rainfall or long dry seasons, irrigation may be necessary, potentially offsetting some energy benefits. This trade-off between water use and cooling efficiency has been noted in studies such as that of Hsieh et al. [11].
Taken together, the findings support the idea that green roof design should be climate-sensitive, with consideration given to vegetation traits, substrate properties, and building layout. These elements work best as a system, rather than in isolation, and offer practical strategies for reducing energy use in public infrastructure.
Further studies could expand on this by incorporating real-time weather data, plant growth stages, and irrigation systems into simulations. Exploring mixed green systems, such as combining green roofs with vertical greenery, may also improve energy performance while addressing space and maintenance constraints.
5. Conclusions
This study explored the application of green roofs in expressway service area buildings across five representative climate zones in China, focusing on their energy-saving performance and the impact of building orientation. The conclusions drawn from the simulation results are as follows:
- (1)
- Green roofs can effectively reduce the annual energy consumption of buildings. Grass roofs achieved the highest energy savings in Beijing (1.5%), Wuhan (1.32%), Guangzhou (0.77%), and Kunming (2.02%), while shrub roofs performed best in Harbin with a saving rate of 1.64%. These results indicate that the choice of vegetation type should be tailored to local climatic conditions, with grasses and shrubs showing the best performance in temperate and cold regions, and ferns proving advantageous in warmer climates.
- (2)
- In terms of heating energy consumption, fern roofs in Guangzhou reduced energy use by 16.35%, while shrub roofs in Kunming achieved savings of 14.32%. For cooling energy, grass roofs in Kunming resulted in a 2.08% reduction. These results demonstrate the climate sensitivity of green roof performance, highlighting the importance of vegetation physiology, moisture retention, and thermal inertia.
- (3)
- Orientation optimization significantly affects building energy consumption. A rotation of 60° produced the best overall energy savings across all five cities, with maximum reductions of 5.31% (Harbin), 7.55% (Beijing), 5.66% (Wuhan), 4.65% (Guangzhou), and 7.73% (Kunming). While green roofs and building orientation were studied independently, their combined effects suggest potential synergies, particularly when aligning vegetation shading patterns with solar exposure.
- (4)
- On typical summer days, green roofs effectively reduced the external surface temperature of the roof. In Wuhan, the grass roof decreased the outer surface temperature by up to 31.82 °C during the daytime. In Kunming during winter nights, green roofs increased the roof surface temperature by 7.22 °C due to soil heat retention and reduced convective loss.
Author Contributions
Methodology, L.Z.; Software, Y.G.; Validation, X.L.; Formal analysis, T.M.; Investigation, Y.G. and T.S.; Data curation, M.T. and Y.H.; Writing—original draft, Y.G.; Writing—review & editing, W.L.; Visualization, T.M. All authors have read and agreed to the published version of the manuscript.
Funding
This research was supported by the National Natural Science Foundation of China (Grant No. 52278123), and the National Key R&D Program of China (Grant No. 2019YFE0197500).
Data Availability Statement
The original contributions presented in this study are included in the article. Further inquiries can be directed to the corresponding author.
Conflicts of Interest
Authors Liang Zhao, Xianglin Liu, Meng Tang and Yunyi Huang were employed by the company CCCC Second Highway Consultants, Co., Ltd. The remaining authors declare that the research was conducted in the absence of any commercial or financial relationships that could be construed as a potential conflict of interest.
Abbreviations
The following abbreviations are used in this manuscript:
| Albedo (short wave reflectivity) of ground surface | |
| Coefficients in linearized temperature equations | |
| Bulk heat transfer coefficient | |
| Sensible heat flux bulk transfer coefficient at ground layer | |
| Specific heat of air at constant pressure, J/kg·K | |
| Multiplying factor for radiation effect on stomatal resistance | |
| Multiplying factor for moisture effect on stomatal resistance | |
| Additional multiplying factor for stomatal resistance | |
| Net heat flux to foliage layer, W/m2 | |
| Net heat flux to ground surface, W/m2 | |
| Foliage sensible heat flux, W/m2 | |
| Ground sensible heat flux, W/m2 | |
| Total incoming longwave radiation, W/m2 | |
| Total incoming shortwave radiation, W/m2 | |
| the thermal conductivity of the soil, W/m2·K | |
| Leaf area index | |
| Foliage latent heat flux, W/m2 | |
| Ground latent heat flux, W/m2 | |
| Current time step | |
| Future time step | |
| Saturation mixing ratio at ground temperature | |
| Saturation mixing ratio at foliage temperature | |
| The saturation mixing ratio | |
| The convective sensible heat flux, W/m2 | |
| Energy consumed by the evaporation of substrate moisture, W/m2 | |
| Evaporation, W/m2 | |
| Downward longwave radiation, W/m2 | |
| Upward longwave radiation, W/m2 | |
| Energy used by plant photosynthesis, W/m2 | |
| Energy consumed by plant respiration, W/m2 | |
| Incident solar radiation, W/m2 | |
| Reflected solar radiation, W/m2 | |
| Energy transferred into the building roof surface, W/m2 | |
| Energy consumed by plant transpiration, W/m2 | |
| Energy conducted by plants, W/m2 | |
| Energy conducted by the substrate, W/m2 | |
| Aerodynamic resistance to transpiration, s/m | |
| Foliage leaf stomatal resistance, s/m | |
| Minimal leaf stomatal resistance, s/m | |
| Air temperature within the canopy, K | |
| Ground surface temperature, K | |
| Leaf temperature, K | |
| Wind speed within the canopy, m/s | |
| Height or depth, m | |
| Albedo (short wave reflectivity) of the canopy | |
| Emissivity of canopy | |
| The emissivity of the ground surface | |
| The Stefan-Boltzmann constant, W/m2·K | |
| Density of air at ground surface temperature, kg/m3 | |
| Density of air at foliage temperature, kg/m3 |
References
- Hu, A. China’s goal of achieving carbon peak by 2030 and its main approaches. J. Beijing Univ. Technol. 2021, 21, 1–15. [Google Scholar]
- Cai, B.; Cao, L.; Lei, Y.; Wang, C.; Zhang, L.; Zhu, J.; Li, M.; Du, M.; Lv, C.; Jiang, H. China’s carbon emission pathway under the carbon neutrality target. China Popul. Resour. Environ. 2021, 31, 7–14. [Google Scholar]
- Wang, N.; Zhao, Y. Construction of an ecological security pattern in Jiangnan water network area based on an integrated Approach: A case study of Gaochun, Nanjing. Ecol. Indic. 2024, 158, 111314. [Google Scholar] [CrossRef]
- Masson-Delmotte, V.; Zhai, P.; Pörtner, H.-O.; Roberts, D.; Skea, J.; Shukla, P.R.; Pirani, A.; Moufouma-Okia, W.; Péan, C.; Pidcock, R. Global Warming of 1.5 °C. An IPCC Special Report on the Impacts of Global Warming of 1.5 °C Above Pre-Industrial Levels and Related Global Greenhouse Gas Emission Pathways, in the Context of Strengthening the Global Response to the Threat of Climate Change; Cambridge University Press: Cambridge, UK, 2018. [Google Scholar]
- Masson-Delmotte, V.; Zhai, P.; Pirani, A.; Connors, S.L.; Péan, C.; Berger, S.; Caud, N.; Chen, Y.; Goldfarb, L.; Gomis, M. Contribution of working group I to the sixth assessment report of the intergovernmental panel on climate change. Clim. Change 2021 Phys. Sci. Basis 2021, 2, 2391. [Google Scholar]
- Park, H.-M.; Jo, H.-K.; Kim, J.-Y. Carbon footprint of landscape tree production in Korea. Sustainability 2021, 13, 5915. [Google Scholar] [CrossRef]
- Dhakal, S. GHG emissions from urbanization and opportunities for urban carbon mitigation. Curr. Opin. Environ. Sustain. 2010, 2, 277–283. [Google Scholar] [CrossRef]
- Min, W.; Haoyang, S. Spatial characteristics and implementation framework for fine control of urban green space affecting carbon neutrality. Landsc. Archit. 2022, 29, 17–23. [Google Scholar]
- Yang, Y.; Yu, C.; Li, S.; Bramston, D. A planting optimization strategy to improve the carbon sink benefit for urban green—Taking the communal green of Nanjing Forestry University as an example. Ecol. Indic. 2024, 159, 111619. [Google Scholar] [CrossRef]
- Jo, H.-K.; Kim, J.-Y.; Park, H.-M. Carbon reduction and planning strategies for urban parks in Seoul. Urban For. Urban Green. 2019, 41, 48–54. [Google Scholar] [CrossRef]
- Hsieh, C.-M.; Li, J.-J.; Zhang, L.; Schwegler, B.J. Effects of tree shading and transpiration on building cooling energy use. Energy Build. 2018, 159, 382–397. [Google Scholar] [CrossRef]
- Mitchell, M.G.; Johansen, K.; Maron, M.; McAlpine, C.A.; Wu, D.; Rhodes, J.R. Identification of fine scale and landscape scale drivers of urban aboveground carbon stocks using high-resolution modeling and mapping. Sci. Total Environ. 2018, 622, 57–70. [Google Scholar] [CrossRef] [PubMed]
- Nowak, D.J.; Crane, D.E.; Stevens, J.C. Air pollution removal by urban trees and shrubs in the United States. Urban For. Urban Green. 2006, 4, 115–123. [Google Scholar] [CrossRef]
- Wang, Y.; Chang, Q.; Li, X. Promoting sustainable carbon sequestration of plants in urban greenspace by planting design: A case study in parks of Beijing. Urban For. Urban Green. 2021, 64, 127291. [Google Scholar] [CrossRef]
- Shadman, S.; Khalid, P.A.; Hanafiah, M.M.; Koyande, A.K.; Islam, M.A.; Bhuiyan, S.A.; Woon, K.S.; Show, P.-L. The carbon sequestration potential of urban public parks of densely populated cities to improve environmental sustainability. Sustain. Energy Technol. Assess. 2022, 52, 102064. [Google Scholar] [CrossRef]
- Wang, X.; Wang, Y.; Qu, X.; Huang, B.; Li, Z.; Sun, J.; Wei, X.; Yang, X. Urban trees in university campus: Structure, function, and ecological values. Environ. Sci. Pollut. Res. 2021, 28, 45183–45198. [Google Scholar] [CrossRef]
- Hepcan, C.C.; Hepcan, S. Assessing regulating ecosystem services provided by the Ege University Rectorship Garden. Urban For. Urban Green. 2018, 34, 10–16. [Google Scholar] [CrossRef]
- Lerman, S.B.; Contosta, A.R. Lawn mowing frequency and its effects on biogenic and anthropogenic carbon dioxide emissions. Landsc. Urban Plan. 2019, 182, 114–123. [Google Scholar] [CrossRef]
- Amoatey, P.; Sulaiman, H. Quantifying carbon storage potential of urban plantations and landscapes in Muscat, Oman. Environ. Dev. Sustain. 2020, 22, 7969–7984. [Google Scholar] [CrossRef]
- Akbari, H.; Matthews, H.D. Global cooling updates: Reflective roofs and pavements. Energy Build. 2012, 55, 2–6. [Google Scholar] [CrossRef]
- Al-Kayiem, H.H.; Koh, K.; Riyadi, T.W.; Effendy, M. A comparative review on greenery ecosystems and their impacts on sustainability of building environment. Sustainability 2020, 12, 8529. [Google Scholar] [CrossRef]
- Besir, A.B.; Cuce, E. Green roofs and facades: A comprehensive review. Renew. Sustain. Energy Rev. 2018, 82, 915–939. [Google Scholar] [CrossRef]
- Bhamare, D.K.; Rathod, M.K.; Banerjee, J. Passive cooling techniques for building and their applicability in different climatic zones—The state of art. Energy Build. 2019, 198, 467–490. [Google Scholar] [CrossRef]
- Xing, Q.; Hao, X.; Lin, Y.; Tan, H.; Yang, K. Experimental investigation on the thermal performance of a vertical greening system with green roof in wet and cold climates during winter. Energy Build. 2019, 183, 105–117. [Google Scholar] [CrossRef]
- Detommaso, M.; Costanzo, V.; Nocera, F.; Evola, G. Evaluation of the cooling potential of a vertical greenery system coupled to a building through an experimentally validated transient model. Build. Environ. 2023, 244, 110769. [Google Scholar] [CrossRef]
- Zuckerman, N.; Lensky, I.M. Thermal performance of vertical greenery systems (VGS) in a street canyon: A real-scale long-term experiment. Build. Environ. 2023, 244, 110750. [Google Scholar] [CrossRef]
- Manso, M.; Castro-Gomes, J. Green wall systems: A review of their characteristics. Renew. Sustain. Energy Rev. 2015, 41, 863–871. [Google Scholar] [CrossRef]
- Xi, C.; Ding, J.; Wang, J.; Feng, Z.; Cao, S.-J. Nature-based solution of greenery configuration design by comprehensive benefit evaluation of microclimate environment and carbon sequestration. Energy Build. 2022, 270, 112264. [Google Scholar] [CrossRef]
- Liu, Y.; Huang, Y.; Zhang, Z.; Wang, K.; Luo, Y.; Cui, P. Impacts of green walls on the characteristics of thermo-flow and photochemical reaction kinetics within street canyons. Urban For. Urban Green. 2022, 72, 127568. [Google Scholar] [CrossRef]
- Toyo Diaz, A.; Sajjadian, S.M. Simulation-based evaluation of low carbon design strategies for extreme climates. Intell. Build. Int. 2023, 15, 191–204. [Google Scholar] [CrossRef]
- Pérez-Acebo, H.; Romo-Martín, A. Service and rest areas in toll motorways in Poland: Study of distribution and facilities. Transp. Probl. 2019, 14, 155–164. [Google Scholar] [CrossRef]
- Plovnick, A.; Berthaume, A.; Poe, C.; Hodges, T. Sustainable Rest Area Design and Operations; John A Volpe National Transportation Systems Center (US): Cambridge, MA, USA, 2017.
- GB 50352-2019; Uniform Standard for Design of Civil Buildings. China Architecture & Building Press: Beijing, China, 2019.
- GB 50736-2012; Design Code for Heating Ventilation and Air Conditioning of Civil Buildings. China Architecture & Building Press: Beijing, China, 2012.
- GB 50034-2013; Standard for Lighting Design of Buildings. China Architecture & Building Press: Beijing, China, 2013.
- GB 50189-2015; Design Standard for Energy Efficiency of Public Buildings. China Architecture & Building Press: Beijing, China, 2015.
- Mousavi, S.; Gheibi, M.; Wacławek, S.; Behzadian, K. A novel smart framework for optimal design of green roofs in buildings conforming with energy conservation and thermal comfort. Energy Build. 2023, 291, 113111. [Google Scholar] [CrossRef]
- Zeng, C.; Bai, X.; Sun, L.; Zhang, Y.; Yuan, Y. Optimal parameters of green roofs in representative cities of four climate zones in China: A simulation study. Energy Build. 2017, 150, 118–131. [Google Scholar] [CrossRef]
- Sailor, D.J. A green roof model for building energy simulation programs. Energy Build. 2008, 40, 1466–1478. [Google Scholar] [CrossRef]
- Mao, R.; Ma, Z.; Ning, H.; Cao, J. Exploring the natural ventilation potential of urban climate for high-rise buildings across different climatic zones. J. Clean. Prod. 2024, 475, 143722. [Google Scholar] [CrossRef]
- Jones, S.L.; Sarasamma, S.; Hunt, E.D.; Borden, C.; Eylander, J.B.; Frankenstein, S. Fast All-season Soil STrength (FASST) Model Alterations for Efficient Regional Simulation. In Proceedings of the 94th American Meteorological Society Annual Meeting, Oklahoma City, OK, USA, 10–11 February 2014; p. 32. [Google Scholar]
- Frankenstein, S.; Koenig, G. Fast All Season Soil STrength (FASST) Model; ERDC/CRREL Special Report SR-04-1; US Army Engineer Research and Development Center, Cold Regions Research and Engineering Laboratory: New Hampshire, NH, USA, 2004. [Google Scholar]
- Huang, J.; Kong, F.; Yin, H.; Middel, A.; Liu, H.; Meadows, M.E. Green roof effects on urban building surface processes and energy budgets. Energy Convers. Manag. 2023, 287, 117100. [Google Scholar] [CrossRef]
Disclaimer/Publisher’s Note: The statements, opinions and data contained in all publications are solely those of the individual author(s) and contributor(s) and not of MDPI and/or the editor(s). MDPI and/or the editor(s) disclaim responsibility for any injury to people or property resulting from any ideas, methods, instructions or products referred to in the content. |
© 2025 by the authors. Licensee MDPI, Basel, Switzerland. This article is an open access article distributed under the terms and conditions of the Creative Commons Attribution (CC BY) license (https://creativecommons.org/licenses/by/4.0/).