Article

A Submerged Building Strategy for Low-Carbon Data Centers in Coal Mining Subsidence Areas: System Design and Energy–Carbon Performance Assessment

1
School of Mechanics and Civil Engineering, China University of Mining and Technology, Xuzhou 221116, China
2
School of Architectural Decoration, Jiangsu Vocational Institute of Architectural Technology, Xuzhou 221116, China
3
College of Electrical Engineering, Sichuan University, Chengdu 610065, China
4
School of Architecture & Design, China University of Mining and Technology, Xuzhou 221116, China
5
School of Design, Hefei University, Hefei 230601, China
*
Authors to whom correspondence should be addressed.
Buildings 2025, 15(17), 3148; https://doi.org/10.3390/buildings15173148
Submission received: 30 July 2025 / Revised: 25 August 2025 / Accepted: 29 August 2025 / Published: 2 September 2025
(This article belongs to the Section Building Energy, Physics, Environment, and Systems)

Abstract

This study explores a submerged architectural strategy for data center deployment in coal mining subsidence water bodies, aiming to simultaneously address the underutilization of post-mining landscapes, the high-carbon operation of data centers, and the implementation challenges of China’s dual carbon goals. The proposed structure integrates wall-mounted plate heat exchangers into the façades of underwater data halls, using the natural convection of surrounding water as a low-grade heat sink to replace conventional cooling towers and achieve passive, low-carbon cooling. A thermal exchange model was developed based on heat transfer principles and validated by comparing outputs from TRNSYS simulations and MATLAB-based parameterized calculations, showing a deviation of less than 3% under all test conditions. The model was then used to estimate energy consumption, PUE, and carbon emissions under typical IT load scenarios. Results indicate a 42.5–64.3% reduction in cooling energy use and a 37.7–75.1% reduction in carbon emissions compared to conventional solutions, while a PUE range of 1.06–1.15 is maintained. The system also offers strong spatial adaptability and scalability, presenting a sustainable solution for redeveloping subsidence zones that supports ecological restoration and digital transformation in resource-depleted urban regions.

1. Introduction

As China’s “Dual Carbon” strategy progresses toward its targets, the nation faces growing challenges in achieving a coordinated balance among spatial planning, energy efficiency, and industrial transformation. Over 97% of China’s coal mines adopt underground mining methods, particularly longwall full-collapse techniques, which have resulted in more than 8 million hectares of mining subsidence zones [1]—approximately 70% of which are now permanently flooded [2]. These subsided water bodies, due to geological instability, complex hydrological conditions, and ambiguous land governance, have long been marginalized in mainstream urban and infrastructure planning systems [3]. While existing research has explored their ecological restoration [4,5,6,7] or recreational use possibilities [8,9,10,11]—such as wetland creation [12,13,14,15] or agriculture and aquaculture [16,17,18]—these efforts often lack sustained economic drivers and fail to ensure long-term functional viability [19,20,21].
At the same time, data centers have emerged as the backbone of national digital infrastructure [22], accompanied by rapidly escalating energy demands. Cooling systems, in particular, account for a substantial proportion of total energy consumption [23]. According to testing by Lawrence Berkeley National Laboratory (LBNL), typical commercial buildings consume up to 100 W/m2 [24], whereas data centers can consume 9–10 times that amount; large-scale facilities may reach as high as 3000 W/m2 [25], far exceeding the intensity of conventional buildings [26]. Some projections indicate that, without intervention, the global ICT industry could consume over 20% of total electricity by 2030 [27]. Although many studies have focused on equipment-level optimization and envelope energy efficiency, few have addressed how data centers could be spatially reallocated, structurally reconfigured, and systemically cooled in an integrated fashion—especially in ways that take advantage of ecologically marginal or underutilized territories.
In the broader field of sustainable architecture, increasing attention has been paid to environmental–structural synergies—such as building-integrated photovoltaics (BIPVs) [28,29,30], natural ventilation [31,32], and green roofs [33,34]—particularly in the context of office, educational, and residential typologies. However, for data center architecture characterized by high thermal density and constant load, such systems require far more complex environmental integration. While liquid-immersion cooling has demonstrated considerable potential to reduce Power Usage Effectiveness (PUE), especially under high-heat-density conditions [35], its coupling with architectural structure and aquatic environments remains underdeveloped and largely untested in real-world applications.
These trends point to three significant gaps in the current literature and practice:
  • Subsided water bodies have yet to be incorporated into infrastructure deployment logic;
  • Despite their potential, liquid cooling systems lack integrated frameworks with building and environmental systems;
  • Tri-integrated architectural models—spatial, structural, and systemic—have not been quantitatively evaluated for their role in advancing carbon neutrality.
To address these issues, this study proposes a low-carbon submerged architectural solution that embeds data center infrastructure within coal mining subsidence water zones. The system combines adaptive pile foundations, façade-mounted liquid cooling components, and water-body-assisted thermal sinks to eliminate the need for conventional cooling towers. In contrast to previous studies that considered spatial reuse and energy-efficient data center design separately, this work develops and validates an integrated deployment model, in which spatial reuse, structural adaptation, and low-carbon cooling are coupled within a single architectural framework. An operational carbon performance model is applied to evaluate the emission-reduction potential and assess the scalability of the proposed system. The study aims to construct a systemic architectural pathway that simultaneously responds to three interlinked challenges: inefficient spatial use, excessive energy consumption, and the stagnation of decarbonization progress.

2. Methodology

2.1. Site Selection and Regional Context

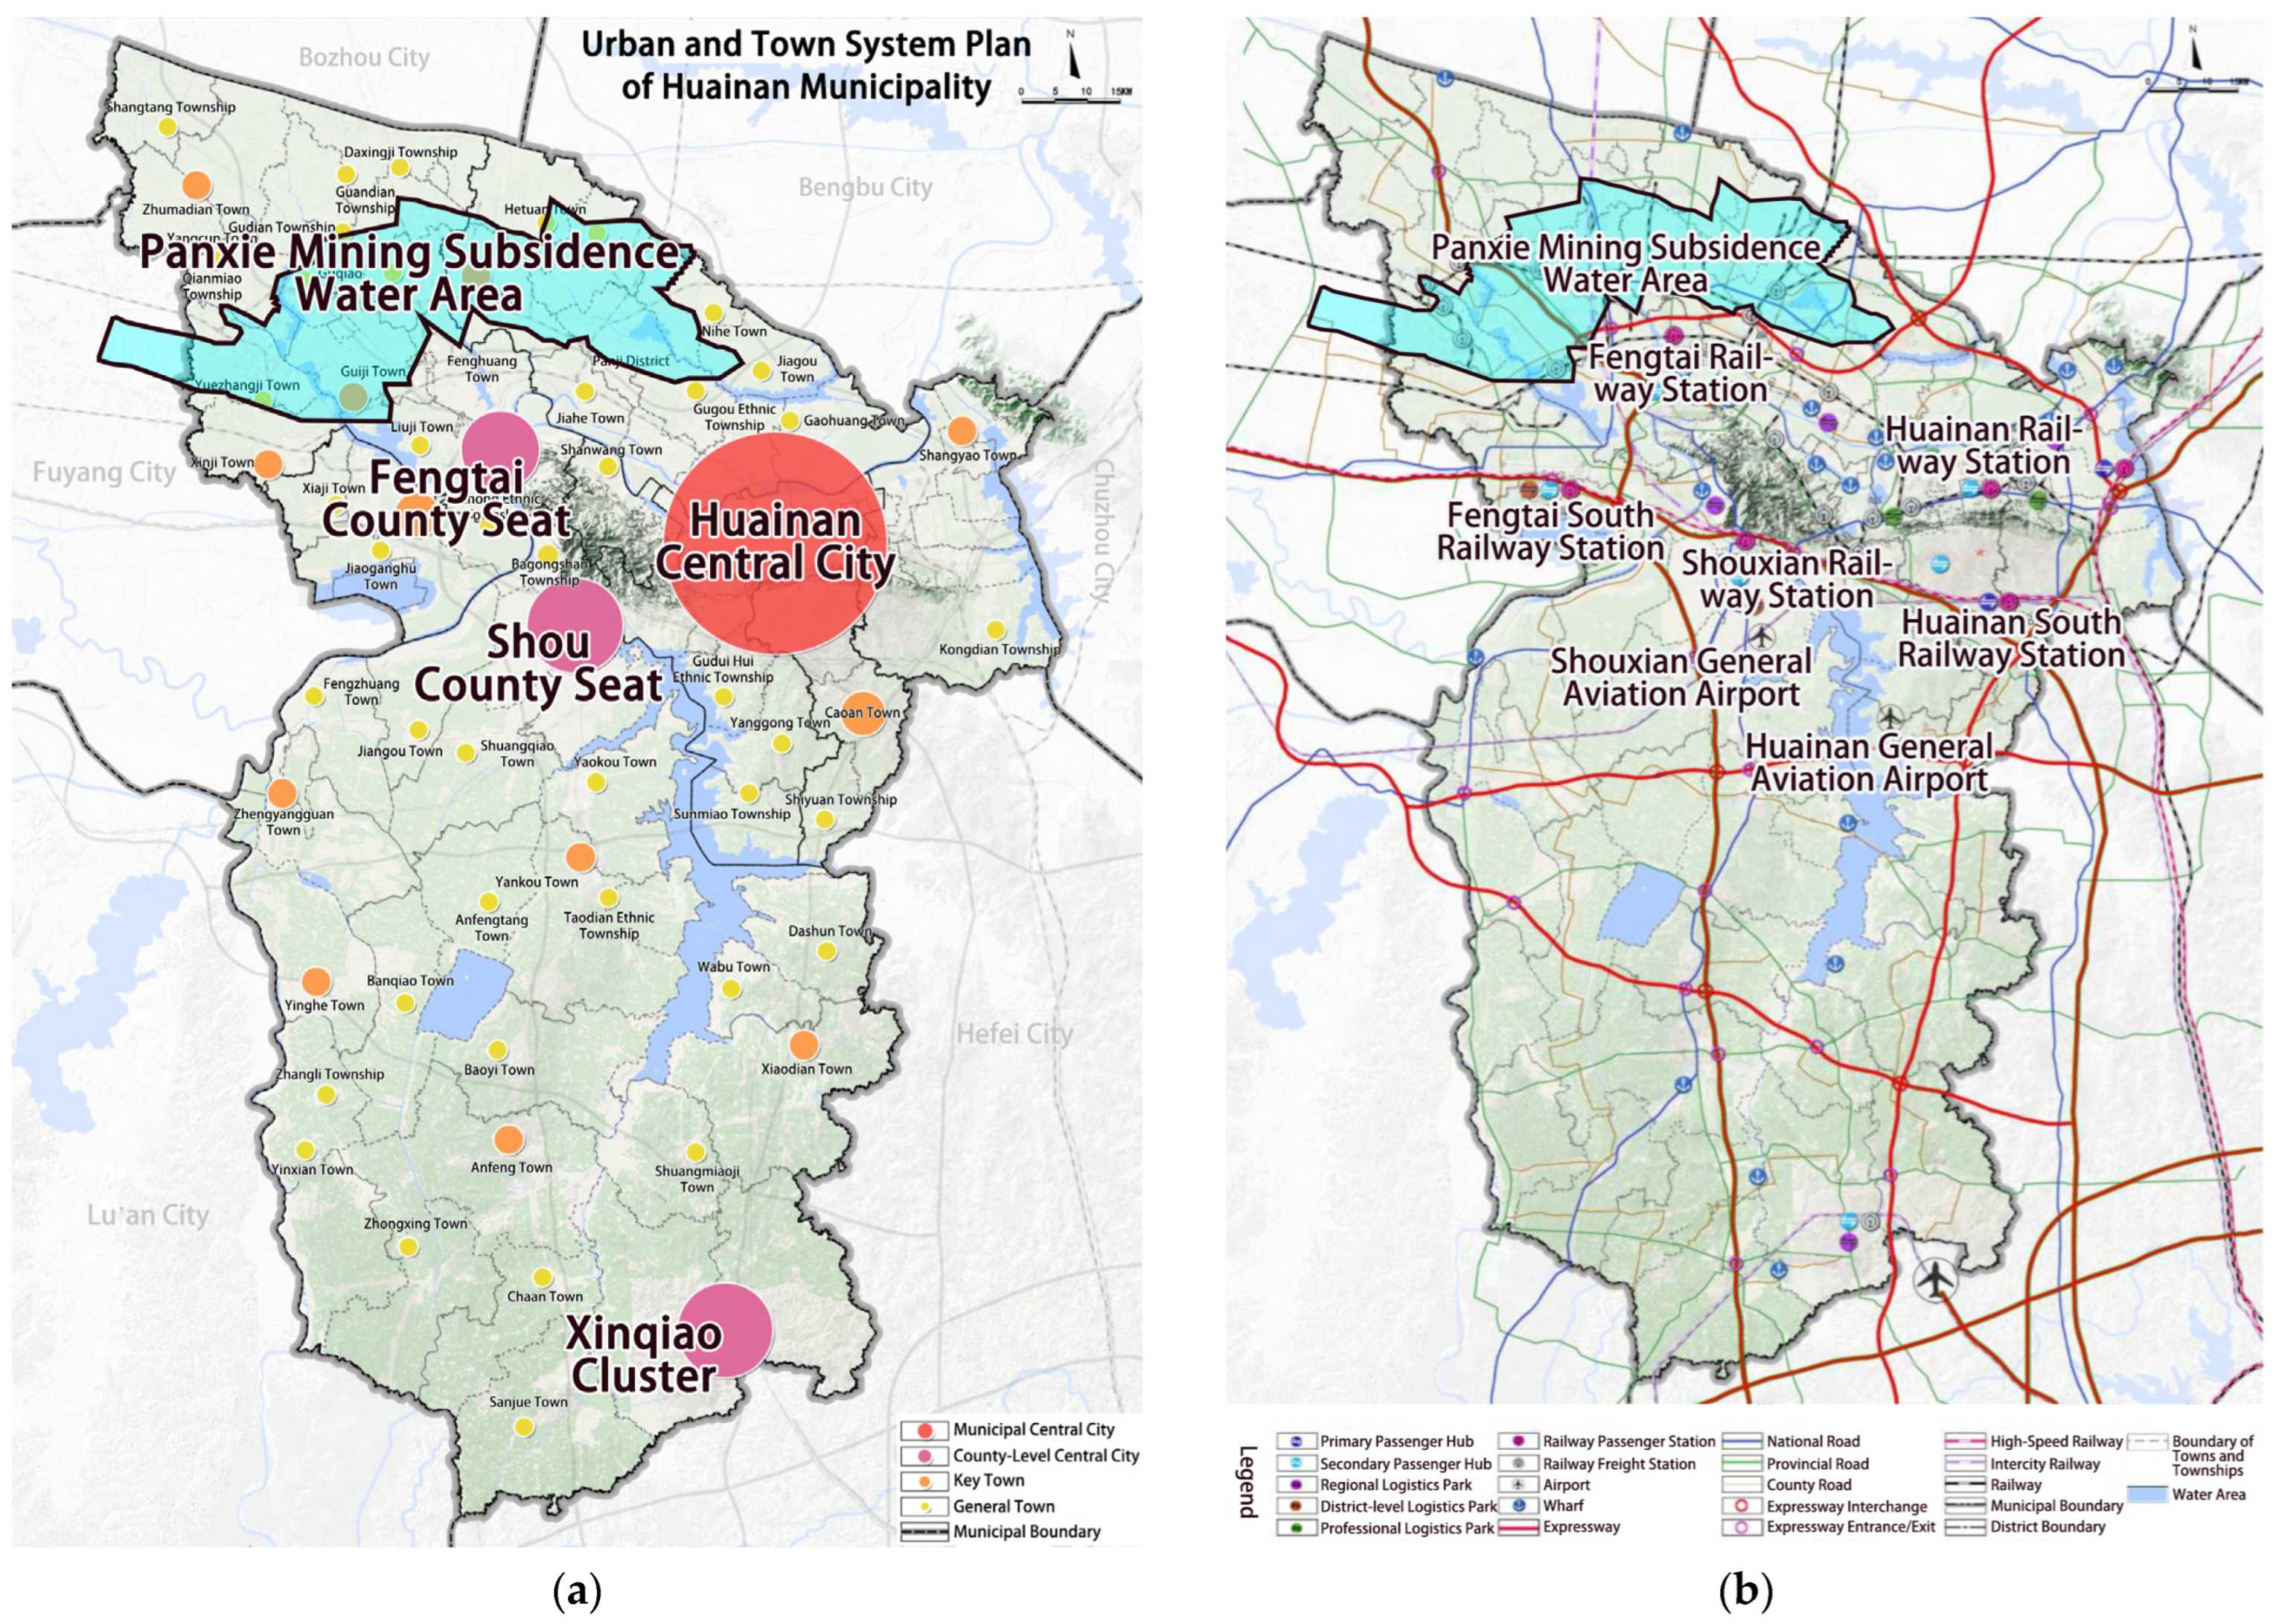
The research site selected for this study is located in the Panxie Mining Area of Huainan, Anhui Province—an area with extensive coal-mining-induced subsidence water bodies (Figure 1). Since the 1960s, the region has undergone large-scale coal extraction, leading to widespread ground settlement and the formation of persistent waterlogged zones. According to regional planning data, the current water-covered subsidence area exceeds 100 km2, accounting for more than 60% of the total subsided land [36]. By 2030, the accumulated water volume is projected to reach 1.35 billion cubic meters [37], and by 2050, the average water depth is expected to surpass 20 m [38]. Following the complete exhaustion of coal resources, land area is anticipated to constitute only 11.9% of the zone, while water bodies may expand to over 597.6 km2 [39].
Although the Panxie region lies within the administrative boundary of Huainan’s urban–rural development plans, its subsided water bodies have remained largely underutilized [40,41] (Figure 2), representing a typical case of “spatial dysfunction.” In recent years, scattered ecological interventions—such as floating wetland islands and shoreline remediation—have been initiated, yet the area still lacks a function-driven infrastructure strategy capable of long-term activation.
This region presents three critical characteristics aligned with the goals of this study:
  • Relatively stable hydrological conditions are suitable for constructing an external thermal sink for cooling systems;
  • Preliminary planning control is already in place, making infrastructural access for data centers technically feasible;
  • The terrain characteristics support a “submerged deployment with shoreline connection” configuration, offering potential for experimental implementation.
These factors collectively provide a favorable environmental basis for the deployment model explored in this research. Accordingly, this study selects a representative subsided water body within the Panxie Mining Area as the prototype site for building-scale analysis of system deployment, structural response, and carbon mitigation performance, aiming to assess the low-carbon potential of submerged data center architecture in post-mining landscapes.

2.2. Building Layout and Structural Strategy

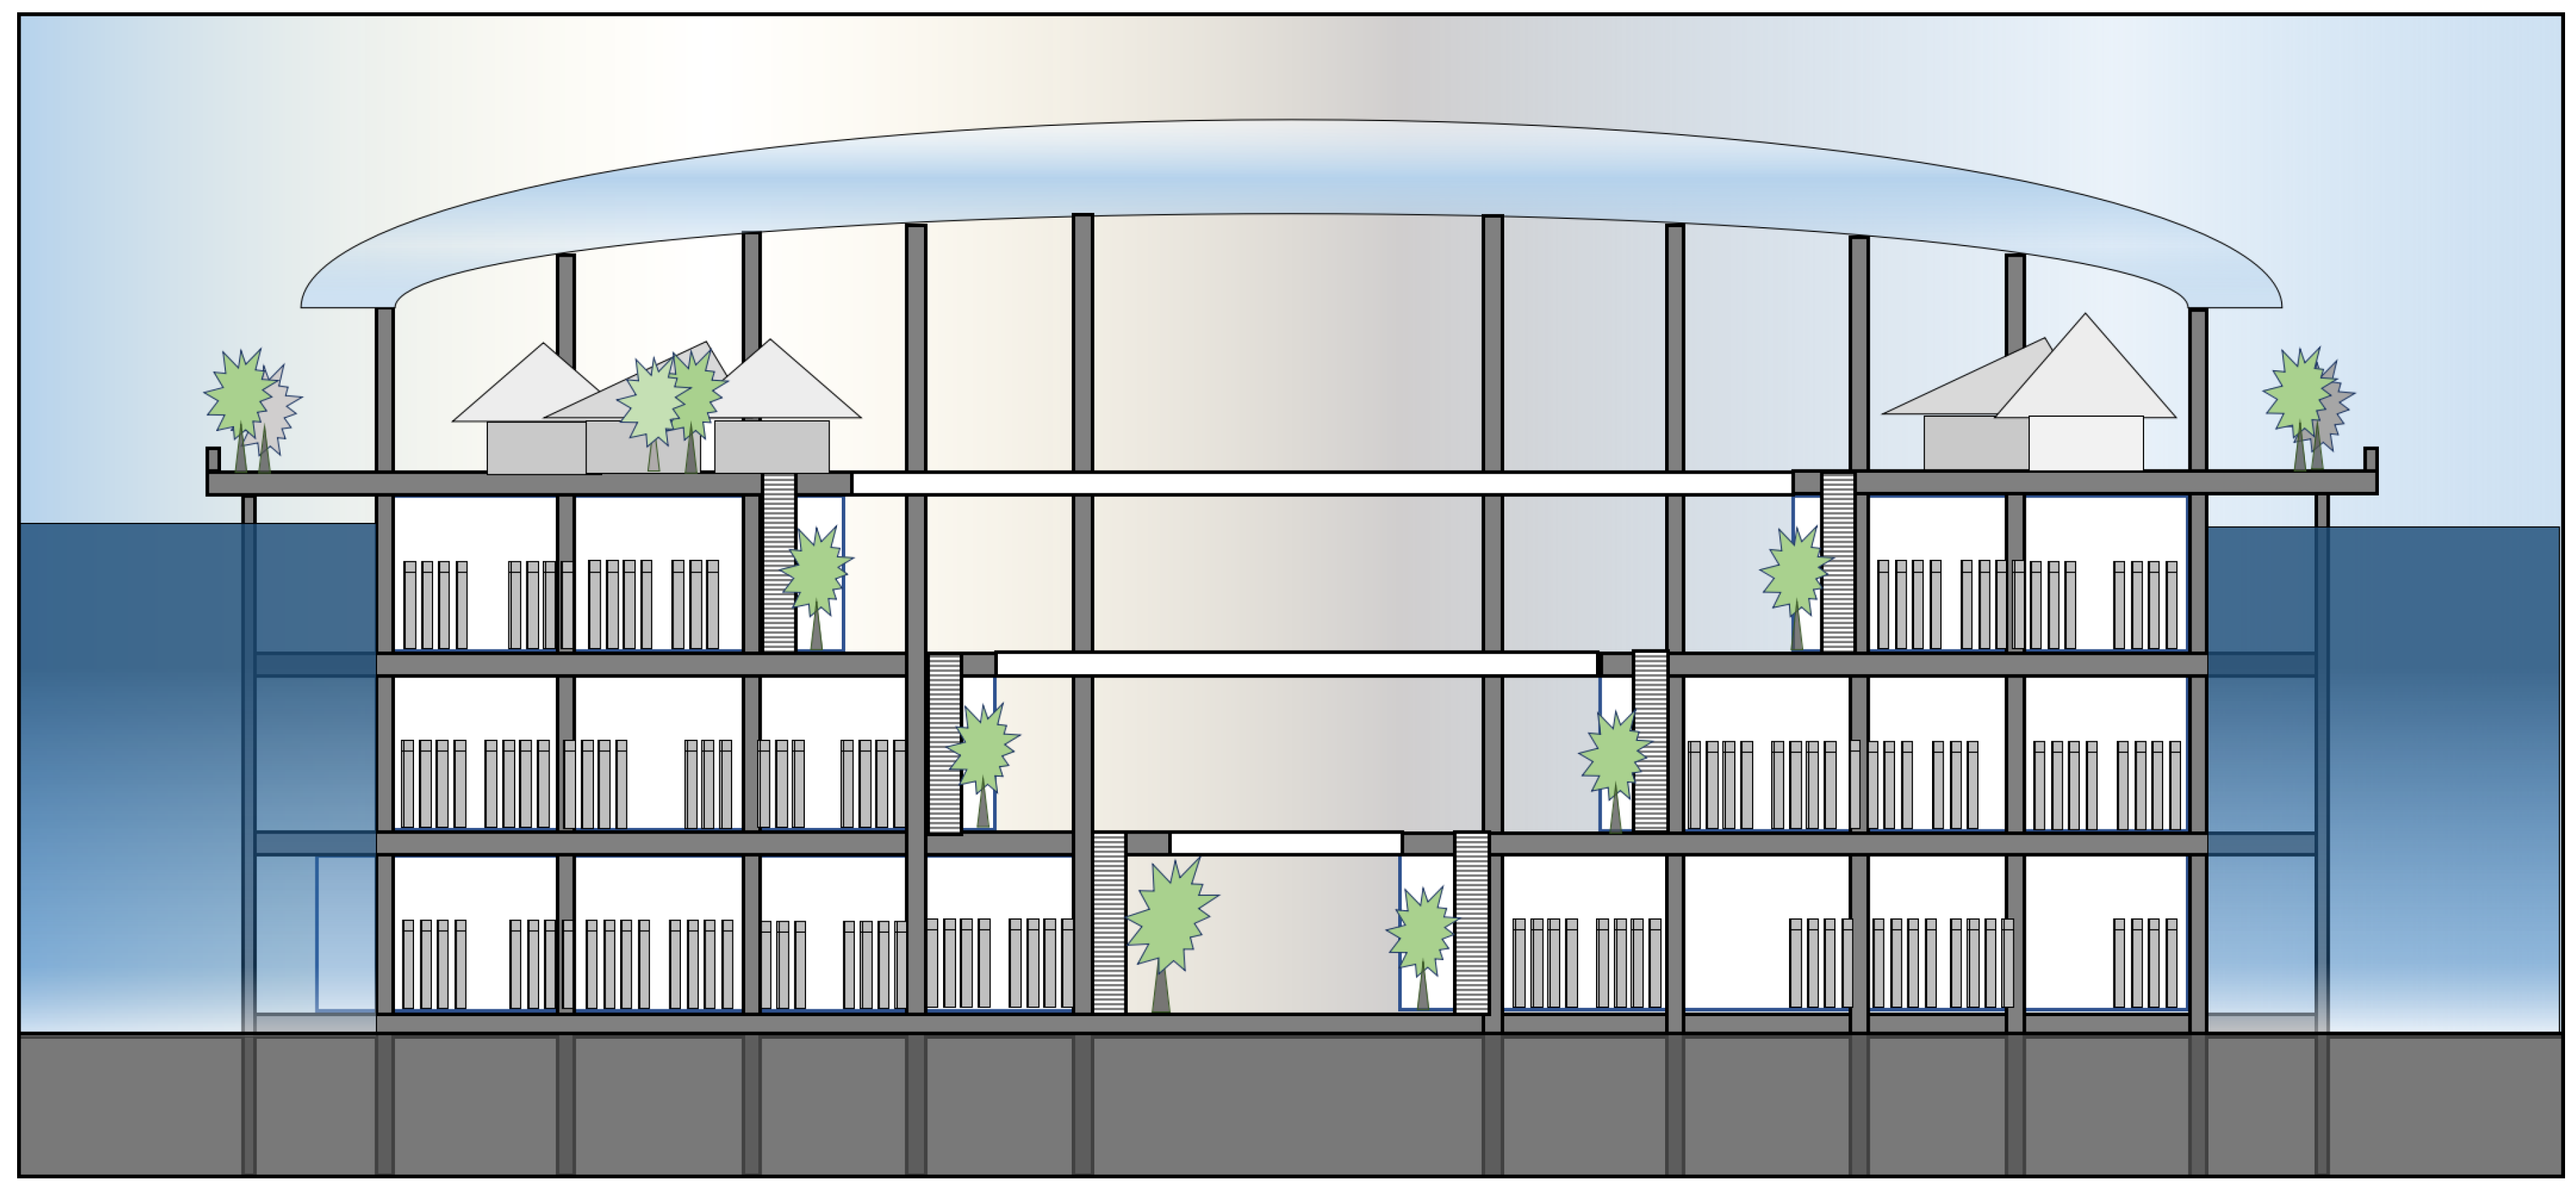
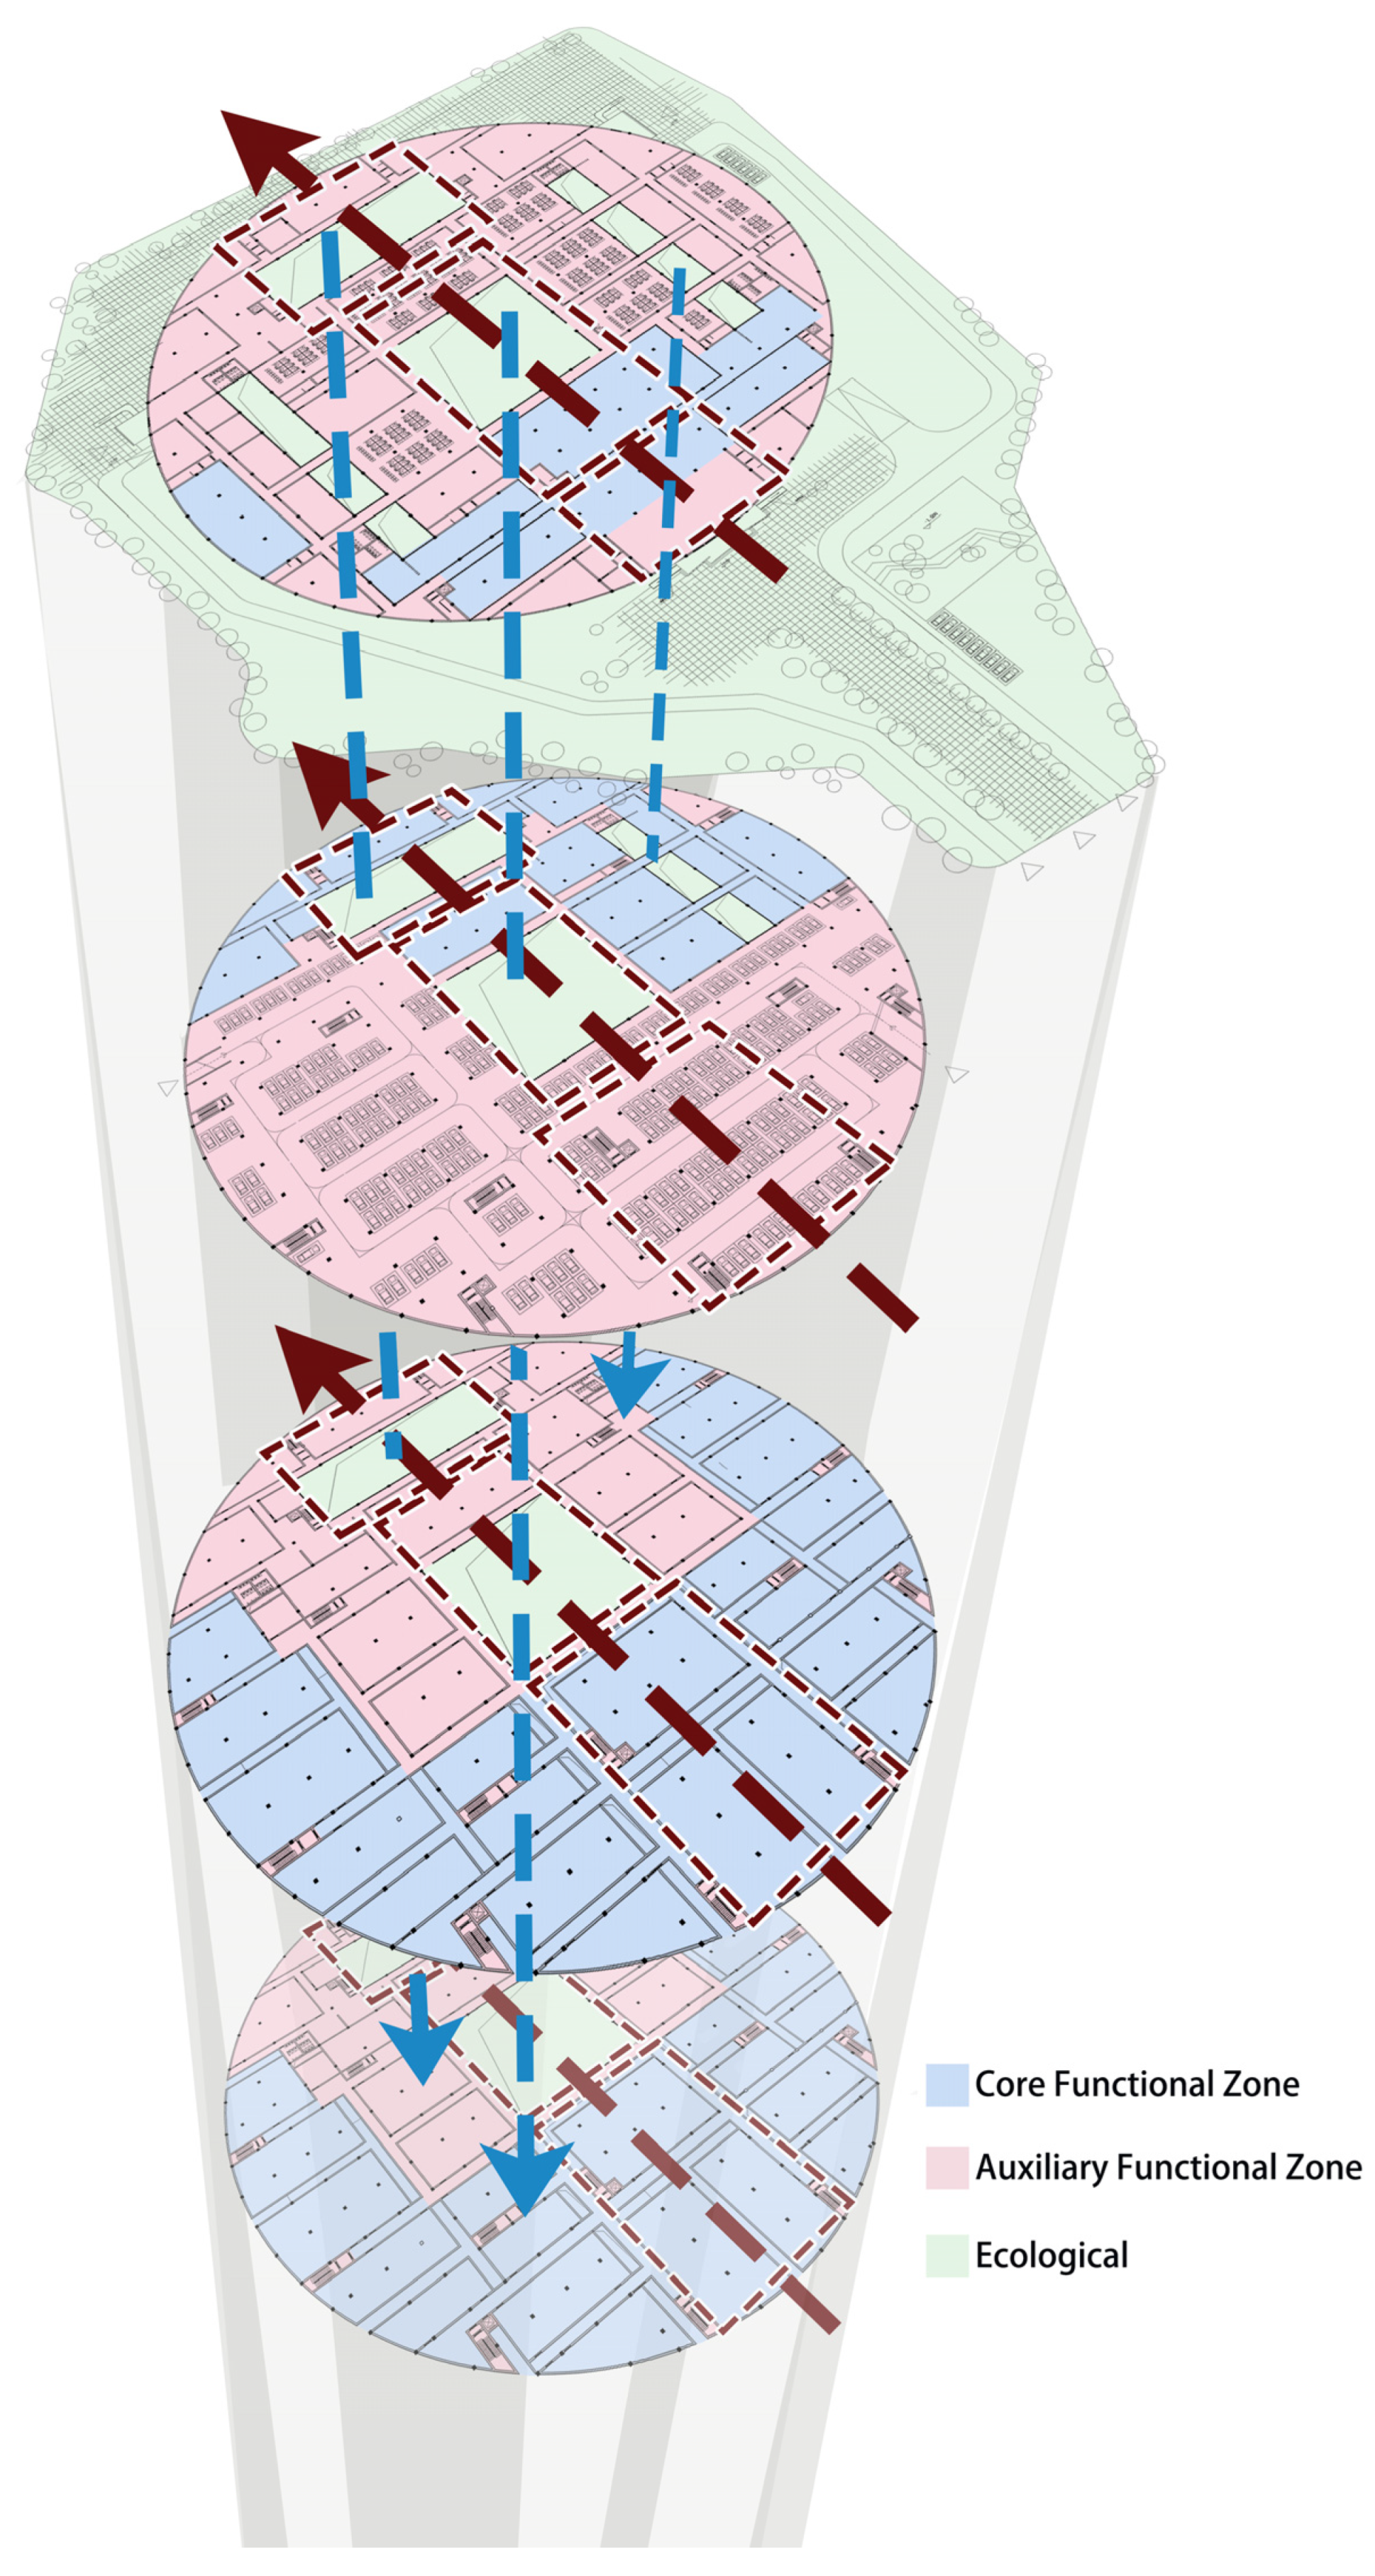
The submerged building is organized in a “shore connection + underwater deployment” mode. The top level remains above water and provides access to power, fiber, and maintenance facilities, while the three lower levels are fully submerged and directly interact with the surrounding water body for heat exchange. The spatial organization follows an “outside–inside” logic: the building envelope is exposed to the water environment, and the interior is organized according to a “cold aisle–hot aisle” layout to optimize heat transfer (Figure 3 and Figure 4).
Based on the position of each server room in the cylindrical cross-section, three typical spatial configurations are identified (Figure 5):
(a)
Two water-exposed sides, with a 1500 mm cold aisle and a 1000 mm hot aisle;
(b)
Two water-exposed sides, with a 1500 mm cold aisle and a 1200 mm hot aisle;
(c)
Three water-exposed sides, with a 1500 mm cold aisle and a 1000 mm hot aisle.
These spatial variations are not design optimizations per se, but passive outcomes determined by the envelope morphology and the location of each server room. While they may inform future refinement of cabinet-level load balancing strategies, in this study, the hot–cold aisle layout is used solely to define the internal organization and to determine the number of cooling units. All server rooms adopt a uniform cabinet load standard in both simulation and operational performance calculations. The submerged building contains 30 server rooms and a total of 720 server racks.
In terms of structural support, the submerged building adopts a reinforced concrete system with rigid frames and slabs, supported by a combination of anchor piles and sleeve piles that transfer loads to stable strata beneath the subsidence basin. To resist buoyant forces, ballast is incorporated into the base structure, and water-filling compartments are used for fine-tuned pressure balancing. A modular cross-sectional design standardizes the geometry of data halls and cooling rooms, facilitating prefabrication and parallel construction across multiple basins with minimal site-specific adjustment. The structural form ensures both mechanical stability and seamless thermal contact with the surrounding water, laying a foundation for scalable application of submerged data centers.
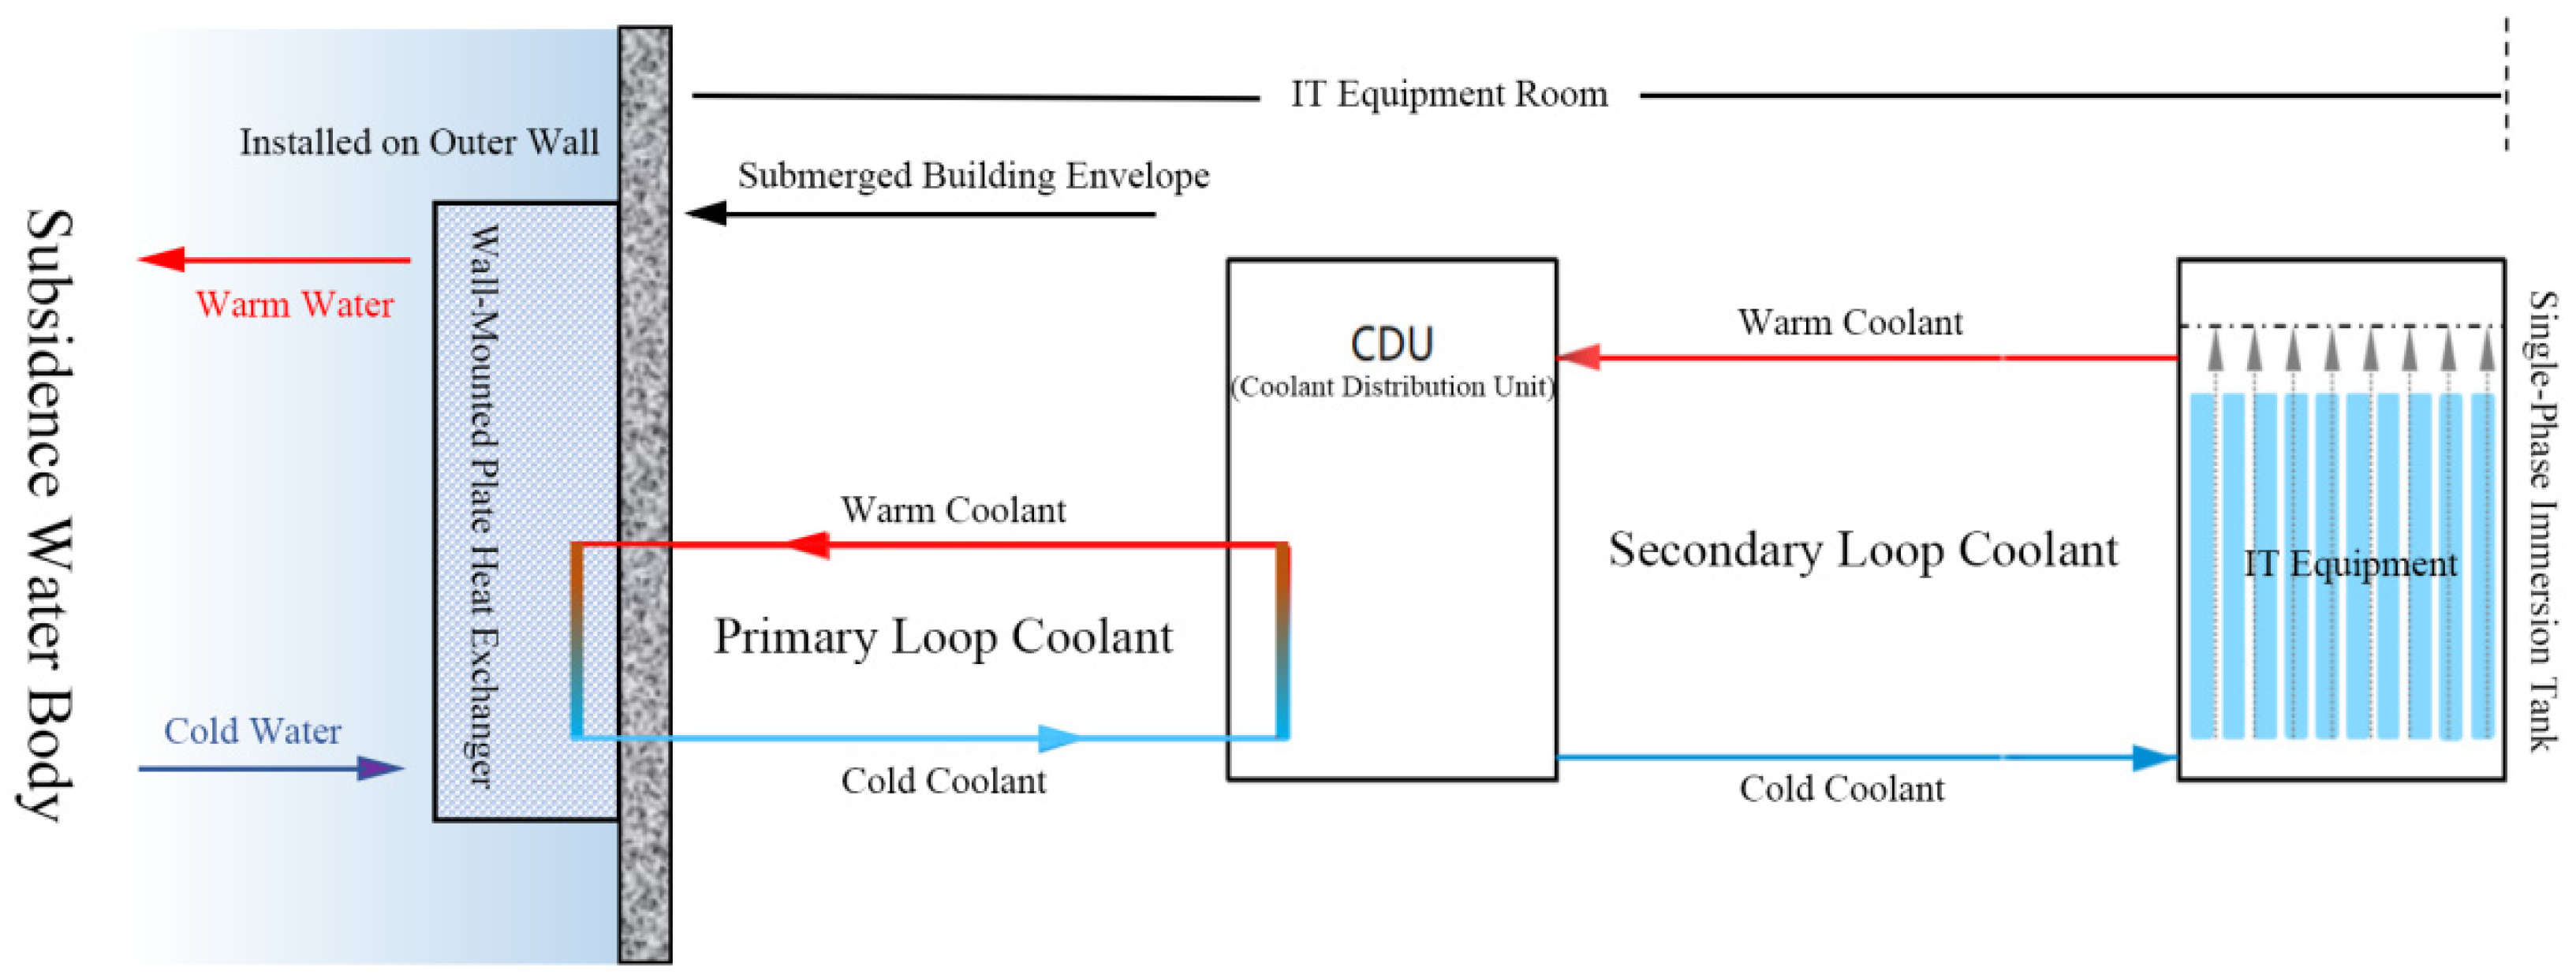
To enable low-carbon operation of high-heat-density systems, the submerged building integrates a liquid-immersion cooling system directly into the architectural envelope. The server racks are immersed in a single-phase coolant (R-1234ze), which transfers heat to coolant distribution units (CDUs) located on each floor. The CDU secondary loop is connected to façade-mounted plate heat exchangers positioned on the water-exposed walls. This arrangement enables direct heat transfer between the cooling water and the surrounding water body through natural convection, replacing the use of conventional cooling towers.
By aligning the location of each CDU with the corresponding façade exchanger positions, the internal cooling loops are shortened and pressure losses reduced. The combination of submerged deployment and façade-based heat rejection creates a continuous thermal path from the IT equipment to the environmental sink, thereby maximizing heat dissipation efficiency and minimizing auxiliary energy consumption.

2.3. Model Framework and Boundary Conditions

This section presents the numerical framework used to evaluate the thermal performance and carbon reduction potential of the submerged data center. The model consists of three coupled heat transfer stages: (i) heat transfer between the IT equipment and the single-phase coolant, (ii) heat exchange in the coolant distribution unit (CDU) between coolant and secondary cooling water, and (iii) heat rejection via façade-mounted plate heat exchangers to the surrounding water body (Figure 6).
The coolant employed in the immersion loop is R-1234ze, which was selected due to its extremely low Global Warming Potential (GWP < 1) and its proven applicability in high-density electronic cooling systems [42]. According to test results reported by the China Refrigeration Society [43], R-1234ze exhibits similar thermophysical properties to the commonly used R-134a, while providing approximately 99.9% lower GWP. The liquid circulation pumps used in this study are based on Xinhu products (consistent with the above tests), ensuring compatibility with the selected refrigerant and industrial practice.
Boundary temperatures for the surrounding water body are derived from long-term monitoring data of the Panxie mining subsidence area, with an annual average water temperature of 15.82 °C and seasonal values ranging from 4.65 °C (winter) to 28.18 °C (summer) [44]. The baseline IT load is set between 55.2 kW and 78.2 kW per rack [45], with a total of 720 racks in the building; simulations assume a uniform load distribution across all server rooms. Material properties of the plate heat exchanger and hydraulic losses of pipework are taken from manufacturer specifications [46].
Life-cycle embodied emissions and sensitivity analysis are excluded from this study due to the limited scope and focus on operational-stage performance. The complete list of model parameters and variable inputs is summarized in Table 1 and Table 2.

2.4. Heat Exchange Model and Simulation Implementation

Based on the spatial configuration described in Section 2.2, a three-stage heat exchange model is established to quantify the thermal performance of the submerged data center. The heat transfer processes include:
(1)
Conductive heat exchange between the IT equipment and the immersion coolant;
(2)
Convective heat exchange within the CDU between the immersion coolant and the secondary cooling water;
(3)
Heat rejection from the cooling water to the surrounding water body via wall-mounted plate heat exchangers.
These processes are expressed through the following equations:
(1)
Server–coolant heat exchange
Q r a c k = m ˙ c l c c l T c l , o u t T c l , i n
(2)
Coolant–CDU heat exchange
Q C D U = U C D U A C D U Δ T l m , C D U
(3)
Cooling water–water body heat exchange
Q e x c h a n g e r = U p l a t e A p l a t e Δ T H E
The above equations are embedded into a parameterized MATLAB (v2021a) framework in order to perform batch calculations for different IT loads and environmental temperatures.
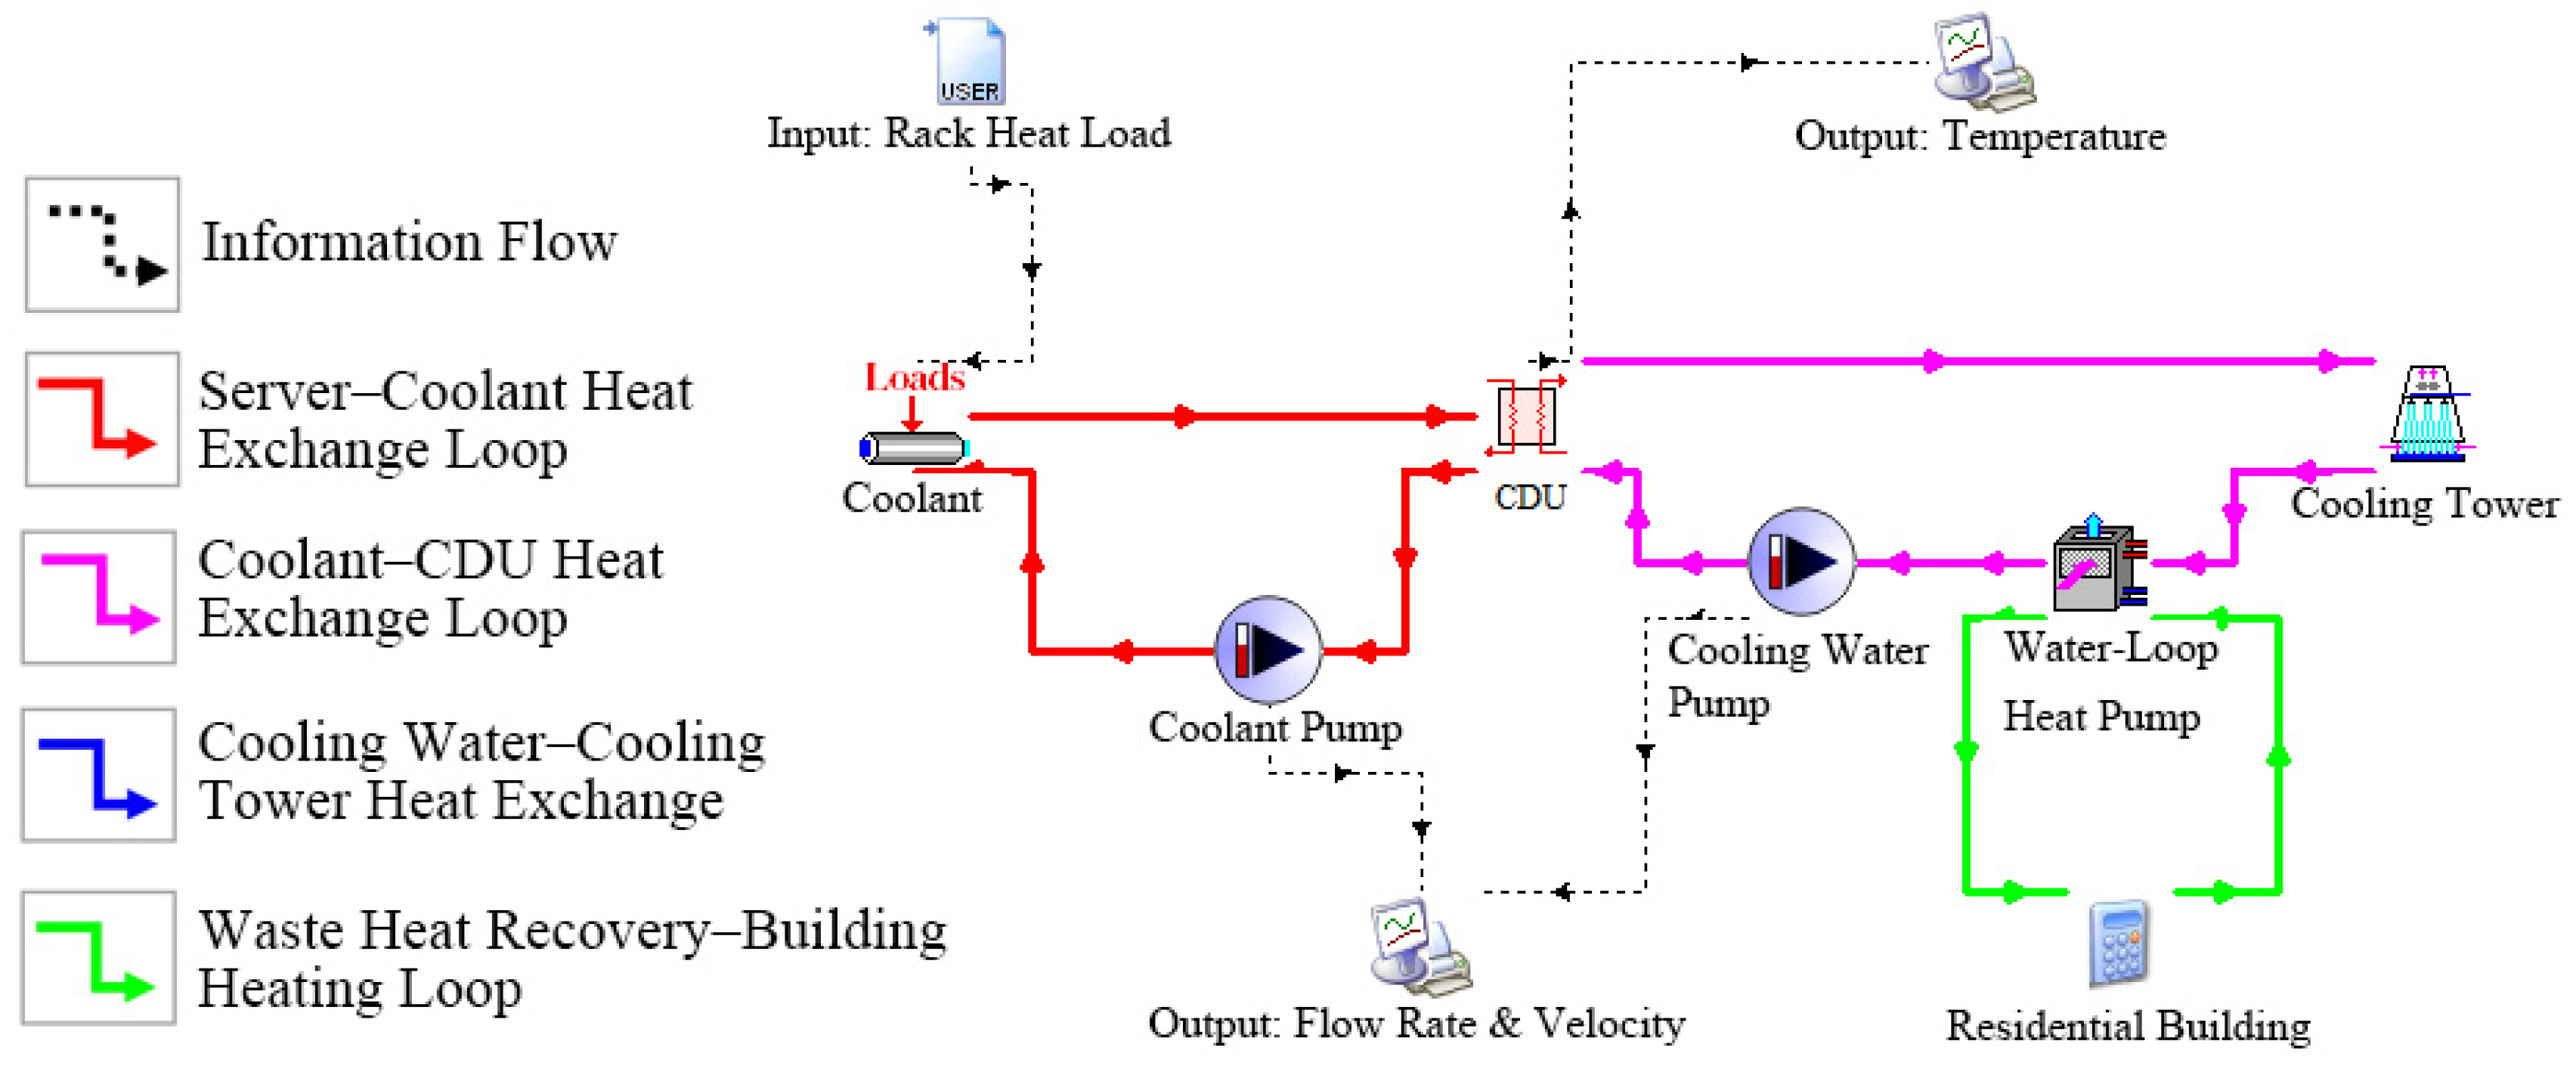
To simulate the same physical processes within a dynamic environment and identify operating performance under multiple running conditions, the model was implemented in TRNSYS (v18). Server loads were imported using Type9e, while the fluid flow control was formulated using Type110. The CDU was modeled using the counter-flow exchanger Type5b, and wall-mounted plate heat exchangers were represented by Type14 calculators with predefined U-A values derived from manufacturer data. Separate winter and summer operating conditions were defined in the control logic to account for seasonal differences in water temperature. The main simulation outputs include cooling energy consumption, temperature variation across each transfer stage, and net heat rejection to the water body (Figure 7).
In the TRNSYS simulation of the conventional cooling-tower-based liquid cooling system, the wall-mounted plate heat exchanger and subsided water body used in the submerged architectural system were replaced with a mechanical cooling tower setup, as illustrated in Figure 8. The selected model is the BAC FXV3-1224-30T closed-circuit cooling tower, with a single-unit heat dissipation capacity of approximately 1.8 MW. Considering the system’s peak cooling load and redundancy requirements, the configuration includes 32 cooling tower units.
Accordingly, the fan power consumption is calculated using an empirical model for variable-speed fan operation, expressed as
P f a n c t = P f a n , t o t c t η l o a d 3
In both the submerged and the conventional cooling tower reference scenarios, cumulative energy consumption and hourly heat rejection values were calculated using the Type24 integrator and exported via Type65C.
The simulation results were preliminarily cross-validated against analytical heat transfer equations and published empirical benchmarks to ensure numerical reliability. A more detailed validation of the TRNSYS model against MATLAB numerical routines is presented in Section 2.5.

2.5. Model Validation (TRNSYS–MATLAB Comparison)

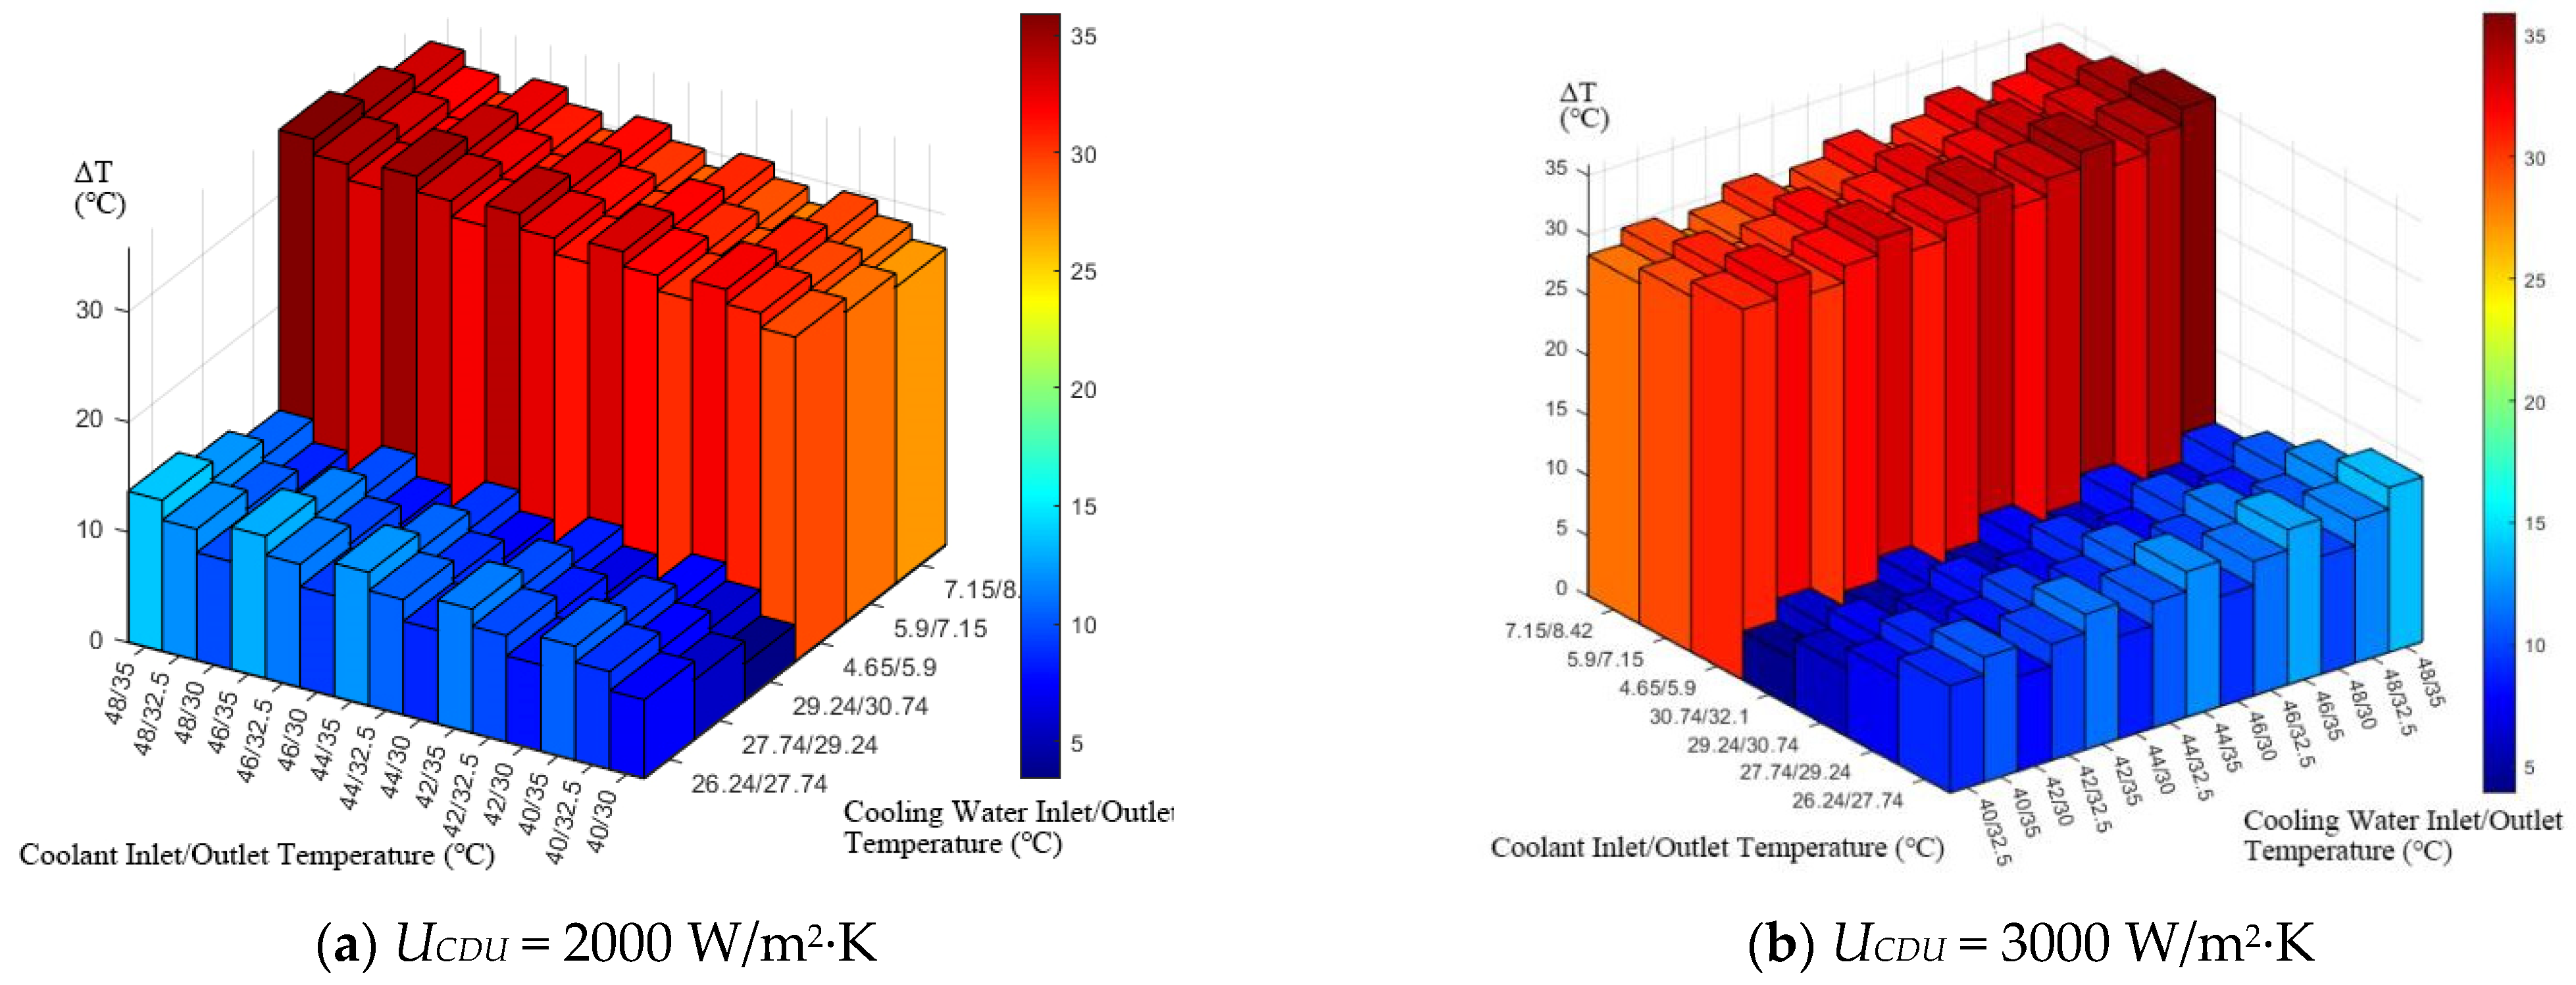
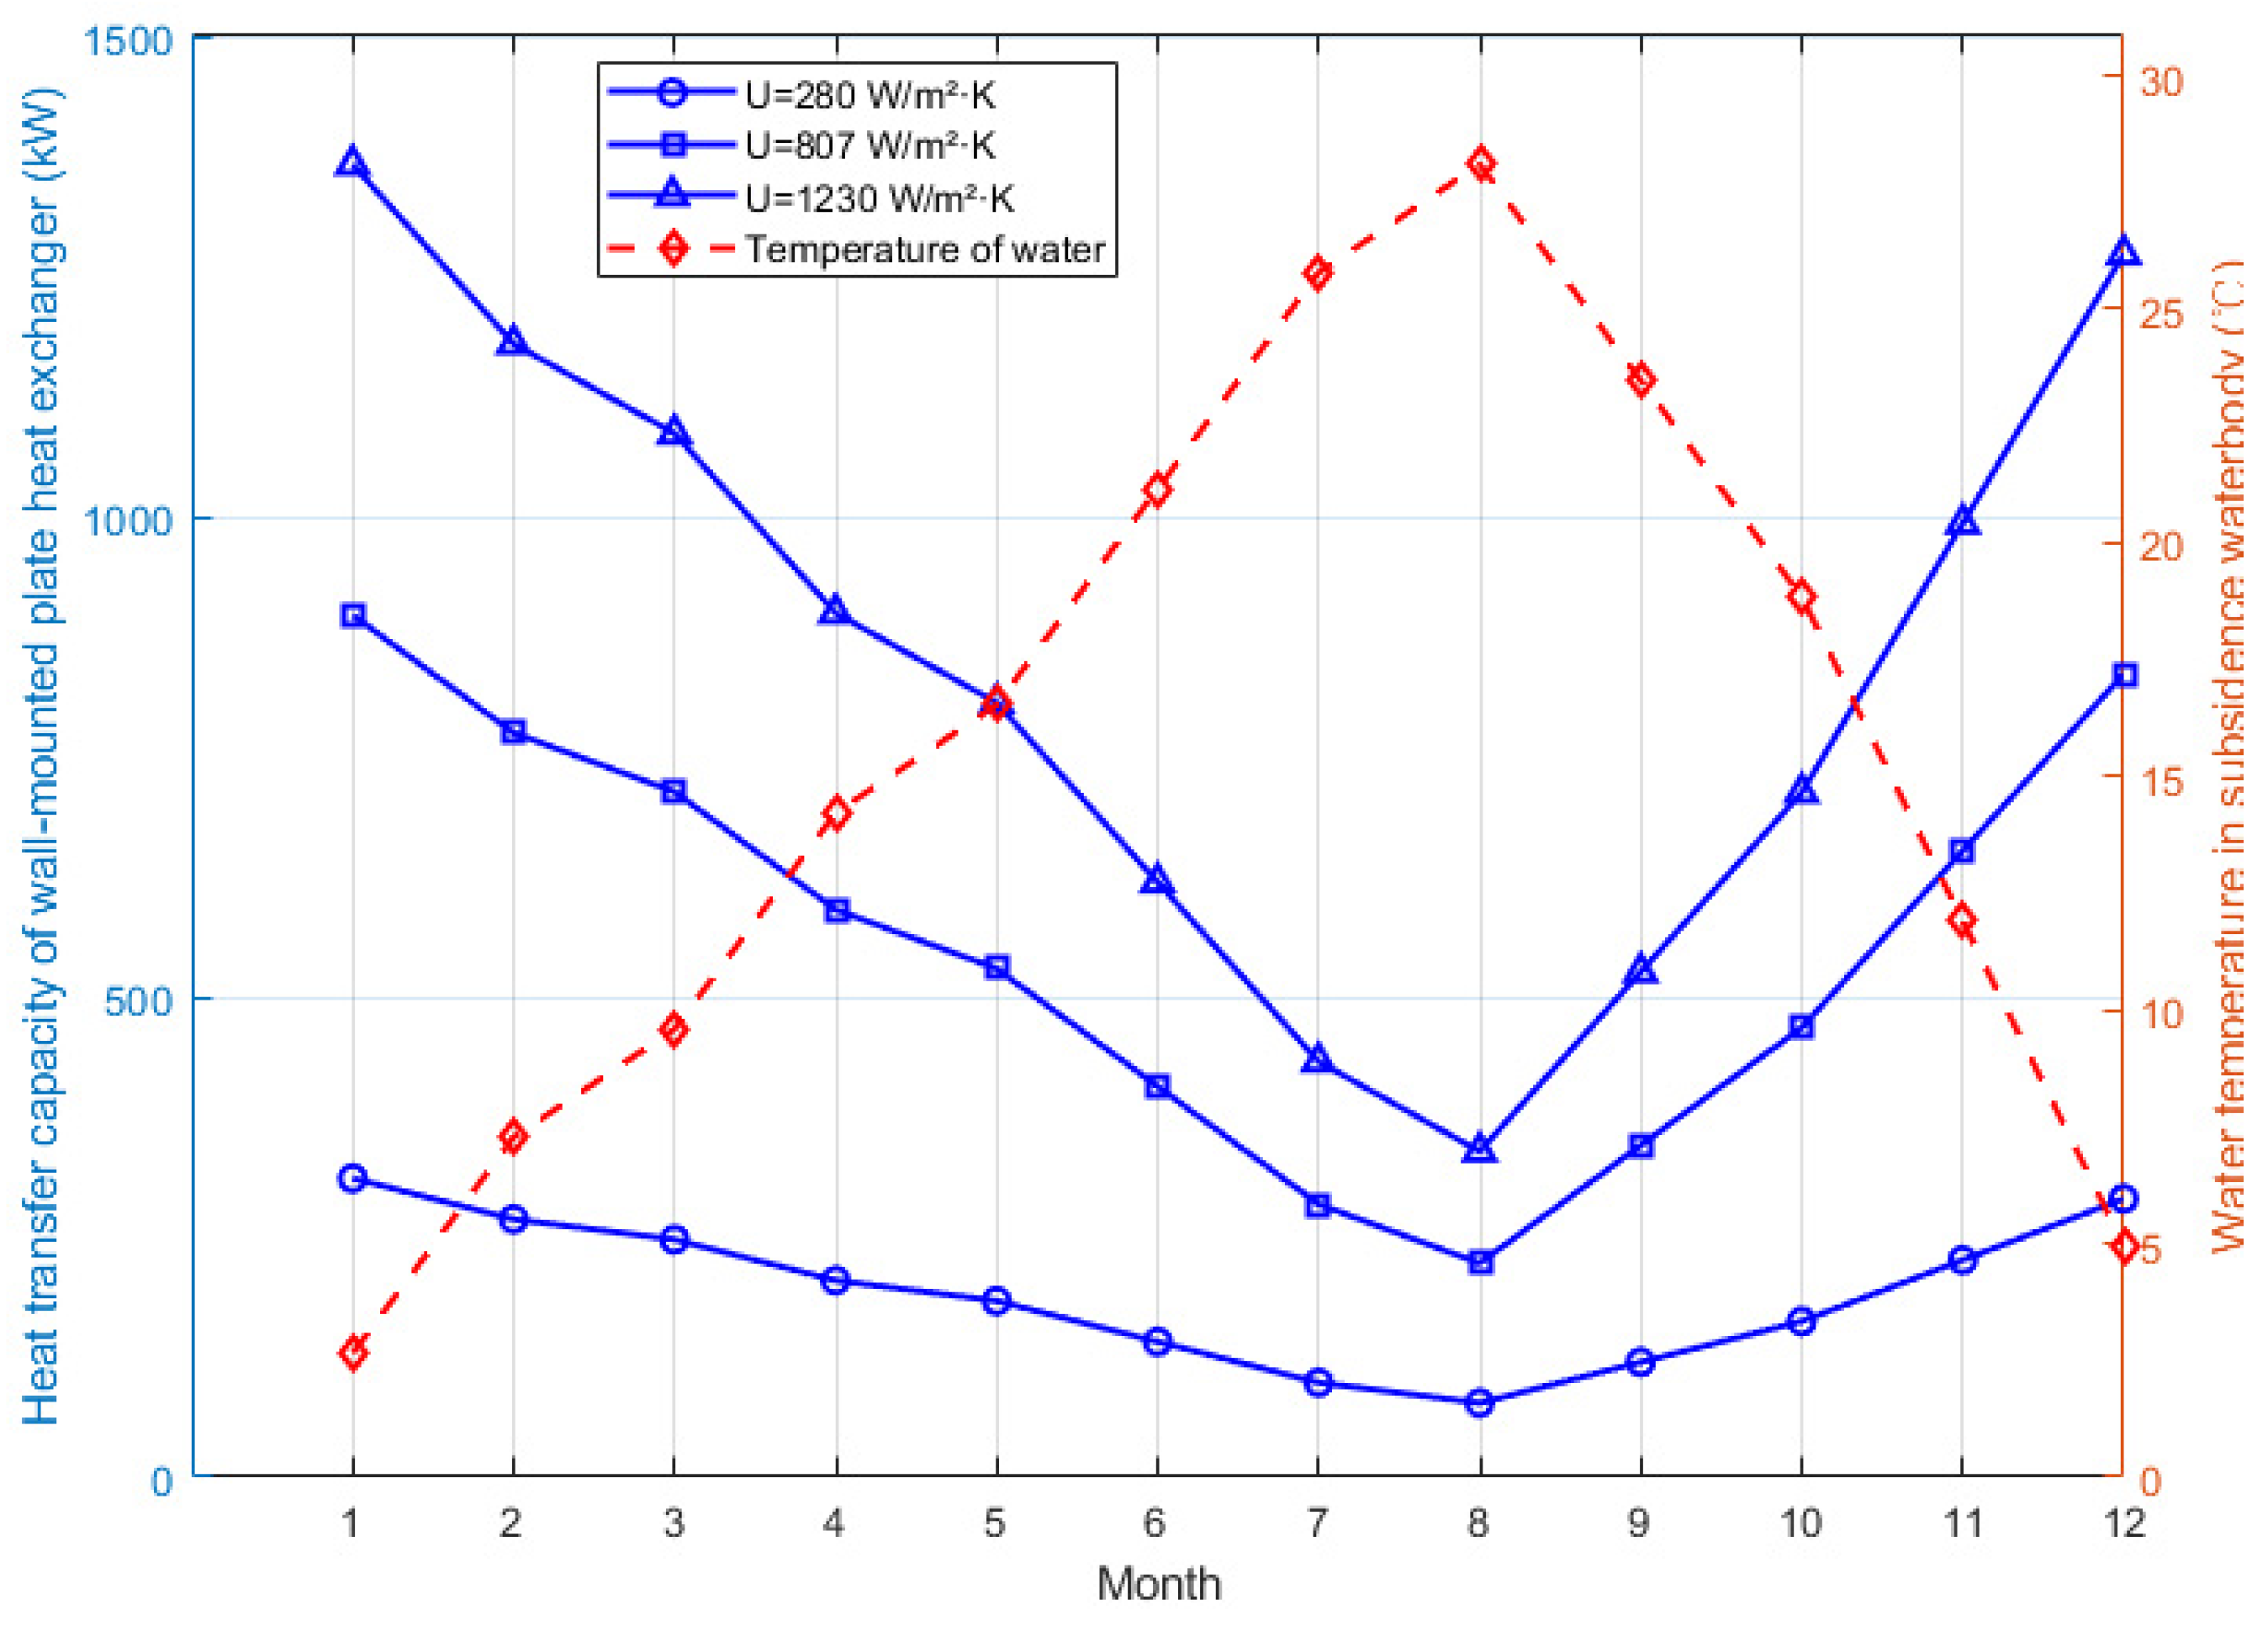
To further verify the robustness of the proposed heat exchange model, outputs from the MATLAB parameterized calculation were systematically compared with those of the TRNSYS simulation under identical boundary conditions. The comparison considered key thermal indicators, including the cooling capacity of each heat transfer stage and the temperature difference across the plate heat exchanger. As presented in Table 3 and Figure 9 and Figure 10, the deviation between the two methods remains below 3% in all operating cases, with a maximum deviation of 4.5%. These results provide quantitative evidence of the model’s thermal accuracy and confirm its suitability for large-scale batch calculations in the subsequent energy and carbon evaluation.

3. Results and Analysis

3.1. Cooling Energy Consumption and PUE Analysis

To assess the operational energy performance of the submerged architectural configuration adopting a single-phase immersion cooling system, this study performed energy consumption calculations under various annual operating conditions based on the established thermal exchange model and parameter settings. The results were compared with those of a conventional cooling-tower-based single-phase immersion system deployed in a data center of equivalent scale.
Under typical IT load conditions (rack-level power density of 55.2–78.2 kW, overall floor power density maintained below 3000 W/m2), the two cooling systems demonstrated the following energy consumption ranges:
  • Submerged-architecture-based liquid cooling system: 88.2 to 2644.0 kW (Figure 11);
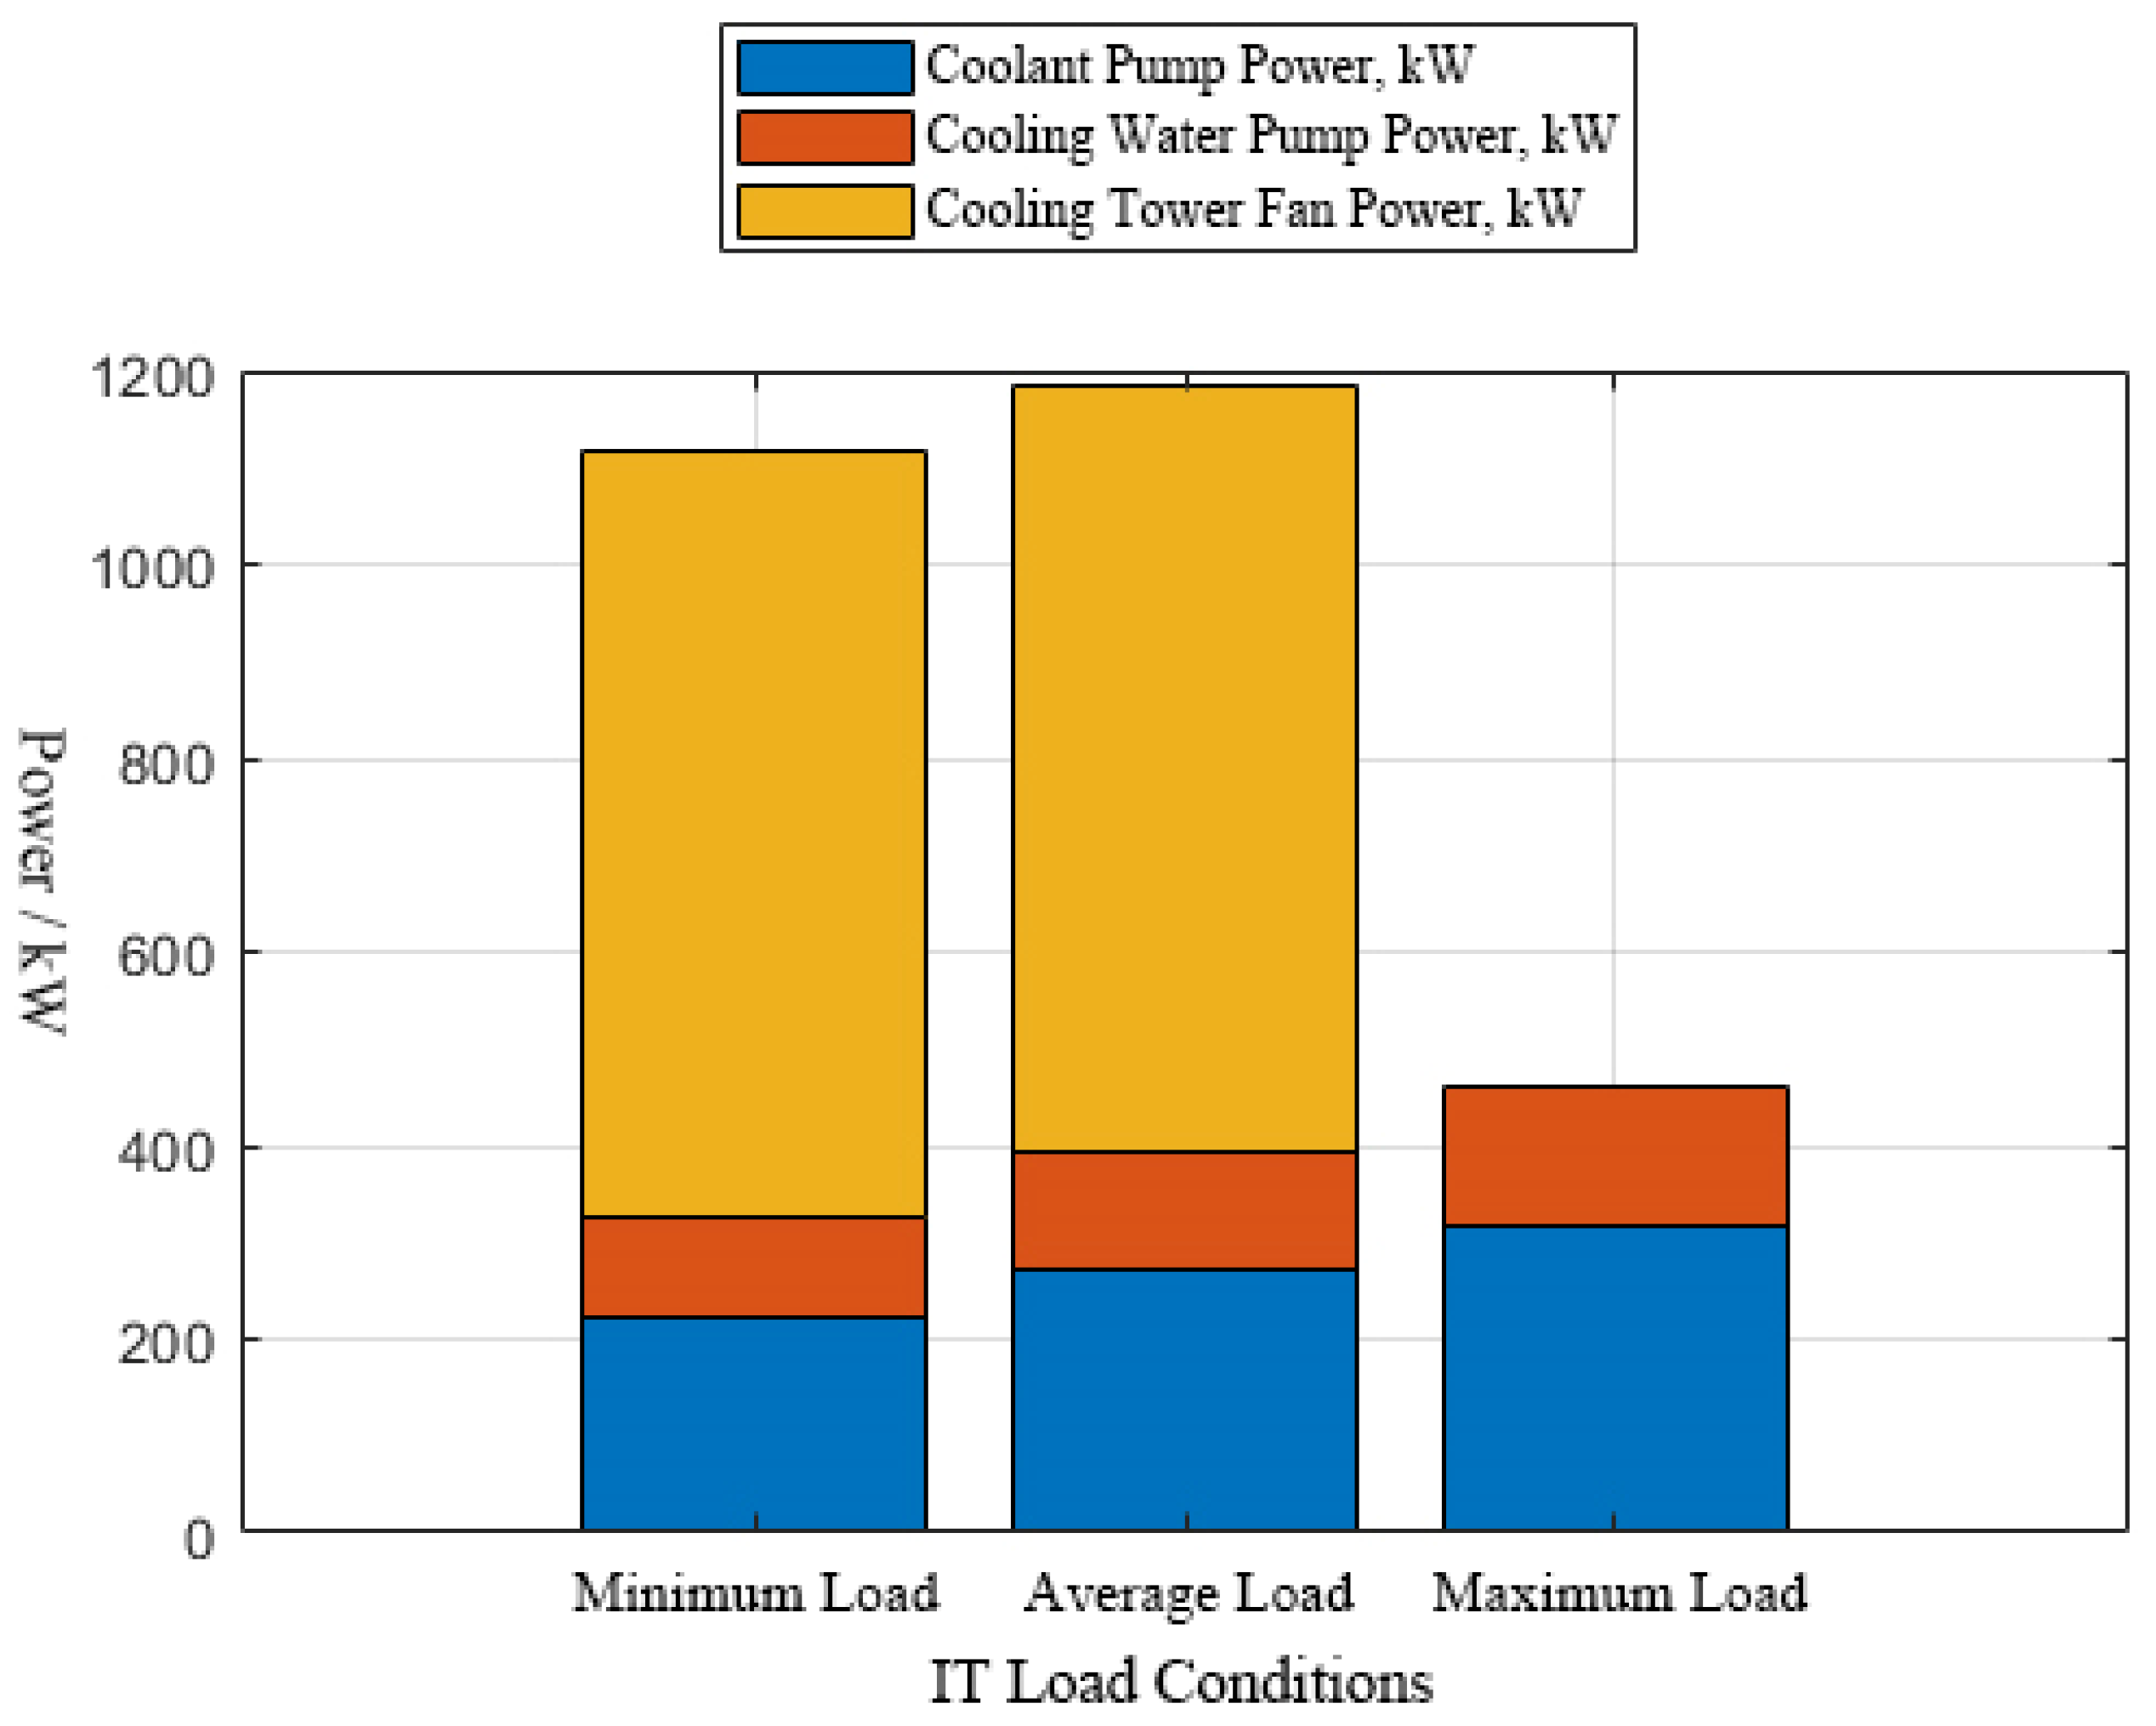
  • Conventional cooling-tower-based liquid cooling system: 1114.7 to 3338.7 kW (Figure 12).
These results indicate that, across the full range of annual operating conditions, the submerged system reduces cooling energy consumption by approximately 20.8% to 92.1% relative to the conventional scheme.
When focusing on typical operational intervals (excluding extreme winter and summer loads), the submerged system’s cooling energy is primarily concentrated between 142 and 1200 kW, compared to 247 and 1870 kW for the conventional system. Under these representative conditions, the energy savings range from 42.5% to 64.3%, demonstrating a substantial energy efficiency advantage.
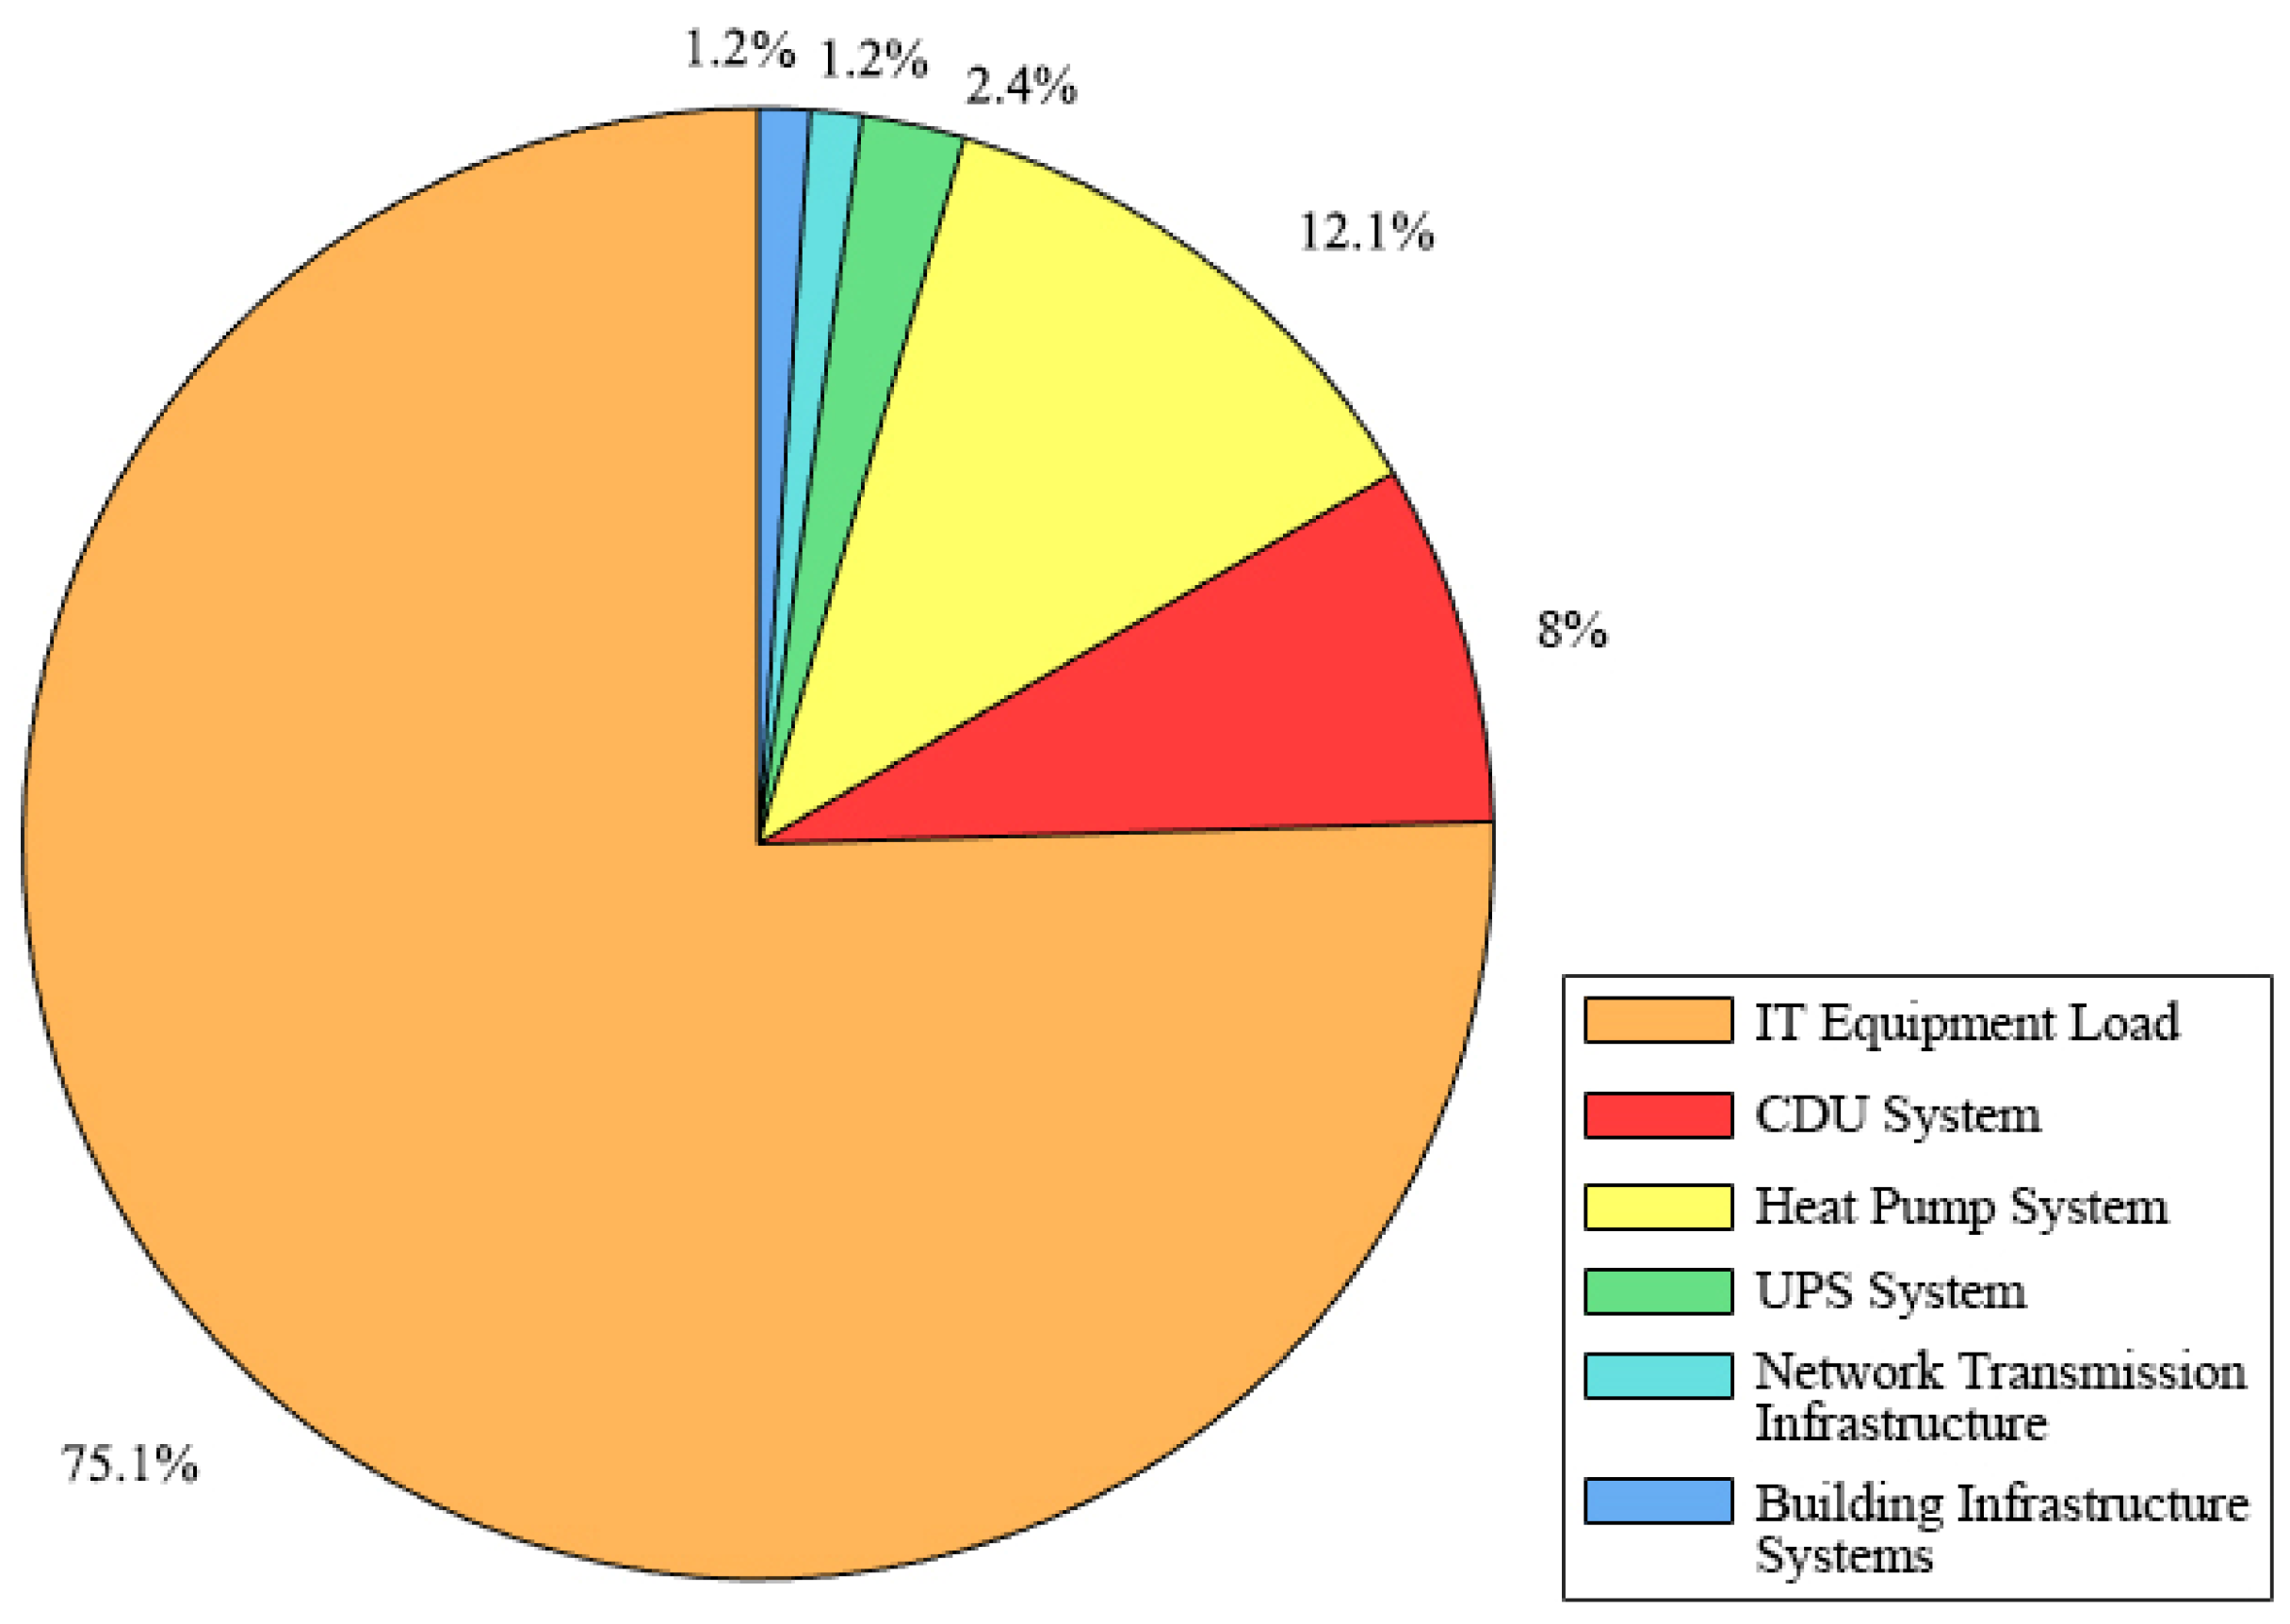
To further evaluate the overall energy performance, the total annual power consumption was estimated by incorporating IT equipment load and other non-cooling subsystems. The breakdown is as follows (Figure 13):
  • IT equipment consumption: Estimated based on a median rack-level load of 65 kW;
  • Non-cooling system consumption: Including UPS, power conversion, networking, and facility operation loads, estimated at 3%, 1.5%, and 1.5% of the IT load, respectively;
  • PUE (Power Usage Effectiveness): Calculated as the ratio of total energy consumption to IT energy consumption.
Comprehensive calculations reveal that the submerged architecture system achieves an annual average PUE of 1.06–1.15, which is significantly lower than that of the conventional system (1.10–1.20). The variation in PUE is primarily influenced by seasonal environmental temperature fluctuations and the corresponding changes in cooling system power demand (Figure 14).
These findings indicate that, given equivalent IT loads, the submerged architecture eliminates the need for energy-intensive cooling towers and dry coolers, while leveraging the surrounding water body as a natural low-grade heat sink. This enables a substantial reduction in cooling energy requirements and contributes to a lower total annual energy footprint.
Note that the reported PUE values include all auxiliary loads such as pumps and CDU operation and therefore represent the overall operational efficiency of the cooling system. For reference, recent industry surveys indicate that the PUE of newly built data centers is typically below 1.5. The proposed submerged system therefore performs noticeably better than this common benchmark.

3.2. Assessment of Energy Savings and Carbon Emissions

To evaluate the carbon reduction potential of the submerged architectural liquid cooling system, this section compares the estimated annual electricity consumption and carbon emissions between the submerged system and a conventional cooling-tower-based liquid cooling system.
Based on the cooling energy consumption ranges established in Section 3.1, the estimated annual electricity usage for both systems is shown in Table 4.
Using the regional carbon emission factor for the Anhui power grid (0.6782 kg CO2/kWh), the corresponding annual carbon emissions are as follows:
  • Submerged system: 16,682–41,706 t CO2.
  • Conventional system: 33,450–66,901 t CO2.
In optimal operational scenarios, the submerged system achieves up to a 50.1% reduction in carbon emissions compared to the conventional system. Within typical operating conditions, the carbon reduction ranges from 37.7% to 75.1%, demonstrating consistent low-carbon performance across varying loads and seasonal conditions.
Furthermore, when extended to the entire building system—including IT equipment and auxiliary infrastructure—the unit carbon intensity per IT load (t CO2/kWh) remains consistently lower for the submerged system. This confirms its superior suitability for deployment under China’s “dual-carbon” objectives.
Overall, utilizing a natural water body as a passive thermal sink not only enhances energy efficiency (see Section 3.1) but also enables a substantial reduction in life-cycle carbon emissions, without compromising cooling reliability or heat exchange effectiveness.
In addition, a sensitivity analysis was conducted under three representative scenarios (low water temperature + high IT load, high water temperature + low IT load, and baseline condition), as presented in Table 5. The results show that even in the least favorable condition (25 °C water temperature and 40% IT load), the carbon reduction rate remains above 45%, confirming the robustness of the proposed solution.

4. Discussion

4.1. Practical Implications of Energy Efficiency and Carbon Reduction

This study demonstrates the multi-dimensional advantages of submersible-building-based liquid cooling systems in terms of operational energy consumption and carbon emissions. Compared with traditional cooling tower systems, the proposed solution achieves a 42.5–64.3% reduction in cooling energy consumption under typical operating conditions and maintains a PUE value between 1.06 and 1.15, significantly outperforming the industry average. The system yields an estimated annual carbon reduction potential of 16,768–25,195 tons, highlighting its engineering adaptability and substantial decarbonization benefits under China’s dual-carbon policy framework.
These results not only optimize the energy use structure and mitigate emissions in high-energy-load industries but also verify the viability of substituting energy-intensive cooling infrastructure with passive water-based heat sinks. Particularly in central China, where natural water resources are available but underutilized due to regulatory or technical constraints, this approach holds replicable value. Even under less favorable boundary conditions—such as high water temperature or low IT loads—the carbon-reduction potential remains above 45%, which demonstrates the robustness of the proposed solution and its suitability for diverse hydrological environments.

4.2. Redevelopment Potential in Coal Mining Subsidence Regions

Deploying this architectural system can offer a strategic engineering path for the reuse and industrial restructuring of typical coal mining subsidence zones. In the case of the Pansan–Xieqiao mining area in Huainan, for instance, the submersible data center—characterized by high density, sealed operation, and intelligent control—has the potential to unlock multiple functional values:
  • Spatial compatibility: Subaqueous deployment leverages large-scale idle water surfaces. Where necessary, underwater excavation may reduce the influence of unstable strata on the structure’s performance.
  • Structural reusability: The combination of pile foundation and grouting techniques accommodates soft ground conditions and allows later transformation into modular or floating platforms.
  • Industrial continuity: As a future-oriented digital infrastructure node (e.g., edge computing, AI training centers, or government cloud hubs), the data center can anchor long-term industrial functions in the area.
Moreover, such deployment is likely to catalyze improvements in shoreline access, power supply, and data connectivity, enabling a “point-to-line-to-zone” spatial transformation logic. Compared with tourism-driven light-service redevelopments, this low-carbon migration of energy-intensive infrastructure aligns more effectively with emerging industrial planning logics under carbon neutrality imperatives.
In summary, the submersible data center model not only addresses energy and carbon challenges but also facilitates an inward-driven spatial, ecological, and economic co-evolution in previously marginalized post-mining landscapes.

4.3. Technical Replicability and Applicability Boundaries

The proposed cooling architecture exhibits strong engineering scalability due to its combination of modular pile-supported structure, façade-mounted heat exchangers, and liquid-immersion cooling. For inland subsidence lakes or other water bodies with stable hydrological conditions, the system can be directly deployed with only minor spatial adaptation, and the thermal performance shows a relatively low sensitivity to regional variations in water flow velocity.
However, the effectiveness of the system still depends on a number of environmental boundary conditions. When the annual mean water temperature is below 5 °C or seasonal temperature fluctuations become extreme (e.g., under climate warming or prolonged summer heatwaves), a hybrid cooling mode or seasonal bypass may be required to maintain the optimum temperature lift. In areas with limited shoreline accessibility or insufficient grid connection, basic mitigation strategies—such as micro-grid integration, prefabricated shoreline access platforms, or partial integration with floating structures—could be adopted to improve deployment feasibility.
For colder climates or tidal water bodies, additional adaptation strategies (e.g., antifreeze operational modes or structural reinforcement against hydrodynamic forces) may be required, and the transferability of the system to such environments will be explored in future research.

4.4. Research Limitations and Future Work

Several limitations of this study should be noted. First, the evaluation of carbon performance focuses exclusively on the operational phase. Embodied emissions related to foundation works and building materials were not included in the current scope, and a full life-cycle assessment (including construction and end-of-life stages) will be carried out in a subsequent phase. It is worth noting qualitatively that submerged configurations may incur higher embodied carbon levels during construction due to underwater foundation and sealing requirements, while potentially reducing the need for large-scale above-ground cooling infrastructure compared with conventional systems. Such differences may influence the overall carbon balance and will be carefully assessed in future work. Second, the model validation was conducted through numerical comparison only. Pilot-scale testing and in situ monitoring will be required in future studies to further verify the thermal performance and long-term structural reliability under real operating conditions. Third, this study did not analyze the potential ecological impacts caused by continuous heat rejection into the surrounding water body. Future work should include an assessment of potential thermal disturbance in aquatic environments in order to develop appropriate mitigation and control strategies.

5. Conclusions

This study proposes a submerged architectural system that integrates a single-phase immersion liquid cooling mechanism within a typical coal mining subsidence water body. It aims to address three interrelated challenges: the underutilization of post-mining water spaces, the high carbon footprint of data center infrastructure, and the implementation bottlenecks in achieving national dual-carbon goals. By incorporating plate heat exchangers into the building’s façade and utilizing the natural flow of subsidence water as a low-grade heat sink, the system achieves low-carbon and high-efficiency cooling without relying on high-energy components such as cooling towers.
The main conclusions are as follows:
  • Under typical IT load conditions, the submerged liquid cooling system reduces cooling energy consumption by 42.5–64.3%, maintaining an annual average PUE of 1.06–1.15, outperforming traditional liquid cooling systems;
  • Compared to conventional cooling-tower-based systems, the proposed system achieves a 37.7–75.1% reduction in annual carbon emissions, with peak decarbonization rates reaching 50.1% in optimal operating scenarios;
  • The heat exchange model was validated using TRNSYS simulation against MATLAB-calculated data, with a deviation of less than 3% in most operating conditions, demonstrating strong thermal accuracy;
  • The spatial configuration supports both submerged deployment and shoreline access, making it suitable for redeveloping post-mining water zones and reactivating underutilized regional infrastructure.
Compared to conventional strategies, this system not only enhances carbon efficiency but also offers a replicable and scalable green infrastructure solution for resource-based city edges in central China. It supports both ecological restoration and digital transformation goals, presenting realistic potential for regional deployment.
Recommendations for future research and practice are as follows:
(1)
Empirical validation: Close the modeling loop with pilot-scale operational data to verify thermal performance and structural durability under real-world conditions.
(2)
Energy integration: Explore coupling with clean energy systems such as photovoltaics, storage, or micro-grids to enhance overall system sustainability.
(3)
Life-cycle analysis: Conduct comprehensive life-cycle carbon and economic assessments that include construction, operation, and end-of-life phases.
(4)
Environmental assessment: Evaluate potential ecological impacts of continuous heat rejection on aquatic ecosystems and propose mitigation strategies.
(5)
Policy alignment: At the policy level, the proposed system demonstrates how China’s dual-carbon strategy can be advanced through both industrial decarbonization and adaptive spatial planning. By reactivating subsidence lakes as productive assets, the approach provides a model for integrating ecological restoration with digital infrastructure, aligning with national targets for energy efficiency and sustainable land use.

Author Contributions

Conceptualization, Y.H. and X.J.; methodology, Y.H.; software, Y.H. and Y.T.; validation, Y.H., Y.T., and Y.C.; formal analysis, Y.H.; investigation, Y.H. and Y.C.; resources, X.J.; data curation, Y.T. and Y.C.; writing—original draft preparation, Y.H.; writing—review and editing, X.J. and Y.T.; visualization, Y.T.; supervision, X.J.; project administration, X.J.; funding acquisition, X.J. All authors have read and agreed to the published version of the manuscript.

Funding

This research was supported by the National Key R&D Program of China, Project “Research on Functional Upgrading and Renovation Planning Methods for Existing Urban Industrial Areas” (Grant No. 2018YFC0704903), under the Green Building and Building Industrialization Key Special Program.

Data Availability Statement

The calculated data supporting the findings of this study, including the energy consumption, PUE, and carbon emission estimates derived from MATLAB parameterized computations and TRNSYS simulations, are available from the corresponding author upon reasonable request. The input parameters used in the models (e.g., server specifications, coolant properties, plate heat exchanger parameters, and grid emission factors) are cited from publicly accessible manufacturer datasheets and official reports listed in the references. The raw TRNSYS model files and MATLAB scripts are not publicly shared due to their large size and ongoing related research but can be provided upon reasonable request.

Acknowledgments

The authors received no specific support beyond what is reported in the Author Contributions and Funding sections.

Conflicts of Interest

The authors declare no conflicts of interest.

Abbreviations

The following abbreviations are used in this manuscript:
PUEPower Usage Effectiveness
ICTInformation and Communication Technology
CDUCoolant Distribution Unit
TRNSYSTransient System Simulation Tool
LCALife Cycle Assessment
CO2Carbon Dioxide
kWKilowatt
kWhKilowatt-Hour
R-1234zeRefrigerant Type R-1234ze
ITInformation Technology
Nomenclature
QrackThe heat dissipation rate of a single server rack (W)
clThe mass flow rate of the coolant (kg/s)
cclThe specific heat capacity of the coolant (J/kg·K)
Tcl,outThe outlet temperatures of the coolant (°C)
Tcl,inThe inlet temperatures of the coolant (°C)
QCDUThe heat transfer rate across the CDU (W)
UCDUThe overall heat transfer coefficient (W/m2·K)
ACDUThe heat transfer area of the CDU (m2)
ΔTlm,CDUThe logarithmic mean temperature difference (LMTD) between the coolant and cooling water
QexchangerThe heat transfer from cooling water to the external subsided water (W)
UplateThe plate exchanger’s heat transfer coefficient (W/m2·k)
AplateThe effective surface area of the plate heat exchanger (m2)
ΔTHEThe temperature difference between cooling water and the surrounding water body (K)
P f a n , t o t c t The total rated power of 32 cooling tower fans (kW)
ηloadA load ratio estimated based on the proportion of thermal load (%)

References

  1. An, S.K.; Li, Z.L.; Hu, Z.S. Study on the evolution trend of ecosystem in high groundwater level mining area: A case study of the Panxie mining area in Huainan. China Min. Mag. 2015, 24, 40–44. (In Chinese) [Google Scholar]
  2. Li, B.J.; Gu, H.H.; Ji, Y.Z. Dynamic changes in fractal characteristics of land use in mining areas. Trans. Chin. Soc. Agric. Eng. 2013, 29, 233–240. (In Chinese) [Google Scholar]
  3. Yang, R.; Lei, S.; Wang, S. Spatio-temporal analysis of ground subsidence due to underground coal mining in Huainan coalfield, China. Nat. Hazards 2020, 100, 105–123. [Google Scholar] [CrossRef]
  4. Hao, B.-y.; Kang, L.-x. Mine land reclamation and eco-reconstruction in Shanxi Province I: Mine land reclamation model. Sci. World J. 2014, 2014, 483862. [Google Scholar] [CrossRef] [PubMed]
  5. Xiao, W.; Hu, Z.; Li, J.; Zhang, H.; Hu, J. A study of land reclamation and ecological restoration in a resource-exhausted city: A case study of Huaibei in China. Int. J. Min. Reclam. Environ. 2011, 25, 332–341. [Google Scholar] [CrossRef]
  6. Hu, T.; Chang, J.; Liu, X.; Feng, S. Integrated methods for determining restoration priorities of coal mining subsidence areas based on green infrastructure: A case study in the Xuzhou urban area. China. Ecol. Indic. 2018, 94, 164–174. [Google Scholar] [CrossRef]
  7. Qiu, H.L.; Gui, H.R.; Song, Q.X. Human health risk assessment of trace elements in shallow groundwater of the Linhuan coal-mining district, Northern Anhui Province, China. Hum. Ecol. Risk Assess. 2018, 24, 1342–1351. [Google Scholar] [CrossRef]
  8. Zipper, C.E.; Skousen, J.G.; Ziemkiewicz, P.F.; Daniels, W.L.; Nolte, B.K.; Schoenholtz, S.H. Restoring forests and associated ecosystem services on Appalachian coal surface mines. J. Environ. Manag. 2011, 47, 751–765. [Google Scholar] [CrossRef] [PubMed]
  9. Zhou, J.; Wang, L. Comprehensive study on ecological restoration and land exploitation of mining subsidence in suburbs of Chinese mining cities. Int. J. Coal Sci. Technol. 2014, 1, 248–252. [Google Scholar] [CrossRef]
  10. Li, C.; Chang, J.; Feng, S.; Zhou, S. From a Coal Mining Area to a Wetland Park: How Is the Social Landscape Performance in Pan’ an Lake National Wetland Park? Land 2025, 14, 1305. [Google Scholar] [CrossRef]
  11. Tan, X.; Peng, Y.; Liu, S.; Liu, P. Landscape pattern and ecotourism carrying capacity of Pan’an Lake Wetland Park in Xuzhou City, China. Desal. Water Treat. 2020, 188, 288–296. [Google Scholar] [CrossRef]
  12. Kalin, M. Biogeochemical and ecological considerations in designing wetland treatment systems in post-mining landscapes. Waste Manag. 2001, 21, 191–196. [Google Scholar] [CrossRef]
  13. Li, C.; Yang, S.; Zha, D.; Zhang, Y.; de Boer, W.F. Waterbird communities in subsidence wetlands created by underground coal mining in China: Effects of multi-scale environmental and anthropogenic variables. Environ. Conserv. 2019, 46, 67–75. [Google Scholar] [CrossRef]
  14. Yang, Y.; Zhang, Y.; Su, X. The spatial distribution and expansion of subsided wetlands induced by underground coal mining in eastern China. Environ. Earth Sci. 2021, 80, 112. [Google Scholar] [CrossRef]
  15. Li, C.; Zhang, Y.; Zha, D.; Yang, S.; de Boer, W.F. Assembly processes of waterbird communities across subsidence wetlands in China: A functional and phylogenetic approach. Divers. Distrib. 2019, 25, 1118–1129. [Google Scholar] [CrossRef]
  16. Chen, Y.; Zheng, L.; Chen, X.; Hu, J.; Li, C.; Zhang, L.; Cheng, H. Distribution of mercury and methylmercury in aquacultured fish in special waters formed by coal mining subsidence. Ecotoxicol. Environ. Saf. 2024, 280, 116546. [Google Scholar] [CrossRef]
  17. Tan, M.; Bian, Z.; Dong, J.; Hao, M.; Qu, J. Comparing the variation and influencing factors of CO2 emission from subsidence waterbodies under different restoration modes in coal mining area. Environ. Res. 2023, 237, 116936. [Google Scholar] [CrossRef]
  18. Xie, K.; Zhang, Y.; Yi, Q.; Yan, J. Optimal resource utilization and ecological restoration of aquatic zones in the coal mining subsidence areas of the Huaibei Plain in Anhui Province, China. Desal. Water Treat. 2013, 51, 4019–4027. [Google Scholar] [CrossRef]
  19. Yuan, L.; Xu, L.J. Concept and practice of resource-based, energy-based and multifunctional utilization in high groundwater level coal mining subsidence areas. J. China Coal Soc. 2024, 49, 65–74. (In Chinese) [Google Scholar]
  20. Yuan, L.; Xu, L. Conception and practice of resource utilization, energization and functionalization of coal mining subsidence areas with high groundwater level. J. China Coal Soc. 2024, 49, 65–74. [Google Scholar] [CrossRef]
  21. Yuan, L.; Peng, S.P.; Wu, Q. Strategic Research on Comprehensive Management and Ecological Restoration of Coal Mining Subsidence Areas in Eastern China; Science Press: Beijing, China, 2020. (In Chinese) [Google Scholar]
  22. Liu, K.Z. Making the China Data Valley—The National Integrated Big Data Centre System and Local Governance. J. Contemp. Asia 2024, 55, 203–225. [Google Scholar] [CrossRef]
  23. Dayarathna, M.; Wen, Y.; Fan, R. Data Center Energy Consumption Modeling: A Survey. IEEE Commun. Surv. Tutor. 2016, 18, 732–794. [Google Scholar] [CrossRef]
  24. Environmental Protection Agency (EPA). Report to Congress on Server and Data Center Energy Efficiency; Public Law 109-431; U.S. Environmental Protection Agency: Washington, DC, USA, 2007.
  25. Sun, H.S.; Lee, S.E. Case study of data centers’ energy performance. Energy Build. 2006, 38, 522–533. [Google Scholar] [CrossRef]
  26. Ma, H.; Du, N.; Yu, S.; Lu, W.; Zhang, Z.; Deng, N. Analysis of typical public building energy consumption in northern China. Energy Build. 2017, 136, 139–150. [Google Scholar] [CrossRef]
  27. Andrae, A.S.G.; Edler, T. On global electricity usage of communication technology: Trends to 2030. Challenges 2015, 6, 117–157. [Google Scholar] [CrossRef]
  28. Rehman, A.; Nogueira, L.A.H.; Mustafa, M.W. The role of renewable energy in the global energy transformation. Energy Strategy Rev. 2019, 24, 38–50. [Google Scholar] [CrossRef]
  29. Gustavsson, L.; Joelsson, A.; Sathre, R. Life cycle primary energy use and carbon emission of an eight-storey wood-framed apartment building. Energy Build. 2010, 42, 230–242. [Google Scholar] [CrossRef]
  30. Ren, C.; Wang, D.; Urgaonkar, B.; Sivasubramaniam, A. Carbon-aware energy capacity planning for datacenters. In Proceedings of the 2012 IEEE 20th International Symposium on Modeling, Analysis and Simulation of Computer and Telecommunication Systems (MASCOTS), Washington, DC, USA, 7–9 August 2012; pp. 161–168. [Google Scholar] [CrossRef]
  31. Stein-Montalvo, M.; Miller, J.; Bou-Zeid, E. Origami-inspired passive ventilation structures for wind capture in urban design. arXiv 2023, arXiv:2310.01577. [Google Scholar]
  32. Biwole, P.H.; Woloszyn, M.; Pompeo, C. Heat transfer model for a ventilated double skin facade. arXiv 2013, arXiv:1312.1295. [Google Scholar]
  33. Azeñas, J.; Roldán-Fernández, J.M.; Recio, J.A. Assessment of green roofs as a passive cooling technique in Mediterranean climate. Energies 2018, 11, 2704. [Google Scholar] [CrossRef]
  34. Zhao, H.; Li, J.; Xu, H. Experimental evaluation of green and cool roofs on building energy performance in different seasons. Front. Energy Res. 2023, 11, 1291213. [Google Scholar] [CrossRef]
  35. Vertiv. Quantifying Data Center PUE When Introducing Liquid Cooling. 2023. Available online: https://www.vertiv.com/en-asia/about/news-and-insights/articles/blog-posts/quantifying-data-center-pue-when-introducing-liquid-cooling/ (accessed on 23 July 2025).
  36. Jia, N.; Hu, W. Floating Towns: Governance and Reconstruction of Coal Mining Subsidence Water Bodies; China Architecture & Building Press: Beijing, China, 2018. (In Chinese) [Google Scholar]
  37. Pei, W.M. Remote Sensing Dynamic Monitoring of Water Environment in Coal Mining Subsidence Areas of Panji, Huainan. Ph.D. Thesis, Nanjing University, Nanjing, China, 2012. (In Chinese). [Google Scholar]
  38. Jia, N.; Hu, W.; Wang, D.Q. New ideas for constructing floating building land in coal mining subsidence water bodies. Mod. Urban Res. 2014, 7, 87–91. (In Chinese) [Google Scholar]
  39. Wu, X.Q.; Zhou, D.W.; An, S.K. Evolution trend and governance countermeasures of land and water in the Panxie mining area, Huainan. J. China Coal Soc. 2015, 40, 6. (In Chinese) [Google Scholar] [CrossRef]
  40. Liu, M.; Zeng, Y. Study on geological disasters and prevention strategies of mining subsidence areas. Jiangsu Environ. Sci. Technol. 2005, 18, 29–32. (In Chinese) [Google Scholar]
  41. Huainan Natural Resources and Planning Bureau. Huainan Territorial Spatial Master Plan (2021–2035)—Draft for Public Comment; Huainan Municipal People’s Government: Huainan, China, 2021. (In Chinese)
  42. Honeywell Energy and Sustainable Technology Group. Solstice® ze (R-1234ze) [EB/OL]. n.d. Available online: https://www.honeywell.com.cn/ess/products-and-services/advanced-materials/flourine-products/refrigerants/solstice-ze-r-1234ze (accessed on 11 March 2025).
  43. China Refrigeration Society Data Center Cooling Working Group. Annual Development Report on Cooling Technologies for Data Centers in China 2022; China Architecture & Building Press: Beijing, China, 2023. (In Chinese) [Google Scholar]
  44. WheatA. V1.6.5b [CP/OL]. 2024. Available online: https://wheata.cn (accessed on 16 August 2024).
  45. Xfusion. FusionServer XH321 V6 [EB/OL]. Available online: https://www.xfusion.com/en/product/high-density-server/fusionserver-xh321-v6 (accessed on 1 March 2025).
  46. Danfoss. Installation, Operation, and Maintenance Manual for Gasketed and Semi-Welded Plate Heat Exchangers (AQ3568.45617175zh-000204); Danfoss (Shanghai) Investment Co., Ltd.: Shanghai, China, 2023. (In Chinese) [Google Scholar]
  47. Anhui Provincial Development and Reform Commission. Analysis report on electricity prices for industrial and commercial users in Anhui Province [R/OL]. 2025. Available online: https://fzggw.ah.gov.cn/jgsz/jgcs/myjjj/hqzc/149826041.html (accessed on 9 March 2025). (In Chinese)
  48. Li, X. Hydrodynamic Numerical Simulation of Dead Water Zones in Longjing Lake Based on the EFDC Model. Ph.D. Thesis, Chongqing University, Chongqing, China, 2025. (In Chinese). [Google Scholar]
  49. Wang, J.; Zhang, P. Flood flow field and velocity distribution simulation of Tianjing Lake based on the MIKE21 2D hydrodynamic model. Zhi Huai 2023, 1, 22–24. (In Chinese) [Google Scholar]
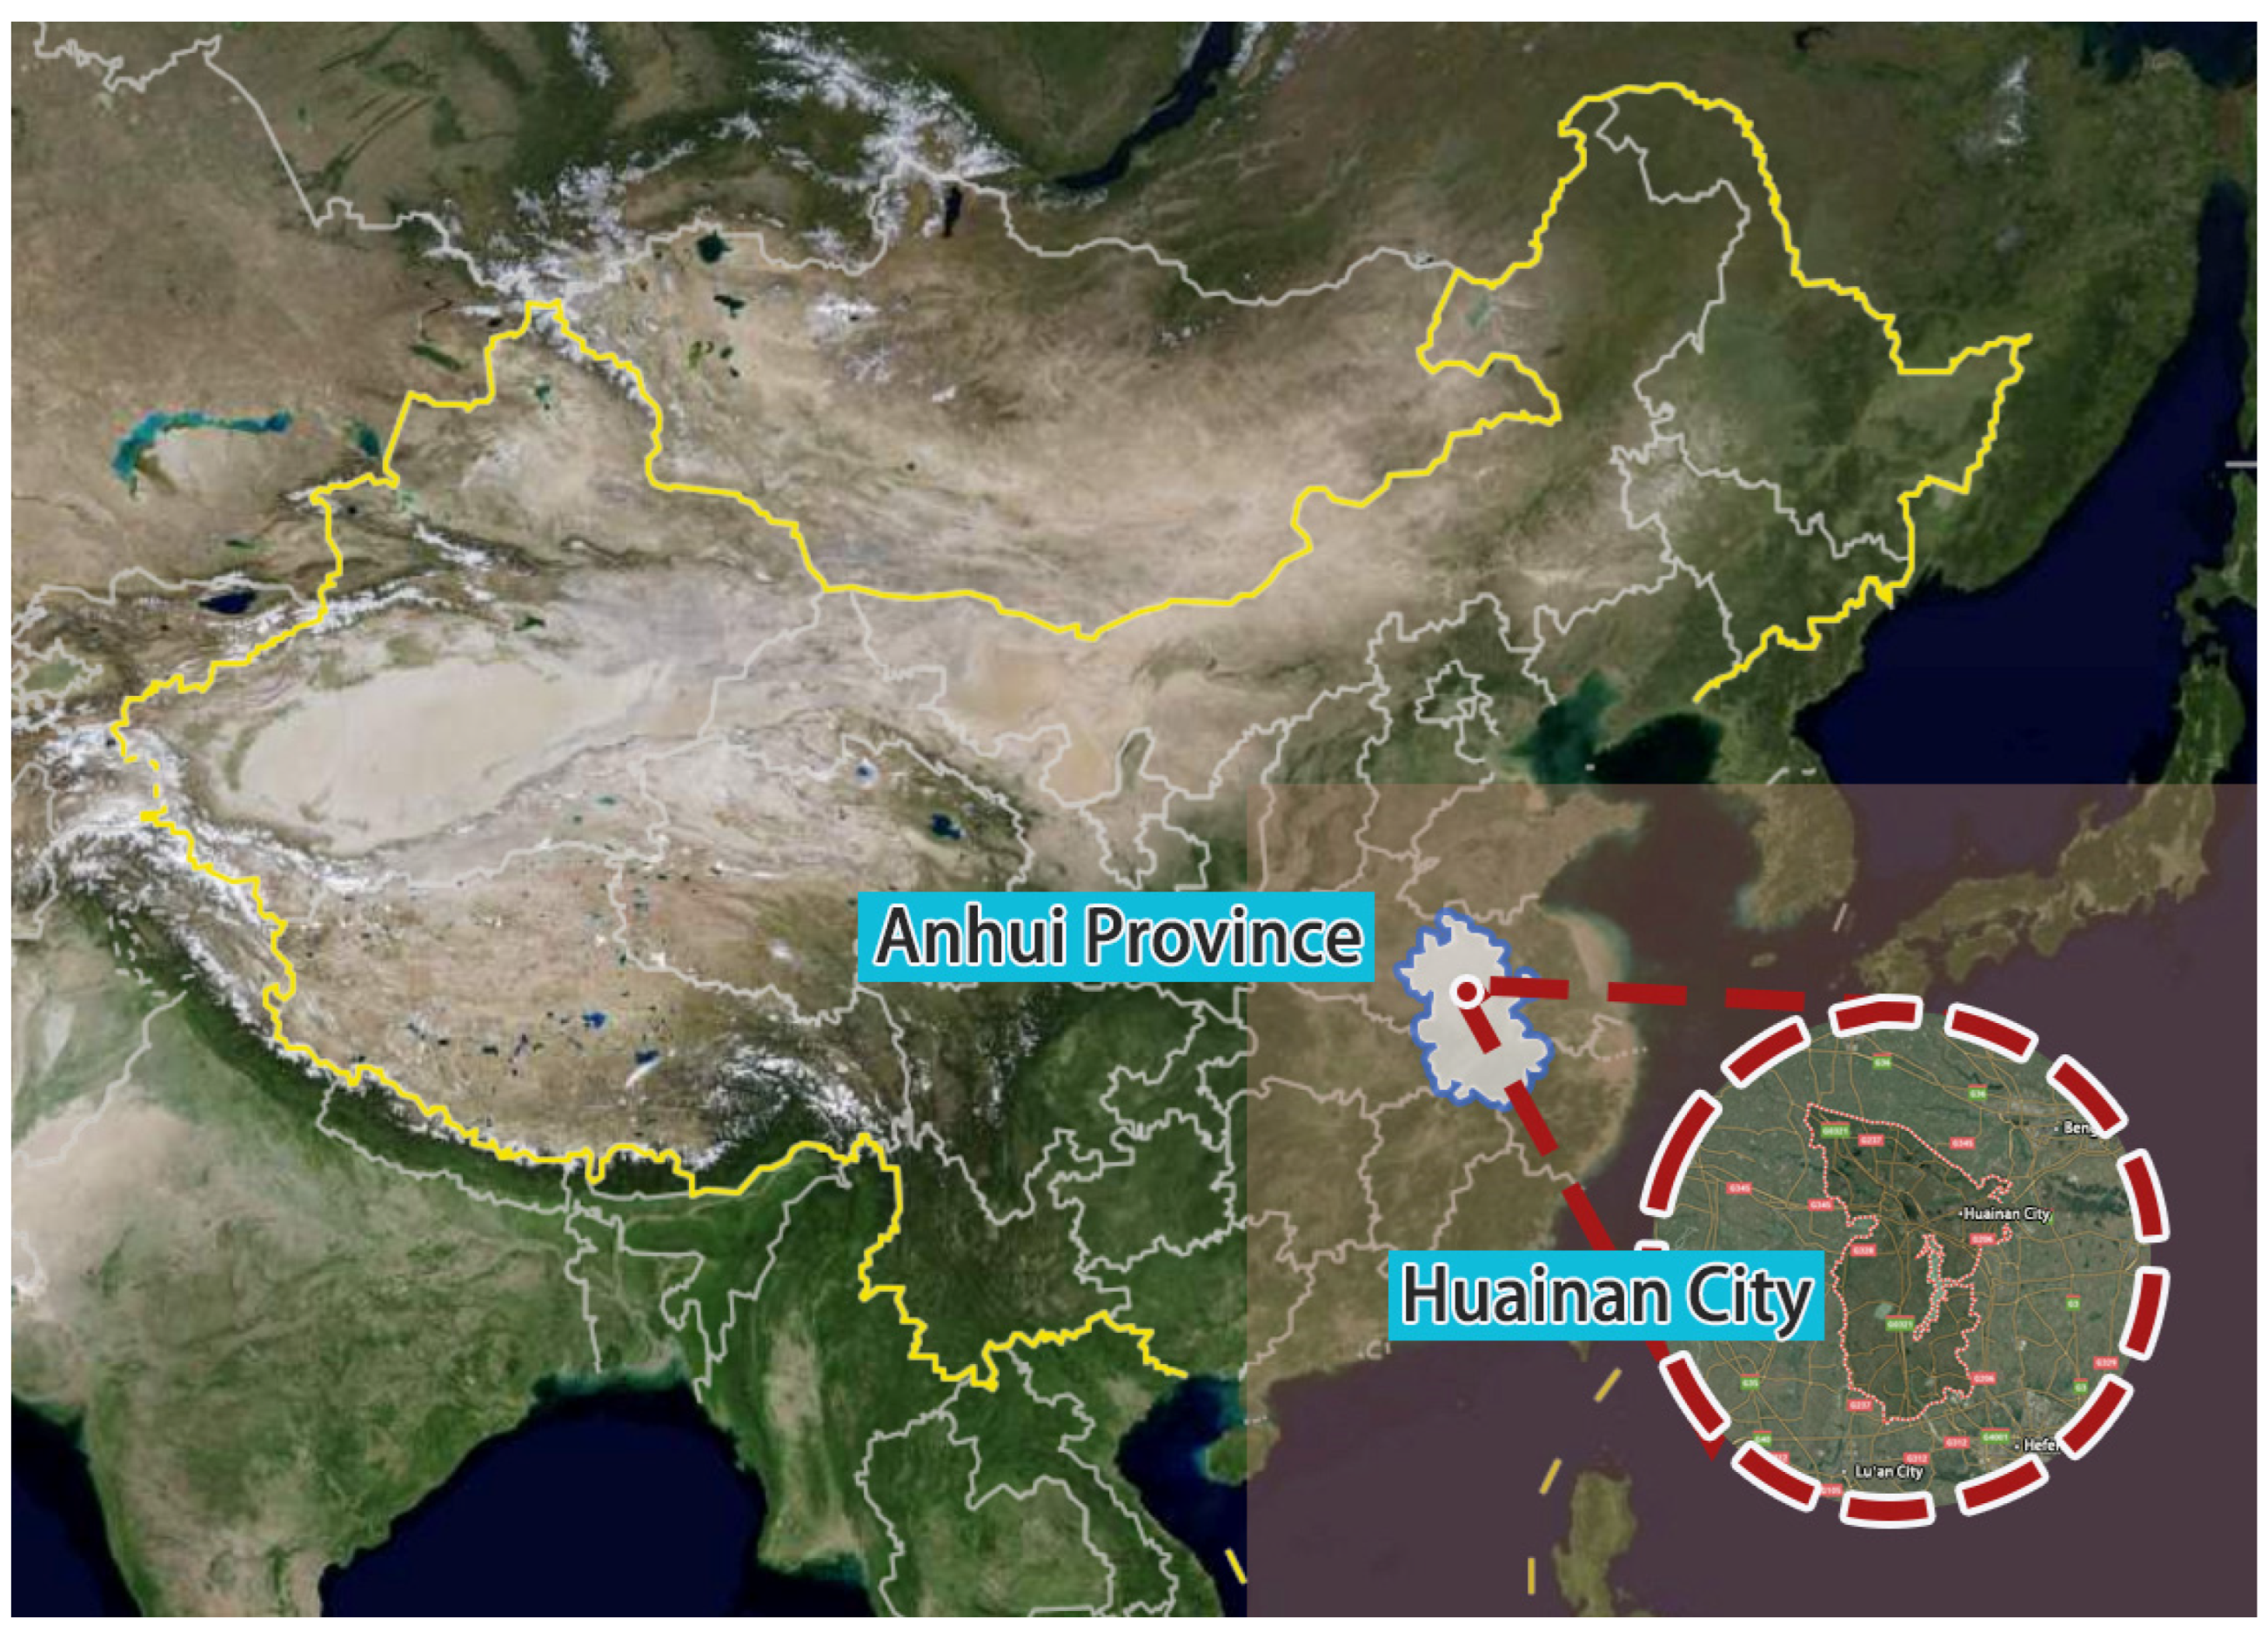
Figure 1. Geographic location of Huainan City in China. Note: Huainan City is located in the north-central part of Anhui Province, eastern China. It lies within the Yangtze River Delta Economic Region, offering strategic proximity to major transportation networks and energy infrastructure.
Buildings 15 03148 g001
Figure 2. Spatial context of the Panxie mining subsidence water area within Huainan City: (a) territorial urban system plan; (b) comprehensive transportation plan. Note: The Panxie mining subsidence water area is located at the intersection of Huainan’s strategic urban planning system and regional transportation corridors. As a large-scale permanently flooded subsided zone formed by historical underground coal mining, the area not only offers suitable spatial conditions for submerged architectural deployment, but also reflects the urgent need for ecological revitalization, industrial transformation, and spatial reintegration.
Buildings 15 03148 g002
Figure 3. Illustration of the submerged architectural data center concept.
Buildings 15 03148 g003
Figure 4. Spatial distribution of functional zones within the submerged data center building. Note: The submerged architectural scheme comprises four vertically arranged levels. The top level remains above water and serves as the interface with external infrastructure, while the remaining three levels are fully submerged and house core computing and cooling functions. Functional zones are organized as follows: the Core Functional Zone accommodates the liquid-cooled server rooms and water-loop heat pump systems; the Auxiliary Functional Zone includes electrical, operational, and maintenance support spaces; and the Ecological Buffer Zone provides spatial transition and thermal buffering through interaction with the surrounding water environment.
Buildings 15 03148 g004
Figure 5. Layout diagrams of different equipment room configurations in the Submerged Architectural Data Center. (a) Two water-exposed sides, 1500 mm cold aisle, 1000 mm hot aisle. (b) Two water-exposed sides, 1500 mm cold aisle, 1200 mm hot aisle. (c) Three water-exposed sides, 1500 mm cold aisle, 1000 mm hot aisle.
Buildings 15 03148 g005
Figure 6. Schematic diagram of the submerged architectural liquid cooling system.
Buildings 15 03148 g006
Figure 7. Simulation model of the submerged architectural liquid cooling system.
Buildings 15 03148 g007
Figure 8. Simulation model of the conventional cooling-tower-based liquid cooling system.
Buildings 15 03148 g008
Figure 9. Simulated average temperature difference between coolant and cooling water (submerged architectural case); theoretical calculated range: 6.5–33.35 °C.
Buildings 15 03148 g009
Figure 10. Simulation of heat exchange between cooling water and subsidence water via wall-mounted plate heat exchanger (submerged architectural case). Note: According to the model-based calculation from Equation (3), the theoretical heat exchange capacity varies between 55.27 and 957.80 kW throughout the year, with an average value.
Buildings 15 03148 g010
Figure 11. Monthly cooling energy consumption of submerged architectural liquid cooling system.
Buildings 15 03148 g011
Figure 12. Component power distribution of conventional cooling-tower-based liquid cooling system under varying IT loads. Note: These data are based on the rated power of each component under ideal operating conditions provided by manufacturers. Factors such as wet-bulb temperature differentials, nonlinear airflow demand, and pump speed regulation deviations are not considered. In practical operation, a system correction coefficient (2.20–2.50) should be applied to adjust the estimated PUE values accordingly.
Buildings 15 03148 g012
Figure 13. Annual energy consumption breakdown of the submerged architectural data center. Note: This figure is based on typical IT load, estimated median values, and full-year operation hours. It reflects a baseline scenario without system-level energy efficiency optimizations. The corresponding estimated PUE under these assumptions is approximately 1.22.
Buildings 15 03148 g013
Figure 14. Monthly PUE comparison between the submerged architectural liquid cooling system and the conventional cooling-tower-based liquid cooling system.
Buildings 15 03148 g014
Table 1. Summary of heat exchange model parameters.
Parameter TypeValue
Water depth of subsidence area20 m
Hydrostatic pressure of subsidence water196.5 kPa
Server specification1U (half-height)
Specific heat capacity of coolant1402.58 kJ/kg·K
Coolant density1146.92 kg/m3
Coolant pipe specificationDN80 (inner diameter: 0.080 m)
Internal flow path length of CDU heat exchanger15 m
Dynamic viscosity of coolant0.00047 Pa·s
Total local resistance coefficient of coolant8.7
Heat transfer area of CDU17 m2
Specific heat capacity of cooling water4180 J/kg·K
Cooling water density997 kg/m3
Cooling water pipe specificationDN40 (inner diameter: 0.040 m)
Heat transfer area of wall-mounted plate heat exchanger32.84 m2
Dynamic viscosity of cooling water0.000715 Pa·s
Thermal conductivity of cooling water0.63 W/m·K
Carbon emission intensity0.6782 kg CO2/kWh [47]
Table 2. Summary of heat exchange model variables.
Variable TypeSeasonValue
Flow velocity of subsidence waterAnnual0.1–0.5 m/s [48,49]
Mixed-layer water temperature of subsidence areaAnnual15.91 °C
Summer26.91 °C
Winter3.73 °C
Mixed-layer water temperature rangeSummer24.38–28.18 °C
Winter2.65–4.39 °C
Overall-layer average water temperatureAnnual15.82 °C
Summer26.65 °C
Winter3.74 °C
Overall-layer water temperature rangeSummer24.24–28.10 °C
Winter2.65–4.42 °C
Water density of subsidence areaAnnual1000.024–1000.048 kg/m3
Server power consumption600–850 W
Rack-level power consumption55.2–78.2 kW
Coolant inlet temperature at CDU side40.0–48.0 °C
Coolant outlet temperature at CDU side30.0–35.0 °C
Coolant temperature difference (inlet–outlet)5.0–18.0 K
Cooling water inlet temperature at CDU sideSummer26.24–32.10 °C
Winter4.65–8.42 °C
Cooling water outlet temperature at CDU sideAnnual35.0–38.0 °C
Cooling water temperature difference (plate HX side)Summer2.9–11.8 K
Winter26.58–33.35 K
Coolant flow rateAnnual34.31–350.01 L/min
Coolant velocity range0.1138–1.1605 m/s
Coolant total pressure drop0.1006–8.8198 kPa
CDU heat transfer coefficient2000–3000 W/m2·K
Cooling water temperature rise2.9–33.35 K
Cooling water flow rate11.8–230.57 L/min
Cooling water velocity range0.0122–0.4650 m/s
Heat transfer coefficient (cooling water side of plate HX)232.22–5670.88 W/m2·K
Heat transfer coefficient (subsidence water side of plate HX)290–1460 W/m2·K
Overall heat transfer coefficient of plate HX280–1230 W/m2·K
Table 3. Validation of heat exchange model between server and coolant under representative operating conditions (submerged architectural case).
Calculated Heat Load (kW)Waste Heat Recovery Rate (%)Heat Exchange Temperature Difference (K)Coolant Mass Flow Rate (kg/s)Simulated Heat Load (kW)
55.200000.0000018.000002.1864555.20008
55.200000.000005.000007.8712155.20001
33.2000040.0000018.000001.3118733.12005
33.2000040.000005.000004.7227333.12003
27.2000050.0000018.000001.0932227.59991
27.2000050.000005.000003.9356027.59996
16.2000070.0000018.000000.6559316.55990
16.2000070.000005.000002.3613616.55998
78.200000.0000018.000003.0974778.20009
78.200000.000005.0000011.1508878.20001
47.2000040.0000018.000001.8584846.92000
47.2000040.000005.000006.6905346.92002
39.2000050.0000018.000001.5487339.09992
39.2000050.000005.000005.5754439.10000
23.2000070.0000018.000000.9292423.46000
23.2000070.000005.000003.3452623.45997
Table 4. Annual electricity consumption estimates (unit: kWh).
System TypeMinimum EstimateMaximum Estimate
Submerged Architecture24,598,08061,495,200
Conventional Cooling Tower49,322,30498,644,608
Table 5. Sensitivity of energy efficiency and carbon reduction to water temperature and IT load (submerged architectural system vs. conventional cooling-tower–based single-phase immersion, same IT load per scenario).
ScenarioWater Temperature (°C)IT Load (% of Design)Submerged System PUECooling Energy Saving vs. Tower (%)CO2 Reduction vs. Tower (%)
(A) Low-T water + high load5951.06~66~75
(B) High-T water + low load25401.15–1.18~40–45~46–52
(C) Baseline15701.10–1.12~55~60
Disclaimer/Publisher’s Note: The statements, opinions and data contained in all publications are solely those of the individual author(s) and contributor(s) and not of MDPI and/or the editor(s). MDPI and/or the editor(s) disclaim responsibility for any injury to people or property resulting from any ideas, methods, instructions or products referred to in the content.