Article

Impact of Reinforcement Corrosion on Progressive Collapse Behavior of Multi-Story RC Frames

1
College of Civil Engineering, Tongji University, Shanghai 200092, China
2
Department of Structural Engineering and Building Materials, Ghent University, Technologiepark Zwijnaarde 60, 9052 Ghent, Belgium
3
Structural Engineering Laboratory, Institute of Civil Engineering, Putian University, Putian 351100, China
4
School of Civil Engineering, Southeast Univeristy, Nanjing 211189, China
*
Authors to whom correspondence should be addressed.
Buildings 2025, 15(14), 2534; https://doi.org/10.3390/buildings15142534
Submission received: 21 June 2025 / Revised: 11 July 2025 / Accepted: 16 July 2025 / Published: 18 July 2025
(This article belongs to the Section Building Materials, and Repair & Renovation)

Abstract

The progressive collapse performance of reinforced concrete (RC) building structures has been extensively investigated using the alternate load path method. However, most studies have focused on newly designed structures, with limited attention given to existing buildings. Since progressive collapse can occur at any point during a structure’s service life and at various locations within the structural system, this study examines the progressive collapse behavior of deteriorated RC frames subjected to simulated reinforcement corrosion. This paper presents an investigation into the system-level progressive collapse responses of deteriorated RC frames, which extends the current state of the art in this field. The influence of different material deteriorations, different corrosion locations, different column removal scenarios, and dynamic effects on structural response is explored. According to the results obtained in this research, a significant reduction in progressive collapse resistance can be resulted in with increasing corrosion levels. Notably, only reinforcement corrosion in the beams located directly above the removed column (i.e., within the directly affected part) for the investigated RC frame had a substantial impact on structural performance. In contrast, corrosion in other regions and concrete deterioration exhibited minimal influence in this work. An increased number of corroded floors further reduced collapse resistance. Dynamic progressive collapse resistance was found to be considerably lower than its static counterpart and decreased at a slightly faster rate as corrosion progressed. Additionally, the energy-based method was shown to provide a reasonable approximation of the maximum dynamic responses at different corrosion levels, offering a computationally efficient alternative to full dynamic analysis.

1. Introduction

The progressive or disproportionate collapse performance of structural systems has been extensively studied over the past few decades, particularly due to the increasing emphasis on structural robustness following several catastrophic failures. Notable examples include the collapse of the Ronan Point apartment building in the UK (1968), which highlighted vulnerabilities in prefabricated construction, and the bombing-induced collapse of the Murrah Federal Building in the US (1995) [1,2,3,4,5]. These incidents have prompted significant research efforts (experimental, theoretical, and numerical) into the progressive collapse behavior of reinforced concrete (RC) building structures [4,6,7,8,9,10,11]. One of the most widely adopted approaches for evaluating progressive collapse is the alternate load path method, which simulates the structural response when one or more load-bearing elements (e.g., columns) are removed [12,13,14,15,16]. This method can be implemented numerically through either static or dynamic analysis procedures [17,18,19]. Nonlinear static and dynamic analyses are two key methodologies used in such assessments, as they allow for the consideration of material and geometric nonlinearities, including large displacements and rotations [20,21,22]. While nonlinear static analysis is relatively straightforward to perform, it typically requires the application of a dynamic amplification factor to account for the inherent dynamic nature of progressive collapse events [20,23,24,25]. In contrast, nonlinear dynamic analysis is currently considered the most accurate approach for evaluating progressive collapse resistance, although it is generally more computationally intensive and time-consuming [12,26,27].
Civil engineering structures are susceptible to aging and deterioration caused by aggressive chemical attacks [8,21,28,29,30,31]. For example, in coastal or marine environments, RC buildings may experience concrete carbonation and chloride ion penetration, which can significantly degrade structural performance. Consequently, life cycle performance assessment becomes crucial for maintaining the safety and longevity of these structures [32,33]. Aging structures are expected to offer lower resistance against progressive collapse compared with newly constructed ones. Botte et al. [33] numerically investigated the influence of corrosion on the tensile membrane behavior of RC slabs subjected to middle support removal scenarios. Reinforcing steel corrosion was found to substantially reduce the ultimate load-bearing capacity of the slabs. Yu et al. [34] examined the progressive collapse behavior of aging RC structures under middle column removal conditions. Their findings indicated that structures with severe corrosion were considerably more vulnerable to progressive collapse compared to newly constructed ones. Feng et al. [28] conducted numerical studies on the time-dependent reliability and redundancy of RC frames subjected to progressive collapse. Du et al. [35] highlighted that corrosion in reinforcement used in structures primarily subjected to dynamic loads, such as those in seismic zones, can significantly decrease their ductility and robustness due to reductions in the ultimate strain and elongation of the bars. Recently, resistances of corroded slab–column connections were well studied [8,29,36], and progressive collapse resistances of corroded RC components were investigated [37,38]. These suggest that the structural performance of aging RC structures during progressive collapse events may be severely compromised.
However, current research in this field remains limited overall, highlighting the need for further investigation [39,40]. The research significance of this work is summarized as follows: More accurate models are required to effectively assess the impact of corrosion on structural robustness [41]. Moreover, while existing studies have primarily focused on the progressive collapse behavior and mechanisms of aging RC structures at the level of beam–column subassembly, the structural response at the system level—such as for multi-story frame structures—remains insufficiently understood, further emphasizing the necessity for comprehensive and system-level investigations into the progressive collapse performance of deteriorated RC frames, such as corrosion development at different locations and rates [39].
Accordingly, this study aims to investigate the progressive collapse performance of deteriorated multi-story RC frame structures subjected to simulated reinforcement corrosion. Particular attention is given to the effects of different material deterioration models, different corrosion locations, and different column removal scenarios, using both static and dynamic analysis approaches. The remainder of this paper is organized as follows: Section 2 presents the modeling approaches used to simulate deterioration in both reinforcement and concrete. Section 3 outlines the three nonlinear analysis methods employed—namely, the static pushdown analysis, the incremental dynamic analysis, and the energy-based method—with respect to the implementation of the alternate load path method. Numerical modeling techniques using the OpenSees software platform v3.7.1 are also described in this section. In Section 4, a representative RC frame is introduced (Section 4.1), followed by the results of static pushdown analyses aimed at investigating the influence of various deterioration models (Section 4.2), deterioration locations within the RC frame (Section 4.3), and different column removal scenarios (Section 4.4). Section 4.5 further explores the influence of dynamic effects on the progressive collapse behavior of the deteriorated structure. Finally, key findings and conclusions are summarized in Section 5.

2. Deterioration Modeling Due to Rebar Corrosion Effects

According to existing studies [28,31,33,42], corrosion of reinforcing steel is one of the most common deterioration mechanisms in reinforced concrete. Rebar corrosion can degrade the performance of both the concrete and the steel reinforcement [21,39]. The corrosion process in RC structures generally consists of two stages: the initiation phase and the propagation phase [30,33]. During the initiation phase, the steel reinforcement becomes depassivated due to the ingress of chlorides or carbonation. In the subsequent propagation phase, the actual cross-sectional area of the reinforcement decreases, while the volume of the rebars starts to expand due to the accumulation of corrosion products. In this study, only the propagation phase is considered, as it is during this phase that the mechanical properties of the rebars are significantly affected. Generally, damage modeling involves the following four aspects [33,43]:
(1)
Reduction in the cross–sectional area of the corroded rebar;
(2)
Degradation of the mechanical properties of the corroded rebar;
(3)
Deterioration of the concrete due to cracking and spalling caused by the expansion of corrosion products;
(4)
Reduction in the bond behavior between the corroded rebar and the surrounding concrete.
However, the reduction in bond behavior is not considered in the present study and should be investigated in future work. Given its complexity and the associated uncertainties [33], this simplification has also been adopted in other studies [33,43].

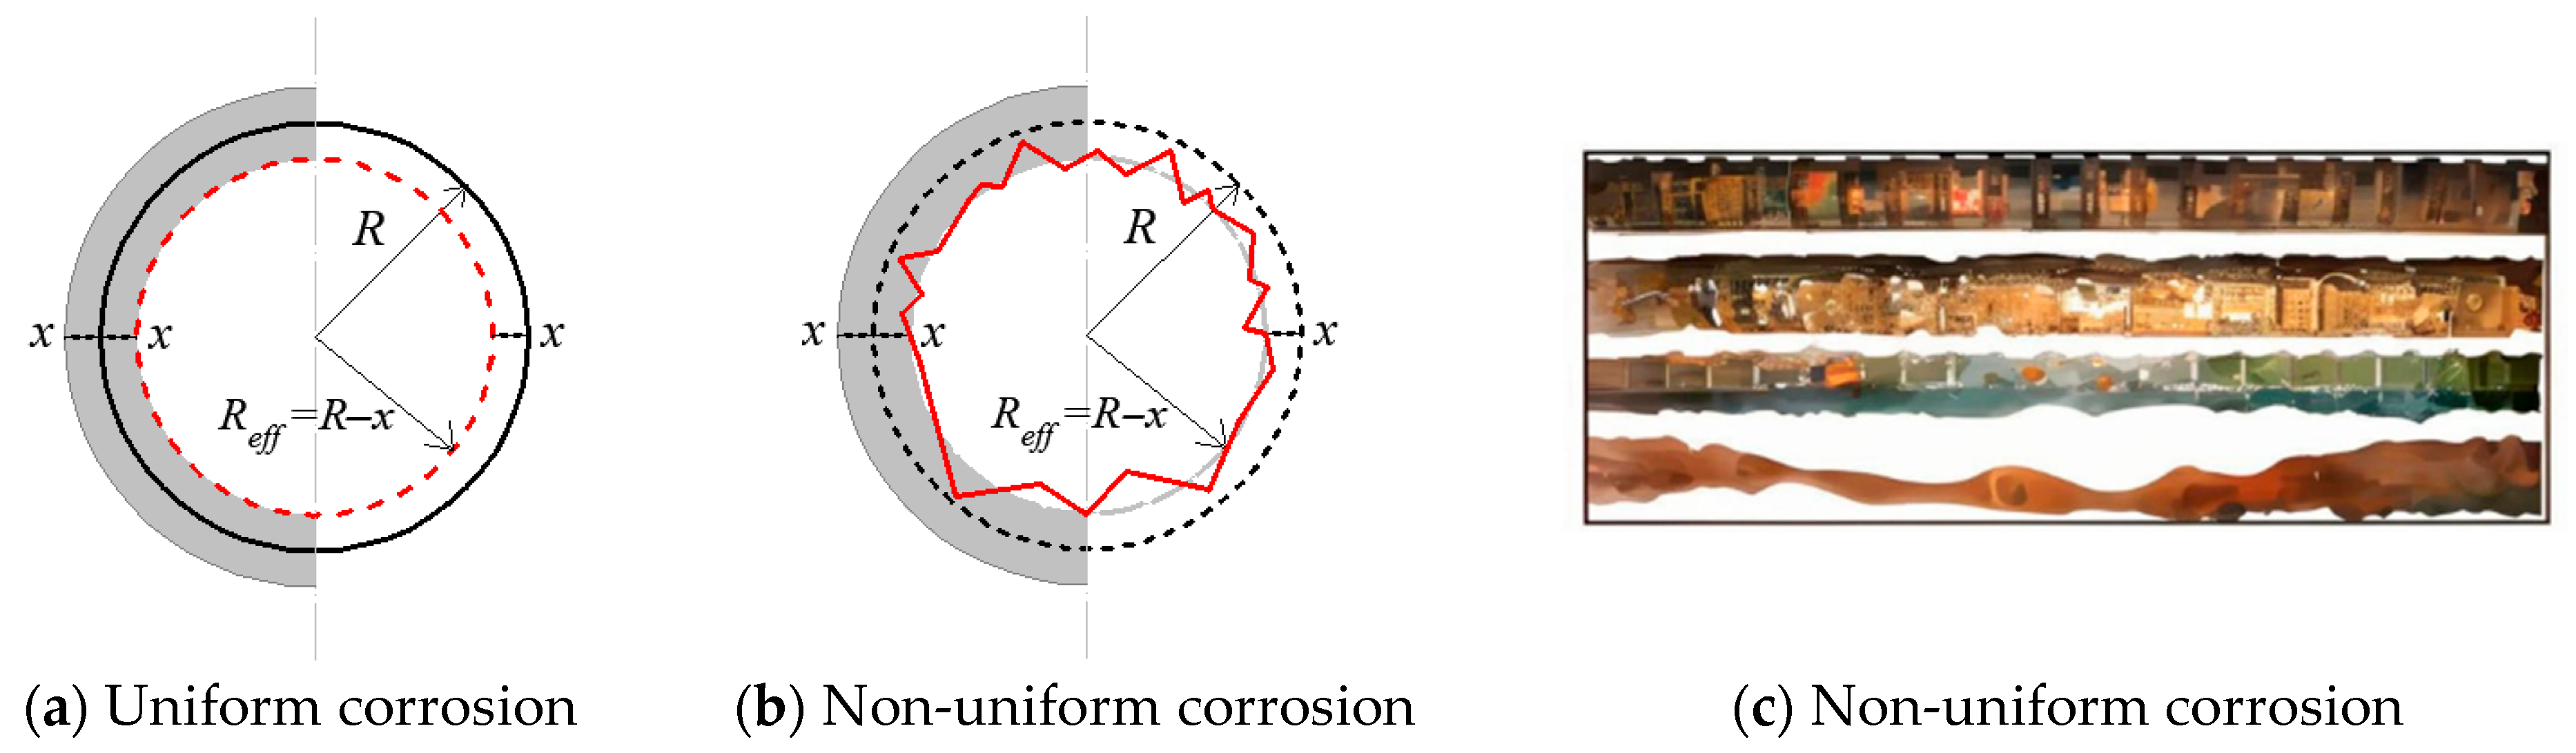
2.1. Corrosion-Induced Reduction in Rebar Cross-Sectional Area

The reduction in the cross-sectional area of corroded rebar is one of the most significant effects of corrosion [31]. Three types of corrosion mechanisms have been reported: (i) uniform corrosion (see Figure 1a), (ii) pitting corrosion (see Figure 1b), and (iii) a combination of both (see Figure 1c). Uniform corrosion may occur due to concrete cover carbonation and/or under low-to-moderate chloride exposure, whereas pitting corrosion typically develops in the presence of chloride ions [35]. Generally, the third one is considered more representative of real-world conditions and is the most complex one [43]. Nonetheless, considering that this study primarily aims to investigate the deterioration mechanism in terms of progressive collapse behavior of multi-story RC frame structures subjected to rebar corrosion—as part of an initial-stage investigation—the relatively simple case of uniform corrosion is adopted herein. Indeed, similar assumptions have been made in other studies [21,28,33,44].
The average loss of the cross-sectional area in the case of uniform corrosion can be calculated if the corrosion penetration depth x is known (see Figure 1a). The original radius of the reinforcing bar is R, while the effective radius after corrosion is Reff = Rx. Consequently, the percentage of cross–sectional area loss α (also referred to as the corrosion level) can be calculated as follows [28,39,44]:
α = Δ A s A s × 100 %
where ΔAs is the area reduction due to corrosion, and As is the nominal area of the non-corroded bar. To account for the time-dependent nature of corrosion, some empirical models can be employed to estimate the corrosion penetration depth x [33,39].

2.2. Corrosion-Induced Deterioration of Rebar Mechanical Properties

The influence of corrosion on the mechanical properties of reinforcing steel—particularly the yield stress and ultimate strength—has been widely investigated in the literature [35]. However, contradictory conclusions have been reported, and further experimental investigations are still needed [33]. Almusallam [45] found that the tensile strength of steel bars was not significantly affected by the degree of corrosion when the actual residual cross-sectional area was considered. In contrast, a notable reduction in tensile strength was observed when the nominal diameter was used for calculations. Du et al. [46] reported a significant decrease in the residual strength of corroded reinforcement. On the other hand, accelerated corrosion tests indicated only a modest loss in strength for bars subjected to localized or pitting corrosion [47,48]. Interestingly, Zhu and François [49] observed an apparent increase in both the effective yield stress and ultimate strength of reinforcements affected by pitting corrosion. These discrepancies highlight the complexity of the problem, which is influenced by multiple factors such as the corrosion environment, the type and diameter of steel, and the experimental procedures employed. Accurately determining the actual residual cross-sectional area at the failure location remains a challenging task [33,50]. Nevertheless, most studies agree that when the actual (reduced) cross-sectional area is used for evaluation, the changes in yield stress and ultimate strength are relatively minor [33]. Therefore, in the following progressive collapse analyses, the reduced cross-sectional area of the rebar at a certain corrosion level is adopted, while no reduction in yield stress or ultimate strength is adopted. This represents a compromise, given the current absence of consensus and experimental validation in the field.

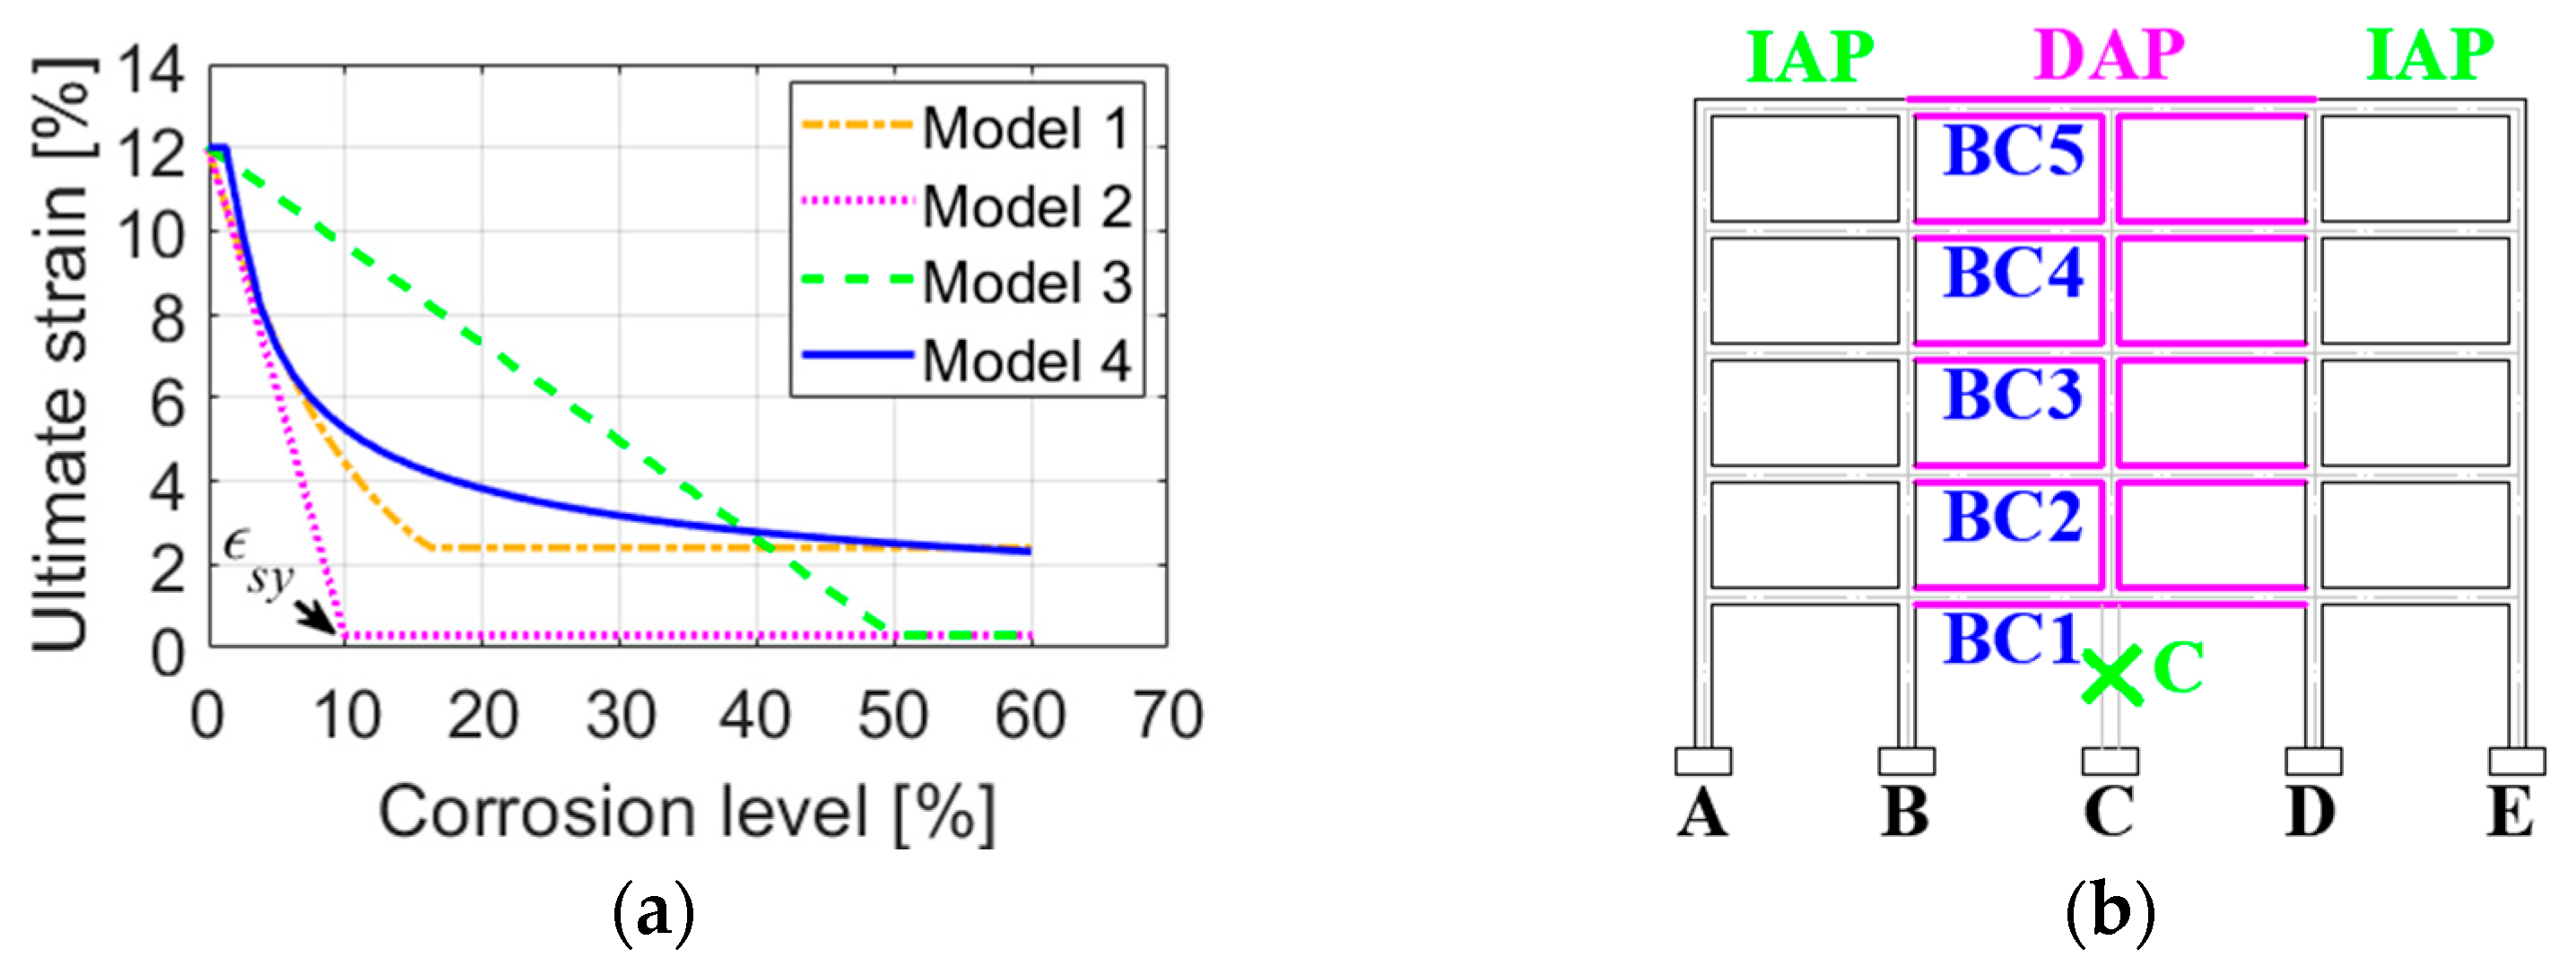
2.3. Corrosion-Induced Deterioration of Steel Ductility in Reinforcing Bars

It has been consistently reported in nearly all experimental studies that rebar corrosion can lead to a significant reduction in the ductility of reinforcing steel, particularly in the presence of pitting corrosion [33,50,51]. Apostolopoulos and Papadakis [47] found that the ductility of reinforcing steel was markedly reduced both under accelerated corrosion conditions and in rebars embedded in real structures that had been exposed to natural corrosion over several years. Moreover, they observed that the loss of ductility was correlated with the loss of cross-sectional area, reporting an exponential decrease in elongation at failure with increasing mass loss. The study by Cairns et al. [48] also showed a considerable reduction in ductility. For instance, a rebar with an 8% reduction in the cross-sectional area experienced approximately 20% loss in ductility. Similarly, Almusallam [45] reported a substantial decrease in steel ductility, with corroded reinforcement becoming significantly more brittle. Based on the fitting of available experimental data, various mathematical models have been proposed to describe ductility degradation. The following four models are reported in the literature:
Model 1: An exponential reduction in ductility is considered as follows [49,50]:
ε s u , c ε s u = e 0.1 α % ,   α 16 %
ε s u , c ε s u = 0.2 ,   α > 16 %
where ɛsu is the ultimate strain of the non-corroded reinforcement; ɛsu,c is the ultimate strain of the corroded reinforcement; and α is the percentage of steel cross-section loss (see Section 2.1).
Model 2: A simply linear reduction model has been proposed by Coronelli and Gambarova, as follows [51]:
ε s u , c ε s u = ε s y ε s u + 1 ε s y ε s u 1 α α max
where ɛsy is the yield strain of the non-corroded reinforcement, and αmax is the percentage of steel cross-sectional area loss with complete loss of ductility (ɛsu,c = ɛsy). Therefore, the parameter αmax is critical for the description of the linear reduction in bar ductility. Different values of αmax have been found based on fitting different experimental results, and a large variation from 0.1 to 0.5 for the value has been reported. According to the experimental results of Castel et al. [52], a value of αmax = 0.1 is adopted for Model 2.
Model 3: Another value of αmax = 0.5 is obtained according to the experimental results of Cairns and Millard [53]. Note that Equation (4) is applied to Model 3 as well. Essentially, these two different values of αmax will result in quite different results, which will be discussed in detail in Section 4.2.
Model 4: the loss of steel ductility is expressed as an exponential reduction model as follows [28,43]:
ε s u , c = ε s u ,   0 α < 0.016 0.1521 α 0.4583 ε s u ,   0.016 α 1

2.4. Influence of Corrosion on Concrete Properties

As the level of reinforcement corrosion increases, significant internal pressure can develop due to the accumulation of corrosion products (e.g., iron oxides) along the surface of the reinforcing bars. This pressure may lead to cracking and spalling of the concrete cover. Consequently, the mechanical properties of both the cover concrete and the core concrete can be adversely affected [28,39,51].
With respect to the cover concrete, the effects of cracking and spalling are typically accounted for by reducing the concrete’s compressive strength [43,51]. The reduced compressive strength of the concrete, denoted as fc*, is expressed as follows:
f c * = f c 1 + κ ( ε c / ε c 1 )
where fc is the concrete peak compressive strength with no reduction; κ is a coefficient related to bar roughness and diameter, where a value of 0.1 has been adopted for medium-diameter ribbed bars [51,54]; εc1 is the concrete peak strain; and εc is the average (smeared) tensile strain in the cracked concrete and is calculated by the following [51]:
ε c = n bar ω c r / b 0
ω c r = 2 π γ r s 1 x
where b0 is the initial section width (no corrosion cracks); nbar is the number of the bars under compression; ωcr is the total crack width for a given corrosion level; γrs is the ratio of volumetric expansion due to corrosion products (Figure 1a), which is set as 2 based on the assumption that all corrosion products accumulate around the corroded bar and are incompressible [34,48]; and x determined by α is the corrosion penetration depth.
With regard to the core concrete, both its strength and ductility may decrease due to the reduced confinement effect provided by the transverse reinforcement, which is weakened as a result of corrosion. When modeling the degraded properties of the core concrete, the reduced cross-sectional area of the corroded transverse bars is taken into account [28].

3. Approaches for Progressive Collapse Analysis

3.1. Alternate Load Path Method

In the context of progressive collapse analysis for RC building structures, the threat-independent alternate load path method is a widely accepted approach for assessing structural response under notional column removal scenarios; see Figure 2a. Two primary approaches for applying the alternate load path method are the nonlinear static and nonlinear dynamic analyses, which allow for the evaluation of structural robustness under column removal scenarios [17,26,55]. Within this framework, a key load-bearing column is removed—either gradually or suddenly—from the intact structural system. The residual structure is then analyzed to determine whether the resulting deformations and internal forces remain within predefined limits, thereby evaluating its capacity to resist progressive collapse [9,17,56,57].
In nonlinear static (pushdown) analysis [19,23,58], a load-bearing column is gradually removed, and downward loads or forces are subsequently applied to the remaining structure. A displacement-controlled loading protocol is employed, with the nodal point at the top of the removed column serving as the control point. The vertical displacement at this location is then gradually increased and continuously recorded throughout the analysis. As a result, a load–displacement curve (i.e., the pushdown curve in Figure 2b) is generated, which provides insights into the static structural behavior and progressive collapse mechanism under the considered scenario.
Given that the structural response to a sudden column loss is inherently dynamic, the nonlinear time–history analysis (NTHA) is considered the most accurate method for capturing the associated dynamic behavior [56,59]. However, since a single NTHA simulation only provides the dynamic response of the structural system under a specific load level (see Figure 2c), a series of such analyses—referred to as incremental dynamic analysis (IDA) [12,59,60,61,62]—is required to construct the dynamic capacity curve or determine the ultimate load-bearing capacity [18,26,63]. In the IDA procedure, downward loads or forces are progressively increased in successive steps according to the relation Pi+1 = Pi + ΔP, where ΔP denotes the load increment [6,12,19]. A separate NTHA is conducted for each load level Pi, fully accounting for dynamic effects. As the structural response becomes highly nonlinear near the ultimate load capacity, the load increment ΔP is typically reduced to ensure accurate determination of the collapse limit. For each NTHA, the peak displacement from the time–history response at the column-removed joint (i.e., the nodal point previously located at the top of the removed column) is extracted. These results are then compiled to generate the load–displacement envelope, also known as the dynamic capacity curve (i.e., the IDA curve in Figure 2b) [6,12,64], which serves as a key tool for evaluating the structural dynamic performance against progressive collapse.
Although IDA is an accurate method for capturing dynamic structural responses, it is computationally intensive and relatively complex to implement [17,25,65]. As an alternative, the energy-based method (EBM) [23,26,66], which has been successfully applied in assessing the maximum dynamic response under sudden column loss scenarios [7,23,34,67], offers a simplified yet effective approach for determining the dynamic capacity curve and the approximate ultimate load-bearing capacity. The EBM is grounded in the principle of conservation of energy [26,68]; i.e., the strain energy equals the potential energy or SE = PE in Figure 2b at the moment of the peak point in the time–history displacement response in Figure 2c. Specifically, the area under the nonlinear pushdown curve (see Figure 2b) represents the energy absorbed by the structure under increasing downward loads. An approximate dynamic capacity curve (i.e., the EBM curve in Figure 2b) can then be estimated by dividing the accumulated stored energy at each displacement level by the corresponding displacement, according to the following expression [7,34,69]:
Q d ( u d ) = 1 u d 0 u d Q S ( u ) d u
where QS(u) and Qd(u) denote the loads corresponding to the static and approximated dynamic load–displacement curves, respectively, at the same displacement ud.

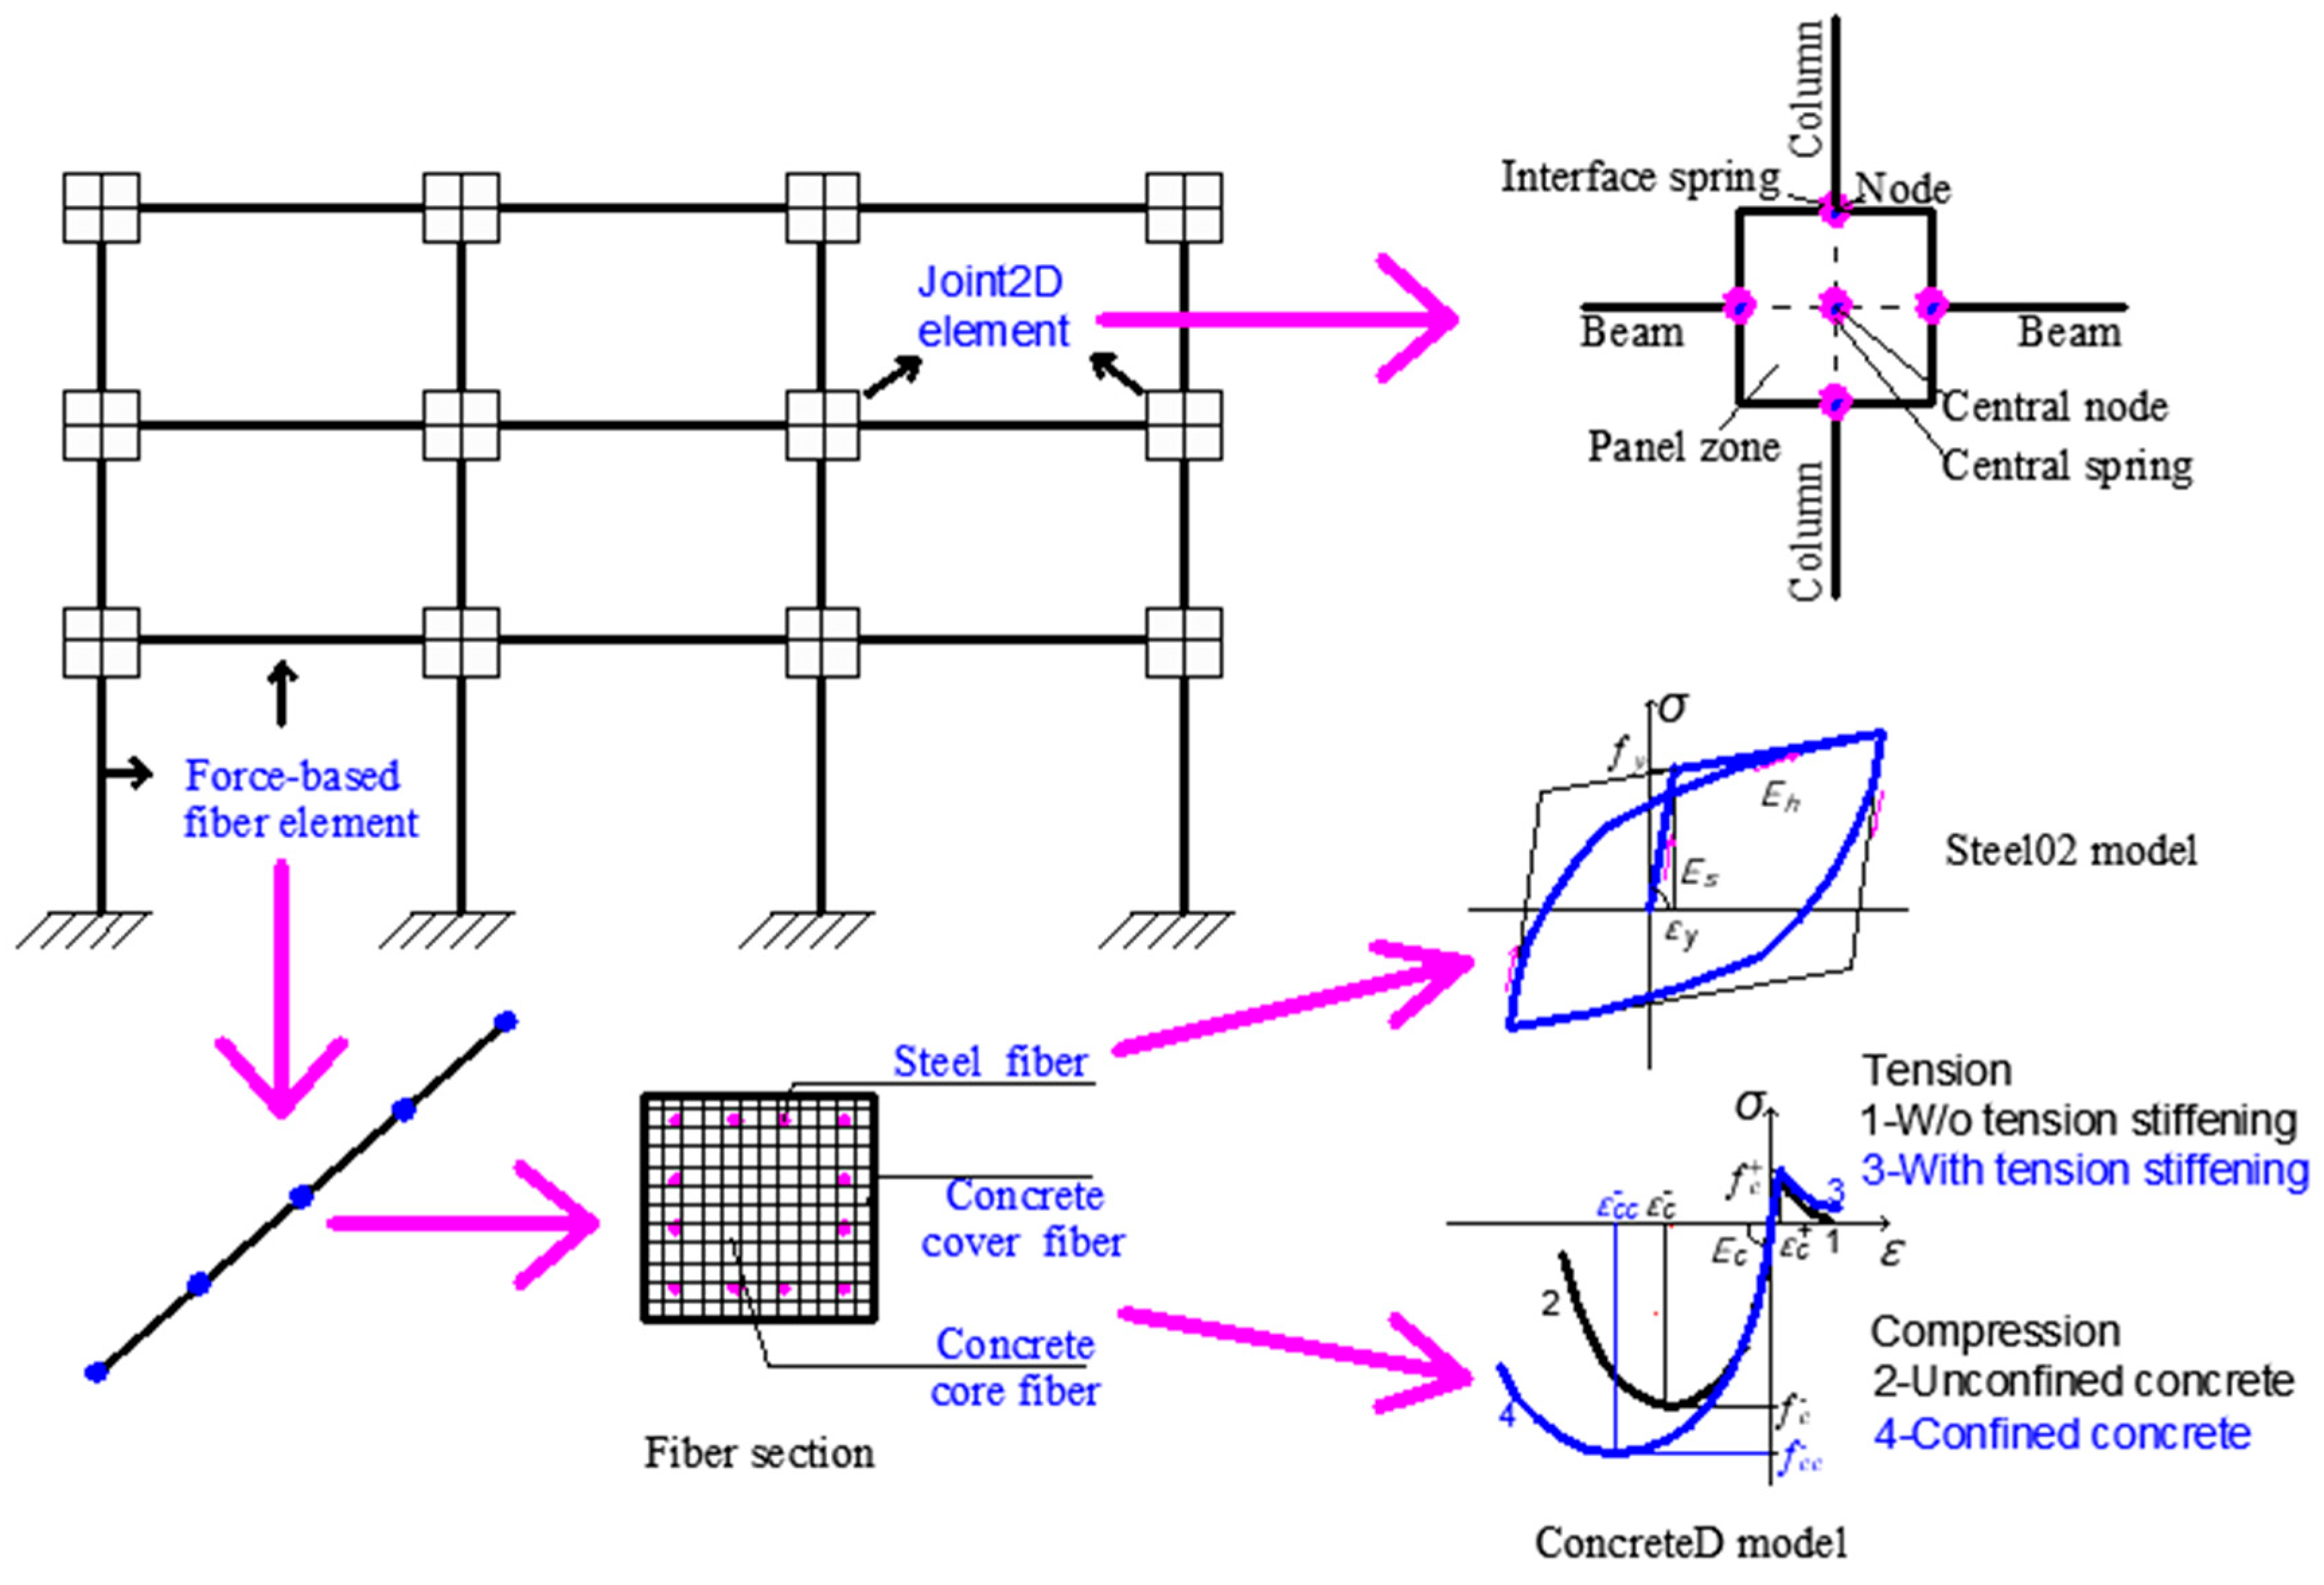
3.2. Numerical Modeling Techniques

The software package OpenSees v3.7.1 [70] is adopted to build finite element models of RC frame structures and to perform progressive analyses in the following sections. The force-based beam–column fiber element is employed to simulate the beam and column components [71]. The cross-section of the fiber element is discretized into fibers (Figure 3) which are subjected to a uniaxial stress state. Hence, different stress–strain relationships can be assigned to the different fibers. Eventually, the mechanical behavior of the section can be obtained by integrating the whole section [72,73]. Regarding beam-to-column connections, the Joint2D element (Figure 3) in OpenSees is adopted. The nonlinear shear behavior of the joints is determined by the modified compression-filed theory [71,74,75]. Additionally, the co-rotational transformation is used to consider geometrical nonlinearity [34]. The uniaxial plastic damage model in OpenSees, i.e., the ConcreteD material [71], is used for concrete fibers. The confinement effect caused by stirrups on the compressive behavior of concrete material is taken into account through the Mander model [76]; see curve 2 vs. curve 4 in Figure 3. The tension stiffening effect using the model by Stevens et al. [77] is adopted, reflecting the effect of longitudinal reinforcement (curve 1 vs. curve 3 in Figure 3). The uniaxial Giuffre–Menegotto–Pinto steel material model, i.e., the Steel02 material model [71,78], is used for reinforcing steel (Figure 3). Furthermore, the Min–Max material is applied to the constitutive models to reflect material failure, such as reinforcement fracture and concrete crushing [70,71]. More details can be found in relevant references [19,26,28,55,59].

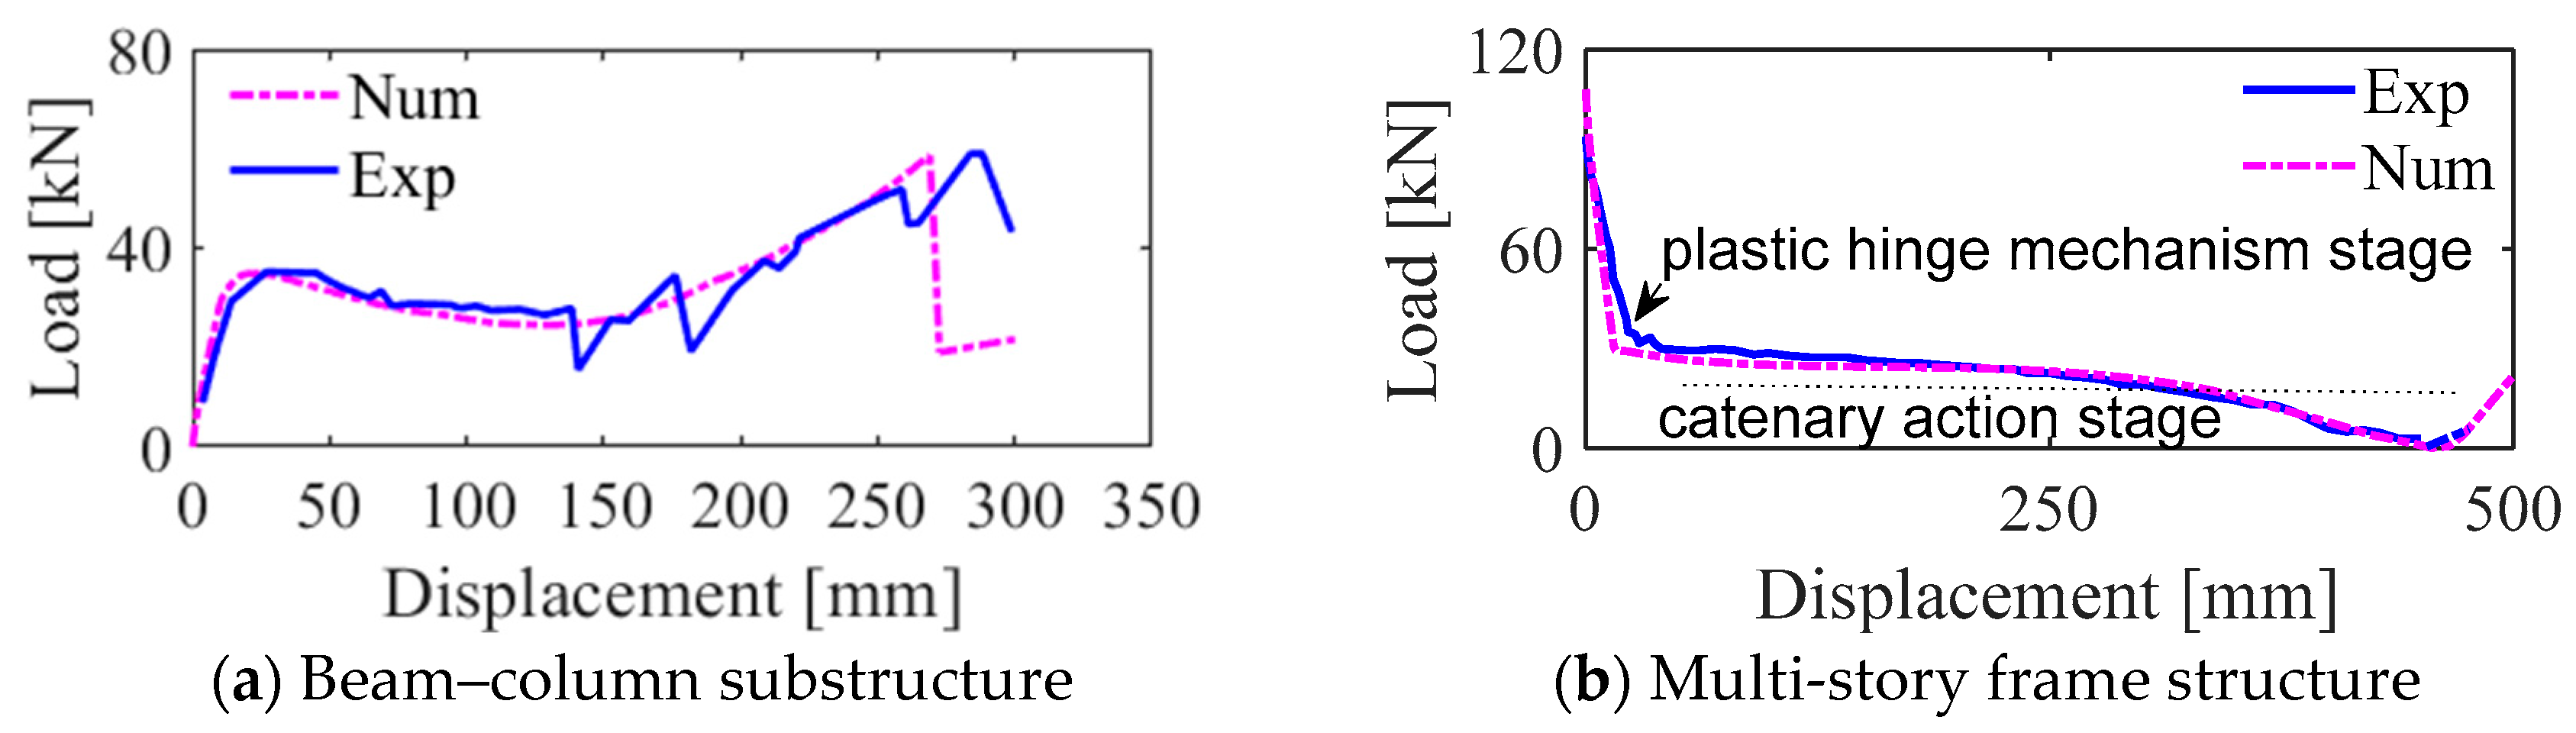
3.3. Validation of Numerical Modeling Strategies

Two experimental specimens on the progressive collapse tests of RC frame structures under column removal conditions are employed. The first one is the specimen P2 tested by Qian et al. [79]. It is a RC beam–column substructure subjected to the middle column loss. The other experimental setup consists of a 1/3-scale RC frame structure with three stories and four bays subjected to the ground-floor middle column loss, as tested by Yi et al. [80]. Further details regarding the experimental tests, including the configurations, geometric dimensions, and material properties, can be found in the two associated references [79,80]. Following this, two distinct numerical models are constructed by applying the described modeling strategies in Figure 3. Using the same material parameters and loading procedures, corresponding progressive collapse analyses are conducted. Figure 4a shows the comparison of the numerical and the experimental curves of the concentrated load imposed on the structure against the vertical displacement at the mid-span, while Figure 4b shows the comparison of the numerical and the experimental curves of the load in the column against the vertical displacement at the top of the removed column. Despite slight discrepancies along certain portions of the curves, the numerical results show good agreement with the experimental data, demonstrating that both the compressive arch action and the tensile catenary action are accurately captured in the simulations. The effectiveness of the numerical modeling strategies is thus confirmed through a comparison with experimental results.

4. Case Study: Structural Description and Results

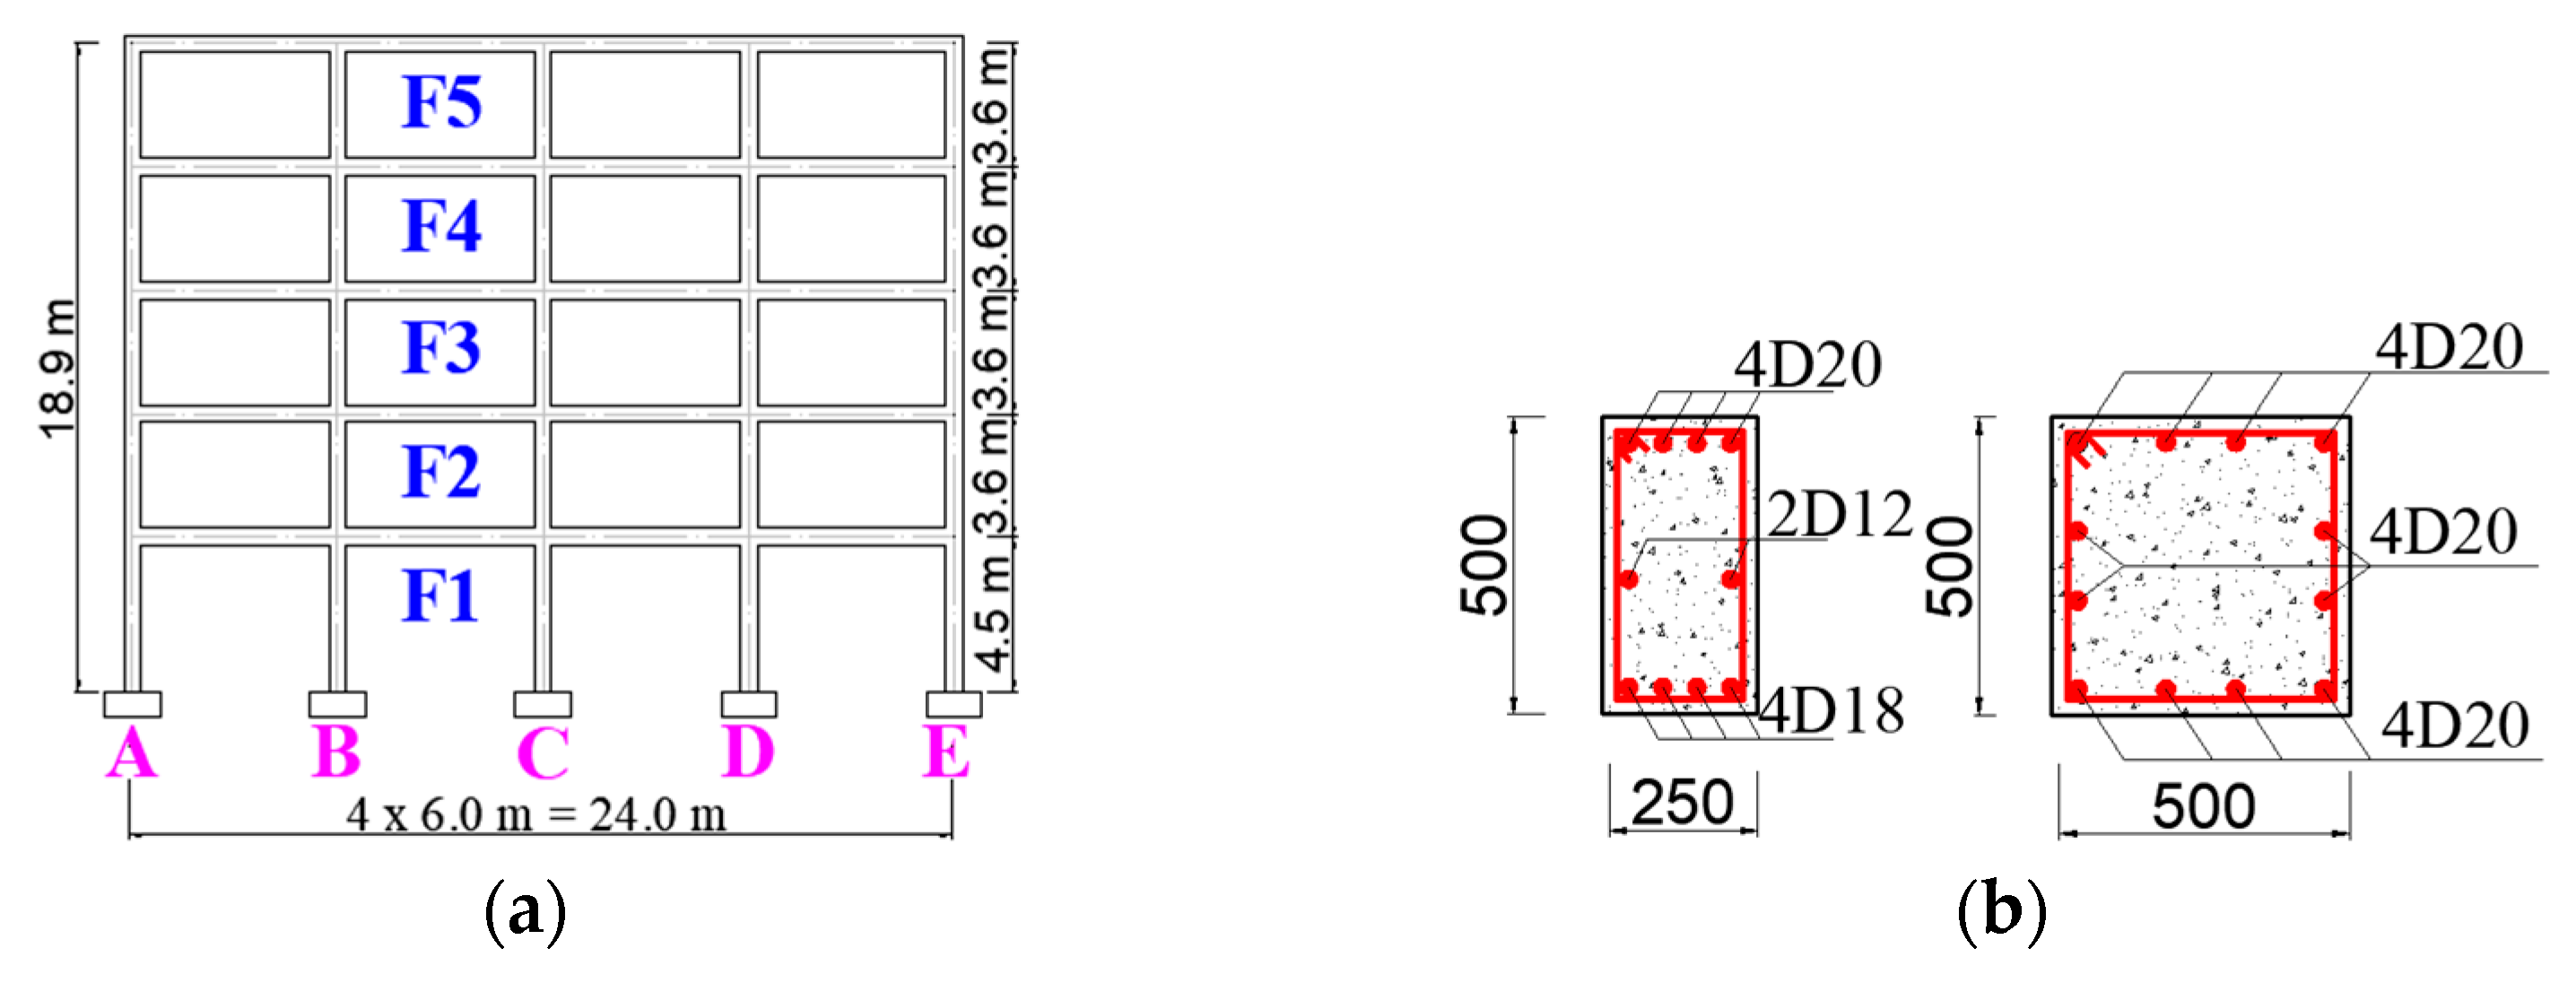
4.1. Description of the RC Frame Structure

A five-story and four-bay RC frame [39] designed in accordance with the Eurocodes [81,82] is considered in this work. As illustrated in Figure 5, the frame is representative of a typical structural unit in an office building. The first story has a height of 4.5 m, while the remaining four stories are each 3.6 m in height. Each bay spans 6.0 m, and the spacing between adjacent frames is also 6.0 m. Detailed cross-sectional dimensions and reinforcement layouts for beams and columns are provided in Figure 5b. Beams have a cross-section of 250 mm × 500 mm, and columns measure 500 mm × 500 mm. A concrete cover of 30 mm is applied to all structural elements. The characteristic dead load for both floor and roof slabs is assumed to be 5.0 kN/m2, while the corresponding live load is taken as 3.0 kN/m2 [81]. Column lines are labeled from left to right as A, B, C, D, and E (see Figure 5a).
Concrete of class C20/25 [82] is adopted, with a characteristic cylinder compressive strength of fck = 20 MPa. According to the fib Model Codes [83], the mean compressive strength can be estimated as fc = fck + 8 = 28 MPa, while the mean tensile strength is given by fct = 0.3 (fck)2/3 = 2.2 MPa. For the reinforcing steel, the characteristic yield and ultimate tensile strengths are fyk = 500 MPa and fuk = 575 MPa, respectively, corresponding to ductility class C [82]. Based on the JCSS Probabilistic Model Code [84], the mean values of the yield and tensile strengths are assumed to be fy = fyk + 2σ1 = 560 MPa and fu = fuk + 2σ2 = 655 MPa, where the standard deviations are taken as σ1 = 30 MPa and σ2 = 40 MPa, respectively. The ultimate strain εu is assumed to be 12% [28]. The modulus of elasticity for the steel is adopted as Es = 205 GPa. A summary of the mechanical properties for both concrete and reinforcement is provided in Table 1.
A numerical model of the RC frame depicted in Figure 5 is constructed in OpenSees, following the modeling framework presented in Figure 3. The model incorporates the mean values of the material properties discussed previously and serves as the basis for the numerical analyses carried out in the ensuing sections.

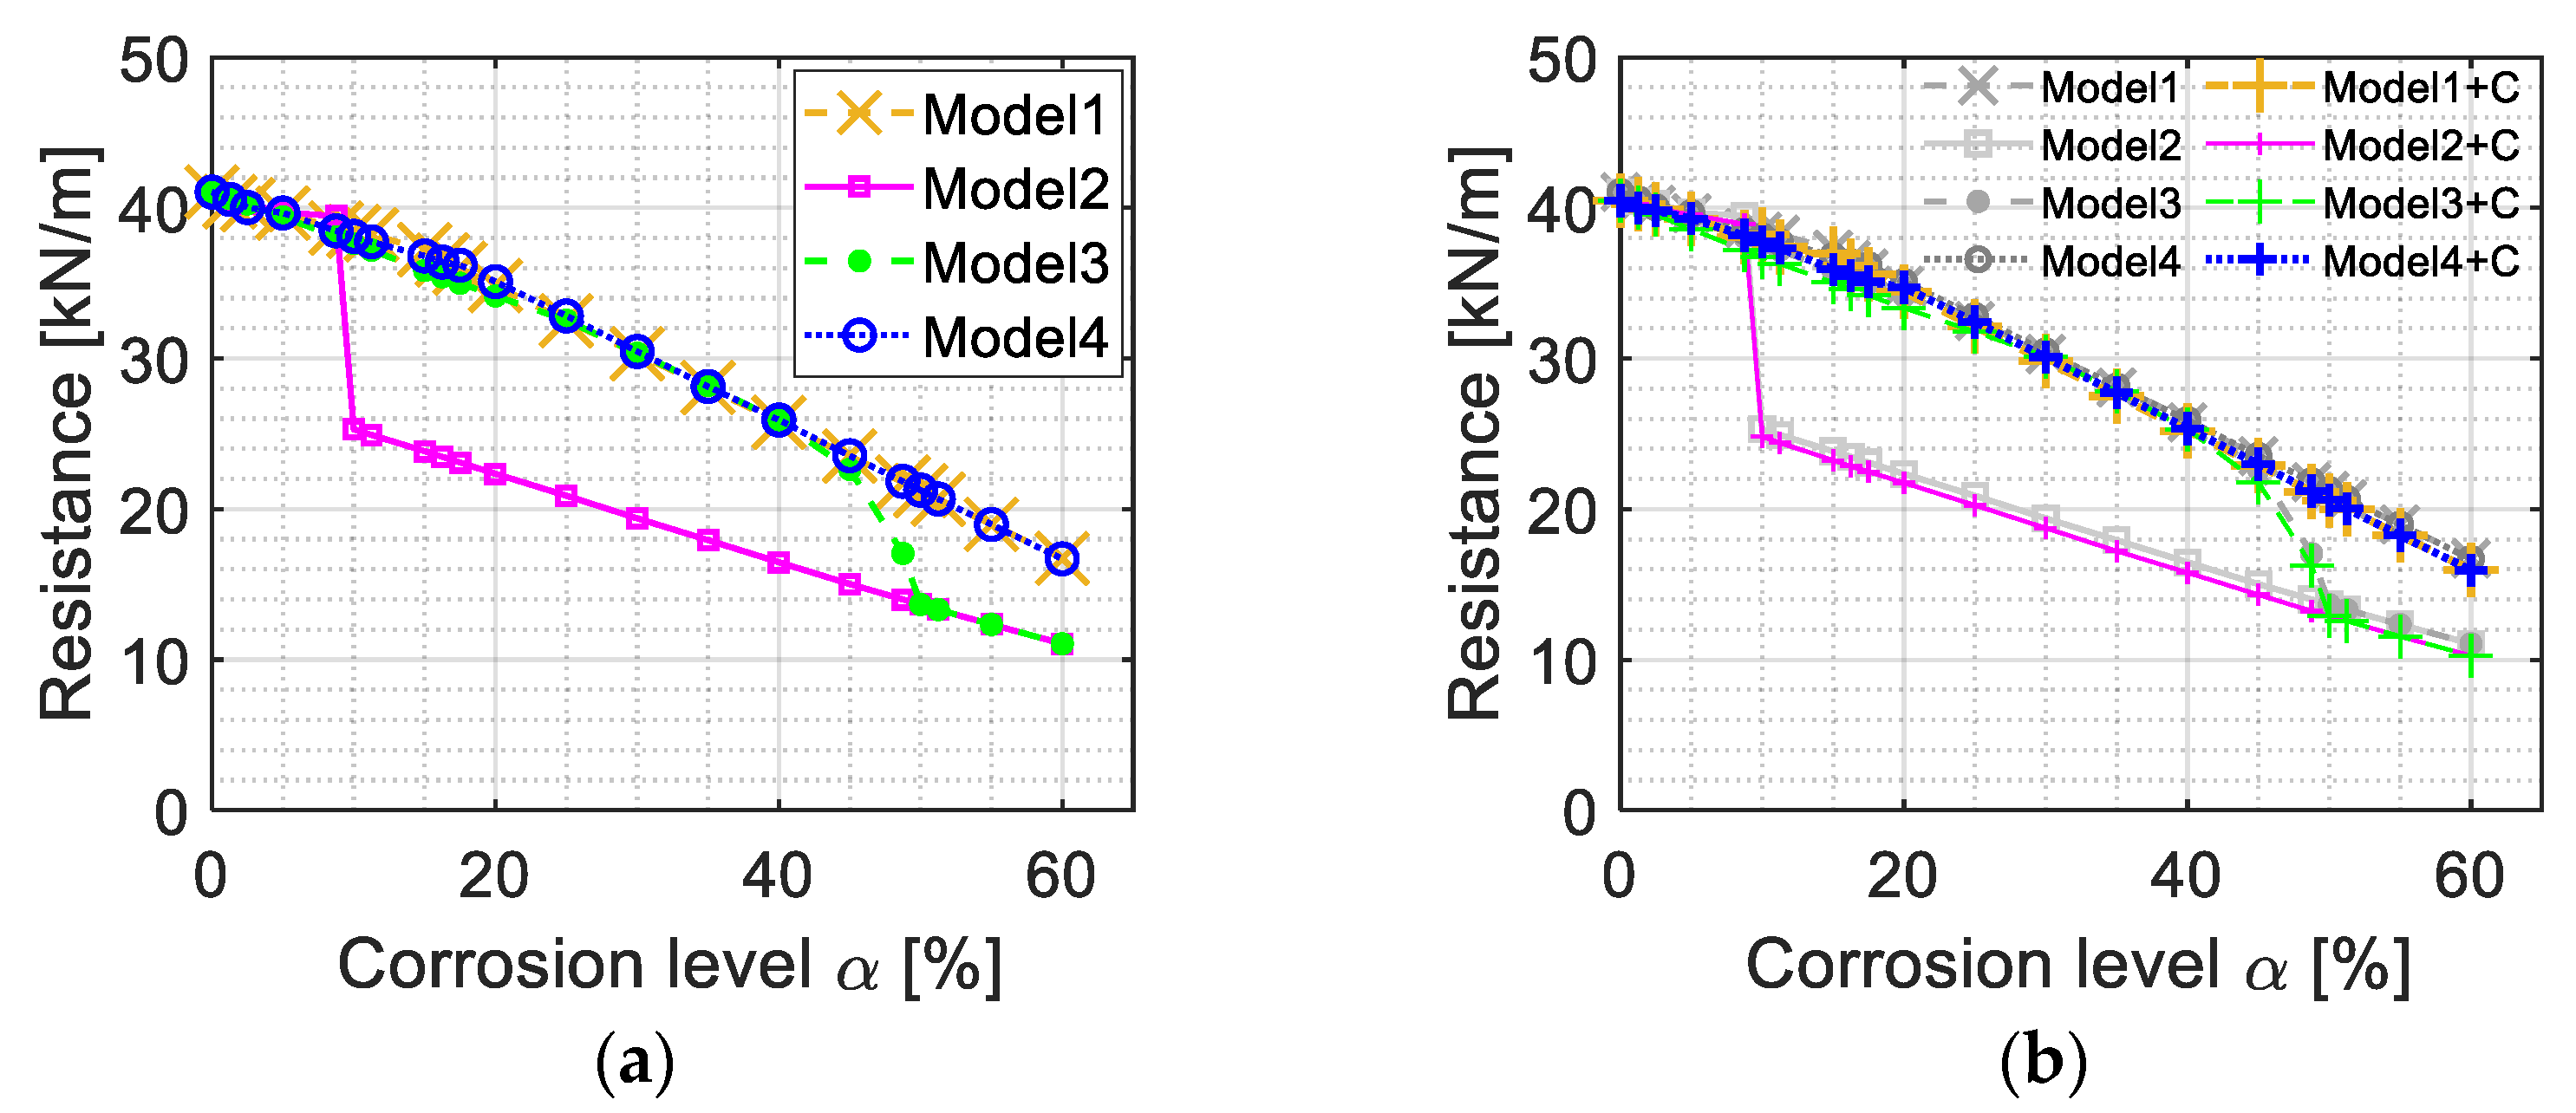
4.2. Influence of Different Material Deterioration: Reinforceing Steel and Concrete

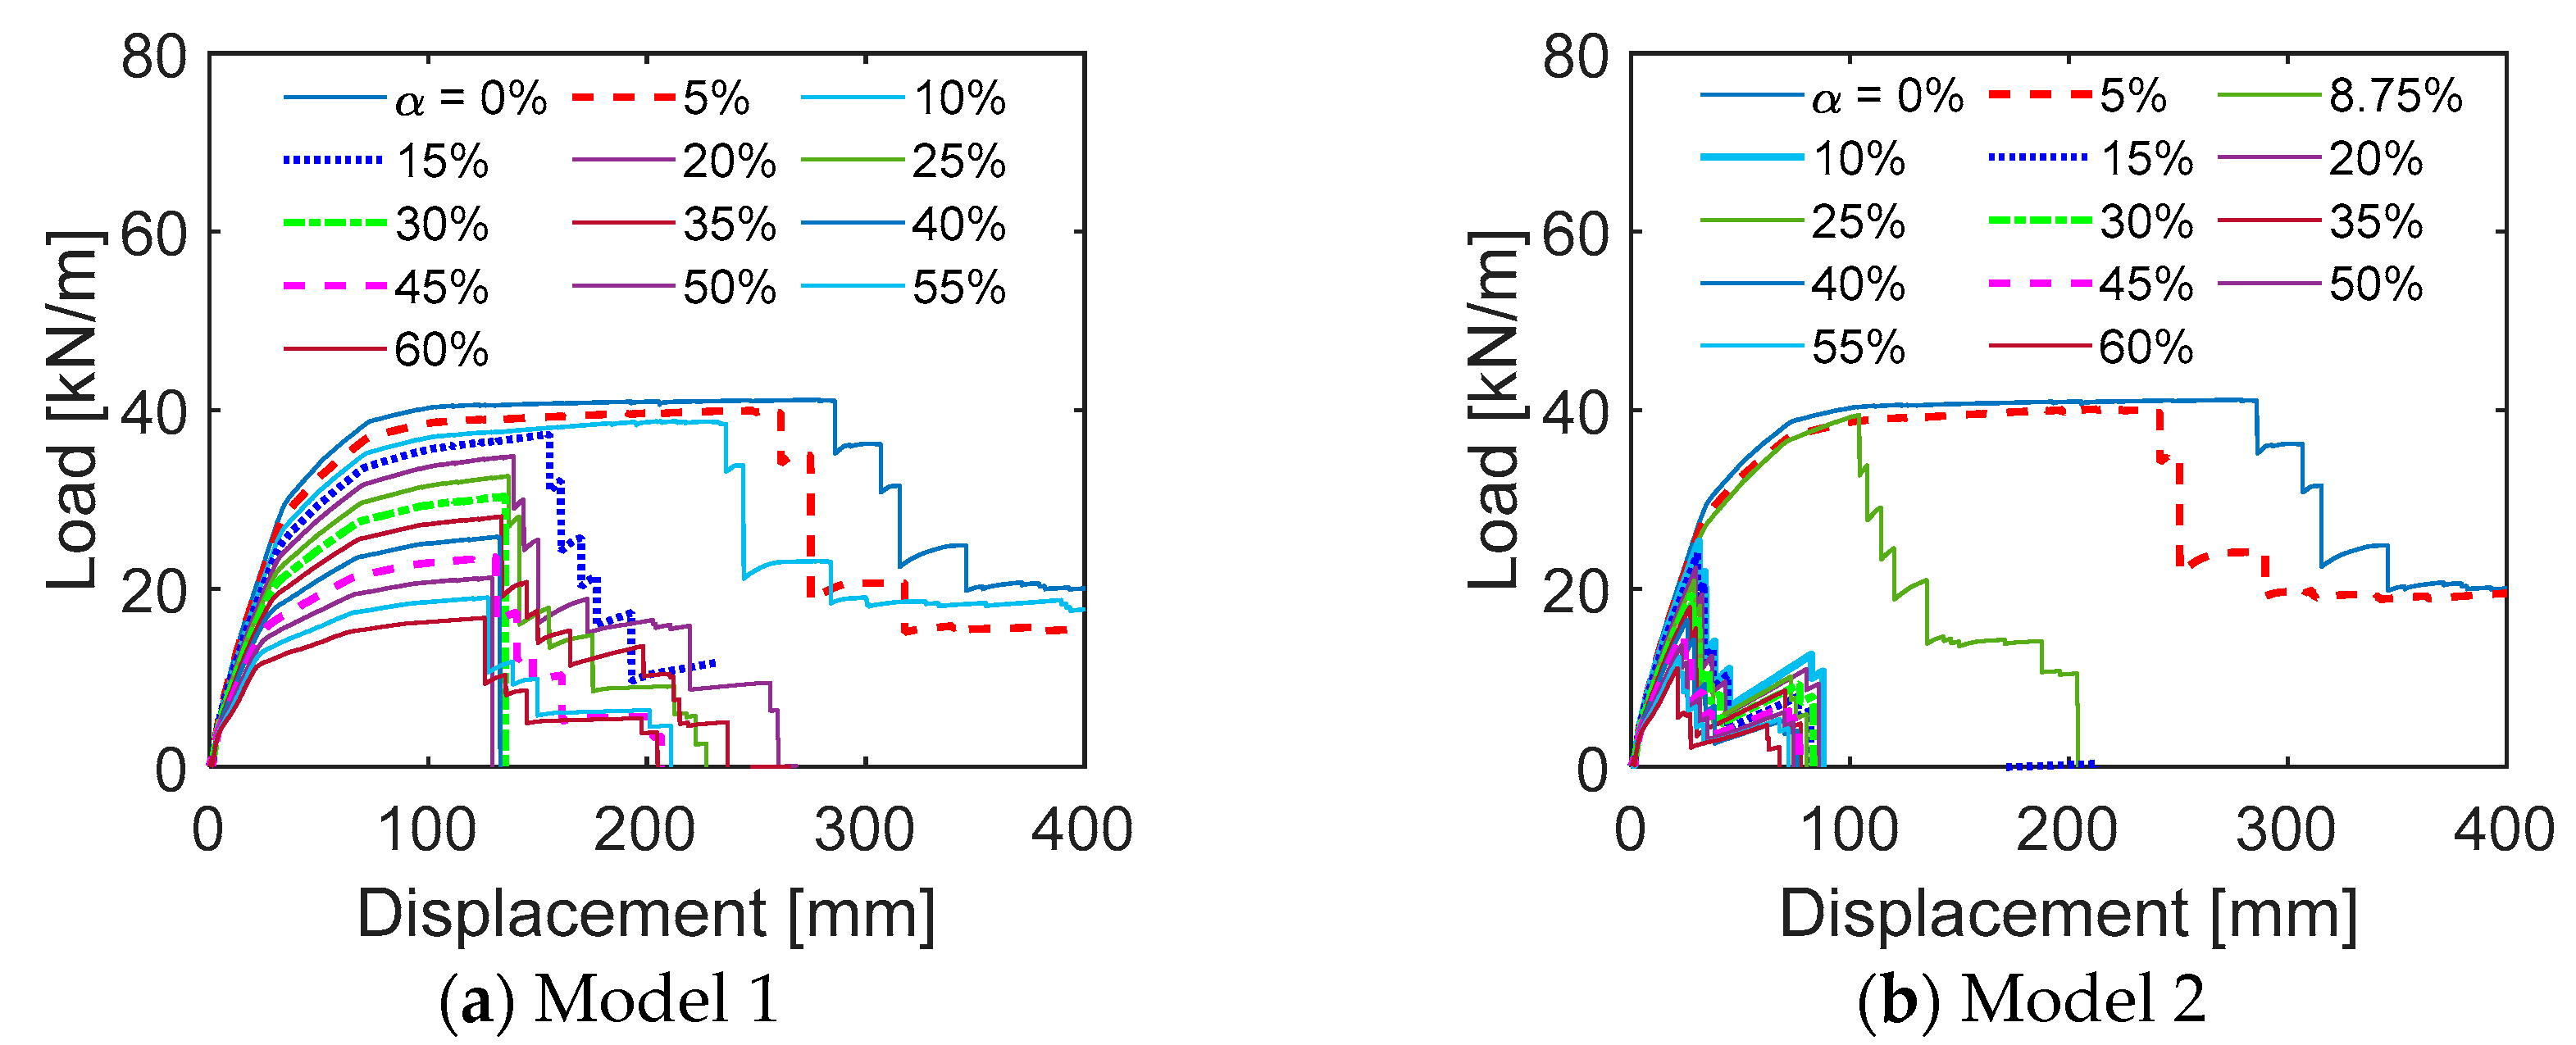
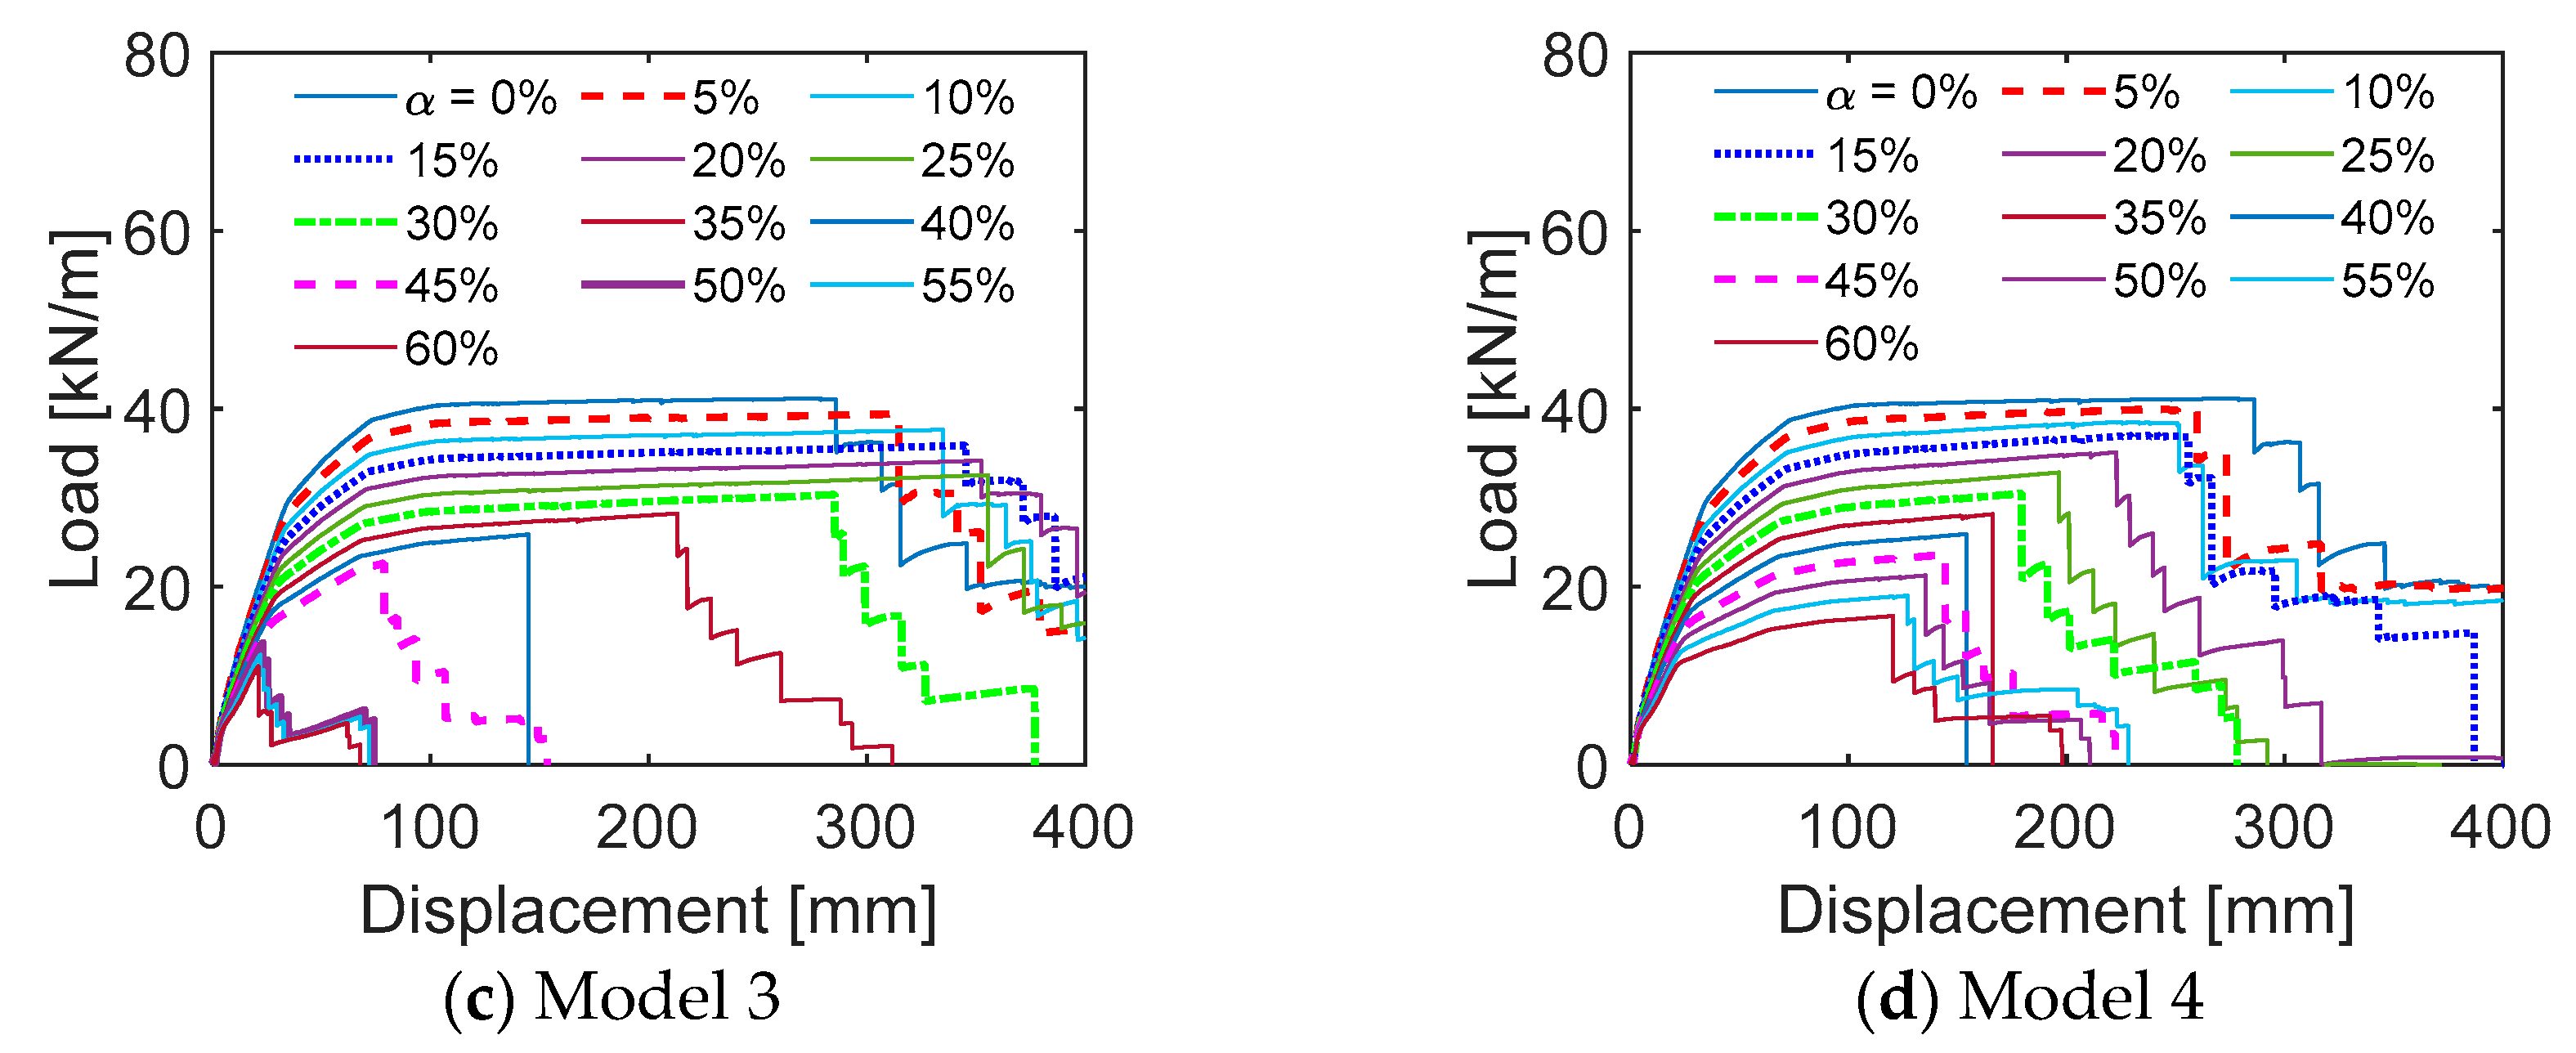
4.2.1. Deterioration of Properties Regarding Corroded Reinforcing Steel

Based on the discussion presented in Section 2.2, no reduction in yield stress or ultimate tensile strength is applied when the actual residual cross-sectional area of the corroded reinforcement is considered. With respect to the four mathematical models introduced in Section 2.3, Figure 6a illustrates the variation in steel ultimate strain as a function of corrosion level (ranging from α = 0 to 60%). Models 1 and 4 exhibit an exponential decreasing trend, with relatively small differences between them. The curve for Model 4 appears smoother, whereas the curve for Model 1 initially decreases and then stabilizes after α = 16%, reaching a constant value of ɛsu,c = 2.4%. In contrast, Models 2 and 3 both show a linear decrease in ultimate strain up to the point where the yield strain ɛsy is reached—indicating the complete loss of steel ductility. However, Model 2 predicts a significantly faster reduction in ultimate strain compared to Model 3. This difference arises from the use of different maximum corrosion levels: α max = 0.1 for Model 2 and α max = 0.5 for Model 3. Consequently, the ultimate strain in Model 2 decreases rapidly from α = 0 to 10%, approaching the yield strain, while that in Model 3 decreases linearly over a much wider range, from α = 0% to 50%, at a slower rate. Among all four models, Model 2 consistently yields the lowest values of reduced ultimate strain across all corrosion levels. Model 3 initially provides the highest ultimate strain but becomes lower than Models 1 and 4, beyond almost α = 40%.
The four models are subsequently employed to conduct nonlinear static pushdown analyses (as described in Section 3.1), considering the removal of the central ground-floor column C (see Figure 6b). It is assumed that all beams and columns are exposed on four sides and that the reinforcements in both beams and columns are subjected to uniform corrosion. In the pushdown analysis, uniformly distributed vertical loads are gradually applied to all beams. A displacement-controlled procedure is adopted, with the vertical displacement at the top of the removed column C being controlled. The analyses are conducted by individually incorporating Models 1 to 4 to account for the reduction in steel ultimate strain, considering varying corrosion levels ranging from α = 0% to 60%. The displacement at the control point is recorded throughout the analysis, resulting in the pushdown curves presented in Figure 7. It can be observed that the static pushdown curves shift downward with increasing corrosion level. This trend is expected, as higher corrosion levels lead to greater reductions in the cross-sectional area, which significantly reduces the structural stiffness.
Figure 7a presents the static load–displacement curves (i.e., pushdown curves) for Model 1 under varying corrosion levels α. As the corrosion level increases, the structural failure becomes increasingly brittle. The ultimate displacement corresponding to the peak load-bearing capacity decreases rapidly before almost α = 16.25% and subsequently changes at a slower rate. This behavior aligns with the trend observed in Model 1, where the steel ultimate strain decreases from α = 0% to 16% and remains constant thereafter (see Figure 6a). It is worth noting that different failure modes can be identified across various corrosion levels. In general, the first failure in the structural system is critical, as it corresponds to the ultimate static load-bearing capacity and marks the onset of global failure with reducing load-carrying capacity. For corrosion levels α ≤ 10%, the initial failure occurs at the left beam ends of BC1 (Figure 6b), primarily due to concrete crushing. When α = 15% and 20%, the first failure shifts to the left beam ends of BC2. For α > 30%, nearly simultaneous failures—either concrete crushing or reinforcement rupture—occur at the beam ends of BC1 to BC5.
Figure 7b,c present the load–displacement curves (i.e., pushdown curves) for Models 2 and 3, respectively. It is evident that, in the case of Model 2, both the ultimate load-bearing capacity and the corresponding displacement decrease sharply when α ≥ 10%. A similar trend is observed for Model 3, but this significant reduction occurs at a higher corrosion level, specifically when α ≥ 50%. This behavior can be attributed to the complete loss of steel ductility at α = 10% and 50% for Models 2 and 3, respectively—values that correspond directly to the model parameters αmax shown in Figure 6a. As with Model 1, the ultimate load-bearing capacity is reached at the point of first failure. The failure modes evolve with increasing corrosion levels, with the location of the initial failure shifting across different floors and beam ends of BC1 to BC5 (see Figure 6b). Notably, in the case of Model 3, the ultimate displacement at first failure increases significantly before α = 25% (Figure 7c), even though the ultimate strain continues to decrease. This phenomenon can be explained by the combined influence of both the reduced ultimate strain and the decreasing corroded bar diameter on the rotational capacity of the beams.
Figure 7d presents the load–displacement curves for Model 4. In general, both the ultimate load-bearing capacity and the corresponding displacement decrease with increasing corrosion levels. The ultimate load is consistently reached at the point of first failure, although different failure modes—involving various beam ends of BC1 to BC5—are observed across different corrosion levels.
The ultimate load-bearing capacities obtained from the results in Figure 7 are summarized as a function of corrosion level and presented in Figure 8a. It can be observed that nearly identical trends are produced by Models 1 and 4, despite differences in ultimate displacement and failure modes (Figure 7). A sharp drop in load capacity is evident at almost α = 10% for Model 2, which corresponds to the rapid reduction in steel ultimate strain to its yield strain (i.e., αmax = 10%), indicating a complete loss of ductility. The curve for Model 3 initially aligns closely with those of Models 1 and 4, followed by an accelerated decline after α = 45%. Beyond α = 50%, the response becomes indistinguishable from that of Model 2, as the steel ultimate strains in both models decrease to the yield strain.
Compared to the abrupt reduction observed in Model 2 at α = 10% and in Model 3 at α = 45% (Figure 8a), the decrease in load-carrying capacity predicted by Models 1 and 4 is significantly more gradual. It can be attributed to the near-complete loss of ductility under these conditions by Models 2 and 3 (Figure 6a). This behavior is further supported by Models 1 and 4, where no significant acceleration in degradation is observed as the residual ductility remains relatively high (ɛsu,c/ɛsu ≥ 20%). Castel et al. [52] conducted tensile tests on notched rebars and found that ductility decreases exponentially before stabilizing at approximately ɛsu,c/ɛsu = 25% of the initial value. Additionally, studies by other researchers [34,85] have shown that the load-carrying capacity of RC beams or frames typically decreases in a stable manner and may even follow a linear relationship with the loss of material due to corrosion. However, it is difficult to determine which model is the most realistic without further experimental validation. More extensive experimental evidence is required to interpret the results, particularly when assessing structural performance at higher corrosion levels.
The different models yield varying structural responses and failure modes, highlighting the importance of selecting an appropriate model for accurate structural assessment. Based on the previous results, it can be observed that Models 2 and 3 may provide overly conservative estimates due to the near-complete loss of steel ductility. In contrast, this trend is not observed in Models 1 and 4. Furthermore, the first failure consistently occurs in the bays directly above the removed column, although the specific beam end at which failure initiates varies depending on the corrosion level and the adopted model.

4.2.2. Deterioration of Concrete Properties

Based on the model introduced in Section 2.4, the cracking and spalling of compressed concrete are simulated by reducing the compressive strength of the cover concrete, while the confinement effect on the core concrete is determined based on the condition of the corroded transverse reinforcement. It should be noted that, at any given moment, all reinforcing bars are assumed to experience the same corrosion level [28,33,44].
Both the deterioration of reinforcing steel and concrete in the RC frame are considered, with reinforcement corrosion being the primary influencing factor [46,48]. As in previous analyses, the frame is assumed to experience the loss of the central ground-floor column C (Figure 6b), and pushdown analyses—identical to those described in Section 4.2.1—are conducted. All four deterioration models related to steel ultimate strain are evaluated. The results of structural resistance as a function of corrosion level α are presented in Figure 8b (labeled as ‘Model X + C’). A similar trend is observed when compared with the corresponding results without considering concrete deterioration (labeled as ‘Model X’). In all four cases, the influence of concrete deterioration on progressive collapse performance appears to be minimal, resulting in only a slight reduction in load-bearing capacity. This indicates that reinforcement corrosion is the dominant factor contributing to the degradation of progressive collapse resistance in RC structures. A study by [34] reported that the ultimate progressive collapse capacity depends largely on the tensile forces provided by the reinforcements, as the governing load-carrying mechanism was found to be tensile catenary action in that investigation.

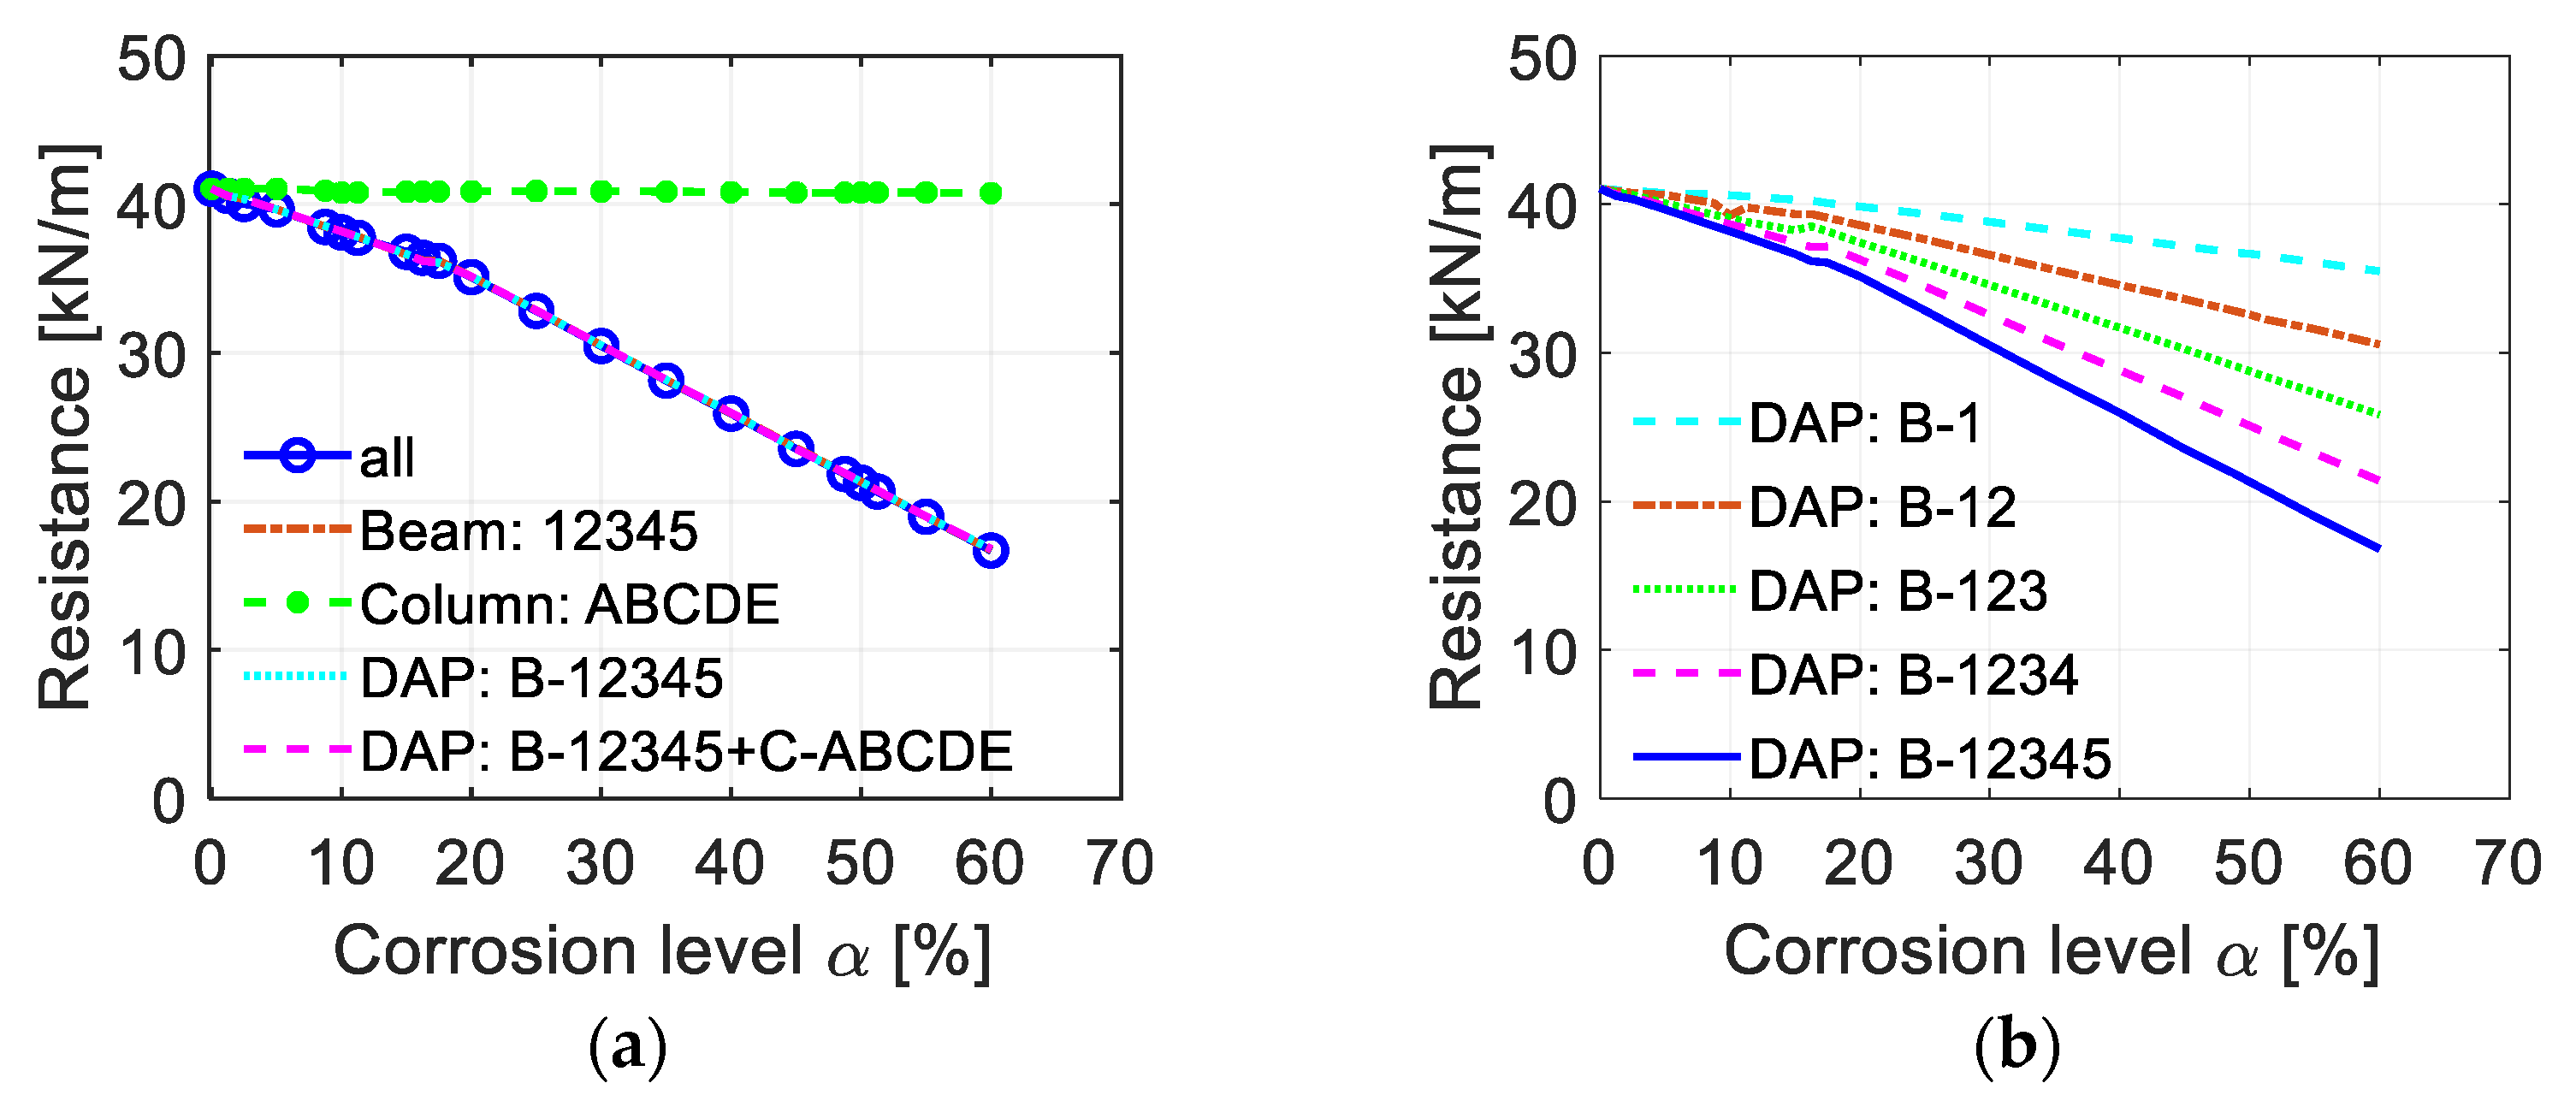
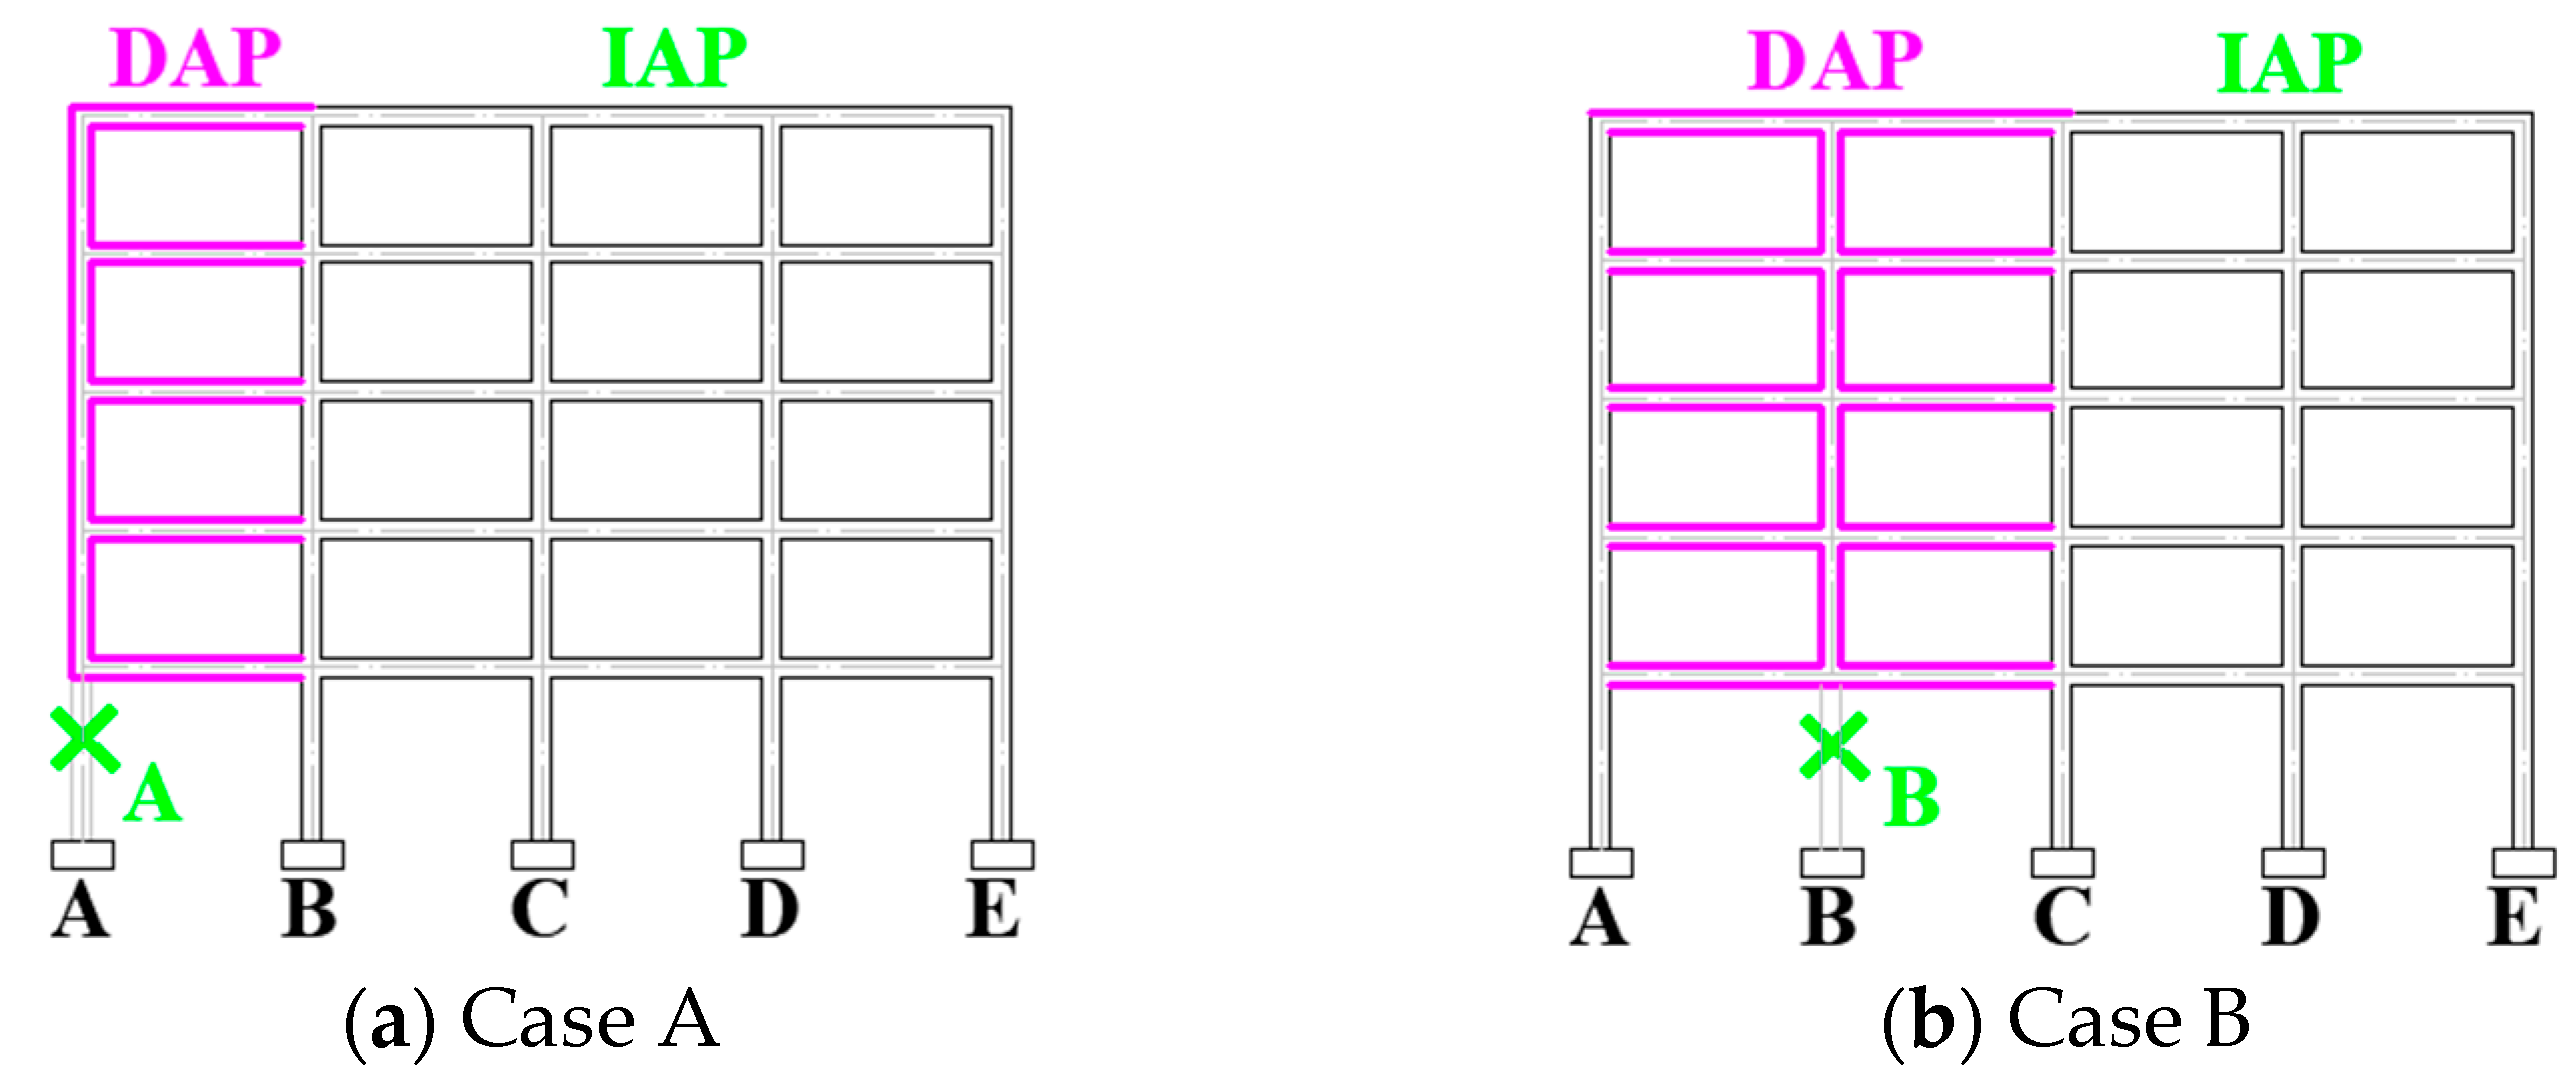
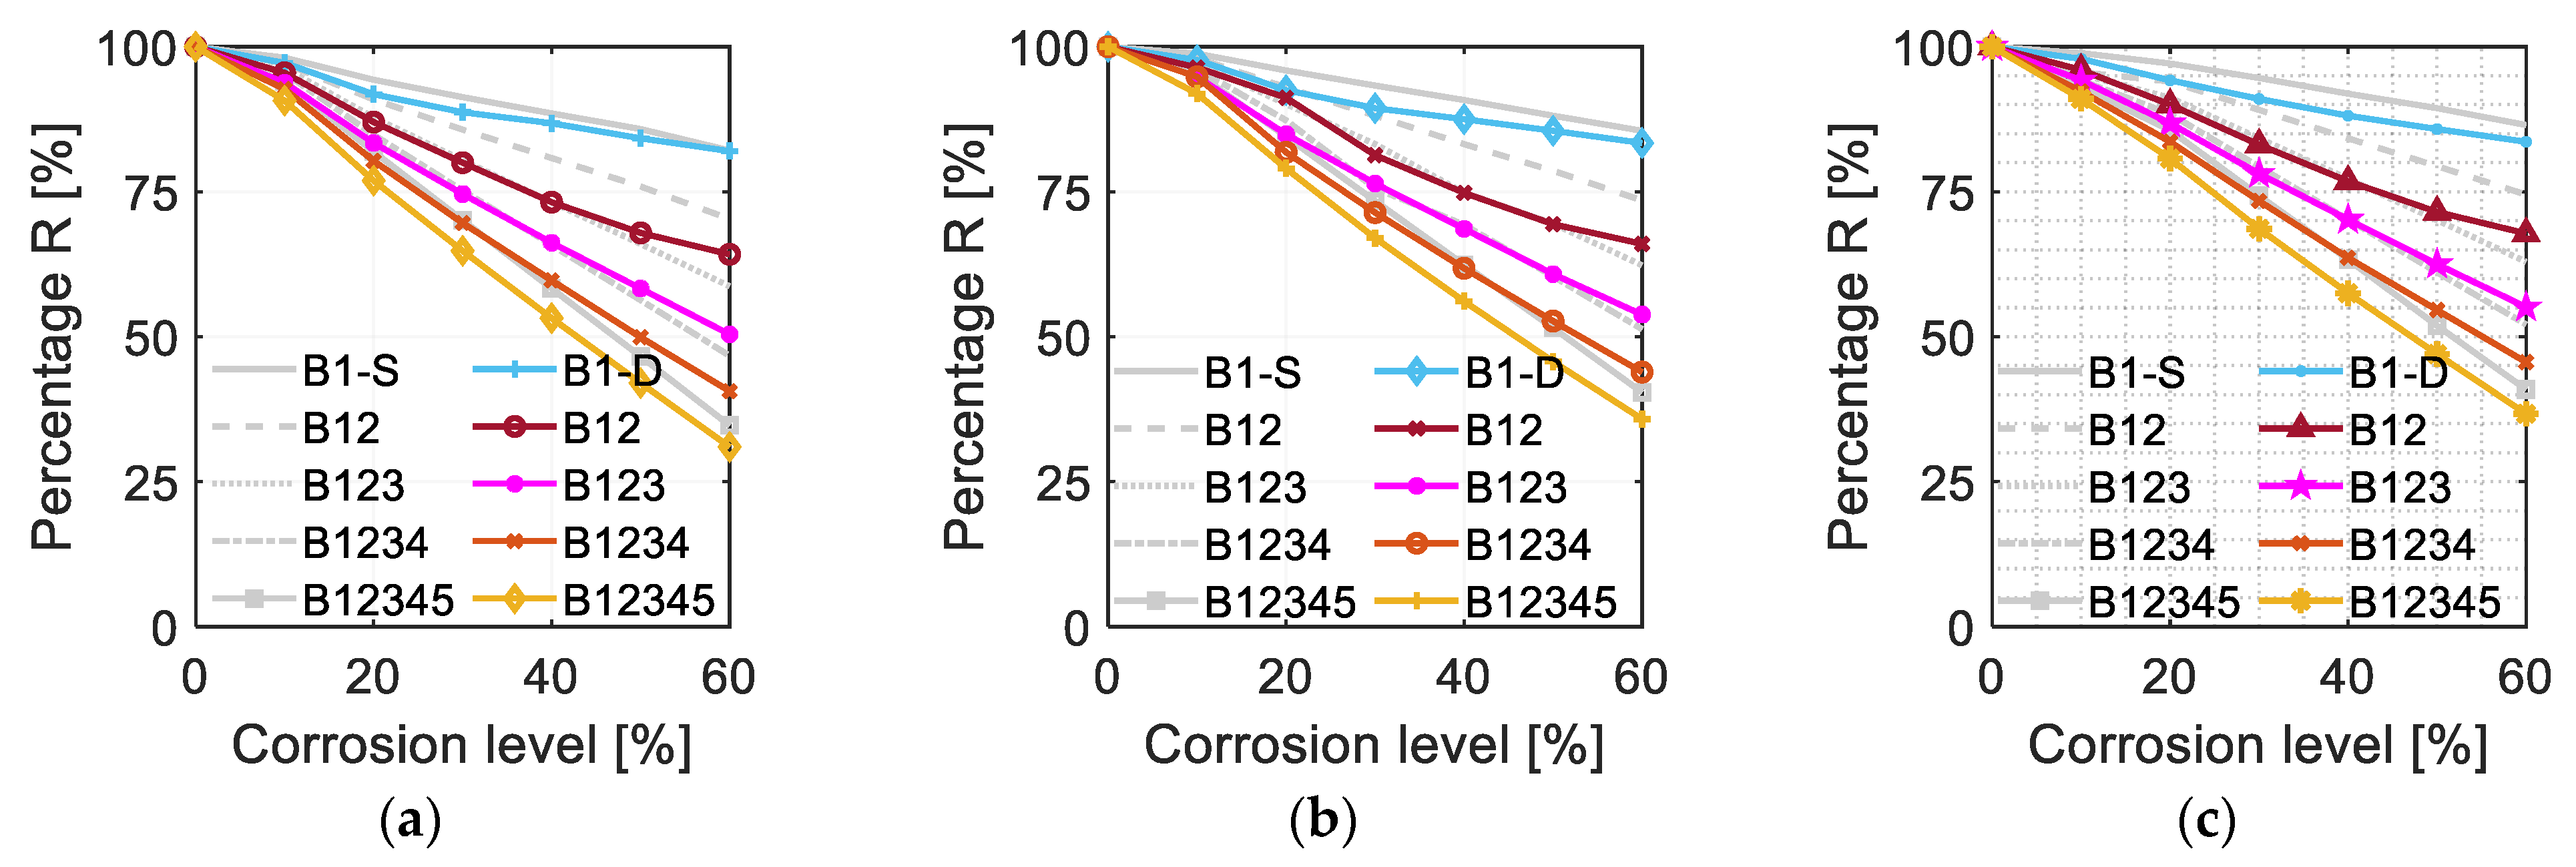
4.3. Influence of Different Corrosion Locations

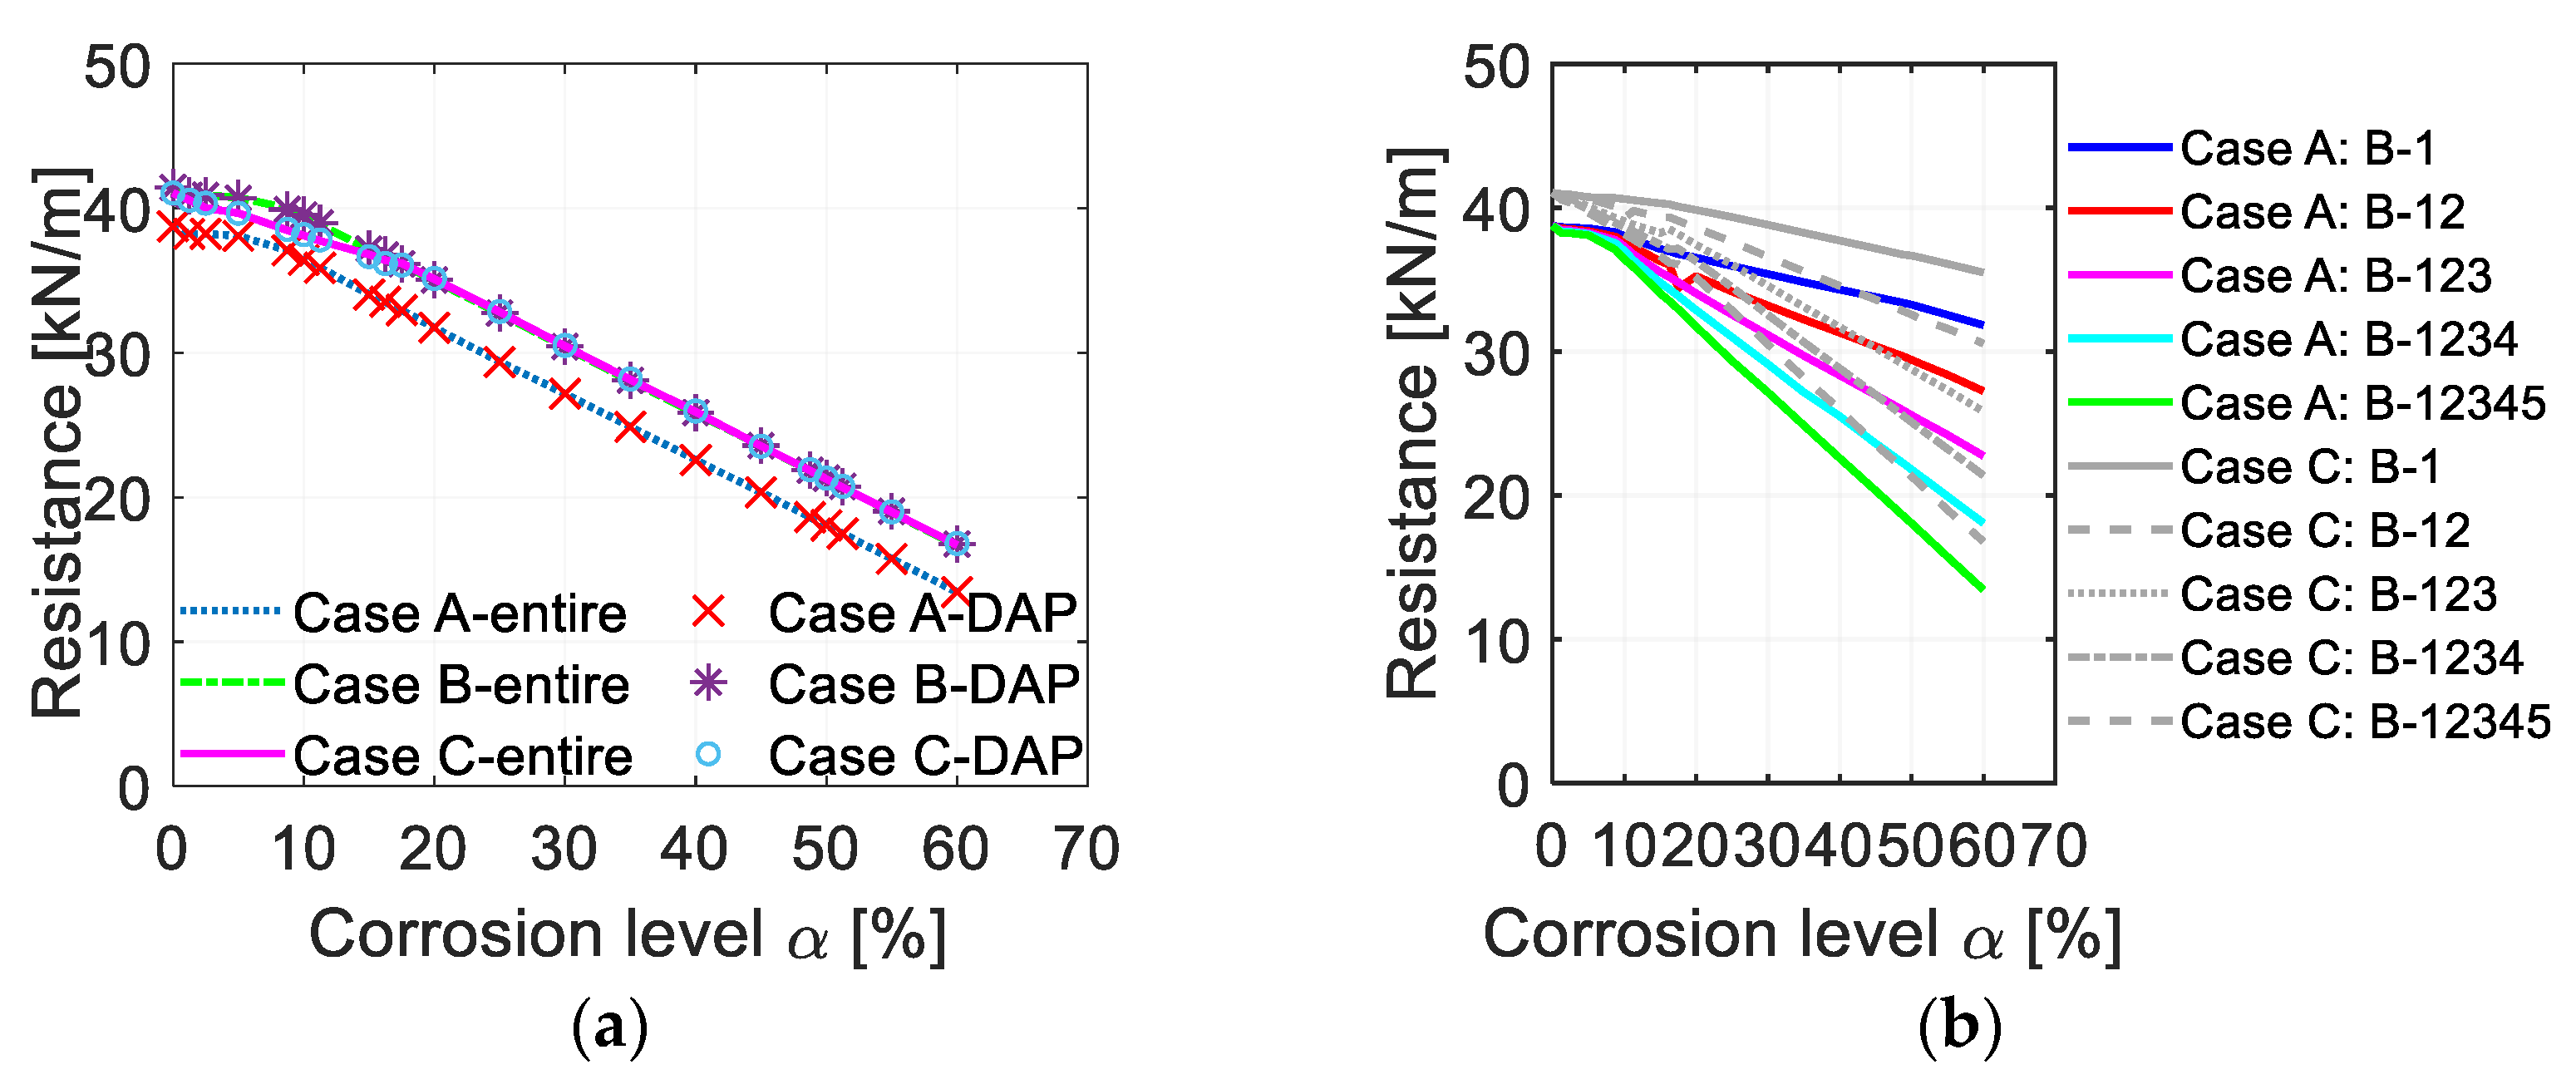
4.3.1. Corrosion in DAP and/or IAP

When the RC frame is subjected to the loss of ground column C (Figure 6b), the bays immediately above the removed column are defined as the directly affected part (DAP), while the remaining portions of the structure constitute the indirectly affected part (IAP) [86]. The DAP is expected to experience the most significant structural response during progressive collapse, including large deformations. Considering that corrosion may occur at any location within the frame, different corrosion scenarios involving various structural regions are investigated. To this end, the same column removal scenario as described in Section 4.2 is adopted—namely, the removal of ground column C (Figure 6b)—and static pushdown analyses are performed. In all subsequent analyses presented in this paper, only Model 4 for the steel ultimate strain is employed as a representative example. Note that Model 4 is used here only as an illustrative example and not as the recommended model. Experimental confirmation is necessary once relevant conditions are available. This model is used consistently to evaluate the influence of corrosion location on structural performance.
Two specific cases are first investigated: one in which all the beams from the first to fifth floors (referred to as ‘Beam–12345’) are subjected to reinforcement corrosion effects and another in which all the columns (referred to as ‘Column–ABCDE’) experience corrosion effects. The curves of resistance against corrosion level α for these cases are presented in Figure 9a. It should be noted that the curve labeled ‘all’ represents the scenario in which the entire structural system—including reinforcements in both beams and columns (see Figure 8)— is subjected to corrosion, following the same assumption as discussed in Section 4.2. It is observed that the curve for ‘Beam: 12345’ is nearly identical to that of ‘all’, indicating that the corrosion of beams is the primary contributor to the reduction in structural load-bearing capacity as the corrosion level increases. This finding is further supported by the curve for ‘Column: ABCDE’, where no significant decrease in load-bearing capacity is observed, since none of the beams are subjected to corrosion in this case. It is worth noting that columns designed under seismic provisions demonstrate significant strength, contributing to the overall robustness of the structure.
Two additional cases are further investigated: one in which only the beams located in the directly affected part (DAP) from the first to fifth floors (referred to as ‘DAP: B–12345’) are subjected to reinforcement corrosion and another in which both all the DAP beams and all columns (labeled as ‘DAP: B–12345 + C–ABCDE’) experience corrosion. As expected, the resulting resistance–corrosion-level curves for both cases are nearly identical to that of the ‘all’ scenario, as shown in Figure 9a.
The case ‘DAP: B–12345’ indicates that reinforcement corrosion occurring exclusively in the DAP beams—and not in the IAP—is the primary cause of the degradation in structural load-bearing capacity with increasing corrosion levels. This is further confirmed by the case ‘DAP: B–12345 + C–ABCDE’, where the inclusion of corroded columns shows little influence on the overall structural response. In the study by Yu et al. [34], only the corrosion effects in all beams of RC frames were considered in the context of progressive collapse, as the beams were identified as the main components providing alternate load paths for redistributing loads around a failed column. This assumption aligns well with the findings of the present study, which also indicate that (strong) column corrosion has a minimal impact on structural performance.

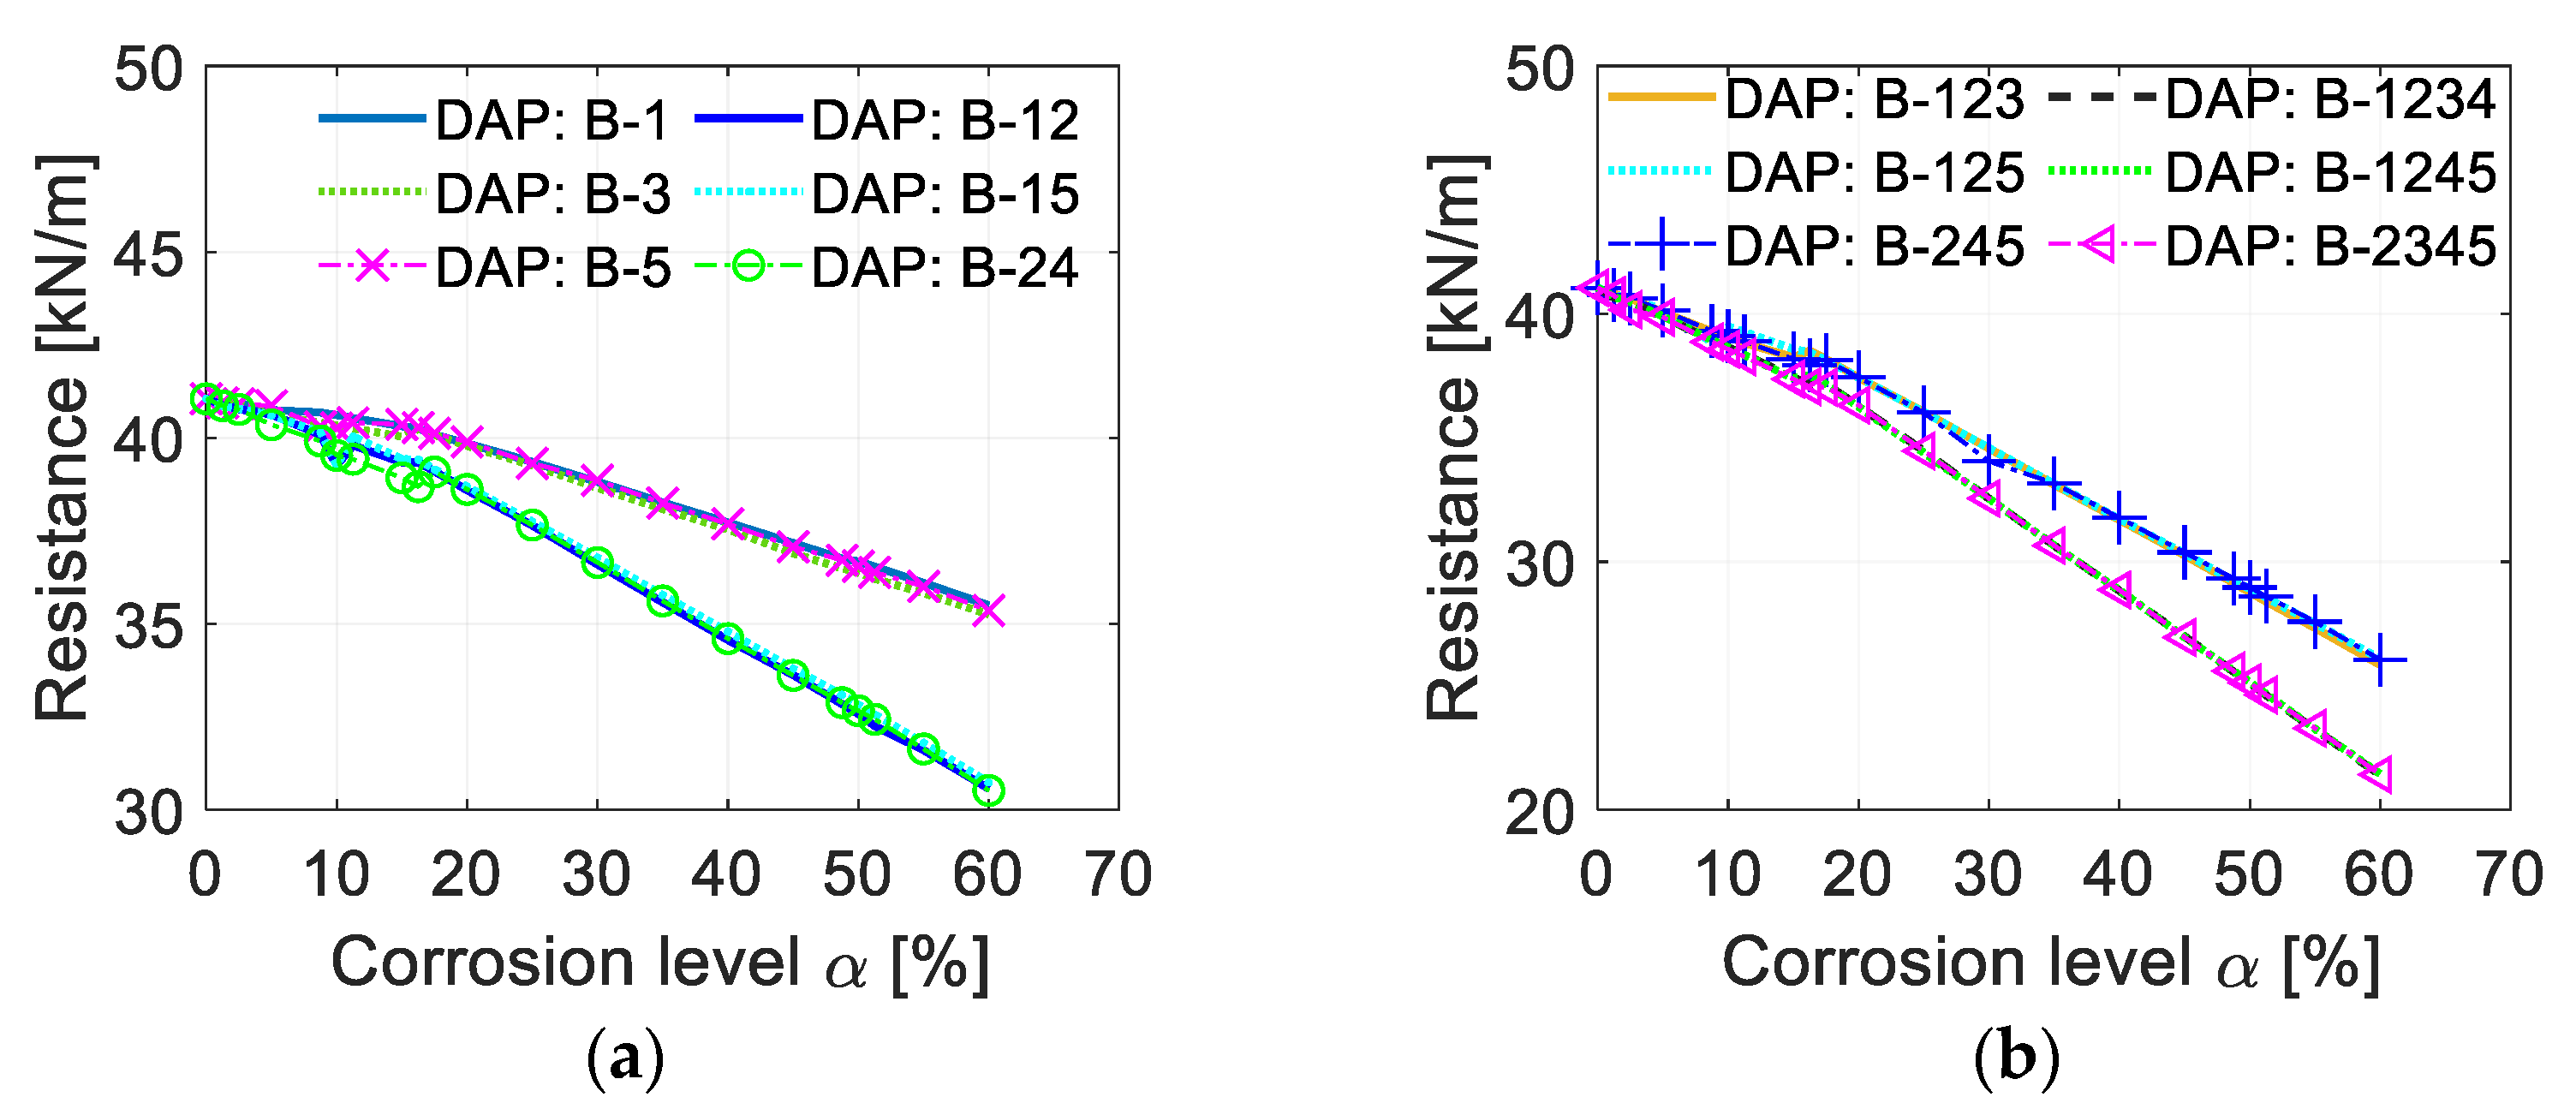
4.3.2. Corrosion in Different Floors in DAP

The previous results indicate that reinforcement corrosion in the beams located within the directly affected part (DAP) is the primary factor responsible for the reduction in progressive collapse resistance as the corrosion level increases. Moreover, the number of corroded floors within the DAP is also found to significantly influence structural performance. Therefore, four additional cases are investigated, considering different numbers of corroded floors in the DAP: only the beams in the first floor (‘DAP: B–1’), the first two floors (‘DAP: B–12’), the first three floors (‘DAP: B–123’), the first four floors (‘DAP: B–1234’), and all five floors (equivalent to ‘DAP: B–12345’ presented in Figure 9a). The resulting resistance–corrosion-level curves are shown in Figure 9b. It can be observed that cases involving a greater number of corroded floors lead to lower load-bearing capacities. All curves coincide at the initial stage (α = 0%), but differences become increasingly apparent as the corrosion level increases.
Moreover, it is observed that corrosion affecting any single floor among the five floors in the DAP leads to nearly identical structural responses; for example, see Figure 10a (‘DAP: B–1’, ‘DAP: B–3’, and ‘DAP: B–5’). This phenomenon is also evident in cases involving corrosion on any two floors (e.g., ‘DAP: B–12’, ‘DAP: B–15’, and ‘DAP: B–24’ in Figure 10a), any three floors (e.g., ‘DAP: B–123’, ‘DAP: B–125’, and ‘DAP: B–245’ in Figure 10b), and any four floors (e.g., ‘DAP: B–1234’, ‘DAP: B–1245’, and ‘DAP: B–2345’ in Figure 10b). This indicates that each floor contributes almost equally to the reduction in load-bearing capacity at a given corrosion level. In the notation ‘DAP: B–XYZ’, it means that the beams located on floors X, Y, and Z within the DAP are subjected to reinforcement corrosion. As expected, different failure modes may be observed across these cases, which can be attributed to both the variation in corrosion locations and corrosion levels.
Accordingly, it can be concluded that only reinforcement corrosion in the beams located within the DAP significantly influences the load-bearing capacity of the RC frame under column loss scenarios. For a given number of corroded floors in the DAP, nearly identical structural capacities are observed, regardless of their specific locations. Furthermore, an increase in the number of corroded floors within the DAP leads to a more pronounced reduction in progressive collapse resistance.

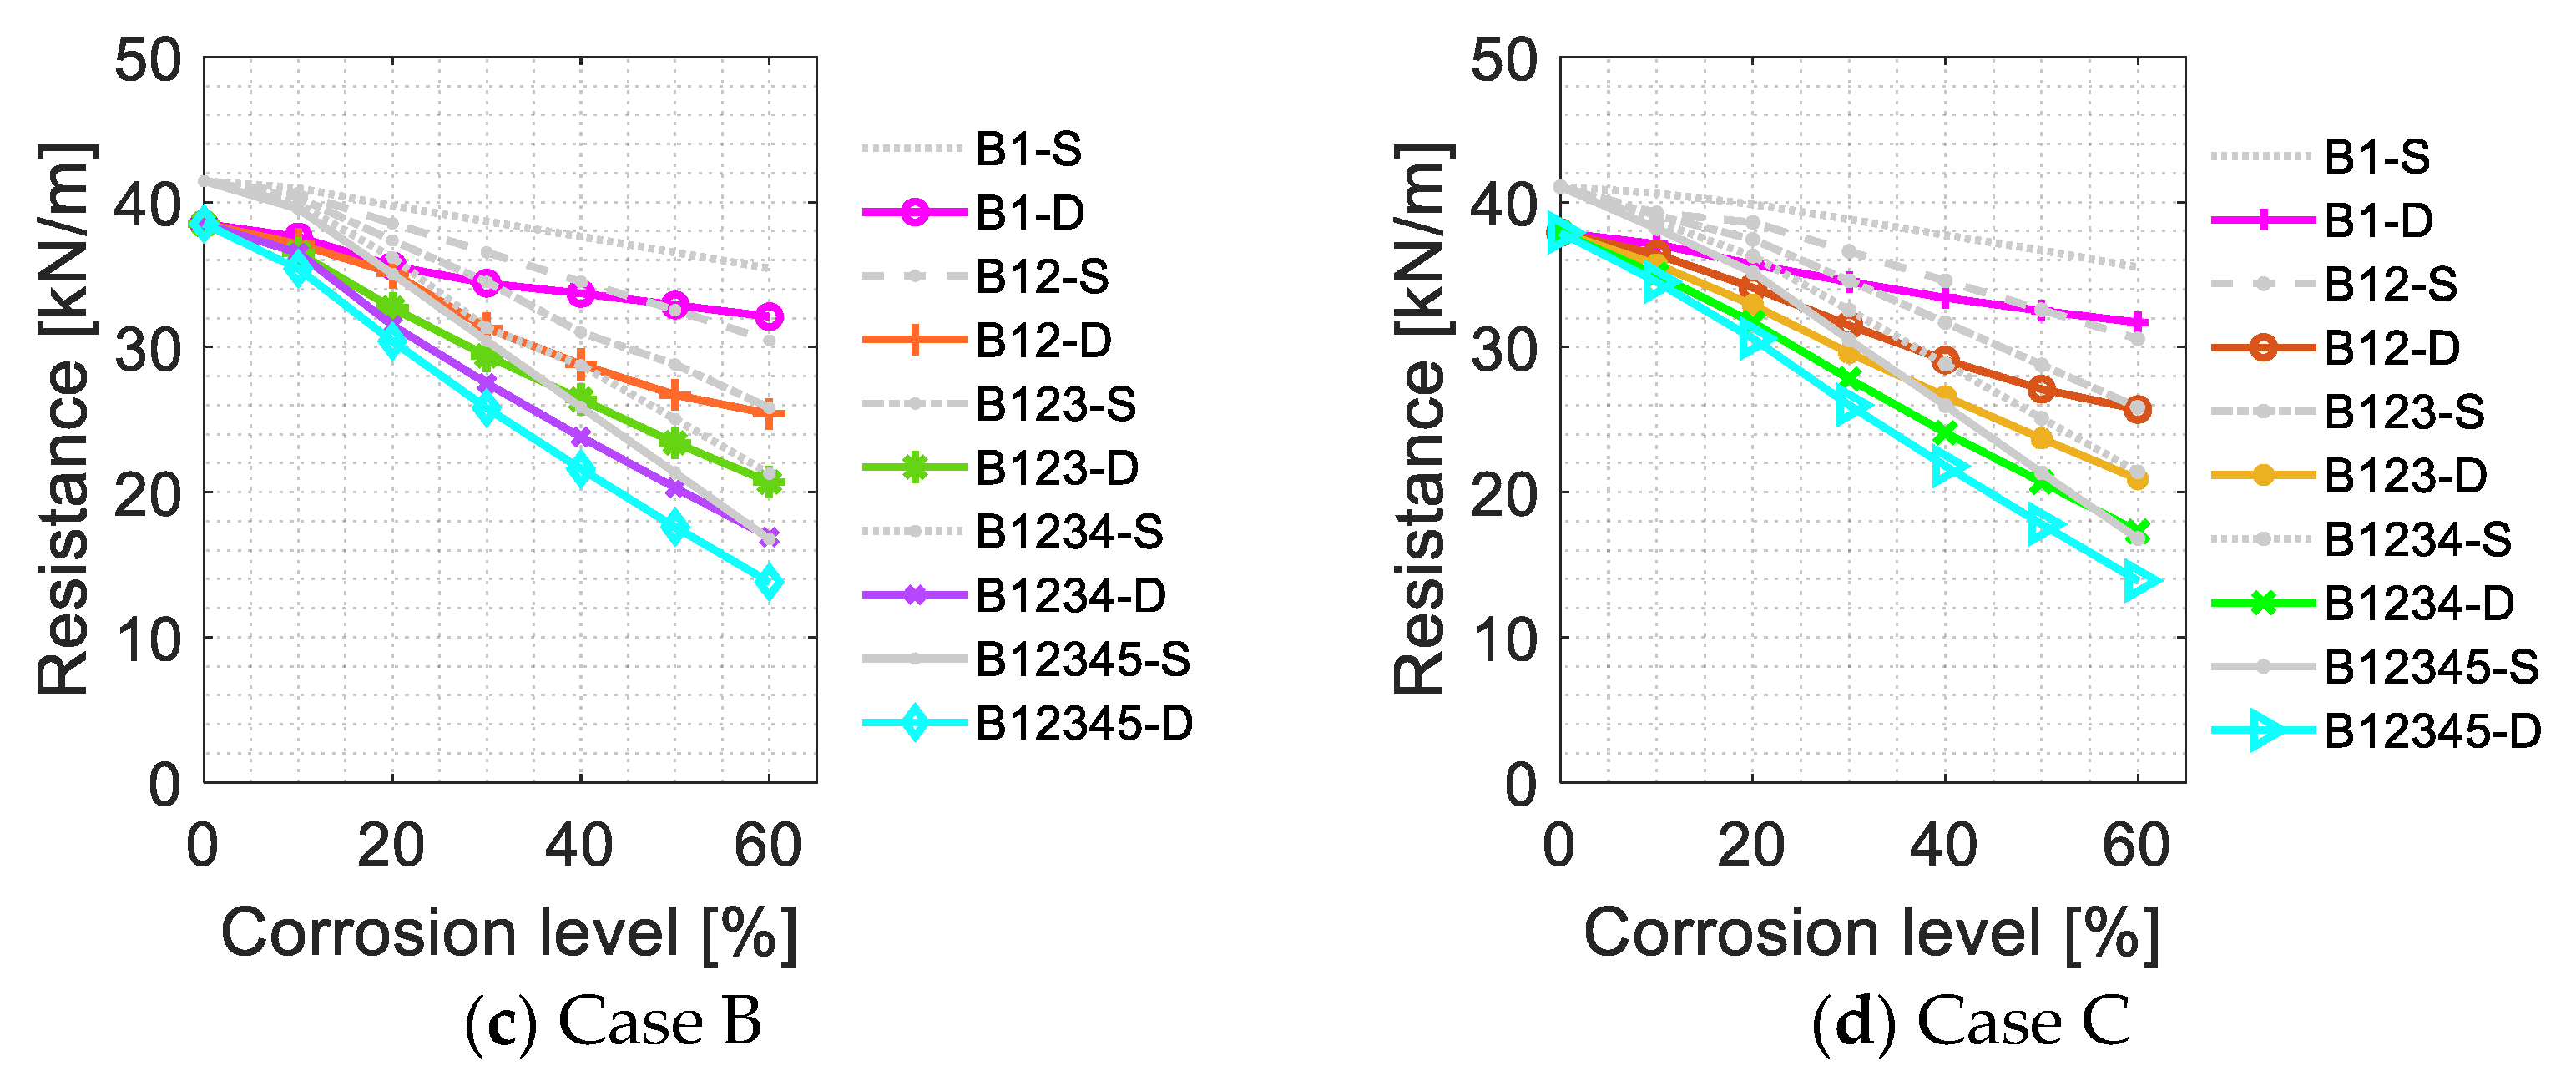
4.4. Influence of Different Column Removal Scenarios

The loss of a ground floor column is generally considered the critical scenario for simple RC frame structures. In the context of the RC frame under investigation, various column loss cases are examined: removal of ground column A (Case A) and removal of ground column B (Case B), as illustrated in Figure 11. It should be noted that the removal of ground column C (Case C) has already been analyzed in previous sections. Therefore, the progressive collapse performance of the deteriorated RC frame is further evaluated for Cases A and B. Static pushdown analyses are conducted for both scenarios. Uniformly distributed downward loads are applied to all beams, and displacement-controlled loading is employed, with control points located at the top of ground columns A and B for Cases A and B, respectively. The load–displacement response at the control point is recorded under varying corrosion levels. Subsequently, curves depicting the ultimate load-bearing capacity versus corrosion level α are plotted in Figure 12a for all three column loss cases. For each case, two corrosion scenarios are considered: (1) only the beams within the directly affected part or DAP—which varies depending on the column loss scenario—are subjected to reinforcement corrosion effects, and (2) the entire structural system, including both beams and columns, experiences reinforcement corrosion effects.
As shown in Figure 12a, the curve for Case A (Case A—all) is significantly lower than those for Cases B (Case B—all) and C (Case C—all). This can be attributed to the fact that force redistribution is more challenging in the case of an external column loss, due to the availability of fewer alternate load paths. The resistance–corrosion-level curves for Cases B and C are nearly identical, with only minor deviations observed at low corrosion levels (α < 15%). Moreover, as expected, the structural responses obtained when considering corrosion only in DAP are almost identical to those when corrosion is applied to the entire system; this holds true for all three column loss cases. For example, the curves ‘Case A—all’ and ‘Case A—DAP’ overlap closely. This further confirms that the load-bearing capacity of the deteriorated RC frame under column loss is primarily influenced by reinforcement corrosion in the beams within the DAP. It is also noted that the first failure always occurs at the beam ends within the DAP (see Figure 11) for all three cases.
The influence of varying the number of corroded floors within the directly affected part or DAP is investigated, considering five scenarios: reinforcement corrosion limited to the first floor (B–1), the first two floors (B–12), the first three floors (B–123), the first four floors (B–1234), and all five floors (B–12345). Only the results for Cases A and C are presented in Figure 12b. As previously observed, Case A is found to be the most critical scenario. It is also evident that an increase in the number of corroded floors within the DAP leads to a corresponding decrease in structural capacity. These conclusions apply consistently across all three column loss cases.

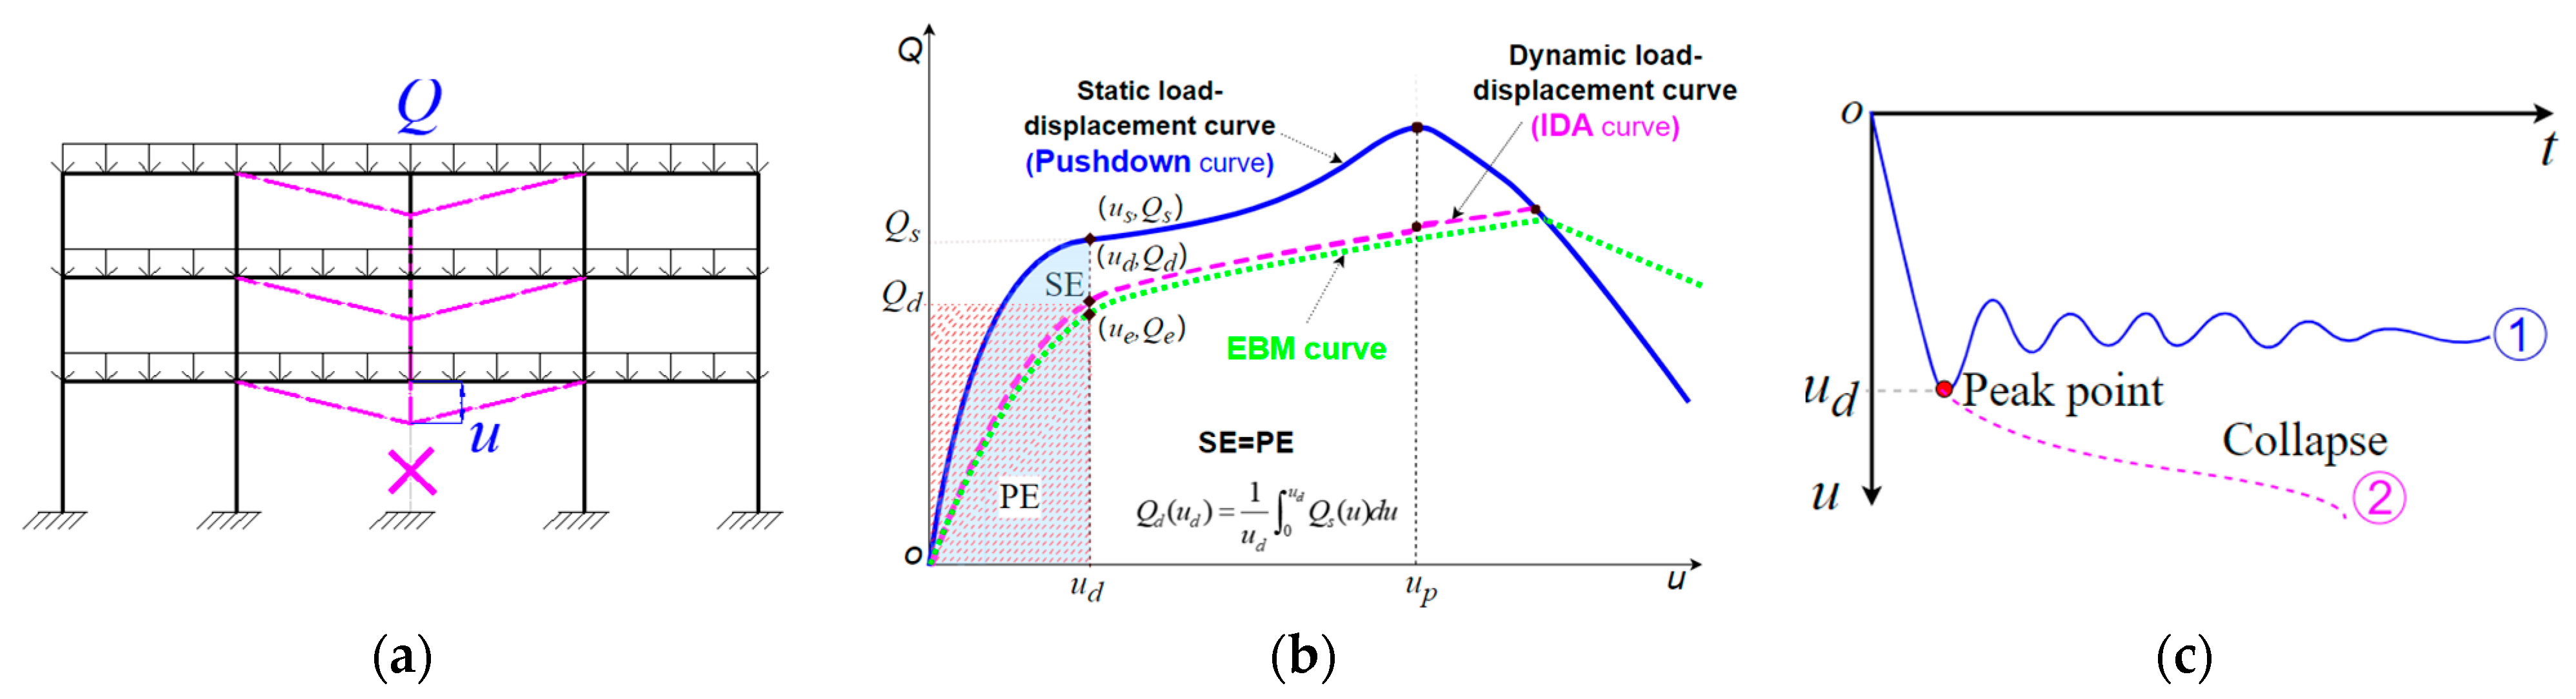
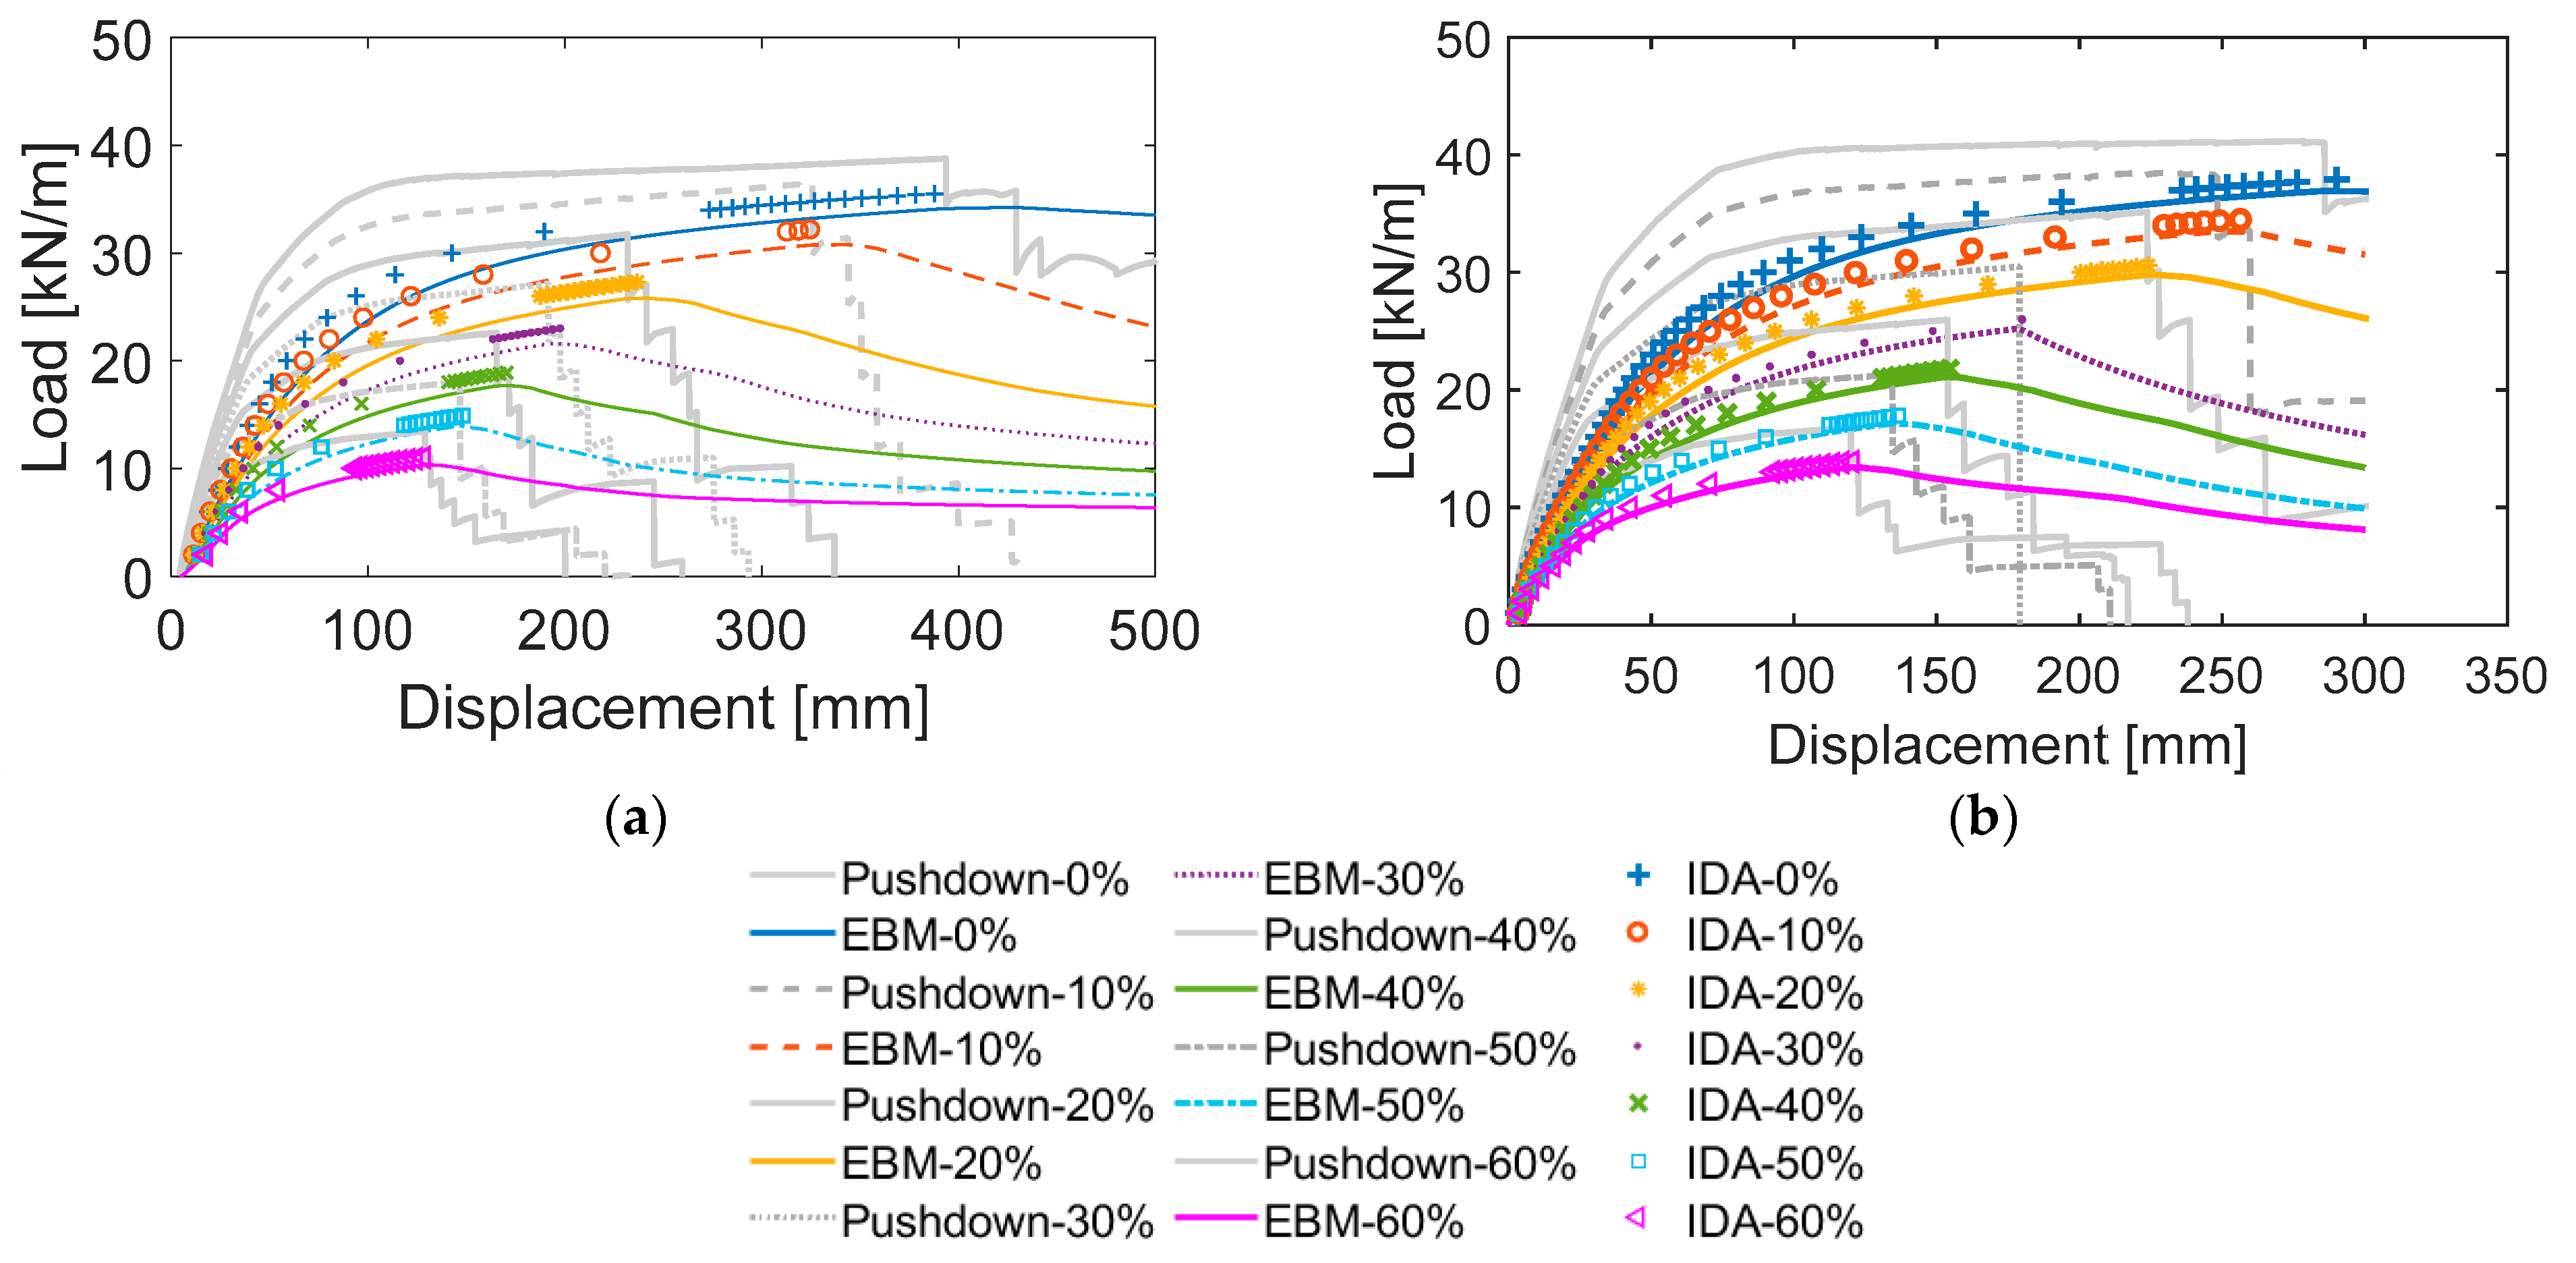
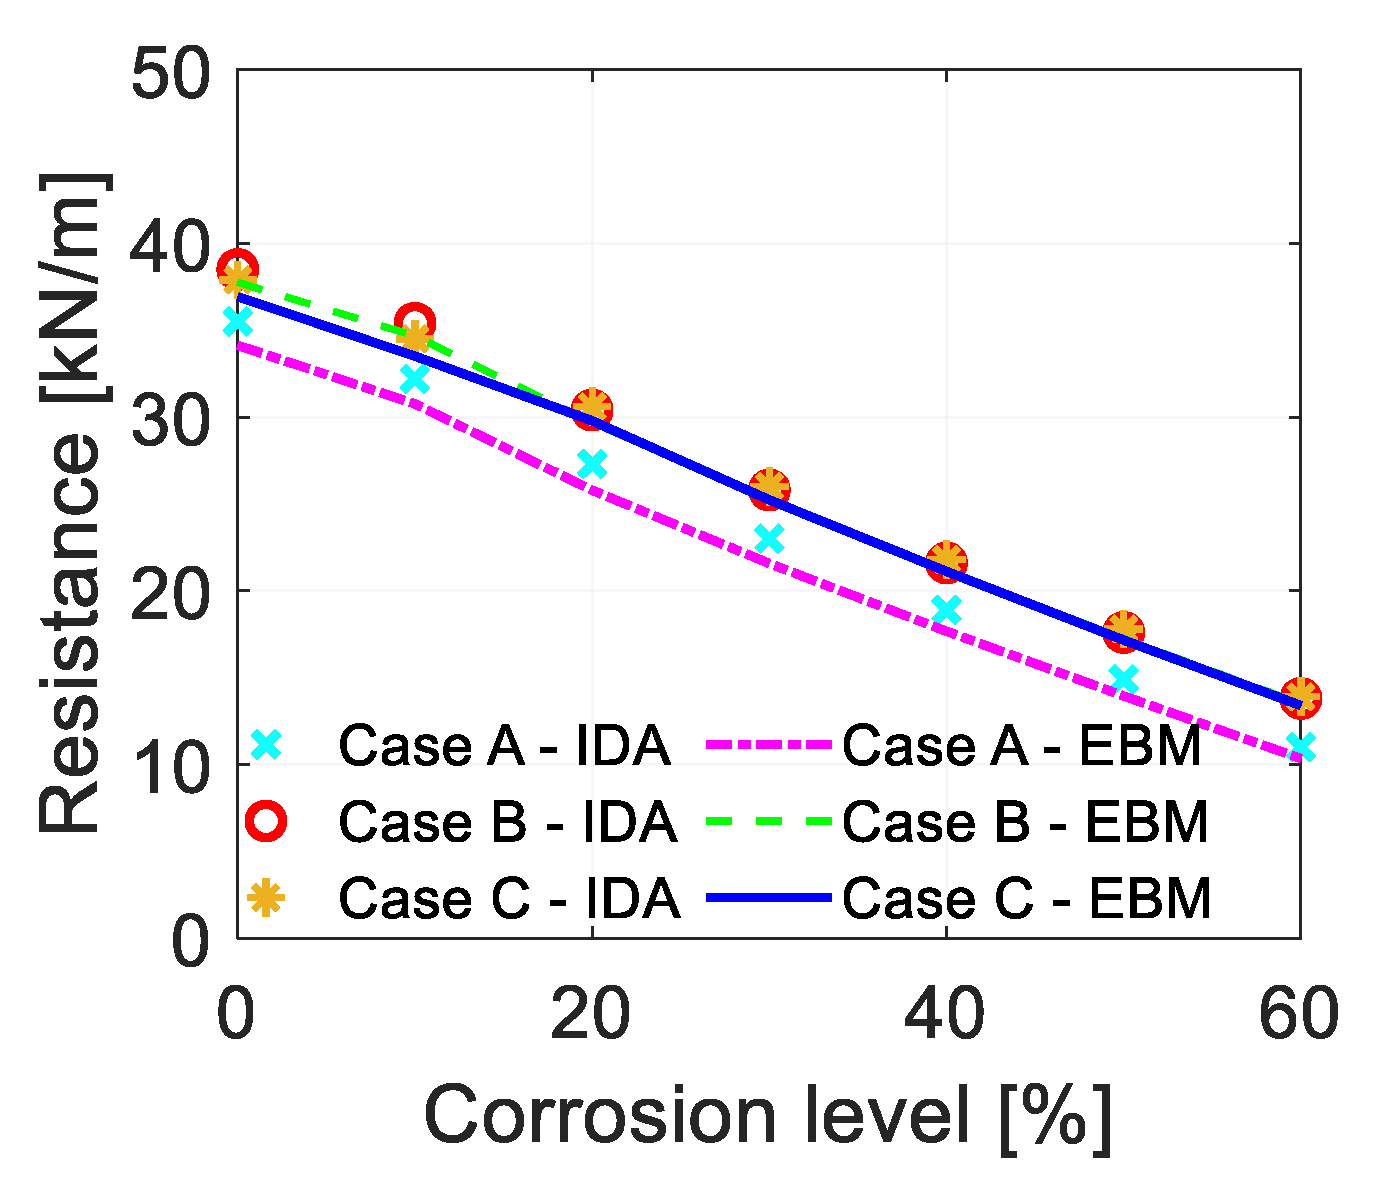
4.5. Influence of Dynamic Effects

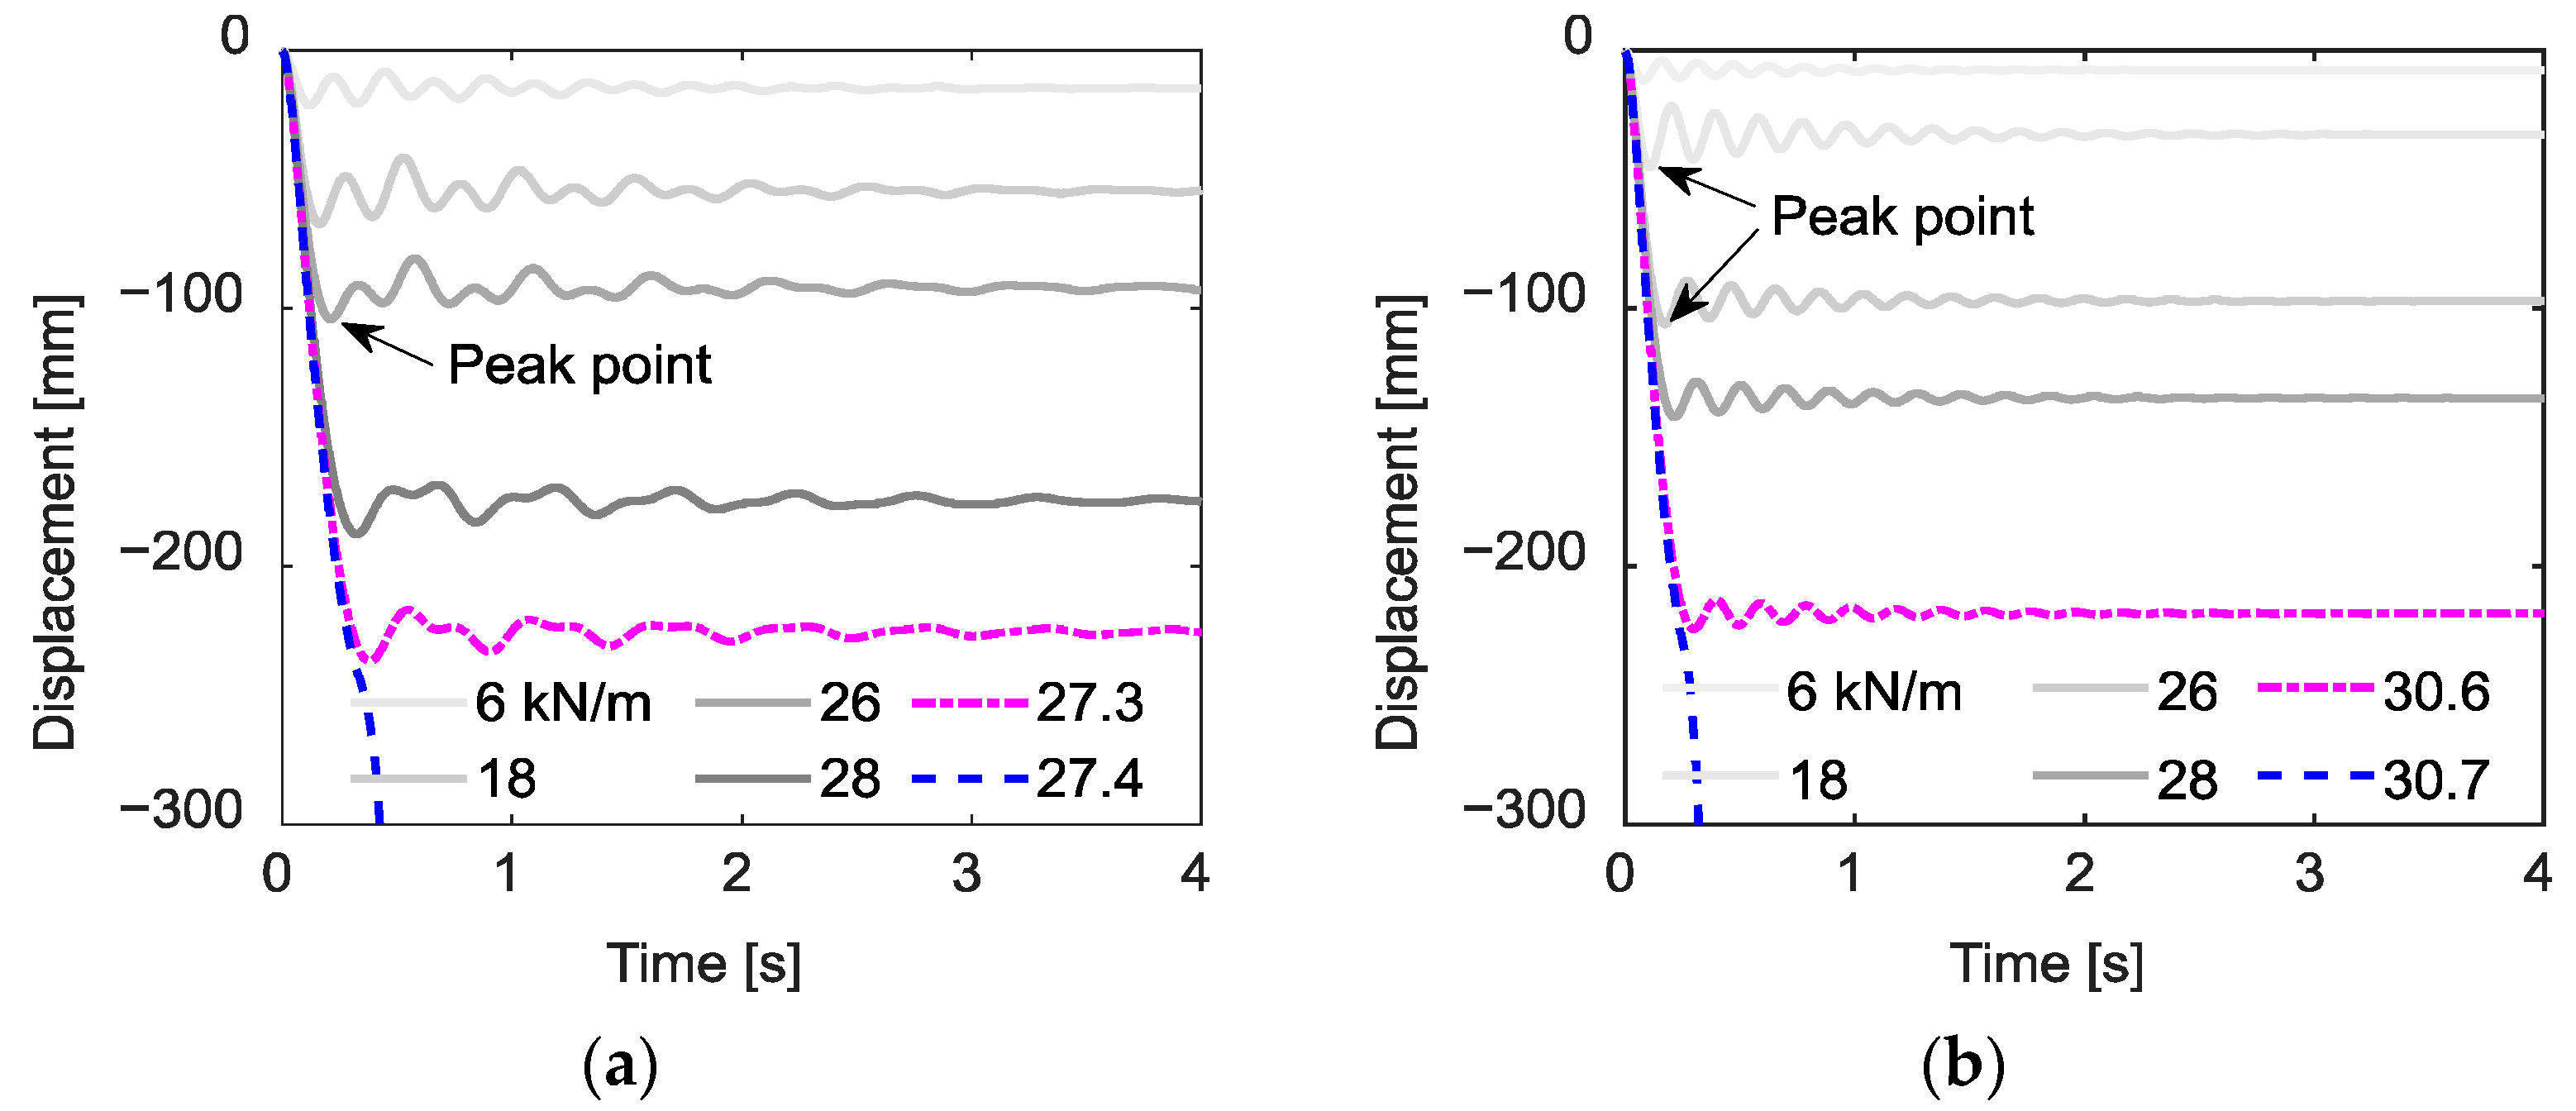
4.5.1. Nonlinear Dynamic Analysis

The response of an RC frame to a sudden column loss is inherently dynamic in nature. Therefore, the incremental dynamic analysis or IDA in Section 3.1 is conducted to investigate the dynamic progressive collapse behavior of the deteriorated structure. To obtain the dynamic load-bearing capacity curve, a series of nonlinear time–history analyses or NTHA is performed, with the intensity of uniformly distributed downward loads on all beams progressively increased. For each load level, one NTHA is carried out; the loads are first applied statically, followed by the instantaneous removal of a ground column (with a removal duration of 0.001 s) [71]. The dynamic response during the first 4 s after column removal is recorded at the top of the removed column. Rayleigh damping with a damping ratio of 5% is employed in all dynamic simulations, as commonly adopted in similar studies [7,12,55,87]. To ensure accuracy in determining the ultimate load-bearing capacity, a fine load increment resolution of 0.1 kN/m is applied.
IDA is conducted for all three column loss cases—removal of column A, B, and C. Additionally, for each case, an IDA is performed at every defined corrosion level. For example, the time–history displacement responses at a corrosion level of α = 20% are presented in Figure 13a,b for Cases A and C, respectively. The structural system oscillates around a new equilibrium position following the sudden column removal, with the oscillations gradually decaying due to the damping effect. Notably, the oscillation pattern in Case A appears more irregular compared to the other cases, which can be attributed to the more complex redistribution mechanism of the unbalanced load associated with the external column loss [19]. Furthermore, the peak values from the time–history displacement responses obtained through IDA are extracted to construct the dynamic capacity curves, also referred to as IDA curves (see Section 3.1).
The IDA curves at various corrosion levels are presented in Figure 14a,b for Cases A and C, respectively. It can be observed that both stiffness, ultimate load-bearing capacity, and ultimate displacement response decrease significantly as the corrosion level increases from 0% to 60%. For reference, the static load–displacement curves (i.e., pushdown curves) are also included in the figures. Notably, the dynamic capacity (or IDA) curve lies significantly below the corresponding static capacity (or pushdown) curve at the same corrosion level. The results highlight the substantial impact of dynamic effects on the load-bearing capacity. Nonetheless, the maximum displacements in the IDA curves are very close to the displacements corresponding to the ultimate load-bearing capacities in the pushdown curves.
Subsequently, the ultimate load-bearing capacities obtained from the IDA are compiled to generate the resistance–corrosion-level curves for all three column loss cases. As expected, the curves derived from the IDA are significantly lower than those obtained from the static pushdown analyses, as illustrated in Figure 15a. This highlights the significant impact on structural capacity when dynamic effects are considered. Among the cases, the external column removal scenario (i.e., Case A) is identified as the most critical, due to the limited availability of alternate load paths. In contrast, the resistance–corrosion-level curves for Cases B and C are nearly identical, indicating similar structural resistances under progressive collapse conditions. A nearly linear reduction trend in the ultimate load-bearing capacity with increasing corrosion levels is observed. Actually, a similar linear degradation pattern during the propagation phase of progressive collapse was reported by Yu et al. [34] for deteriorated RC structures, although their findings were expressed in terms of time-dependent performance evaluation.
The effects of varying the number of corroded floors within the DAP are investigated for all three column loss cases (A, B, and C), with results presented in Figure 15b–d, respectively. The following scenarios are considered: only the first floor subjected to reinforcement corrosion (B1), as well as combinations involving the first two floors (B12), the first three floors (B123), the first four floors (B1234), and all five floors (B12345) within the DAP. In the figures, the subscript ‘S’ denotes results from static pushdown analysis, while ‘D’ indicates results obtained from dynamic IDA. Consistent with the static findings, dynamic resistance decreases significantly as the number of corroded floors in the DAP increases, across all three column loss scenarios.
Figure 16a–c illustrate the percentages of ultimate dynamic and static load-bearing capacities (R) at increasing corrosion levels, normalized with respect to the corresponding values at α = 0%, as shown in Figure 15b–d, respectively. It can be observed that dynamic resistance generally decreases slightly faster than static capacity as corrosion increases. This can be attributed to the severely reduced ultimate strain capacity at higher corrosion levels. As reported in previous studies [7,20,25], the dynamic amplification factor decreases with decreasing structural ductility. Therefore, this means that it may be inaccurate if a constant dynamic amplification factor (in order to reflect dynamic effects) is applied to the static loadings in nonlinear static analyses under different corrosion levels.

4.5.2. Efficient Approaches for Dynamic Analysis

While the IDA provides an accurate means of evaluating dynamic structural responses, it is often time-consuming and computationally intensive [26,55,59,69,88,89,90]. As a more efficient alternative, the energy-based method or EBM can be employed to estimate the dynamic capacity curve and the ultimate load-bearing capacity; see Equation (12) in Section 3.1 [7,34].
Figure 14a,b present the approximated dynamic capacity curves obtained using the EBM, based on the static pushdown curves for Cases A and C, respectively. It can be observed that the EBM curves closely match the IDA results, indicating that the EBM can provide a reasonable approximation of the dynamic load-bearing capacity. The EBM curves are slightly lower than the IDA curves, suggesting that the method yields slightly conservative estimates. This is expected, as certain dynamic effects—such as damping—are not explicitly accounted for in the EBM, whereas they are considered in IDA. It should be noted that the EBM curves are calculated up to the intersection point between the pushdown curve and the EBM curve, following the approach established in previous studies [26,55,59,69,88].
The ultimate load-bearing capacities under various reinforcement corrosion levels, derived from both EBM and IDA results (see Figure 14a,b for Cases A and C, respectively), are collected for all three column loss scenarios. These values are used to construct the resistance–corrosion-level curves, as shown in Figure 17. It can be observed that the EBM results show strong agreement with those obtained from IDA. The coefficients of determination (R2) are 0.98, 0.99, and 0.99 for Cases A, B, and C, respectively. These values indicate that the EBM performs well in approximating the dynamic ultimate load-bearing capacities across different corrosion levels. In practical applications, the EBM can serve as a promising and efficient method for estimating dynamic progressive collapse resistance with reasonable accuracy.

5. Conclusions

In this study, the progressive collapse performance of deteriorated reinforced concrete (RC) frames subjected to column removal scenarios was evaluated under both nonlinear static and dynamic situations. Particular attention was given to the effects of varying material deteriorations, deterioration locations, and column removal scenarios in the structural system. The results indicate that both static and dynamic progressive collapse resistances of the RC frames decrease significantly with increasing corrosion levels. Furthermore, the energy-based method (EBM) was employed to approximate the maximum dynamic response, and it demonstrated good accuracy in capturing the structural behavior under progressive collapse conditions. The main conclusions are addressed as follows:
(1)
Reinforcement corrosion is identified as the primary factor contributing to the degradation of progressive collapse performance with increasing corrosion levels. In contrast, the effects of concrete deterioration on structural robustness are relatively minor. Furthermore, different deterioration models—particularly those related to the reduction in steel ultimate strain—may lead to variations in both structural response and failure modes.
(2)
The structural performance under all three column removal scenarios is predominantly governed by reinforcement corrosion in the beams located within the directly affected part (DAP). Corrosion in other regions of the structure has a minimal influence on overall collapse resistance. Additionally, an increase in the number of corroded floors within the DAP leads to a significantly greater reduction in progressive collapse capacity.
(3)
Progressive collapse resistances obtained from dynamic analyses are notably lower than those derived from static analyses, and they exhibit a slightly faster rate of degradation as corrosion levels increase. This highlights the importance of considering dynamic effects in the assessment of deteriorated structures.
It is important to note that the results presented in this study are based on certain simplifying assumptions. The conclusions are drawn according to the results in this study. Experimental validation is recommended when relevant experimental conditions become available. For instance, uniform corrosion was assumed across the reinforcement, whereas localized pitting corrosion may be more representative of real-world reinforced concrete structures. Additionally, the bond degradation between reinforcing steel and concrete—which may significantly affect structural performance under progressive collapse scenarios—was not considered in the current analysis. Therefore, further research incorporating more realistic corrosion patterns, bond–slip behavior, and structures is recommended to enhance the accuracy and applicability of the findings.

Author Contributions

Conceptualization, L.D.; methodology, L.D. and Y.Z.; software, L.D. and Y.G.; validation, L.D., X.D., Y.Z. and Y.G.; formal analysis, L.D.; investigation, L.D., Y.Z. and Y.G.; resources, L.D. and X.D.; data curation, L.D., Y.Z. and Y.G.; writing—original draft preparation, L.D.; writing—review and editing, X.D., Y.Z. and Y.G.; visualization, L.D., X.D., Y.Z. and Y.G.; project administration, L.D. and X.D.; funding acquisition, L.D. All authors have read and agreed to the published version of the manuscript.

Funding

This research is funded by the China Postdoctoral Science Foundation (grant number: 2022M722427) and the Fundamental Research Funds for the Central Universities.

Data Availability Statement

Data are supplied on request.

Conflicts of Interest

The authors declare no conflicts of interest.

Nomenclature

BCBeam endJCSSJoint committee on structural safety
DAPDirectly affected partNTHANonlinear time–history analysis
EBMEnergy-based methodPEPotential energy
IAPIndirectly affected partRCReinforced concrete
IDAIncremental dynamic analysisSEStrain energy

References

  1. Makoond, N.; Setiawan, A.; Buitrago, M.; Adam, J.M. Arresting failure propagation in buildings through collapse isolation. Nature 2024, 629, 592–596. [Google Scholar] [CrossRef]
  2. Zeng, Y.; Shen, Y.; Noori, M.; Wu, G. Experimental study on the progressive collapse resistance of emulative precast concrete beam-column subassemblies with various anchorage details. J. Build. Eng. 2024, 88, 109242. [Google Scholar] [CrossRef]
  3. Gerasimidis, S.; Ellingwood, B. Twenty years of advances in disproportionate collapse research and best practices since 9/11/2001. J. Struct. Eng. 2023, 149, 2022002. [Google Scholar] [CrossRef]
  4. Gan, Y.; Chen, J.; Xiang, M. PDEM-based reliability assessment of RC frames against progressive collapse considering initial local failure. J. Build. Eng. 2023, 76, 107198. [Google Scholar] [CrossRef]
  5. Yi, F.; Yi, W.J.; Sun, J.M.; Zhou, Y.; Zhang, W.X.; He, Q.F. Experimental study on progressive collapse behavior of frame structures triggered by impact column removal. Eng. Struct. 2024, 321, 119022. [Google Scholar] [CrossRef]
  6. Parisi, F.; Scalvenzi, M.; Brunesi, E. Performance limit states for progressive collapse analysis of reinforced concrete framed buildings. Struct. Concr. 2019, 20, 68–84. [Google Scholar] [CrossRef]
  7. Tsai, M.H.; Lin, B.H. Investigation of progressive collapse resistance and inelastic response for an earthquake-resistant RC building subjected to column failure. Eng. Struct. 2008, 30, 3619–3628. [Google Scholar] [CrossRef]
  8. Weng, Y.-H.; Fu, F.; Qian, K. Punching shear resistance of corroded slab–column connections subjected to eccentric load. J. Struct. Eng. 2023, 149, 04022219. [Google Scholar] [CrossRef]
  9. Gan, Y.; Chen, J.; Zeng, H.; Zeng, D. Whole-process analytical model on progressive collapse response of reinforced concrete structures under middle column loss. Eng. Struct. 2024, 302, 117375. [Google Scholar] [CrossRef]
  10. Yi, F.; Yi, W.J.; Sun, J.M.; Ni, J.; He, Q.F.; Zhou, Y. On the progressive collapse performance of RC frame structures under impact column removal. Eng. Struct. 2024, 307, 117926. [Google Scholar] [CrossRef]
  11. Zeng, Y.; Caspeele, R.; Matthys, S.; Taerwe, L. Compressive membrane action in FRP strengthened RC members. Constr. Build. Mater. 2016, 126, 442–452. [Google Scholar] [CrossRef]
  12. Parisi, F.; Scalvenzi, M. Progressive collapse assessment of gravity-load designed European RC buildings under multi-column loss scenarios. Eng. Struct. 2020, 209, 110001. [Google Scholar] [CrossRef]
  13. Zhang, Z.; Xi, Z.; Qin, W. Experiments and a tension-bending catenary model for the progressive collapse resistance of concrete beam-column structures. J. Build. Eng. 2023, 67, 105971. [Google Scholar] [CrossRef]
  14. Zhang, Z.; Qin, W.; Wang, J.; Xi, Z.; Fan, X. Theoretical and numerical insights into shear performance of steel- and SFCB-reinforced concrete beam-column structures in progressive collapse-resisting design. Structures 2025, 71, 108181. [Google Scholar] [CrossRef]
  15. Zhang, R.; Hu, S.; Guo, T. Performance and recentering demands of partially self-centering BRBFs in the life-cycle span. Eng. Struct. 2025, 334, 120205. [Google Scholar] [CrossRef]
  16. Zhang, R.; Wang, W.; Alam, M.S. Deep learning-aided optimization framework for hybrid braced structures to support life-cycle cost-based design. Eng. Struct. 2025, 327, 119603. [Google Scholar] [CrossRef]
  17. Izzuddin, B.A. Rational robustness design of multistory building structures. J. Struct. Eng. 2022, 148, 04021279. [Google Scholar] [CrossRef]
  18. Ding, L.; Van Coile, R.; Botte, W.; Caspeele, R. Quantification of model uncertainties of the energy-based method for dynamic column removal scenarios. Eng. Struct. 2021, 237, 112057. [Google Scholar] [CrossRef]
  19. Ding, L.; Van Coile, R.; Botte, W.; Caspeele, R. Performance assessment of an energy–based approximation method for the dynamic capacity of RC frames subjected to sudden column removal scenarios. Appl. Sci. 2021, 11, 7492. [Google Scholar] [CrossRef]
  20. Brunesi, E.; Nascimbene, R.; Parisi, F.; Augenti, N. Progressive collapse fragility of reinforced concrete framed structures through incremental dynamic analysis. Eng. Struct. 2015, 104, 65–79. [Google Scholar] [CrossRef]
  21. Yu, X.; Chen, J.; Chen, J.; Qian, K.; Dai, K.; Ding, L.; Caspeele, R. Effects of reinforcement corrosion on the static and dynamic progressive collapse behavior of RC subassemblies. J. Build. Eng. under review.
  22. Ding, L.; Botte, W.; Van Coile, R.; Caspeele, R. Evaluation of the energy-based method for dynamic analysis under a sudden column removal scenario. In Proceedings of the fib Symposium 2020: Concrete Structures for Resilient Society, Shanghai, China, 22–24 November 2020. [Google Scholar]
  23. Izzuddin, B.A.; Vlassis, A.G.; Elghazouli, A.Y.; Nethercot, D.A. Progressive collapse of multi-storey buildings due to sudden column loss—Part I: Simplified assessment framework. Eng. Struct. 2008, 30, 1308–1318. [Google Scholar] [CrossRef]
  24. Ding, L.; Botte, W.; Van Coile, R.; Caspeele, R. Robustness-evaluation of a stochastic dynamic system and the instant equivalent extreme-value event. Beton- Und Stahlbetonbau 2018, 113, 33–37. [Google Scholar] [CrossRef]
  25. Ding, L.; Yu, X.; Qian, K.; Ren, X.; Chen, J.; Caspeele, R. A unified regression model for the force-based dynamic increase factor in relation to progressive collapse analyses of frame structures. Eng. Struct. 2025; under review. [Google Scholar]
  26. Ding, L.; Chen, J.; Caspeele, R. Determination of dynamic collapse limit states using the energy-based method for multi-story RC frames subjected to column removal scenarios. Eng. Struct. 2024, 311, 118170. [Google Scholar] [CrossRef]
  27. Ding, L.; Droogné, D.; Botte, W.; Van Coile, R.; Caspeele, R. Structural reliability calculations considering concrete tensile membrane action using the probability density evolution method. In Proceedings of the 13th International Conference on Applications of Statistics and Probability in Civil Engineering (ICASP 13), Seoul, Republic of Korea, 26–30 May 2019; pp. 1–7. [Google Scholar]
  28. Feng, D.C.; Xie, S.C.; Li, Y.; Jin, L. Time-dependent reliability-based redundancy assessment of deteriorated RC structures against progressive collapse considering corrosion effect. Struct. Saf. 2021, 89, 102061. [Google Scholar] [CrossRef]
  29. Qian, K.; Weng, Y.H.; Liang, S.L.; Fu, F. Punching shear behavior and corrosion resistance of composite slab-column connections reinforced by BFRP and steel rebar. Eng. Struct. 2024, 304, 117589. [Google Scholar] [CrossRef]
  30. Biondini, F.; Frangopol, D.M. Time-variant redundancy and failure times of deteriorating concrete structures considering multiple limit states. Struct. Infrastruct. Eng. 2017, 13, 94–106. [Google Scholar] [CrossRef]
  31. Biondini, F.; Frangopol, D.M. Life-cycle performance of deteriorating structural systems under uncertainty: Review. J. Struct. Eng. 2016, 142, F4016001. [Google Scholar] [CrossRef]
  32. Botte, W.; Vereecken, E.; Taerwe, L.; Caspeele, R. Assessment of posttensioned concrete beams from the 1940s: Large-scale load testing, numerical analysis and Bayesian assessment of prestressing losses. Struct. Concr. 2021, 22, 1500–1522. [Google Scholar] [CrossRef]
  33. Botte, W.; Caspeele, R.; Taerwe, L. Membrane behavior in RC slabs subjected to simulated reinforcement corrosion. Eng. Struct. 2016, 123, 45–58. [Google Scholar] [CrossRef]
  34. Yu, X.H.; Qian, K.; Lu, D.G.; Li, B. Progressive collapse behavior of aging reinforced concrete structures considering corrosion effects. J. Perform. Constr. Facil. 2017, 31, 04017009. [Google Scholar] [CrossRef]
  35. Du, Y.G.; Clark, L.A.; Chan, A.H.C. Effect of corrosion on ductility of reinforcing bars. Mag. Concr. Res. 2005, 57, 407–419. [Google Scholar] [CrossRef]
  36. Qian, K.; Li, J.; Huang, T.; Weng, Y.; Deng, X. Punching shear strength of corroded reinforced concrete slab-column connections. J. Build. Eng. 2022, 45, 103489. [Google Scholar] [CrossRef]
  37. Bao, C.; Long, H.; Ma, X.; Alshaikh, I.M.H.; Mekhlafi, G.A.; Peng, L.; Wang, H. Experimental study on progressive collapse resistance of corroded RC continuous deep flexural members. Eng. Fail. Anal. 2025, 175, 109543. [Google Scholar] [CrossRef]
  38. Bao, C.; Wang, H.; Long, H.; Alshaikh, I.M.H.; Gaboby, Z.A.; Ma, X. Study on progressive collapse mechanism of RC frame structures corroded by chloride. Case Stud. Constr. Mater. 2025, 22, e04472. [Google Scholar] [CrossRef]
  39. Ding, L.C.; Peng, Y.B.; Chen, J.B. Progressive collapse behavior of RC frames subjected to reinforcement corrosion. In Proceedings of the Life-Cycle of Structures and Infrastructure Systems—Proceedings of the 8th International Symposium on Life-Cycle Civil Engineering, IALCCE 2023, Milan, Italy, 2–6 July 2023; pp. 3777–3792. [Google Scholar]
  40. Ding, L. Quantitative Assessment of Reinforced Concrete Buildings Subjected to Column Removal Scenarios Taking into Account Dynamic Response Behaviour. Ph.D. Thesis, Ghent University, Ghent, Belgium, 2021. [Google Scholar]
  41. Cavaco, E.S.; Neves, L.A.C.; Casas, J.R. On the robustness to corrosion in the life cycle assessment of an existing reinforced concrete bridge. Struct. Infrastruct. Eng. 2018, 14, 137–150. [Google Scholar] [CrossRef]
  42. Yu, B.; Ning, C.L.; Li, B. Probabilistic durability assessment of concrete structures in marine environments: Reliability and sensitivity analysis. China Ocean Eng. 2017, 31, 63–73. [Google Scholar] [CrossRef]
  43. Biondini, F.; Vergani, M. Deteriorating beam finite element for nonlinear analysis of concrete structures under corrosion. Struct. Infrastruct. Eng. 2014, 11, 519–532. [Google Scholar] [CrossRef]
  44. Yu, X.-H.; Dai, K.-Y.; Li, Y.-S. Variability in corrosion damage models and its effect on seismic collapse fragility of aging reinforced concrete frames. Constr. Build. Mater. 2021, 295, 123654. [Google Scholar] [CrossRef]
  45. Almusallam, A.A. Effect of degree of corrosion on the properties of reinforcing steel bars. Constr. Build. Mater. 2001, 15, 361–368. [Google Scholar] [CrossRef]
  46. Du, Y.G.; Clark, L.A.; Chan, A.H.C. Residual capacity of corroded reinforcing bars. Mag. Concr. Res. 2005, 57, 135–147. [Google Scholar] [CrossRef]
  47. Apostolopoulos, C.A.; Papadakis, V.G. Consequences of steel corrosion on the ductility properties of reinforcement bar. Constr. Build. Mater. 2008, 22, 2316–2324. [Google Scholar] [CrossRef]
  48. Cairns, J.; Plizzari, G.A.; Du, Y.G.; Law, D.W.; Franzoni, C. Mechanical properties of corrosion-damaged reinforcement. Aci Mater. J. 2005, 102, 256–264. [Google Scholar]
  49. Zhu, W.; François, R. Effect of corrosion pattern on the ductility of tensile reinforcement extracted from a 26-year-old corroded beam. Adv. Concr. Constr. 2013, 1, 121. [Google Scholar] [CrossRef]
  50. Yu, L.; François, R.; Dang, V.H.; L’Hostis, V.; Gagné, R. Structural performance of RC beams damaged by natural corrosion under sustained loading in a chloride environment. Eng. Struct. 2015, 96, 30–40. [Google Scholar] [CrossRef]
  51. Coronelli, D.; Gambarova, P. Structural assessment of corroded reinforced concrete beams: Modeling guidelines. J. Struct. Eng. 2004, 130, 1214–1224. [Google Scholar] [CrossRef]
  52. Castel, A.; François, R.; Arliguie, G. Mechanical behaviour of corroded reinforced concrete beams—Part 2: Bond and notch effects. Mater. Struct. 2000, 33, 545–551. [Google Scholar] [CrossRef]
  53. Cairns, J.; Millard, S. Reinforcement corrosion and its effect on residual strength of concrete structures. In Proceedings of the 8th International Conference on Structural Faults and Repair, London, UK, 1 January 1999. [Google Scholar]
  54. Vereecken, E.; Botte, W.; Lombaert, G.; Caspeele, R. A Bayesian inference approach for the updating of spatially distributed corrosion model parameters based on heterogeneous measurement data. Struct. Infrastruct. Eng. 2020, 18, 30–46. [Google Scholar] [CrossRef]
  55. Ding, L.; Chen, J. Physically-based collapse failure criteria in progressive collapse analyses of random-parameter multi-story RC structures subjected to column removal scenarios. Eng. Struct. 2025, 325, 119379. [Google Scholar] [CrossRef]
  56. Liu, M.; Pirmoz, A. Energy-based pulldown analysis for assessing the progressive collapse potential of steel frame buildings. Eng. Struct. 2016, 123, 372–378. [Google Scholar] [CrossRef]
  57. Zeng, Y.; Botte, W.; Caspeele, R. Reliability analysis of FRP strengthened RC beams considering compressive membrane action. Constr. Build. Mater. 2018, 169, 473–488. [Google Scholar] [CrossRef]
  58. Gan, Y.; Chen, J.; Li, Y.; Xu, Z. Prediction of progressive collapse resistance of RC frames using deep and cross network model. Structures 2023, 51, 800–813. [Google Scholar] [CrossRef]
  59. Ding, L.; Chen, J.; Caspeele, R. Dynamic sensitive failure mode in the progressive collapse of RC structures subjected to column removal scenarios. Eng. Struct. 2025, 323, 119301. [Google Scholar] [CrossRef]
  60. Peng, Y.; Ding, L.; Liu, J.; Chen, J. Probabilistic analysis of seismic mitigation of base-isolated structure with sliding hydromagnetic bearings based on finite element simulations. Earthq. Eng. Resil. 2023, 2, 194–210. [Google Scholar] [CrossRef]
  61. Vamvatsikos, D.; Cornell, C.A. Incremental dynamic analysis. Earthq. Eng. Struct. Dyn. 2002, 31, 491–514. [Google Scholar] [CrossRef]
  62. Peng, Y.B.; Ding, L.C.; Chen, J.B.; Liu, J.T.; Villaverde, R. Shaking table test of seismic isolated structures with sliding hydromagnetic bearings. J. Struct. Eng. 2020, 146, 04020174. [Google Scholar] [CrossRef]
  63. Ding, L.; Botte, W.; Van Coile, R.; Caspeele, R. Model uncertainty quantification for column removal scenario calculations using the energy-based method. In Proceedings of the 13th fib International PhD-Symposium In Civil Engineering, Paris, France, 26–28 August 2020. [Google Scholar]
  64. Ding, L.; Van Coile, R.; Botte, W.; Caspeele, R. Structural reliability of RC frames under sudden column removal scenarios considering static and dynamic methods. In Proceedings of the IABSE Congress: Structural Engineering for Future Societal Needs, Ghent, Belgium, 22–24 September 2021. [Google Scholar]
  65. Lin, K.; Wu, Z.; Zhu, Y.; Zheng, J.; Li, Y.; Lu, X. Progressive collapse design optimization of RC frame structures using high-performance computing. Structures 2023, 50, 823–834. [Google Scholar] [CrossRef]
  66. Ding, L.; Van Coile, R.; Botte, W.; Caspeele, R. Reliability-based robustness quantification of RC structures subjected to dynamic effects following sudden column removal scenarios. In Proceedings of the 13th International Conference on Structural Safety and Reliability (ICOSSAR 2021), Shanghai, China, 21–25 June 2021. [Google Scholar]
  67. Huang, M.; Huang, H.; Hao, R.; Chen, Z.; Li, M.; Deng, W. Studies on secondary progressive collapse-resistance mechanisms of reinforced concrete subassemblages. Struct. Concr. 2021, 22, 2138–2154. [Google Scholar] [CrossRef]
  68. Baker, J.W.; Schubert, M.; Faber, M.H. On the assessment of robustness. Struct. Saf. 2008, 30, 253–267. [Google Scholar] [CrossRef]
  69. Ding, L.C.; Chen, J.B. Determination of dynamic progressive collapse resistances for deteriorating multi-story RC frames subjected to column removal scenarios via the energy-based method. In Proceedings of the 14th International Conference on Application of Statistics and Probability in Civil Engineering (ICASP14), Dublin, Ireland, 9–13 July 2023. [Google Scholar]
  70. Mazzoni, S.; McKenna, F.; Scott, M.H.; Fenves, G.L. OpenSees Command Language Manual; Pacific Earthquake Engineering Research (PEER) Center: Berkeley, CA, USA, 2006; Volume 264. [Google Scholar]
  71. Feng, D.; Wang, Z.; Wu, G. Progressive collapse performance analysis of precast reinforced concrete structures. Struct. Des. Tall Spec. Build. 2019, 28, e1588. [Google Scholar] [CrossRef]
  72. Feng, D.C.; Ren, X.D. Implicit gradient-enhanced force-based Timoshenko fiber element formulation for reinforced concrete structures. Int. J. Numer. Methods Eng. 2021, 122, 325–347. [Google Scholar] [CrossRef]
  73. Ceresa, P.; Petrini, L.; Pinho, R. Flexure-shear fiber beam-column elements for modeling frame structures under seismic loading—State of the art. J. Earthq. Eng. 2007, 11, 46–88. [Google Scholar] [CrossRef]
  74. Vecchio, F.J.; Collins, M.P. The modified compression-field theory for reinforced-concrete elements subjected to shear. J Am Concr. I 1986, 83, 219–231. [Google Scholar]
  75. Lowes, L.N.; Altoontash, A. Modeling reinforced-concrete beam-column joints subjected to cyclic loading. J. Struct. Eng. 2003, 129, 1686–1697. [Google Scholar] [CrossRef]
  76. Mander, J.B.; Priestley, M.J.N.; Park, R. Theoretical stress-strain model for confined concrete. J. Struct. Eng. 1988, 114, 1804–1826. [Google Scholar] [CrossRef]
  77. Stevens, N.J.; Uzumeri, S.M.; Will, G.T. Constitutive model for reinforced concrete finite element analysis. Struct. J. 1991, 88, 49–59. [Google Scholar]
  78. Esmaeiltabar, P.; Vaseghi, J.; Khosravi, H. Nonlinear macro modeling of slender reinforced concrete shear walls. Struct. Concr. 2019, 20, 899–910. [Google Scholar] [CrossRef]
  79. Qian, K.; Li, B.; Ma, J.X. Load-carrying mechanism to resist progressive collapse of RC buildings. J. Struct. Eng. 2014, 141, 04014107. [Google Scholar] [CrossRef]
  80. Yi, W.J.; He, Q.F.; Xiao, Y.; Kunnath, S.K. Experimental study on progressive collapse-resistant behavior of reinforced concrete frame structures. ACI Struct. J. 2008, 105, 433–439. [Google Scholar] [CrossRef] [PubMed]
  81. EN 1991-1-1; Eurocode 1: Actions on Structures-Part 1-1: General Actions-Densities, Self-Weight, Imposed Loads for Buildings. European Committee for Standardization Brussels (CEN): Brussels, Belgium, 2002.
  82. EN 1992-1-1; Eurocode 2: Design of Concrete Structures—Part 1-1: General Rules and Rules for Buildings. European Committee for Standardization Brussels (CEN): Brussels, Belgium, 2004.
  83. fib. fib Model Code for Concrete Structures 2010; fib: Lausanne, Switzerland, 2013. [Google Scholar]
  84. JCSS. Probabilistic Model Code; Joint Committee on Structural Safety: Copenhagen, Denmark, 2001. [Google Scholar]
  85. Ting, S.; Nowak, A.S. Effect of reinforcing steel area loss on flexural behavior of reinforced concrete beams. Struct. J. 1991, 88, 309–314. [Google Scholar]
  86. Droogné, D.; Botte, W.; Caspeele, R. A multilevel calculation scheme for risk-based robustness quantification of reinforced concrete frames. Eng. Struct. 2018, 160, 56–70. [Google Scholar] [CrossRef]
  87. Liang, C.F.; Xiao, J.Z.; Wang, Y.F.; Wang, C.H.; Mei, S.Q. Relationship between internal viscous damping and stiffness of concrete material and structure. Struct. Concr. 2021, 22, 1410–1428. [Google Scholar] [CrossRef]
  88. Ding, L.; Chen, J. Investigation of dynamic sensitive danger zone for RC structures against progressive collapse by the phase plane method. Eng. Mech. 2024, 1–11. Available online: https://engineeringmechanics.cn/article/doi/10.6052/j.issn.1000-4750.2023.08.0607 (accessed on 1 July 2025).
  89. Ding, L.; Chen, J.; Peng, Y.; Caspeele, R. Physically-based dynamic collapse criterion for RC frame structures against progressive collapse and its evaluation considering uncertainties. In Proceedings of the 9th International Symposium on Reliability Engineering and Risk Management (ISRERM 2024), Hefei, China, 18–21 October 2024. [Google Scholar]
  90. Ding, L.; Chen, J.; Caspeele, R. Concept of dynamic sensitive failure mode during progressive collapse of RC building structures. In Proceedings of the 4th International Conference on Vulnerability and Risk Analysis and Management (ICVRAM2024) & 8th International Symposium on Uncertainty Modelling and Analysis (ISUMA2024), Shanghai, China, 25–27 April 2024. [Google Scholar]
Figure 1. Schematic illustration of cross-sectional area reduction in corroded bar.
Buildings 15 02534 g001
Figure 2. Illustration: (a) an RC frame subjected to the middle column removal scenario; (b) load–displacement curves; and (c) time–history displacement responses.
Buildings 15 02534 g002
Figure 3. Numerical modeling strategies by using OpenSees: RC frame, force-based element, fiber section, ConcreteD model, Steel02 model, and Joint2D element.
Buildings 15 02534 g003
Figure 4. Validation of the numerical modeling strategies.
Buildings 15 02534 g004
Figure 5. RC frame: (a) layout and (b) beam and column cross-sections (units in mm).
Buildings 15 02534 g005
Figure 6. (a) Steel ultimate strain vs. corrosion level α and (b) removal of the ground column C.
Buildings 15 02534 g006
Figure 7. Results of static load–displacement relationships under different corrosion levels: (a) Model 1; (b) Model 2; (c) Model 3; and (d) Model 4.
Buildings 15 02534 g007aBuildings 15 02534 g007b
Figure 8. Results of resistance against corrosion level α: (a) corrosion in reinforcement and (b) influence of deteriorated concrete.
Buildings 15 02534 g008
Figure 9. Results of resistance against corrosion level α: (a) corrosion in beams and/or in columns and (b) different numbers of floors in DAP subjected to corrosion.
Buildings 15 02534 g009
Figure 10. Results of resistance against corrosion level α: (a) any one or two floors in DAP and (b) any three or four floors in DAP.
Buildings 15 02534 g010
Figure 11. Column removal scenarios: (a) loss of column A and (b) loss of column B.
Buildings 15 02534 g011
Figure 12. Results of resistance against corrosion level α: (a) different column removals and (b) different numbers of floor in DAP.
Buildings 15 02534 g012
Figure 13. Time–history displacement responses when α = 20%: (a) Case A and (b) Case C.
Buildings 15 02534 g013
Figure 14. Load-displacement curves: (a) Case A and (b) Case C.
Buildings 15 02534 g014
Figure 15. Results of resistance against corrosion level α: (a) all three cases; (b) Case A; (c) Case B; and (d) Case C.
Buildings 15 02534 g015aBuildings 15 02534 g015b
Figure 16. Percentage of resistance vs. corrosion level α: (a) Case A; (b) Case B; and (c) Case C.
Buildings 15 02534 g016
Figure 17. Comparison between EBM and IDA.
Buildings 15 02534 g017
Table 1. Mechanical properties for concrete and reinforcement materials.
MaterialParameterUnitMean Value
Concrete Compressive   strength   f c MPa28
Compressive   peak   strain   ε c 1 %0.21
Tensile   strength   f c t MPa2.2
Young s   modulus   E c i GPa30.3
Steel Yield   stress   f y MPa560
Tensile   strength   f u MPa655
Ultimate   strain   ε u %12
Young s   modulus   E s GPa205
Disclaimer/Publisher’s Note: The statements, opinions and data contained in all publications are solely those of the individual author(s) and contributor(s) and not of MDPI and/or the editor(s). MDPI and/or the editor(s) disclaim responsibility for any injury to people or property resulting from any ideas, methods, instructions or products referred to in the content.

