1. Introduction
Urban morphology has long been shaped by landmark public facilities, among which sports stadiums play a critical role due to their scale, location, and ability to attract socioeconomic activities [
1,
2,
3]. As prominent nodes within urban landscapes, sports facilities significantly influence local urban form and function, altering surrounding land-use patterns, boosting economic vitality, and catalyzing urban regeneration processes [
4,
5,
6]. Despite extensive research into urban morphology and facility-driven regeneration, empirical quantitative studies evaluating the spatial impacts of sports stadiums remain relatively scarce, particularly in rapidly urbanizing regions such as China [
7,
8]. The existing literature rarely quantitatively assesses how historic sports venues facilitate long-term urban transformation [
9]. Addressing this research gap is essential for comprehending the broader implications of stadiums on sustainable urban development and providing critical insights to inform strategic urban planning and regeneration policies [
2,
10].
Shanghai’s Jiangwan Stadium, constructed in the early 1930s, holds historical significance as China’s first large-scale, Western-style sports venue and represents a unique case for examining the interplay between sports architecture and urban development [
11]. Over nearly a century, the stadium has witnessed extensive urban changes, shifting from an initial suburban context to a vibrant urban node deeply integrated into Shanghai’s broader urban fabric [
12]. Although previous qualitative studies have described its historical and architectural value [
13], there is limited quantitative research into how this particular stadium has shaped surrounding land-uses, influenced local economic activities, and contributed to urban regeneration. As Shanghai continues its rapid urbanization, empirically assessing Jiangwan Stadium’s long-term morphological and functional impacts is essential not only to preserve its cultural heritage but also to derive strategic insights for sustainably integrating sports facilities into contemporary urban planning [
14,
15].
This study aims to answer three core research questions:
- (1)
How has Jiangwan Stadium influenced the spatiotemporal evolution of urban functions around its vicinity?
- (2)
In what ways has the stadium affected the diversity and intensity of economic activities in surrounding areas?
- (3)
What spatial distribution patterns and radiating effects can be identified across multiple scales?
It is important to acknowledge that urban transformation is shaped by a multitude of factors beyond the presence of sports architecture, including historical planning decisions, infrastructure investments, and nearby institutional developments. Therefore, while we aim to isolate the stadium’s influence, we do not claim to provide definitive causal attribution. This consideration underscores the importance of an interdisciplinary approach to understanding the spatial and functional impact of historical sports facilities.
2. Literature Review
Sports facilities have long been recognized as key drivers of urban regeneration, primarily through their ability to catalyze economic growth, reshape land-use patterns, and enhance urban vitality [
1,
16,
17]. Internationally, major sporting events such as the Olympics and FIFA World Cups have often triggered extensive urban redevelopment projects, influencing local economies, property values, and community structures [
18,
19]. However, existing studies have predominantly focused on qualitative evaluations of these mega-events or flagship projects, emphasizing their immediate or short-term impacts rather than sustained, long-term spatial transformations [
1,
4].
Recent advancements in Geographic Information Systems (GIS) and the increased availability of Points of Interest (POI) data offer novel opportunities for quantitatively analyzing urban functional evolution [
20,
21]. POI data, providing detailed and dynamic spatial information, have been increasingly employed to measure urban vitality, functional diversity, and land-use dynamics [
22,
23]. Nonetheless, applications of these methods to sports-related urban transformations remain limited, particularly regarding smaller-scale historic sports venues and their long-term influence on surrounding urban morphology [
23,
24]. Further studies, such as Testa et al. (2023), highlight the local impact of sports centers on residents’ future intentions and social perception [
25], while Wang et al. (2025) emphasize the importance of evaluating accessibility and equity of public sports infrastructure at the neighborhood scale [
26]. These references enrich the discourse on the broader implications of sports facilities in shaping urban life and spatial development.
This research gap is particularly pronounced in rapidly urbanizing contexts such as China, where historic sports facilities’ roles in urban development are often qualitatively documented but rarely quantitatively assessed [
14]. As such, comprehensive empirical studies examining how historic stadiums influence urban functions, spatial restructuring, and economic vitality over extended periods are necessary. Addressing this gap, our study employs POI-based GIS spatial analyses and statistical techniques to quantify the long-term urban morphological and functional impacts of Jiangwan Stadium, Shanghai’s iconic historic sports facility. By doing so, this study contributes to the existing literature on urban regeneration, offering practical insights and a methodological framework applicable to similar urban contexts globally.
3. Material and Methods
3.1. Study Sample
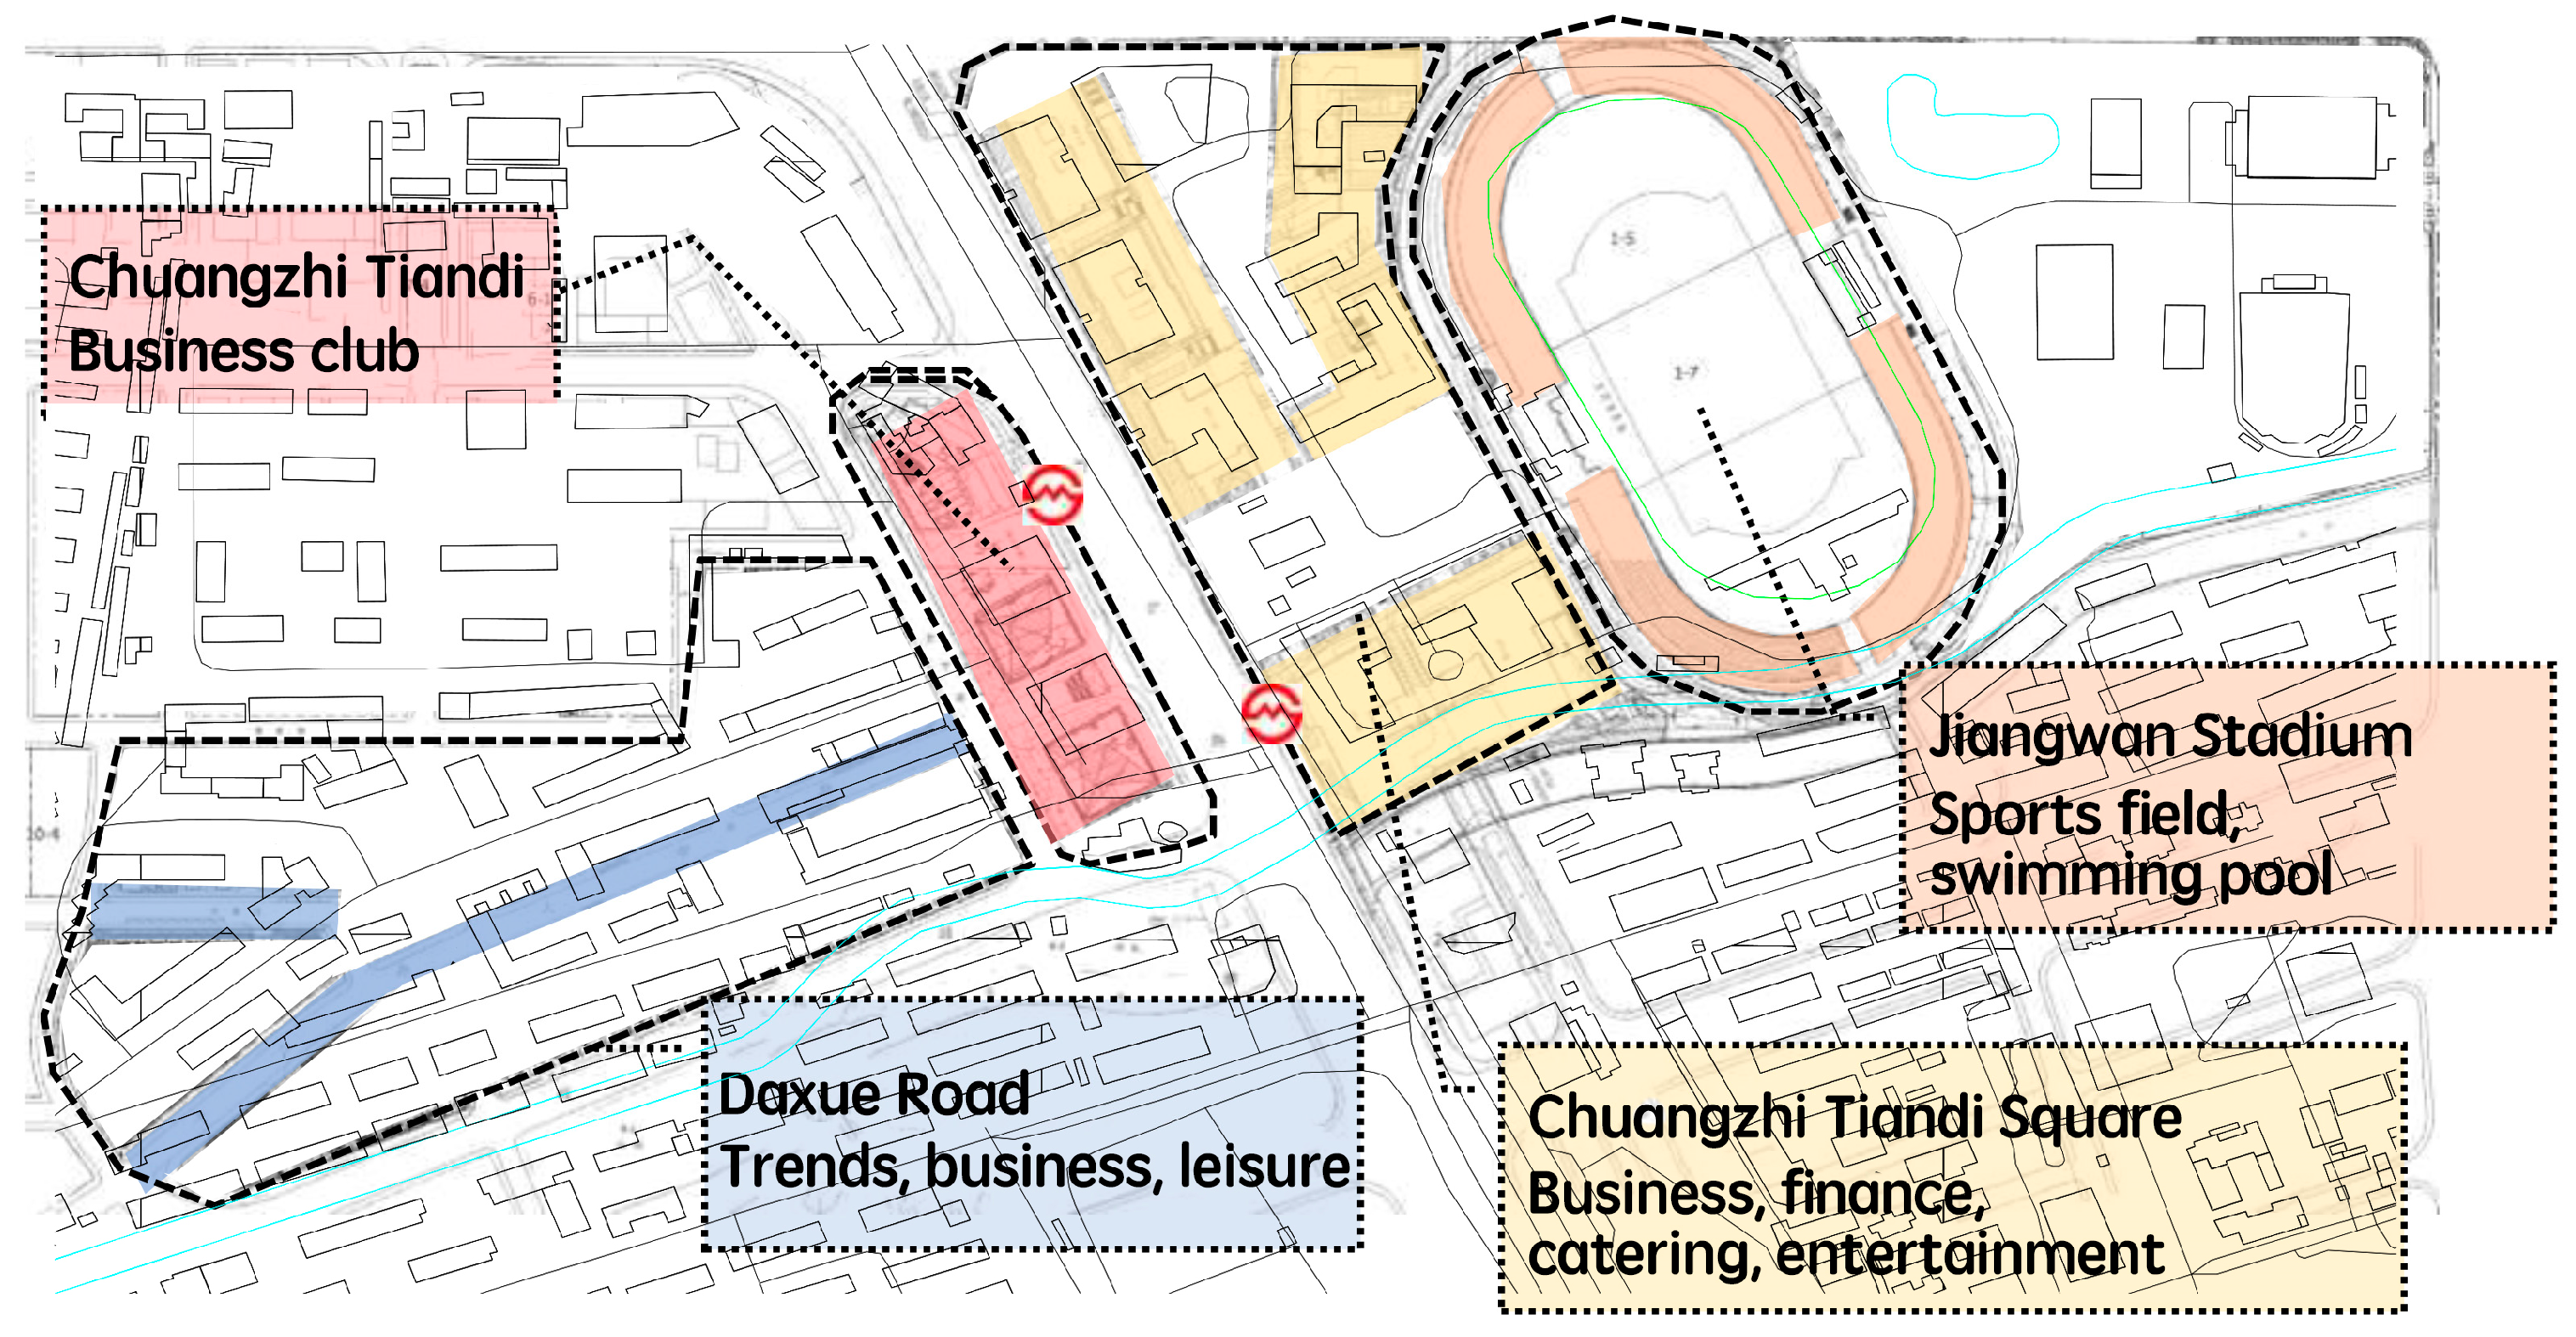
This study focuses on Jiangwan Stadium (
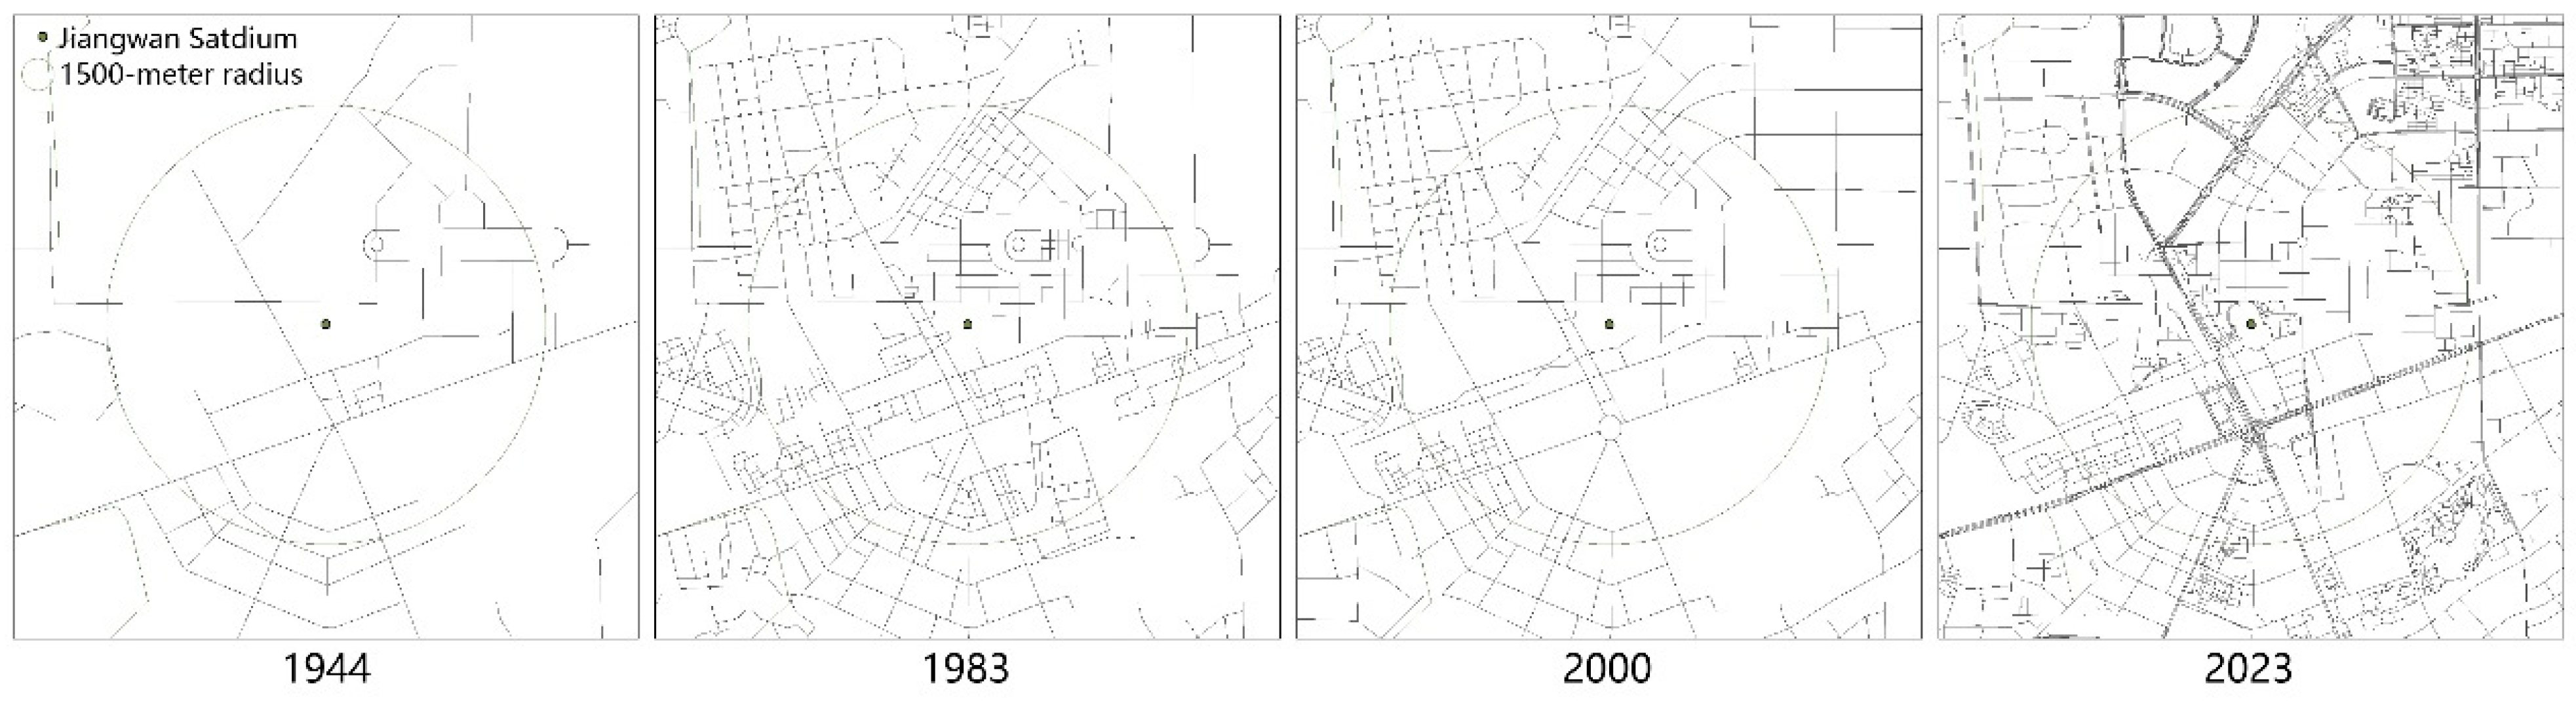
Figure 1), situated in northeastern Shanghai. Constructed in 1935, the stadium originally served as a suburban sports venue and has gradually integrated into Shanghai’s expanding urban core (
Figure 2). Historically significant as China’s earliest Western-style sports stadium, Jiangwan Stadium provides an exemplary case for studying long-term stadium-driven urban morphological changes and regeneration dynamics. The study specifically examines the stadium’s surrounding areas using buffer zones at 500 m, 1000 m, and 1500 m radii, capturing fine-grained spatial impacts and radiating urban patterns over a temporal scope extending from 1980 to 2023.
3.2. Data Preparation
We utilized comprehensive Point of Interest (POI) datasets provided by AMap, one of China’s most prominent digital map providers. The full POI dataset spans from 1980 to 2023, with 1980 representing the earliest year for which continuous and geocoded records are available. However, only data from 2004 to 2021 were used in the core statistical modeling and regression analysis due to the availability of consistent and verified annual records. Data for 2023 was incorporated solely for descriptive spatial visualization, as 2024 data was incomplete at the time of study initiation.
Descriptive spatial analyses, such as Kernel Density Estimation (KDE), utilized the broader 1980–2023 dataset to contextualize long-term morphological shifts. KDE snapshots were generated at four-year intervals, aligning with China’s municipal and national urban planning cycles, which typically operate on five-year horizons. Annual snapshots were avoided to reduce short-term fluctuations and emphasize more sustained urban transformation patterns. This methodological distinction ensures the analytical robustness of our findings, particularly regarding transportation growth trends, which were calculated strictly within the 2004–2021 data window.
These POI datasets contain detailed attributes on specific urban facilities, including commercial enterprises, public services, recreational facilities, and transportation nodes, offering accurate representations of spatial-functional distributions and economic activities [
27,
28]. In addition, historical and contemporary urban planning documents and relevant official reports from the Shanghai Urban Planning Bureau were reviewed to contextualize POI data and enhance analytical accuracy.
3.3. Methods and Framework
This study employs a multi-method analytical framework combining Geographic Information Systems (GIS)-based spatial analytical techniques, statistical methods, and spatial modeling tools. First, POI datasets were categorized according to standard land-use classification systems, generating comparable functional categories, such as commercial, service, residential, recreational, and transportation-related uses [
22]. Second, spatiotemporal density changes and spatial concentrations of these categories were analyzed through Kernel Density Estimation (KDE) in ArcGIS. KDE provides spatially explicit insights into how urban functions cluster or disperse over time, revealing dynamic patterns of urban vitality around Jiangwan Stadium [
23].
The analytical framework employed multiple methods to understand the functional evolution around Jiangwan Stadium, consisting of three main stages:
3.3.1. Kernel Density Estimation (KDE)
KDE was used to analyze the spatial clustering of POIs over different time periods. This method allowed visualization of density changes within a 1000 m radius of the stadium. KDE was conducted at fixed four-year intervals to provide a consistent basis for analyzing temporal changes in density.
The kernel density estimation formula is:
where
is the estimated density at point .
K is the kernel function (e.g., Gaussian kernel).
h is the bandwidth, controlling the smoothness of the estimate.
n is the total number of sample points.
Xi is the location of the i-th sample point.
Bandwidth selection was based on Silverman’s rule of thumb to balance between over-smoothing and under-smoothing [
29].
3.3.2. Functional Mix Analysis
Functional mix analysis determined the diversity of functions within buffer zones of 500 m to 3000 m around the stadium. This method calculated the level of mixed-use across different urban functions, highlighting the coexistence of various activities such as commerce, recreation, and residential uses. Adapted from Dovey and Pafka (2017), the analysis assessed how urban vitality is influenced by different functional compositions [
30].
The functional mix degree
for study area
k was calculated using:
where
Nk is the total number of POIs in area k.
ni is the number of POIs of type i in area k.
fi is the proportion of POIs of type i.
Lk represents the entropy-based measure of functional diversity.
3.3.3. Statistical Analysis
The chi-square test assessed whether the distribution of POI categories around Jiangwan Stadium differed significantly from the general pattern in Yangpu District. This test evaluated the correlation between the growth of specific services and their proximity to the stadium over time, providing insights into the stadium’s influence on functional categories [
31].
The chi-square statistic is calculated as:
where
The predictive model estimates the evolution of features around Jiangwan Stadium over the next five years. It calculates the mean and standard deviation of POI growth rates for each category, followed by normalization to account for variations. Linear regression analysis is employed to forecast future development of urban functions, aiding in strategic planning and assessment of potential impacts. The complete calculation process is included in
Appendix A.
Forecasting Future Growth
Projection Period: The model projects growth for the next five years (2024–2028).
Using Regression Models: We applied the regression equations to forecast the expected POI counts for each category in the future years.
Calculating Projected Growth Rates:
Normalization and Adjustment
Normalization: To account for variations in scale across categories, we normalized the growth rates using z-scores:
4. Findings
This chapter presents detailed results aligned with the three research objectives defined earlier: (1) characterizing spatiotemporal evolution of urban functions around Jiangwan Stadium, (2) evaluating the stadium’s impact on economic diversity and intensity, and (3) analyzing spatial distribution patterns and radiating effects.
4.1. Overall Spatiotemporal Evolution Around Jiangwan Stadium
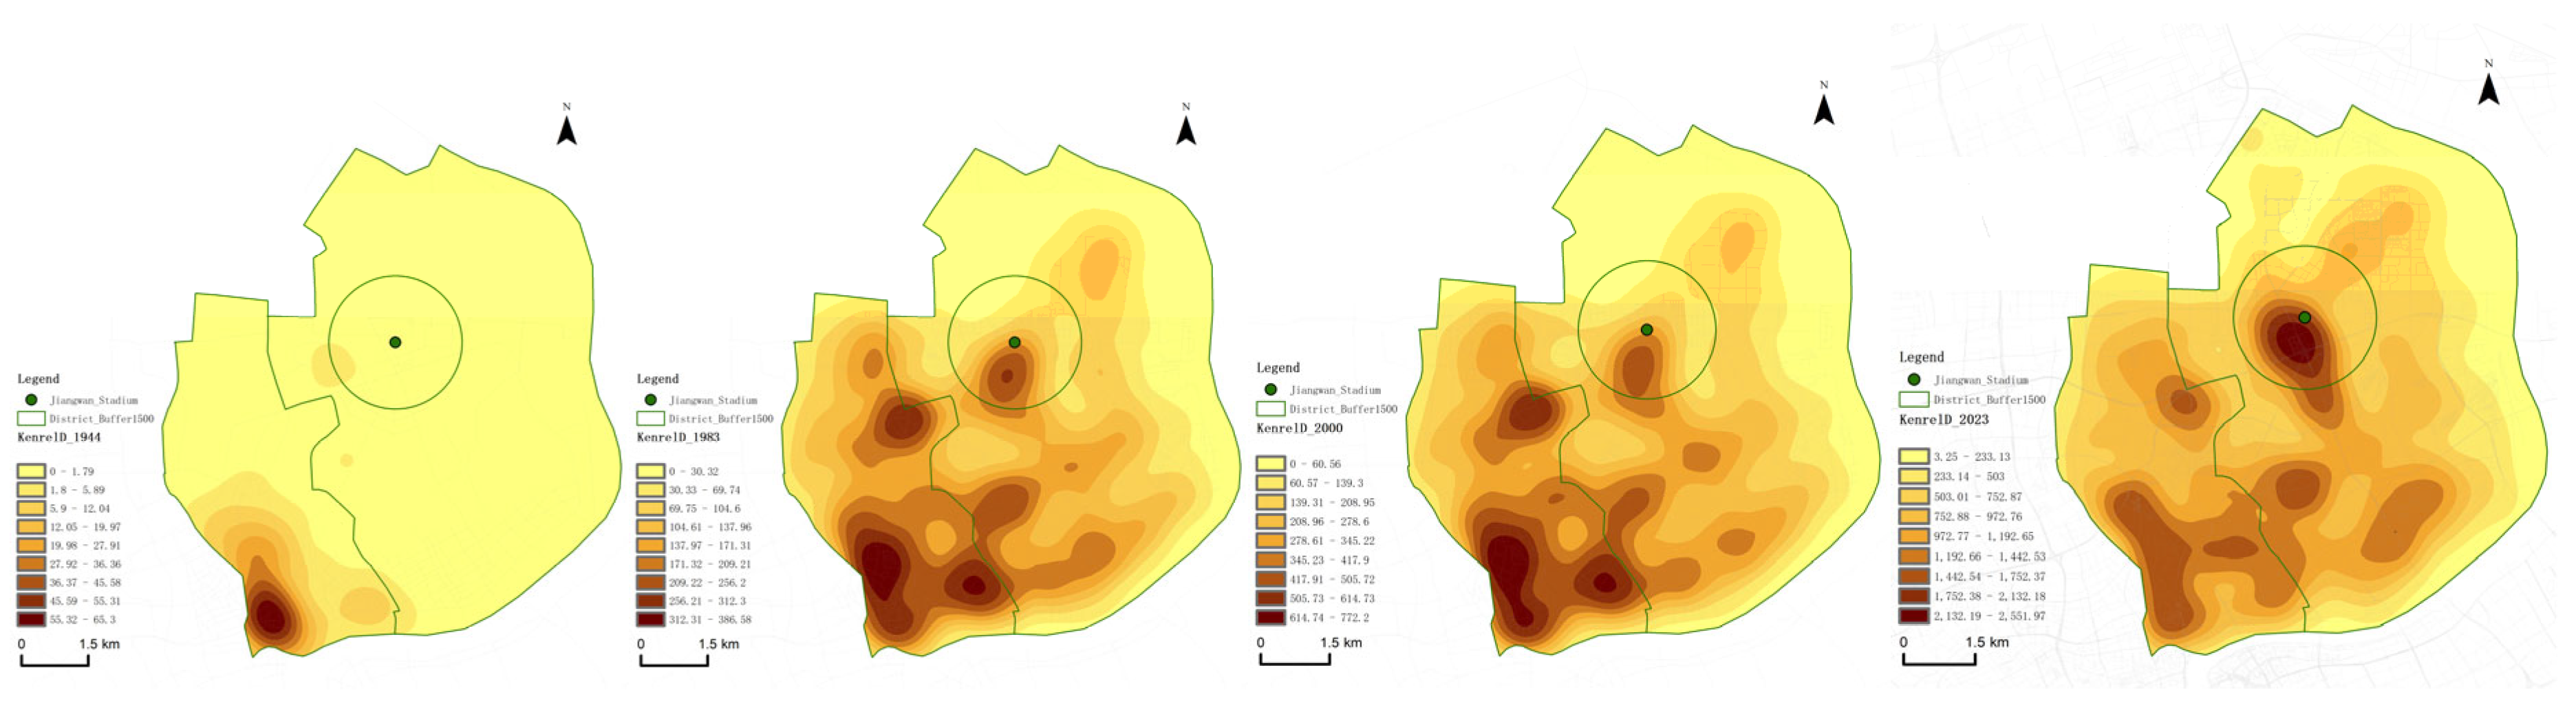
The spatial analysis of Point of Interest (POI) data from 1980 to 2023 reveals significant transformations in the urban fabric surrounding Jiangwan Stadium. Initially, the area exhibited sparse POI distributions, indicative of limited economic and social activities. Over the decades, there has been a substantial increase in POI density, particularly within the 500 m to 1500 m radii of the stadium (
Figure 3). This shift reflects a transition from diffusion to aggregation and clustering patterns, underscoring the stadium’s evolving role as a central urban hub in the Yangpu District.
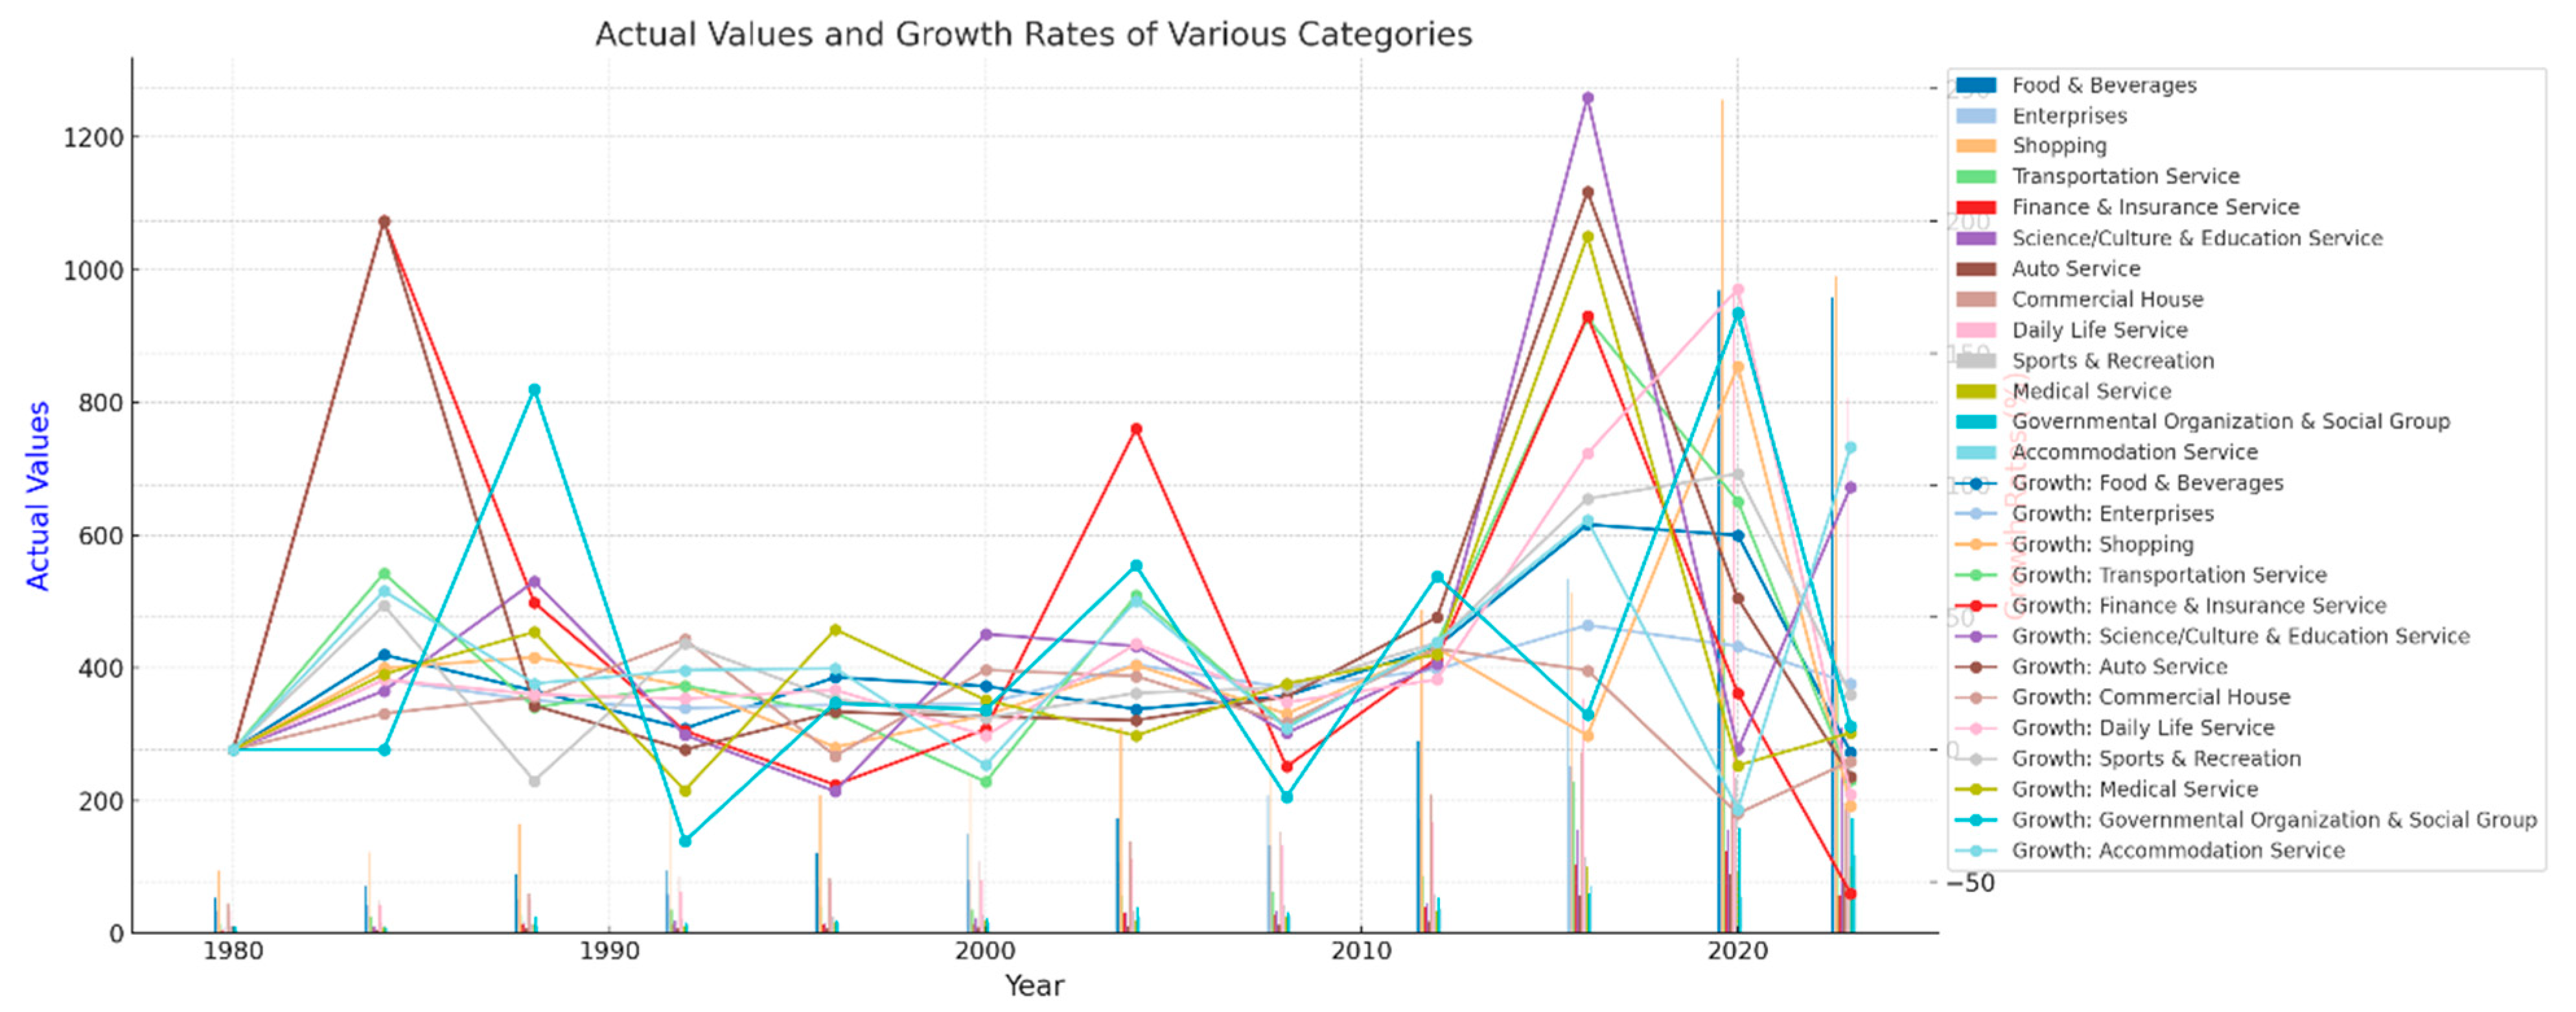
4.2. Sectoral Growth Patterns and Economic Diversification
A detailed examination of POI growth across major urban function categories—Food and Beverage, Enterprises, Shopping, Transportation Services, Finance and Insurance—reveals significant differential growth rates when benchmarked against the broader Yangpu District (
Table 1).
4.2.1. Food and Beverage
Within a 500 m radius, Food and Beverage POIs grew by approximately 1727%, significantly outperforming the district-wide growth rate (1428%). Within a 1000 m radius, this growth remained robust at 1709%.
The pronounced concentration indicates the stadium’s critical role in stimulating the local dining industry, likely driven by event-related consumer traffic and daily visitation.
4.2.2. Enterprises and Commercial Activity
Enterprise POIs within a 500 m radius grew by 1133% (district-wide: 498%), while Shopping grew by 967% (district-wide: 744%).
This strong growth demonstrates the stadium’s ability to attract sustained business and retail activity, transforming its immediate surroundings into a vibrant commercial hub.
4.2.3. Transportation and Infrastructure Development
Transportation-related POIs experienced an exceptional increase, particularly within the 500 m radius (6000% growth vs. district-wide 2884%). This substantial investment in transportation infrastructure can be attributed directly to event-generated demand, underlining the stadium’s significant infrastructural impact.
4.2.4. Finance and Insurance Services
Within 500 m of the stadium, POIs in Finance and Insurance surged by 2100% (district-wide: 641%), reflecting the growing demand for financial services accompanying increased economic activity and business presence near the stadium.
These findings clearly demonstrate that Jiangwan Stadium has significantly influenced the economic vitality and diversity of urban functions, particularly enhancing the local concentration of service-oriented and commercial activities.
4.3. Spatial Patterns and Radiation Effects
Spatial analysis indicates clear patterns of differential impact based on proximity to Jiangwan Stadium, capturing its radiating influence across defined buffer zones:
500 m High-Intensity Zone: Exhibits extreme clustering of Transportation and Financial services, directly correlated with stadium-driven visitor traffic and increased business activity.
1000–1500 m Moderate-Intensity Zone: Beyond the immediate vicinity, Enterprises, Shopping, and Food and Beverage sectors display robust growth rates, though less intensely than within 500 m, confirming the spatial gradient of stadium influence.
Overall, this analysis provides clear quantitative evidence of spatial influence patterns radiating outward from the stadium, demonstrating its effective spatial reach in shaping urban morphology and function (
Figure 4).
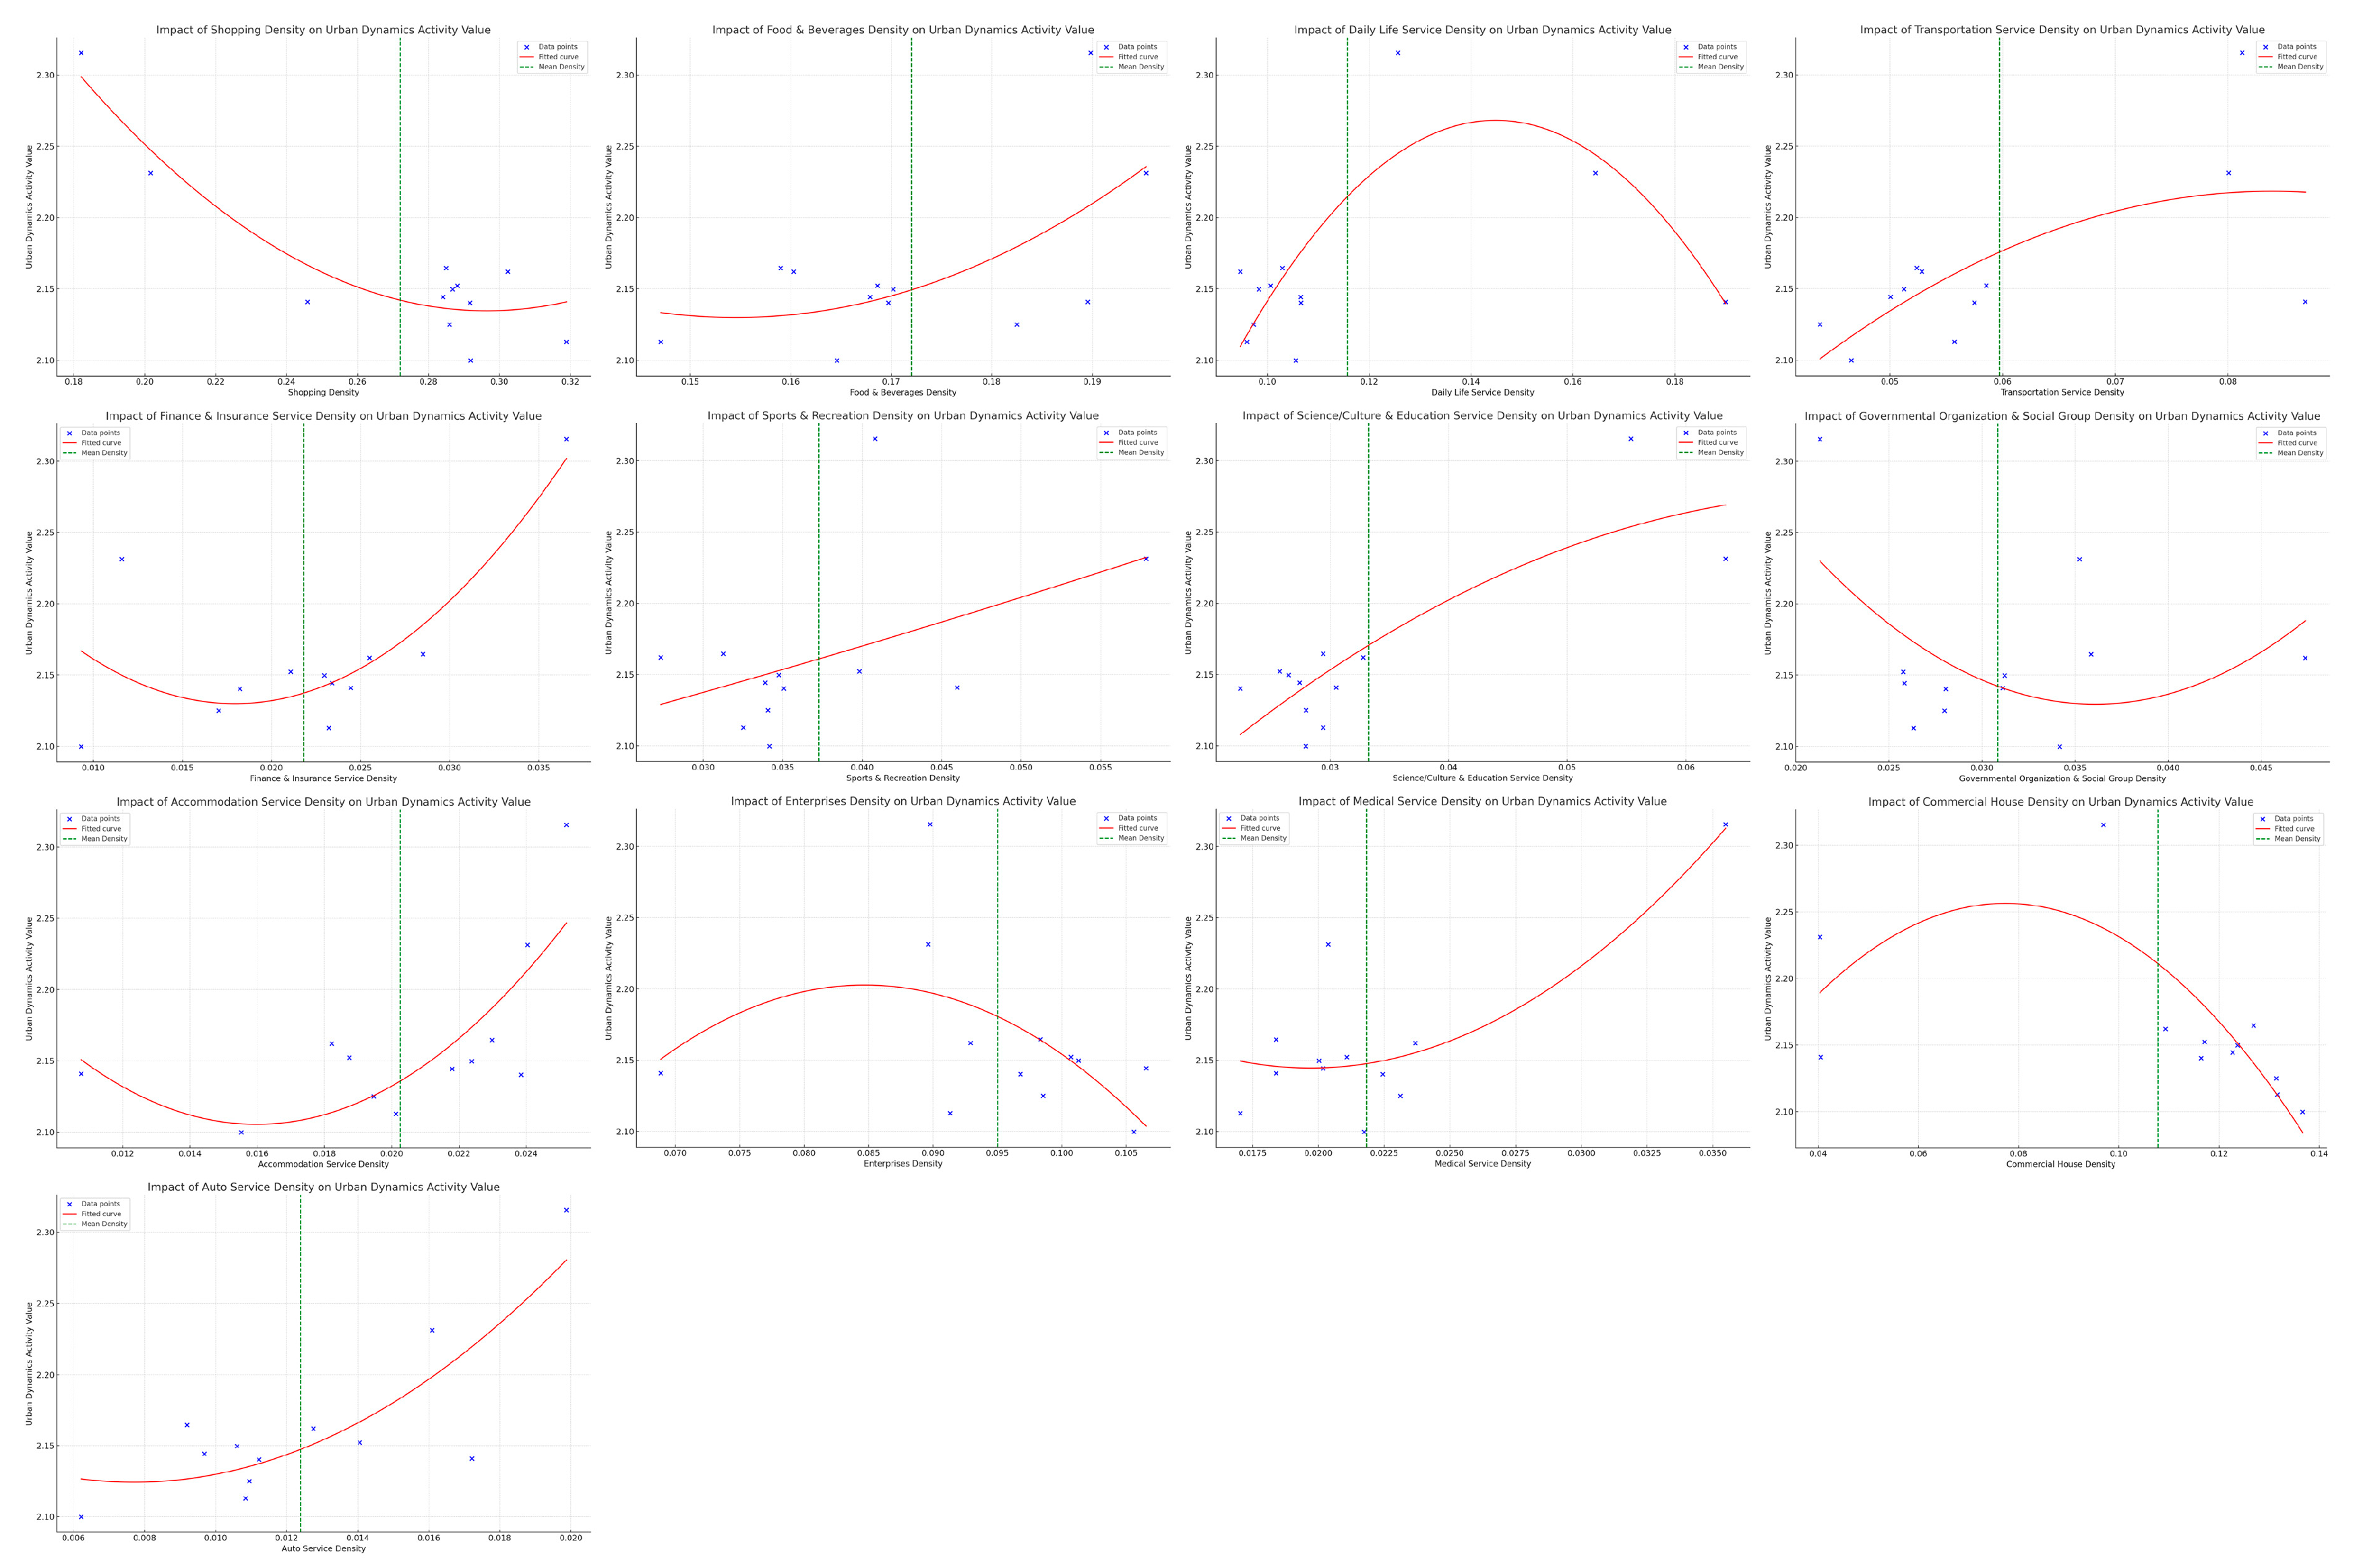
4.4. Urban Vitality and Functional Mix Optimization
Functional Mix Analysis revealed that the 1000 m radius experienced the highest urban vitality, particularly in 2016, which marked the peak of functional diversity around Jiangwan Stadium. Although some fluctuations occurred, the overall trend showed stabilization in urban functions, highlighting the balanced integration of residential, commercial, and service-oriented activities.
The functional mix proportions observed in 2016 (
Figure 5)—Food and Beverage (17–19%), Shopping (16–18%), Daily Life Services (11–13%), and Commercial Housing (9–10%)—are interpreted as indicative of a highly vibrant urban condition. These ratios are not presented as universally optimal but rather as context-specific benchmarks associated with elevated urban vitality during the period analyzed. Sensitivity tests conducted using 500 m and 1500 m buffer zones produced comparable yet slightly varied ratios, reinforcing the spatial consistency of these patterns.
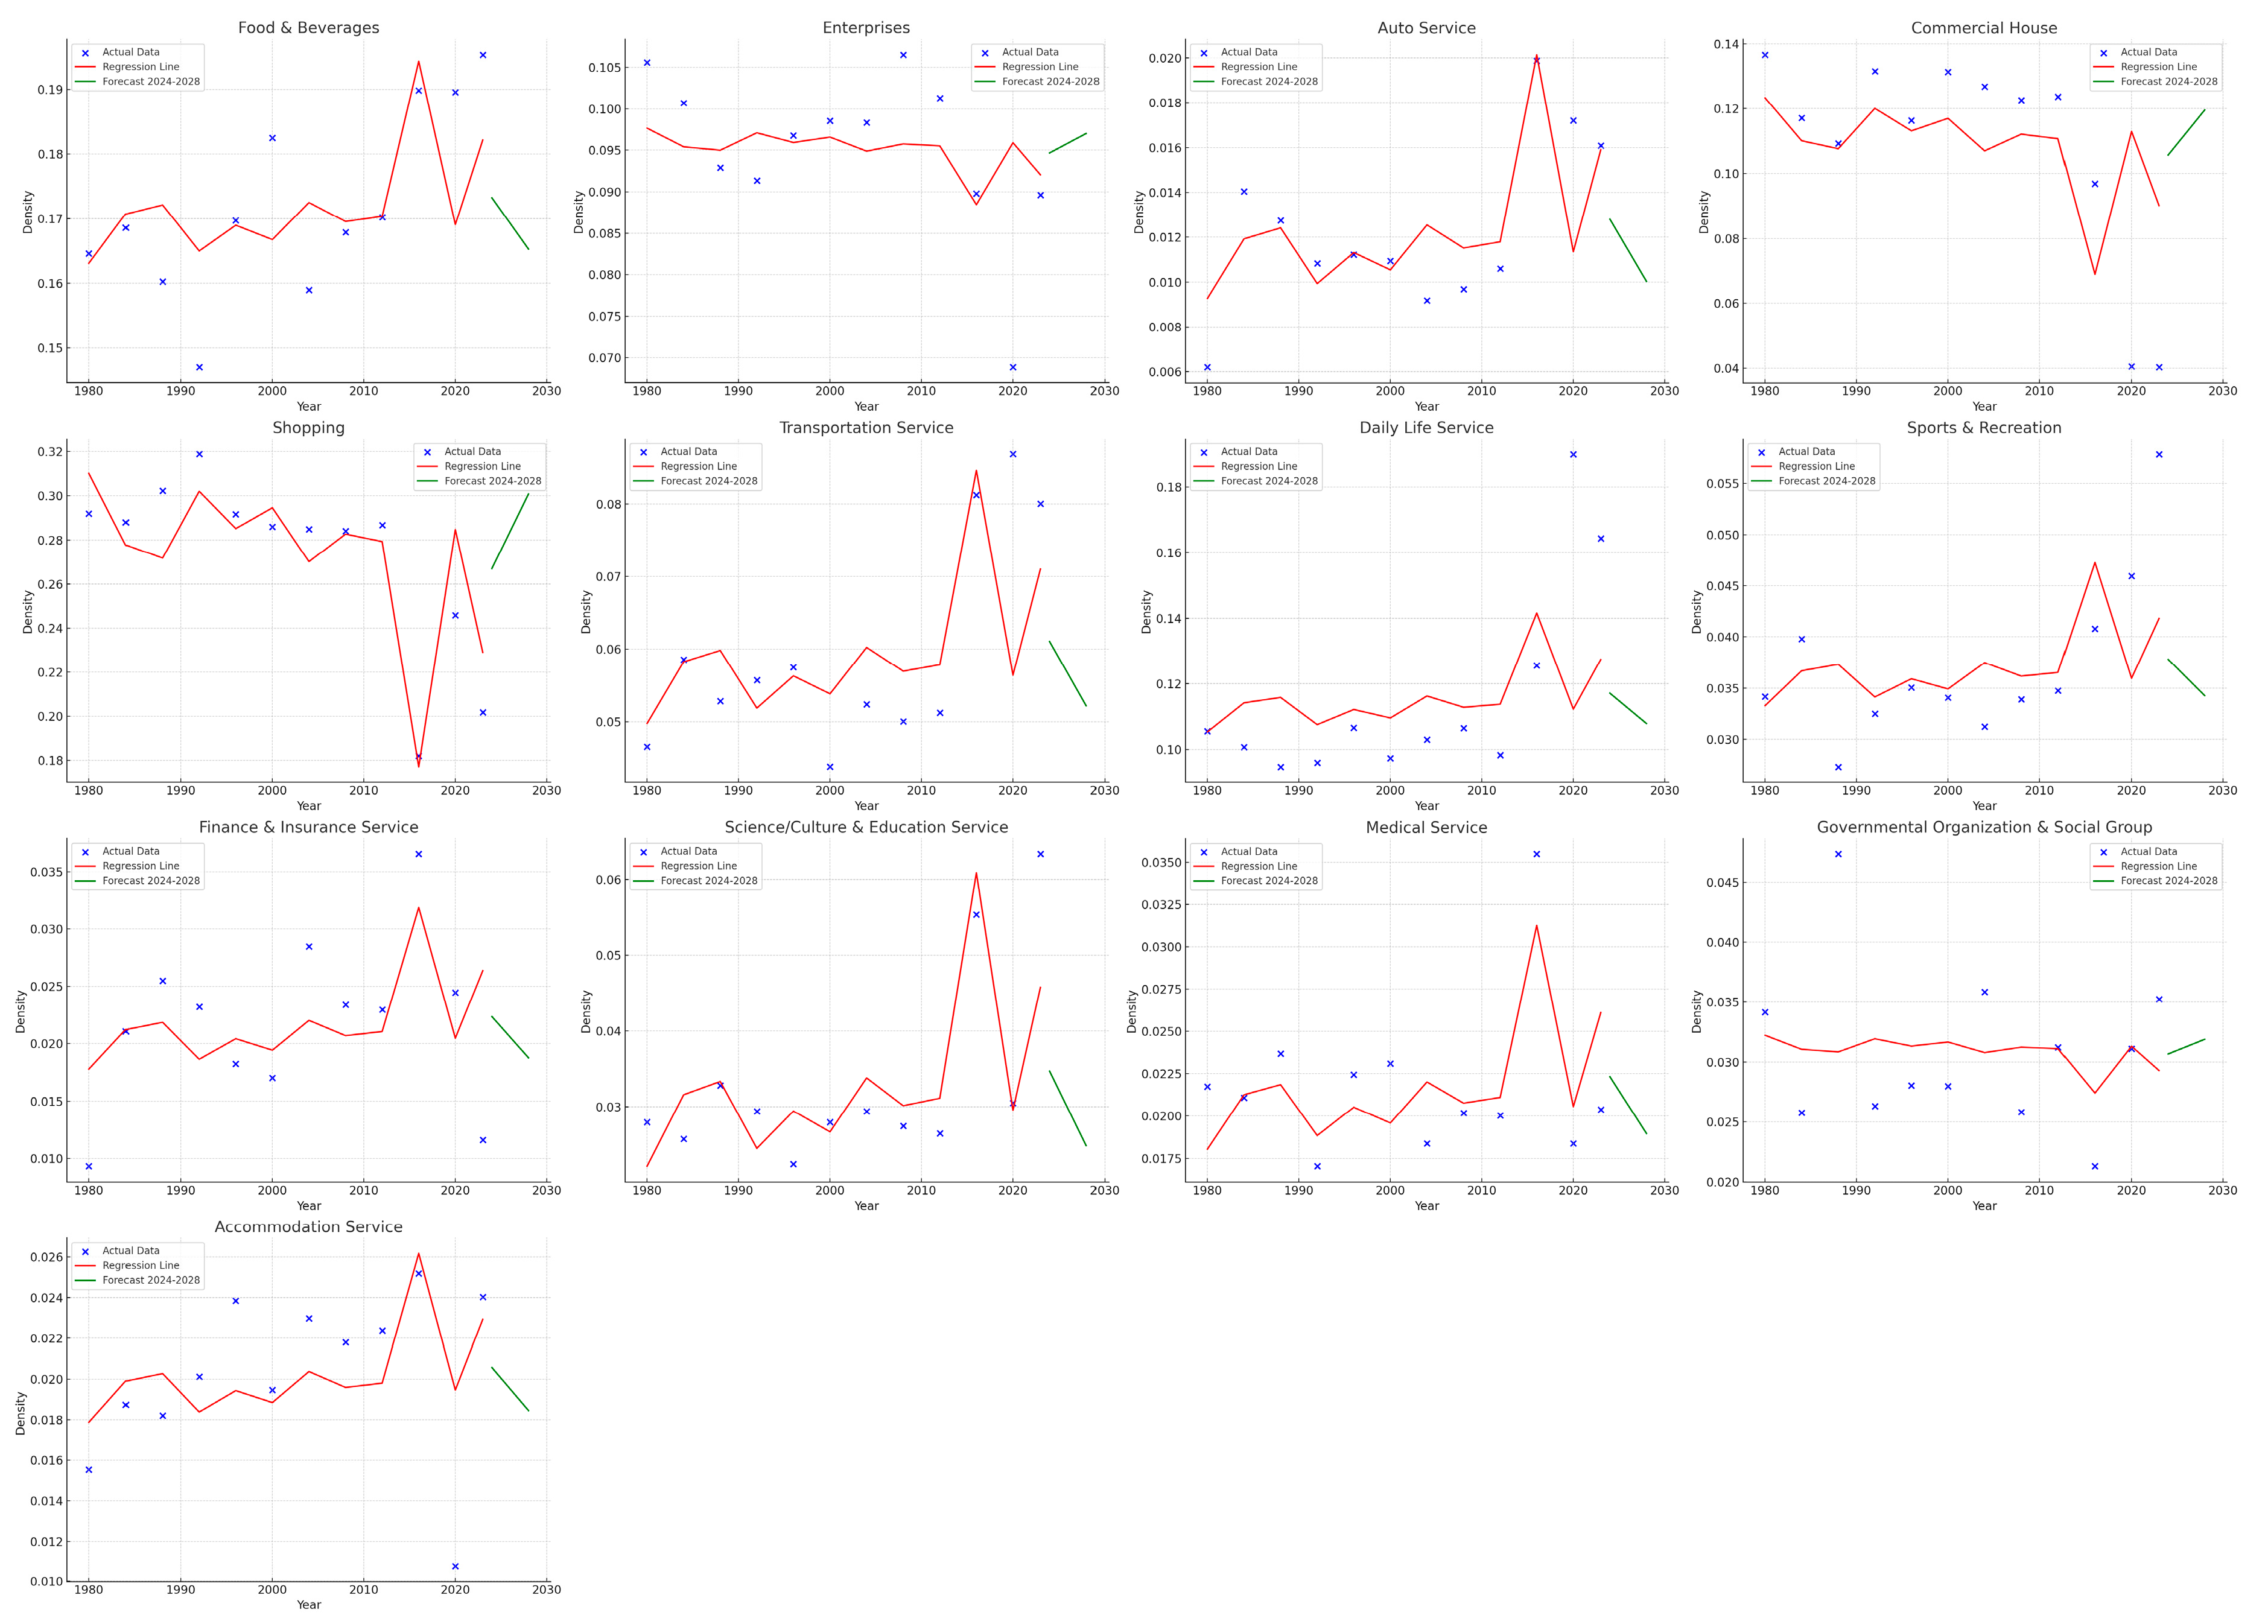
4.5. Predictive Insights and Future Implications
Based on historical growth trends and statistical modeling, projections for the next five years suggest continued development in key sectors around Jiangwan Stadium (
Figure 6):
Transportation Services: Projected to grow by an additional 18%, aligning with ongoing demands for mobility solutions due to increased activities and events at the stadium.
Finance and Insurance Services: Expected to increase by 12%, indicating sustained economic activities requiring financial services.
Shopping and Daily Life Services: Anticipated growth of 15% and 12%, respectively, reflecting continued consumer demand and residential needs.
Enterprises: Projected to grow by 10%, suggesting steady business development and investment in the area.
These projections highlight the need for strategic urban planning to manage and support the anticipated growth. Infrastructure enhancements, transportation planning, and zoning regulations may be necessary to accommodate increased activities while maintaining urban vitality and sustainability. The stadium’s role as a catalyst for urban development underscores its significance in shaping the future landscape of the Yangpu District.
5. Discussion
5.1. Theoretical Implications
This research contributes to the existing literature on urban morphology by quantitatively exploring the relationship between sports facilities and surrounding urban functional changes. While prior research largely emphasizes qualitative analysis of mega-events or newly built sports facilities [
1,
16,
18], this study provides evidence supporting the idea that historical sports venues may also play a meaningful role in urban regeneration, subject to various local conditions. Using detailed spatial analyses based on Points-of-Interest (POI) data, Kernel Density Estimation, and Functional Mix Analysis, the study offers a methodological framework to assess urban functional transformation over an extended period.
However, it is essential to recognize that Jiangwan Stadium’s urban regeneration impact cannot be solely attributed to the presence of the sports facility itself. Multiple historical, social, and infrastructural factors—including its strategic location within Shanghai’s evolving urban structure, historical urban planning policies, accessibility improvements like the construction of Metro Line 10, and nearby educational institutions such as Fudan University—have also likely contributed to the observed patterns of urban development [
11,
12]. Therefore, this study supports the hypothesis that sports architecture can influence urban regeneration but highlights the necessity of considering local historical and contextual factors that interplay with such developments.
5.2. Practical Implications
The findings provide several practical insights for urban planners, local governments, and policymakers regarding sports venues and urban development strategies:
Strategic Land-Use and Functional Diversity: Urban planners could use the identified optimal functional mix (Food and Beverage: ~17–19%, Shopping: ~16–18%, Daily Life Services: ~11–13%, Commercial Housing: ~9–10%) as a general reference rather than an absolute standard, recognizing local contextual adaptations.
Infrastructural Considerations: The notable growth in transportation-related functions near Jiangwan Stadium suggests that strategic planning should prioritize transport infrastructure improvements and multimodal accessibility, especially in historic areas undergoing redevelopment.
Economic Development Opportunities: The clustering of economic activities observed in the proximity of Jiangwan Stadium indicates potential opportunities for targeted commercial and business incentives to sustain local economic vitality.
Nevertheless, policymakers must remain cautious not to generalize these findings uncritically, recognizing that successful urban regeneration depends on the nuanced interplay of various contextual conditions, local histories, and socio-economic factors.
5.3. Value and Contribution of the Study
The main contribution of this research lies in its provision of empirical evidence of the nuanced and context-dependent relationship between historical sports venues and urban functional transformations. By employing comprehensive spatial analysis and POI data, the study extends existing theoretical frameworks in urban morphology and offers a replicable quantitative method for evaluating sports venues’ potential impacts on urban landscapes.
While our findings suggest a significant correlation between the stadium and POI growth—particularly in categories such as Food and Beverage, Shopping, and Transportation—we explicitly avoid attributing causality without further controls. The analysis reflects associative spatial patterns, and we acknowledge that broader district-wide dynamics, such as infrastructure development (e.g., Metro Line 10), institutional proximity (e.g., Fudan University), and commercial zoning adjustments may also have contributed substantially to observed changes. As such, we now emphasize that Jiangwan Stadium functions as one of several spatial anchors influencing urban change, rather than as a sole causal agent.
5.4. Limitations and Recommendations for Further Research
This study acknowledges several key limitations. First, while POI data offers high-resolution insight into functional distributions, it may not fully capture informal or transient land-uses. Second, our use of linear regression to project POI growth simplifies complex urban processes and does not account for possible saturation or non-linear dynamics. For instance, the Transportation Services category, which exhibited a 6000% increase, may experience plateau effects that linear models cannot capture. We recommend future research apply non-linear or logistic growth models to explore potential thresholds and saturation effects more accurately.
Third, our temporal KDE analysis was conducted at four-year intervals to align with policy planning cycles and to emphasize structural trends. However, we recognize that this may overlook short-term fluctuations tied to episodic events (e.g., tournaments or exhibitions). Although our statistical analysis leverages annual data (2004–2021), future studies could complement this with event-based or rolling KDE assessments to better capture short-term spatial responses.
Fourth, the single-case design focusing on Jiangwan Stadium may limit generalizability, especially given its historical significance and specific urban context. We therefore caution against universalizing these findings and suggest that comparative studies across multiple stadium types—modern versus historic, centrally located versus peripheral—could illuminate typological differences in morphological impact.
Fifth, future studies could further enhance spatiotemporal analysis by integrating vision-based techniques. Methods such as DeepLab, a deep convolutional neural network for semantic segmentation, can perform pixel-level land-use classification from satellite imagery [
32], while EfficientNet provides scalable and efficient models for analyzing street-level imagery and detecting informal developments with high precision [
33]. The integration of such computer vision tools would complement POI-based data and offer richer insights into morphological and land-use changes over time.
6. Conclusions
This study has explored the potential influence of historical sports facilities on urban functional diversification and economic vitality, using Shanghai’s Jiangwan Stadium as a case study. Employing POI-based Kernel Density Estimation, Functional Mix Analysis, and statistical modeling, the study provides empirical evidence suggesting that Jiangwan Stadium has played a role in catalyzing local economic and spatial transformations.
Key findings include:
A marked transition in urban function density and distribution, with a peak in functional diversity observed in 2016;
Significant economic clustering in food and beverage, retail, finance, and transportation services within a 1000 m radius of the stadium;
Identification of spatial radiation effects extending to surrounding urban neighborhoods, confirming the stadium’s multi-scalar influence.
Nevertheless, the research underscores the complexity of attributing urban regeneration outcomes exclusively to sports architecture, highlighting the impact of other contextual influences such as infrastructure improvements, urban planning policies, and proximity to institutions like Fudan University.
These findings provide actionable insights for planners and policymakers seeking to integrate historic sports venues into broader urban regeneration strategies. Future research should incorporate qualitative methods, such as community surveys or comparative case studies, to further investigate the socio-spatial impacts of stadiums across different urban contexts.
Author Contributions
Conceptualization, H.L.; methodology, H.L.; software, H.L.; validation, H.L., and Z.X.; formal analysis, H.L.; investigation, H.L.; resources, H.L.; data curation, H.L.; writing—original draft preparation, H.L.; writing—review and editing, H.L.; visualization, H.L.; supervision, Z.X.; project administration, Z.X.; funding acquisition, Z.X. All authors have read and agreed to the published version of the manuscript.
Funding
This research received no external funding.
Data Availability Statement
The raw data supporting the conclusions of this article will be made available by the authors on request.
Conflicts of Interest
The authors declare no conflicts of interest.
Appendix A. Predictive Model Development
Historical POI Data: We collected Point of Interest (POI) data for various categories around Jiangwan Stadium from 1980 to 2023.
Data Segmentation: The data was segmented into time intervals to calculate growth rates over specific periods, focusing on the 500 m, 1000 m, and 1500 m radii.
Annual Growth Rates: For each category and radius, we calculated the annual growth rates using the formula:
Mean Growth Rates: We determined the mean annual growth rate for each category over the observed period.
Trend Analysis: We performed linear regression analysis for each category to identify trends and patterns in POI growth over time.
β0: Intercept (initial POI count)
β1: Slope (rate of change per year)
Significance Testing: We tested the statistical significance of the regression models using the t-test and evaluated the goodness-of-fit with the R-squared value.
Projection Period: The model projects growth for the next five years (2024–2028).
Using Regression Models: We applied the regression equations to forecast the expected POI counts for each category in the future years.
Calculating Projected Growth Rates:
Normalization: To account for variations in scale across categories, we normalized the growth rates using z-scores:
X: Observed growth rate
μ: Mean growth rate of the category
σ: Standard deviation of the growth rates
Adjustment for External Factors: While the model primarily relies on historical data, we adjusted projections based on known urban development plans or policies that could influence future growth.
Appendix B
Figure A1.
Different buffer sensitivity test charts.
Figure A1.
Different buffer sensitivity test charts.
References
- Long, J.G. Public-Private Partnerships for Major League Sports Facilities; Routledge: Oxfordshire, UK, 2012. [Google Scholar]
- Sharifi, A. Urban form resilience: A meso-scale analysis. Cities 2019, 93, 238–252. [Google Scholar] [CrossRef]
- Cortinovis, C.; Geneletti, D. A performance-based planning approach integrating supply and demand of urban ecosystem services. Landsc. Urban Plan. 2020, 201, 103842. [Google Scholar] [CrossRef]
- Baim, D.V. The Sports Stadium as A Municipal Investment; Greenwood Publishing Group: Westport, CT, USA, 1994. [Google Scholar]
- Ahlfeldt, G.; Maennig, W. Stadium architecture and urban development from the perspective of urban economics. Int. J. Urban Reg. Res. 2010, 34, 629–646. [Google Scholar] [CrossRef]
- Koroso, N.H.; Lengoiboni, M.; Zevenbergen, J.A. Urbanization and urban land use efficiency: Evidence from regional and Addis Ababa satellite cities, Ethiopia. Habitat Int. 2021, 117, 102437. [Google Scholar] [CrossRef]
- Ren, X. Architecture and nation building in the age of globalization: Construction of the national stadium of Beijing for the 2008 Olympics. J. Urban Aff. 2008, 30, 175–190. [Google Scholar] [CrossRef]
- Xu, G.; Jiao, L.; Yuan, M.; Dong, T.; Zhang, B.; Du, C. How does urban population density decline over time? An exponential model for Chinese cities with international comparisons. Landsc. Urban Plan. 2019, 183, 59–67. [Google Scholar] [CrossRef]
- Zhang, L.; Zhang, L.; Xu, Y.; Zhou, P.; Yeh, C.H. Evaluating urban land use efficiency with interacting criteria: An empirical study of cities in Jiangsu China. Land Use Policy 2020, 90, 104292. [Google Scholar] [CrossRef]
- Lemoine-Rodríguez, R.; Inostroza, L.; Zepp, H. The global homogenization of urban form. An assessment of 194 cities across time. Landsc. Urban Plan. 2020, 204, 103949. [Google Scholar] [CrossRef]
- Liu, H. The account of Jiangwan Stadium in “Shen Bao” from 1934 to 1935. Sports Sci. Res. 2019, 40, 30–35. [Google Scholar]
- Zhang, H.; Zhou, L.G.; Chen, M.N.; Ma, W.C. Land use dynamics of the fast-growing Shanghai Metropolis, China (1979–2008) and its implications for land use and urban planning policy. Sensors 2011, 11, 1794–1809. [Google Scholar] [CrossRef] [PubMed]
- Chen, F.; Thwaites, K. Chinese Urban Design: The Typomorphological Approach, 1st ed.; Routledge: Oxfordshire, UK, 2013. [Google Scholar] [CrossRef]
- Zhu, Y.; Song, J.; Bai, Y. China’s Urban Regeneration Evolution from 1949 to 2022: From the Perspective of Governance Mode. Land 2024, 13, 1806. [Google Scholar] [CrossRef]
- Huang, B.; Zhou, Y.; Li, Z.; Song, Y.; Cai, J.; Tu, W. Evaluating and characterizing urban vibrancy using spatial big data: Shanghai as a case study. Environ. Plan. B Urban Anal. City Sci. 2020, 47, 1543–1559. [Google Scholar] [CrossRef]
- Ahlfeldt, G.M.; Kavetsos, G. Form or function? The effect of new sports stadia on property prices in London. J. R. Stat. Soc. Ser. A Stat. Soc. 2014, 177, 169–190. [Google Scholar] [CrossRef]
- Davies, L.E. A wider role for sport: Community sports hubs and urban regeneration. Sport Soc. 2016, 19, 1537–1555. [Google Scholar] [CrossRef]
- Sánchez, F.; Broudehoux, A.M. Mega-events and urban regeneration in Rio de Janeiro: Planning in a state of emergency. Int. J. Urban Sustain. Dev. 2013, 5, 132–153. [Google Scholar] [CrossRef]
- La Rosa, D.; Pappalardo, V. Policies and planning of urban green infrastructure and sustainable urban drainage systems. In Urban Services to Ecosystems: Green Infrastructure Benefits from the Landscape to the Urban Scale; Springer: Berlin/Heidelberg, Germany, 2021; pp. 297–316. [Google Scholar]
- Gao, S.; Janowicz, K.; Montello, D.R.; Hu, Y.; Yang, J.-A.; McKenzie, G.; Ju, Y.; Gong, L.; Adams, B.; Yan, B. A data-synthesis-driven method for detecting and extracting vague cognitive regions. Int. J. Geogr. Inf. Sci. 2017, 31, 1245–1271. [Google Scholar] [CrossRef]
- Zhou, N. Research on urban spatial structure based on the dual constraints of geographic environment and POI big data. J. King Saud Univ.-Sci. 2022, 34, 101887. [Google Scholar] [CrossRef]
- Song, Y.; Merlin, L.; Rodriguez, D. Comparing measures of urban land use mix. Comput. Environ. Urban Syst. 2013, 42, 1–13. [Google Scholar] [CrossRef]
- Wu, F.; Zhang, F. Rethinking China’s urban governance: The role of the state in neighbourhoods, cities and regions. Prog. Hum. Geogr. 2022, 46, 775–797. [Google Scholar] [CrossRef]
- He, S.; Yu, S.; Li, G.; Zhang, J. Exploring the influence of urban form on land-use efficiency from a spatiotemporal heterogeneity perspective: Evidence from 336 Chinese cities. Land Use Policy 2020, 95, 104576. [Google Scholar] [CrossRef]
- Testa, L.; Parra-Camacho, D.; Gómez-Tafalla, A.M.; Garcia-Pascual, F.; Duclos-Bastías, D. Local Impact of a Sports Centre: Effects on Future Intentions. Sustainability 2023, 15, 5550. [Google Scholar] [CrossRef]
- Wang, W.; Cai, Y.; Xiong, X.; Xu, G. Evaluating Accessibility and Equity of Multi-Level Urban Public Sports Facilities at the Residential Neighborhood Scale. Buildings 2025, 15, 1640. [Google Scholar] [CrossRef]
- Yuan, Z.; Liu, H.; Liu, Y.; Zhang, D.; Yi, F.; Zhu, N.; Xiong, H. Spatio-temporal dual graph attention network for query-poi matching. In Proceedings of the 43rd International ACM SIGIR Conference on Research and Development in Information Retrieval, Xi’an, China, 30 July 2020; pp. 629–638. [Google Scholar]
- Zhao, K.; Zhang, Y.; Yin, H.; Wang, J.; Zheng, K.; Zhou, X.; Xing, C. Discovering subsequence patterns for next POI recommendation. In Proceedings of the Twenty-Ninth International Conference on International Joint Conferences on Artificial Intelligence, Yokohama, Japan, 7–15 January 2021; pp. 3216–3222. [Google Scholar]
- Silverman, B.W. Density Estimation for Statistics and Data Analysis, 1st ed.; Routledge: Oxfordshire, UK, 1998. [Google Scholar] [CrossRef]
- Dovey, K.; Pafka, E. What is functional mix? An assemblage approach. Plan. Theory Pract. 2017, 18, 249–267. [Google Scholar] [CrossRef]
- Rana, R.; Singhal, R. Chi-square test and its application in hypothesis testing. J. Pract. Cardiovasc. Sci. 2015, 1, 69–71. [Google Scholar]
- Song, Z.; Zou, S.; Zhou, W.; Huang, Y.; Shao, L.; Yuan, J.; Gou, X.; Jin, W.; Wang, Z.; Chen, X.; et al. Clinically applicable histopathological diagnosis system for gastric cancer detection using deep learning. Nat. Commun. 2020, 11, 4294. [Google Scholar] [CrossRef] [PubMed]
- Kabir, H.; Wu, J.; Dahal, S.; Joo, T.; Garg, N. Automated estimation of cementitious sorptivity via computer vision. Nat. Commun. 2024, 15, 9935. [Google Scholar] [CrossRef] [PubMed]
| Disclaimer/Publisher’s Note: The statements, opinions and data contained in all publications are solely those of the individual author(s) and contributor(s) and not of MDPI and/or the editor(s). MDPI and/or the editor(s) disclaim responsibility for any injury to people or property resulting from any ideas, methods, instructions or products referred to in the content. |
© 2025 by the authors. Licensee MDPI, Basel, Switzerland. This article is an open access article distributed under the terms and conditions of the Creative Commons Attribution (CC BY) license (https://creativecommons.org/licenses/by/4.0/).


