
Seismic Fragility and Loss Assessment of a Multi-Story Steel Frame with Viscous Damper in a Corrosion Environment

Abstract
1. Introduction
2. Experimental Study on Steel Corrosion
2.1. Materials
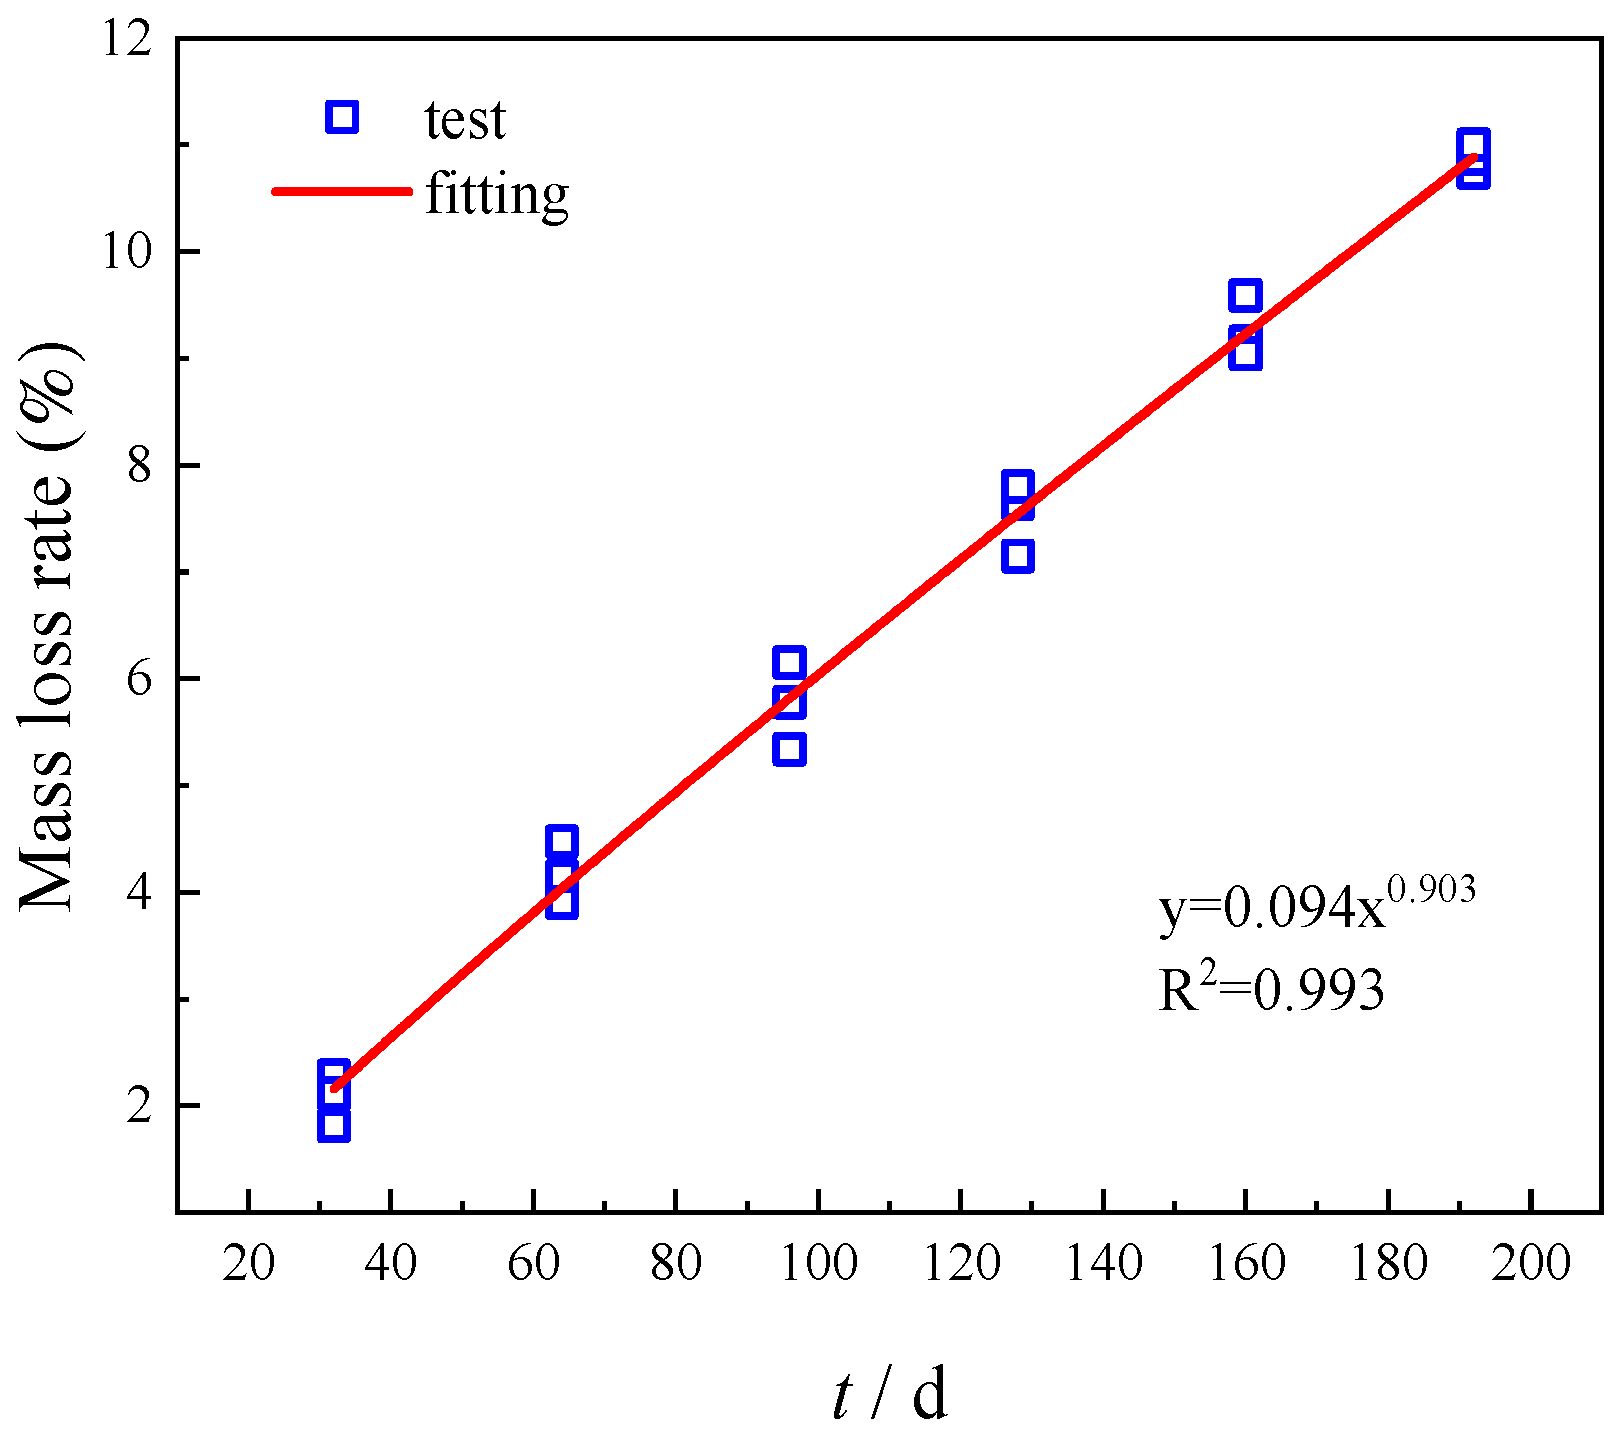
2.2. Corrosion Test
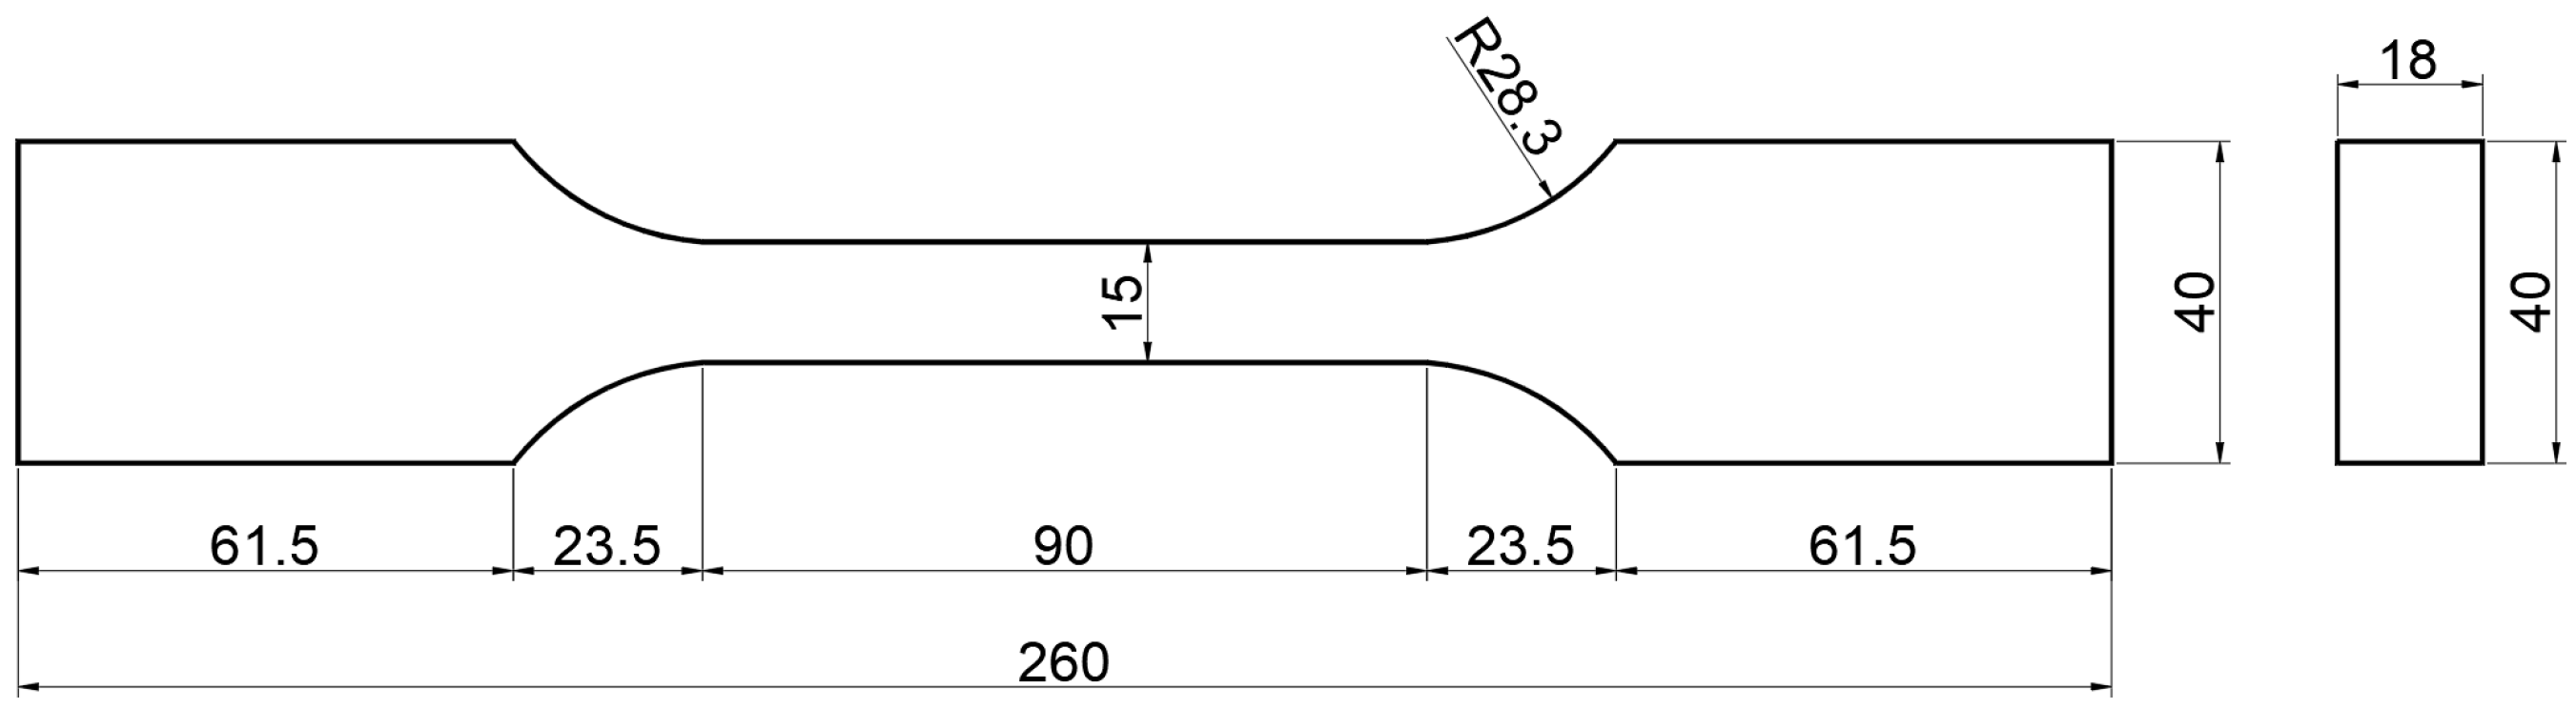
2.3. Tensile Test
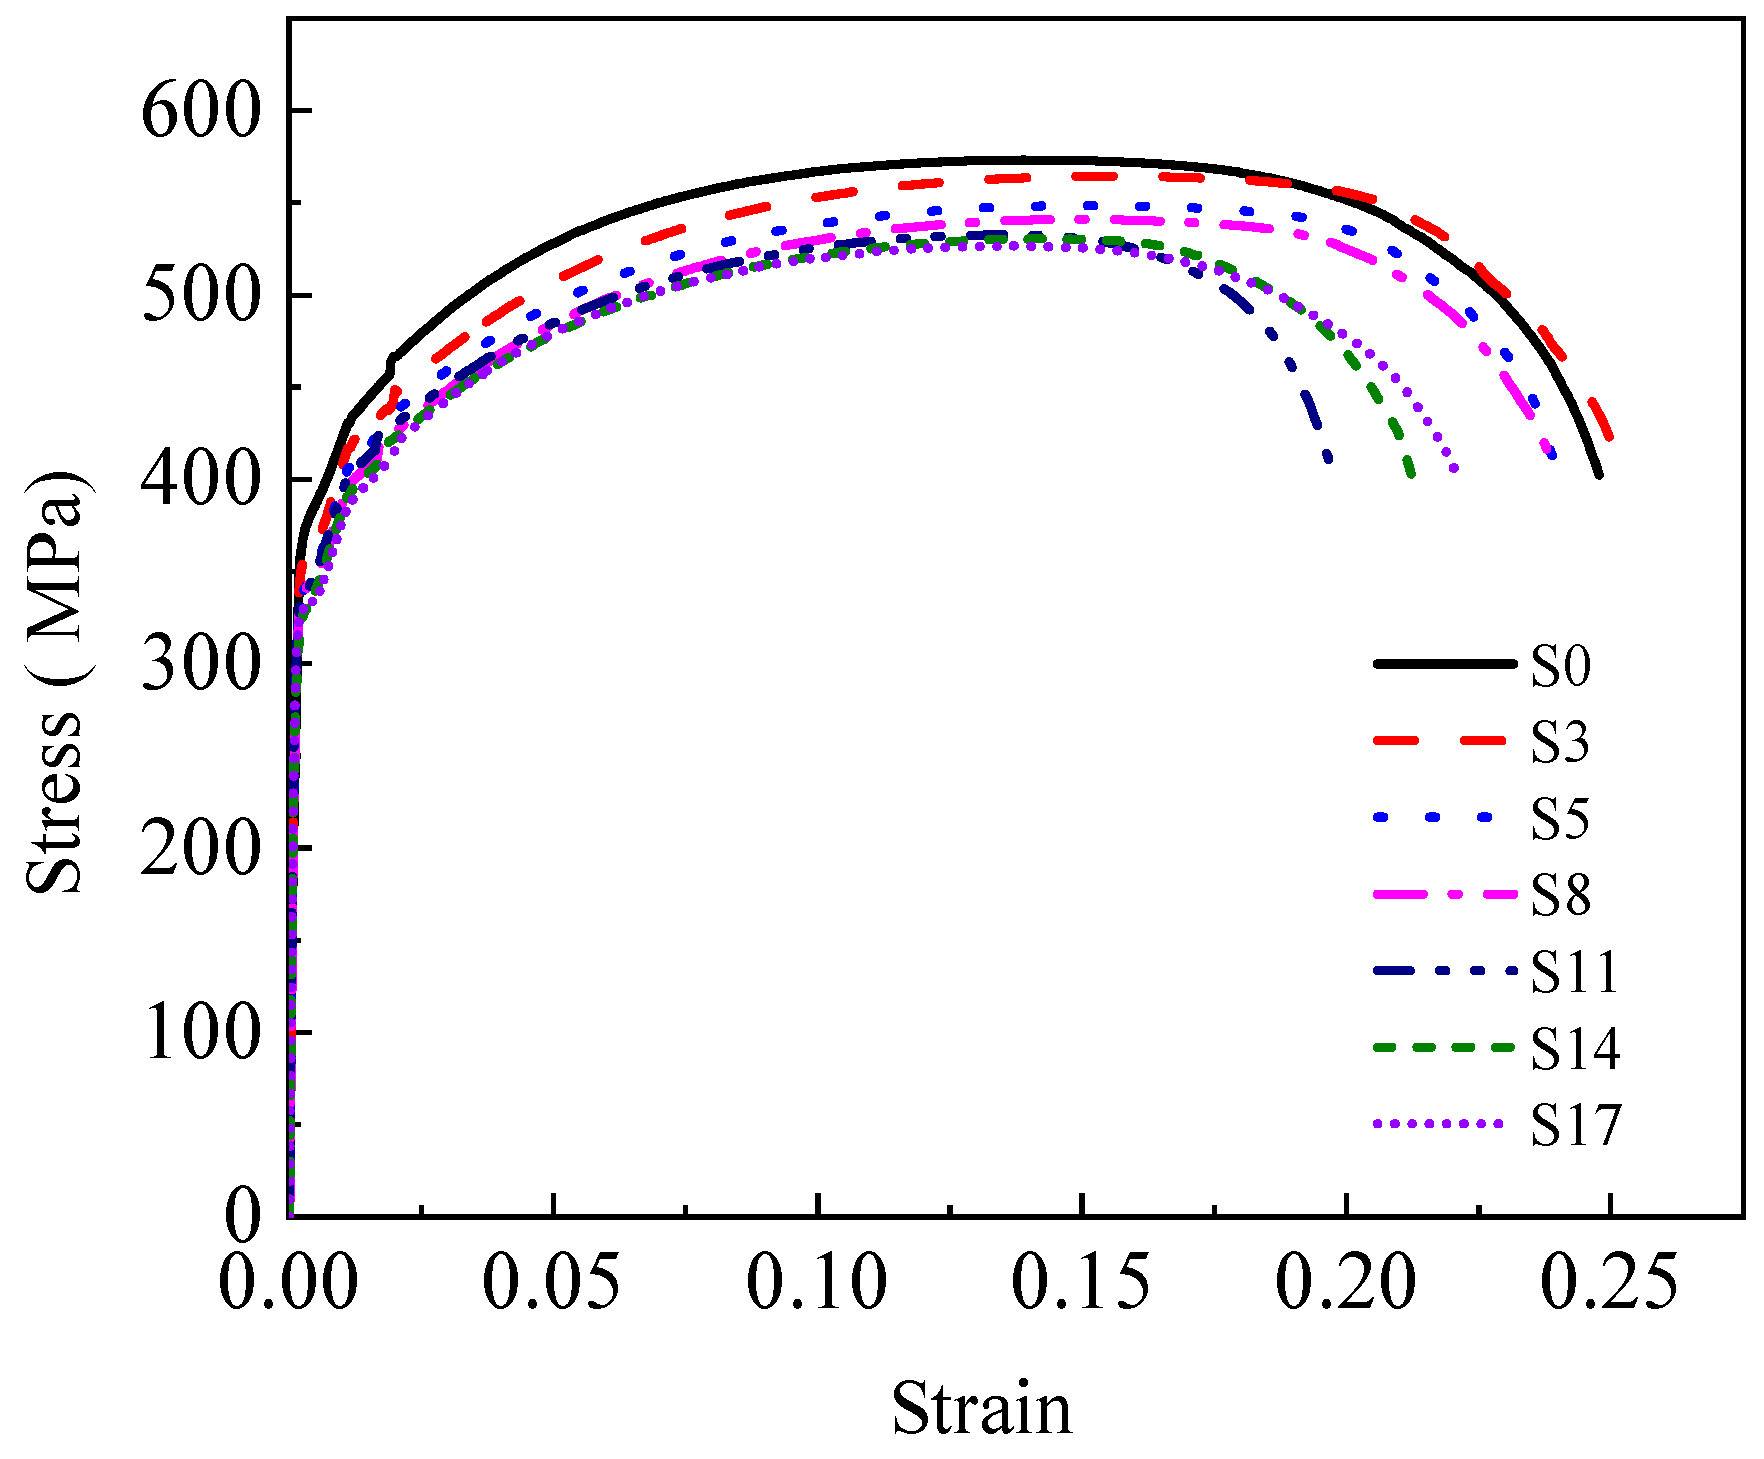
2.4. Results
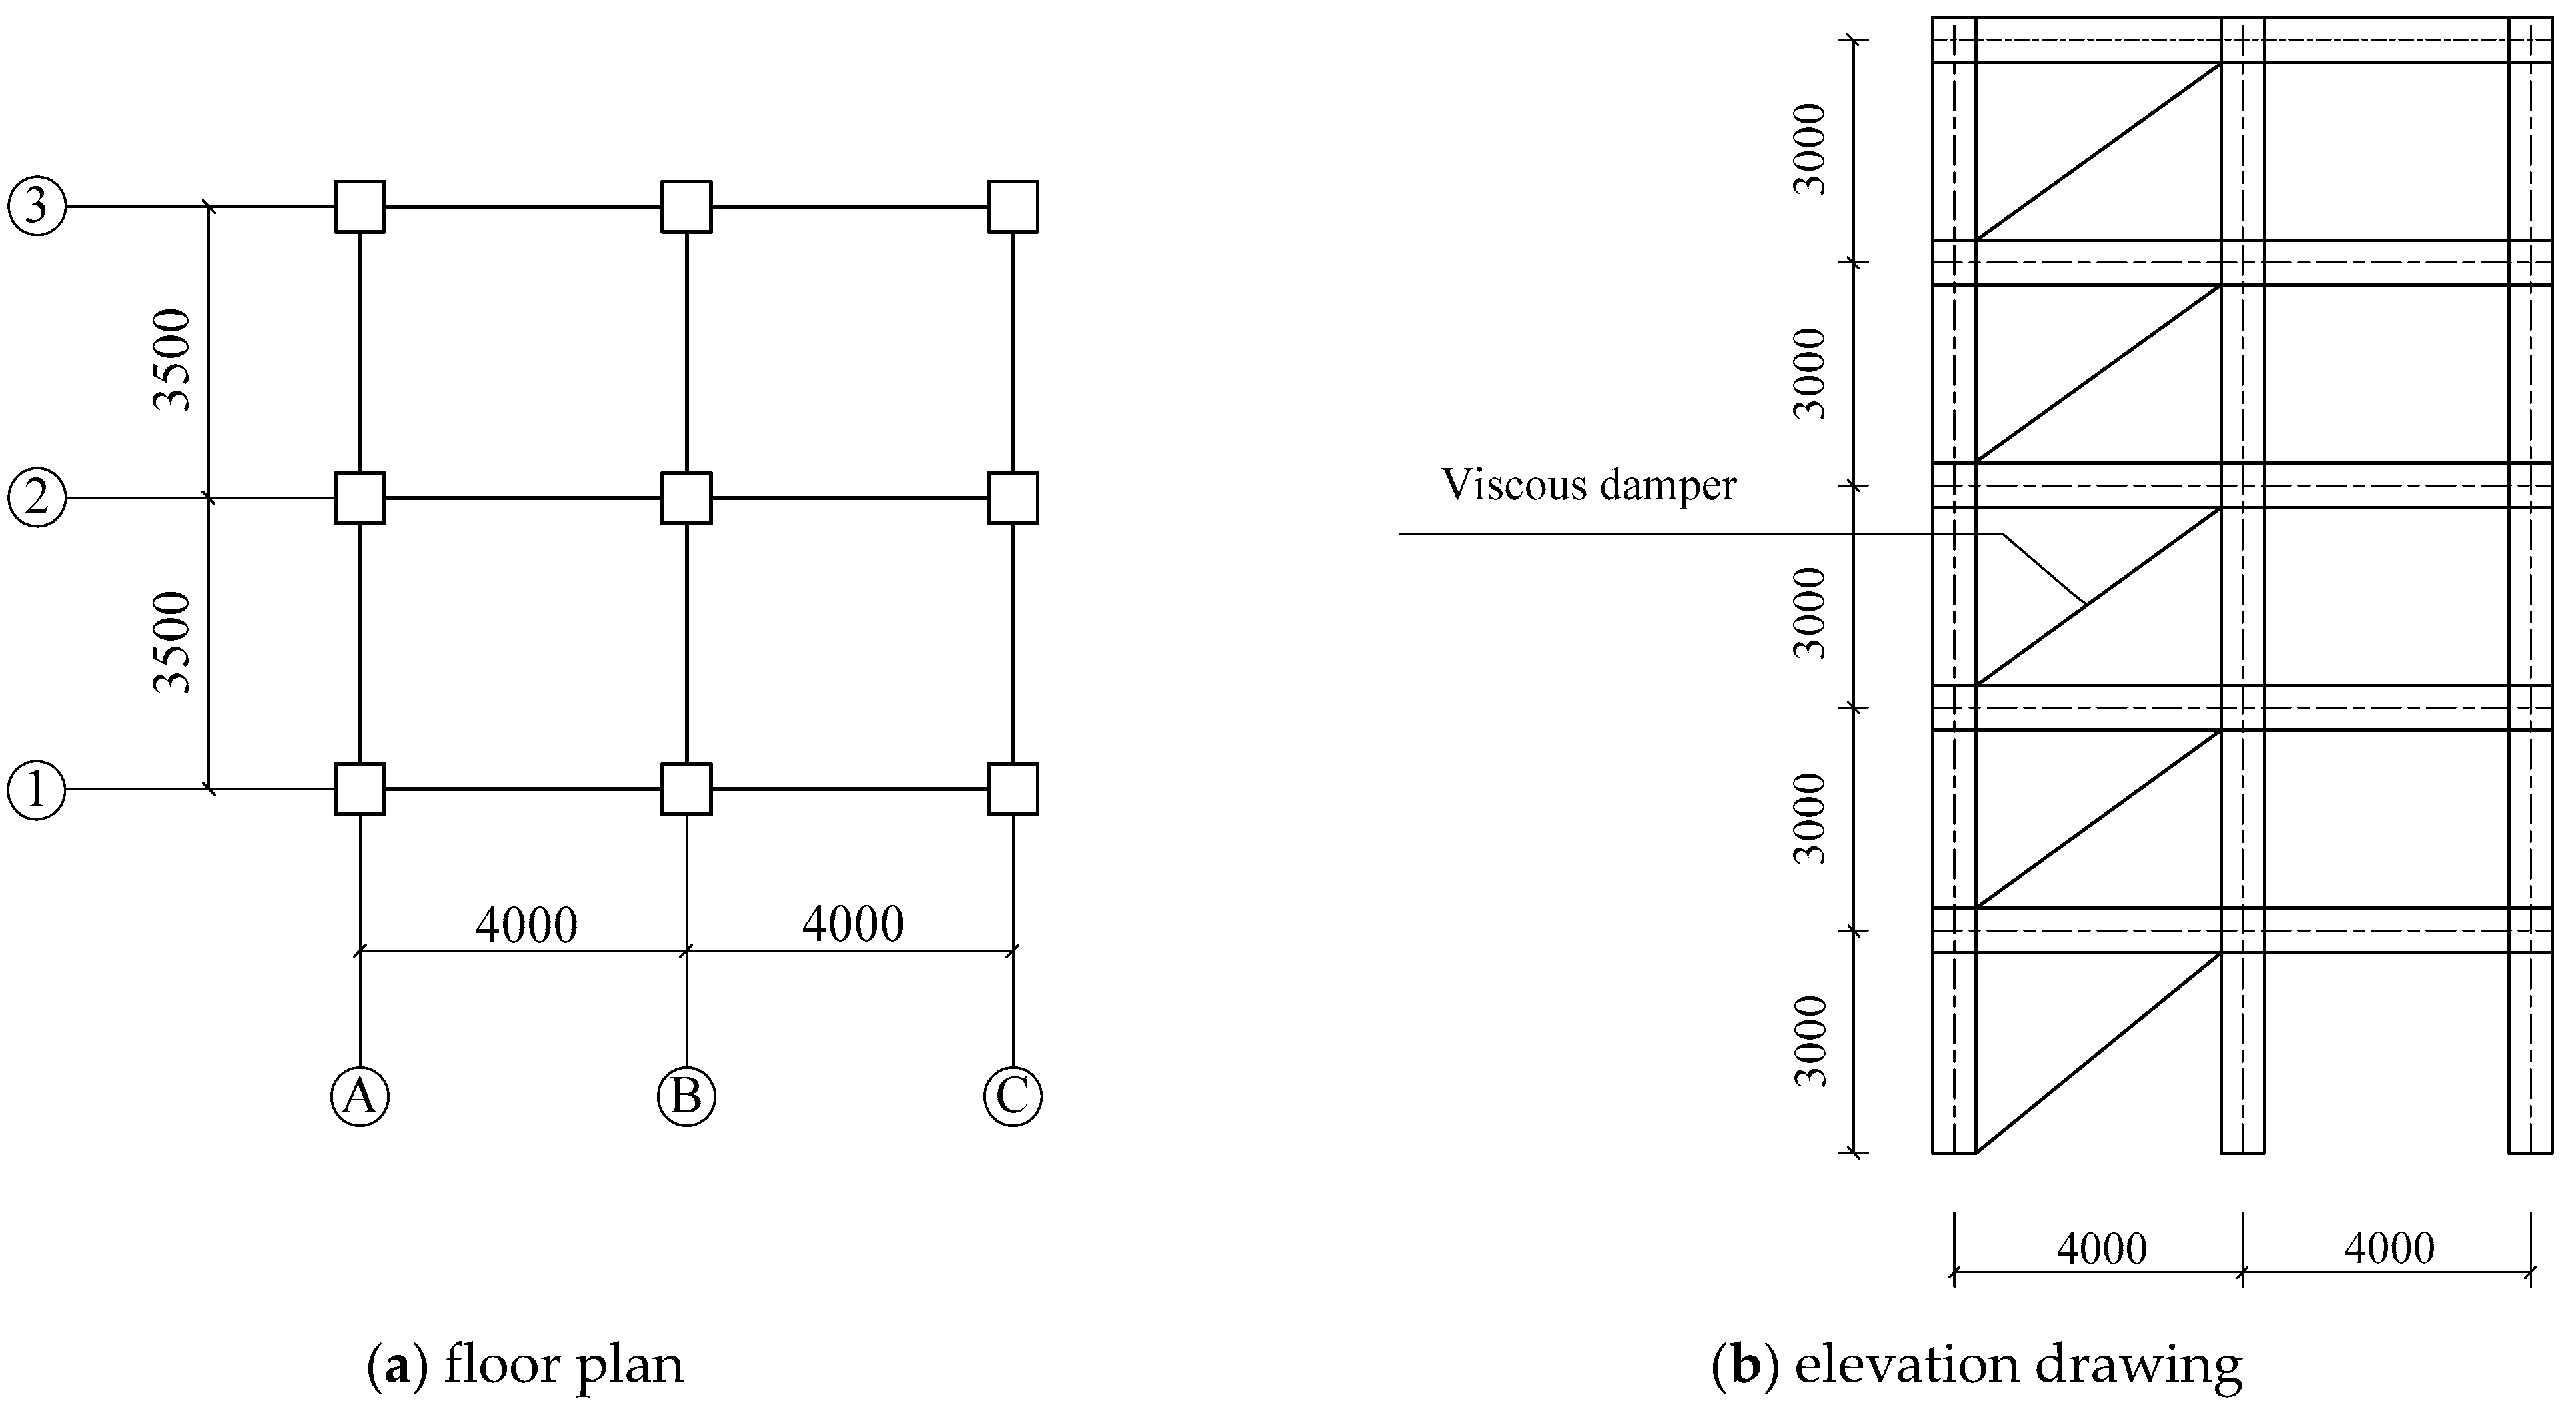
3. Fragility Analysis of the SFVD
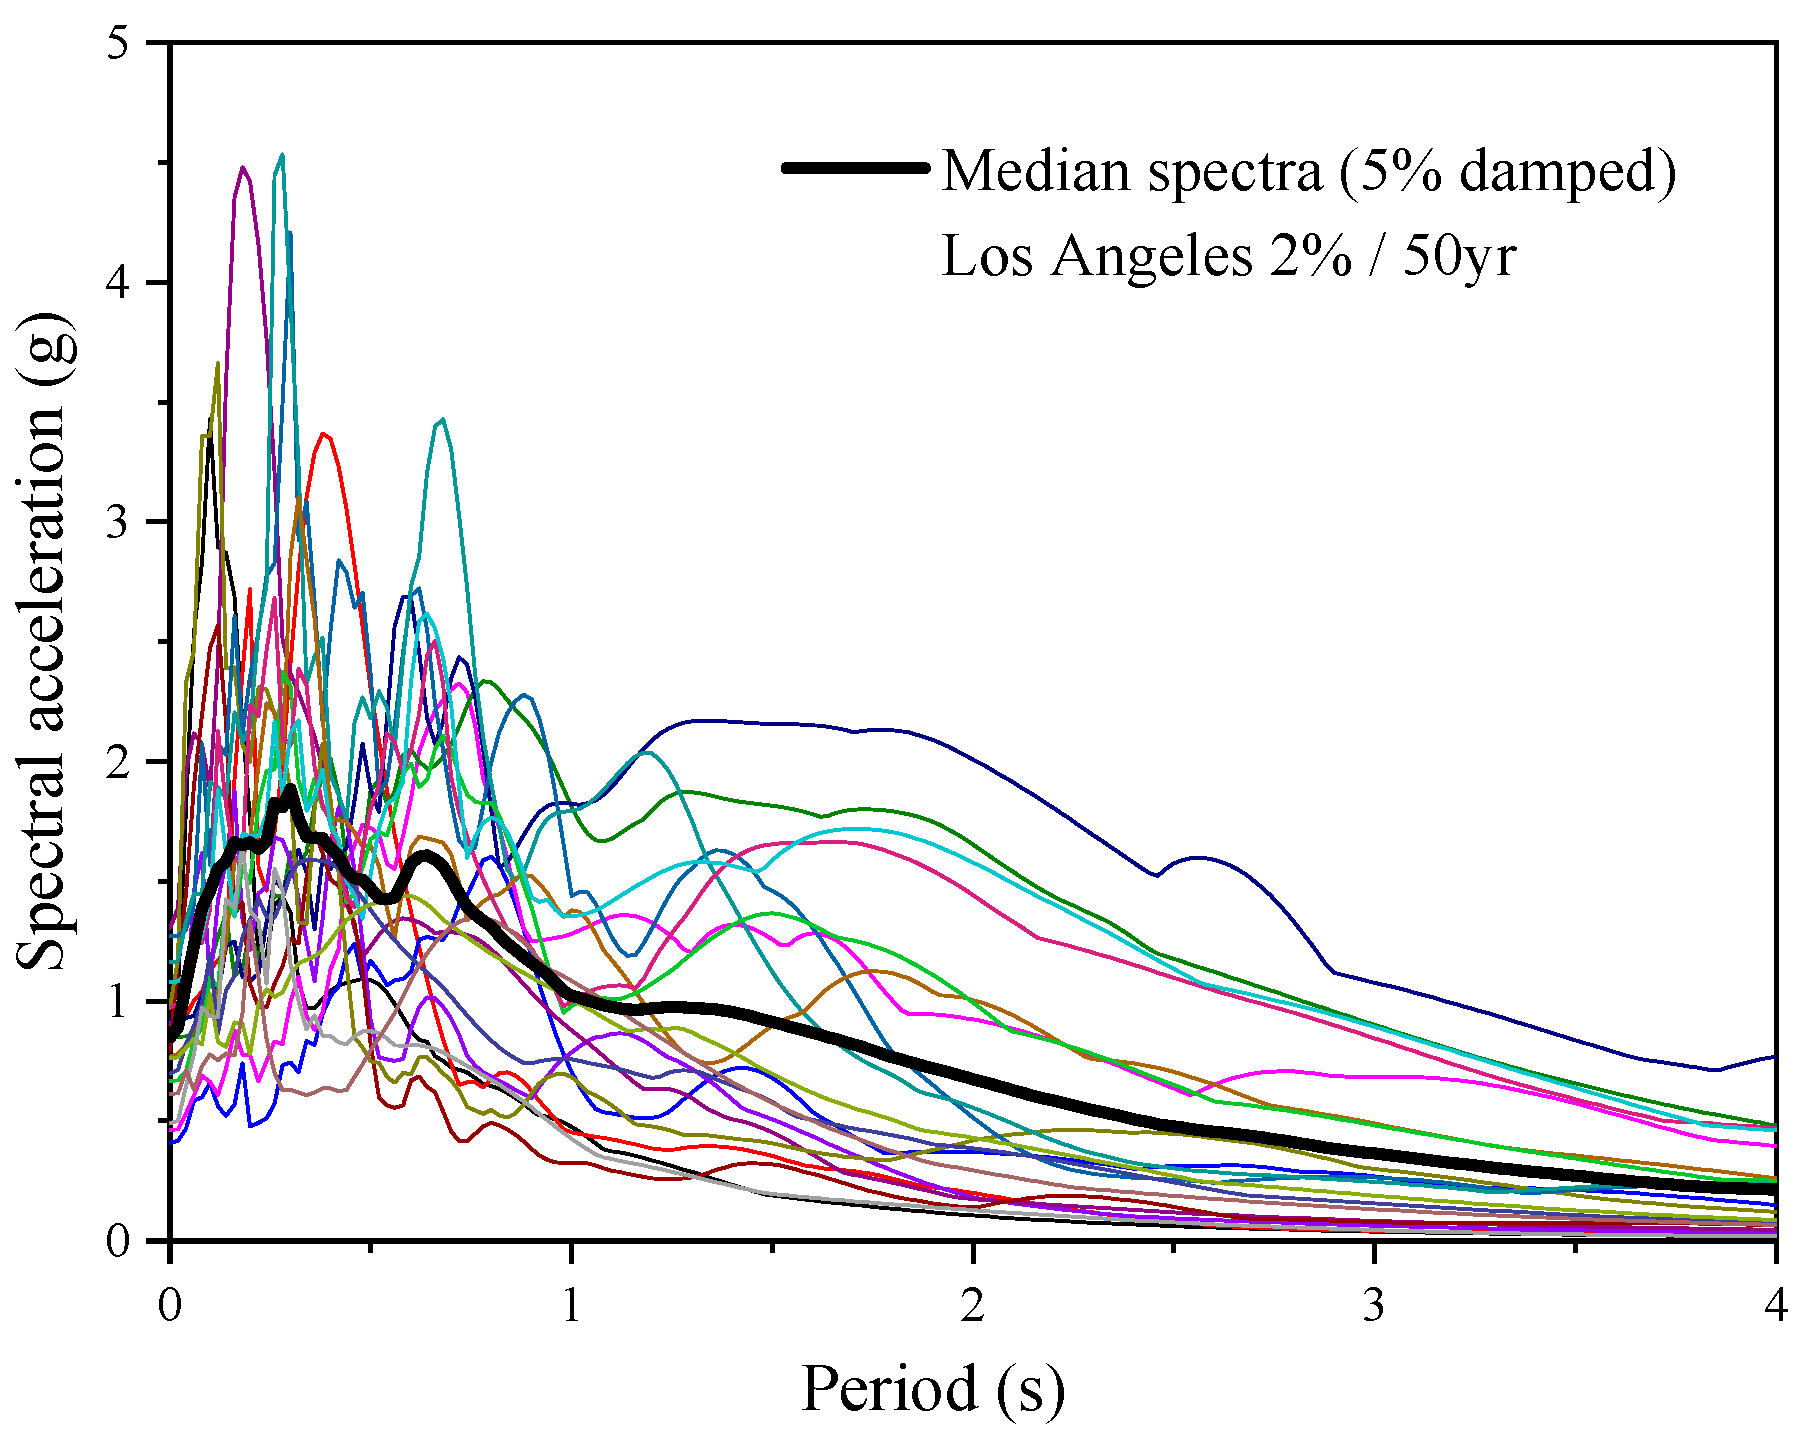
3.1. Seismic Wave Selection
3.2. Determination of the Damage Measure
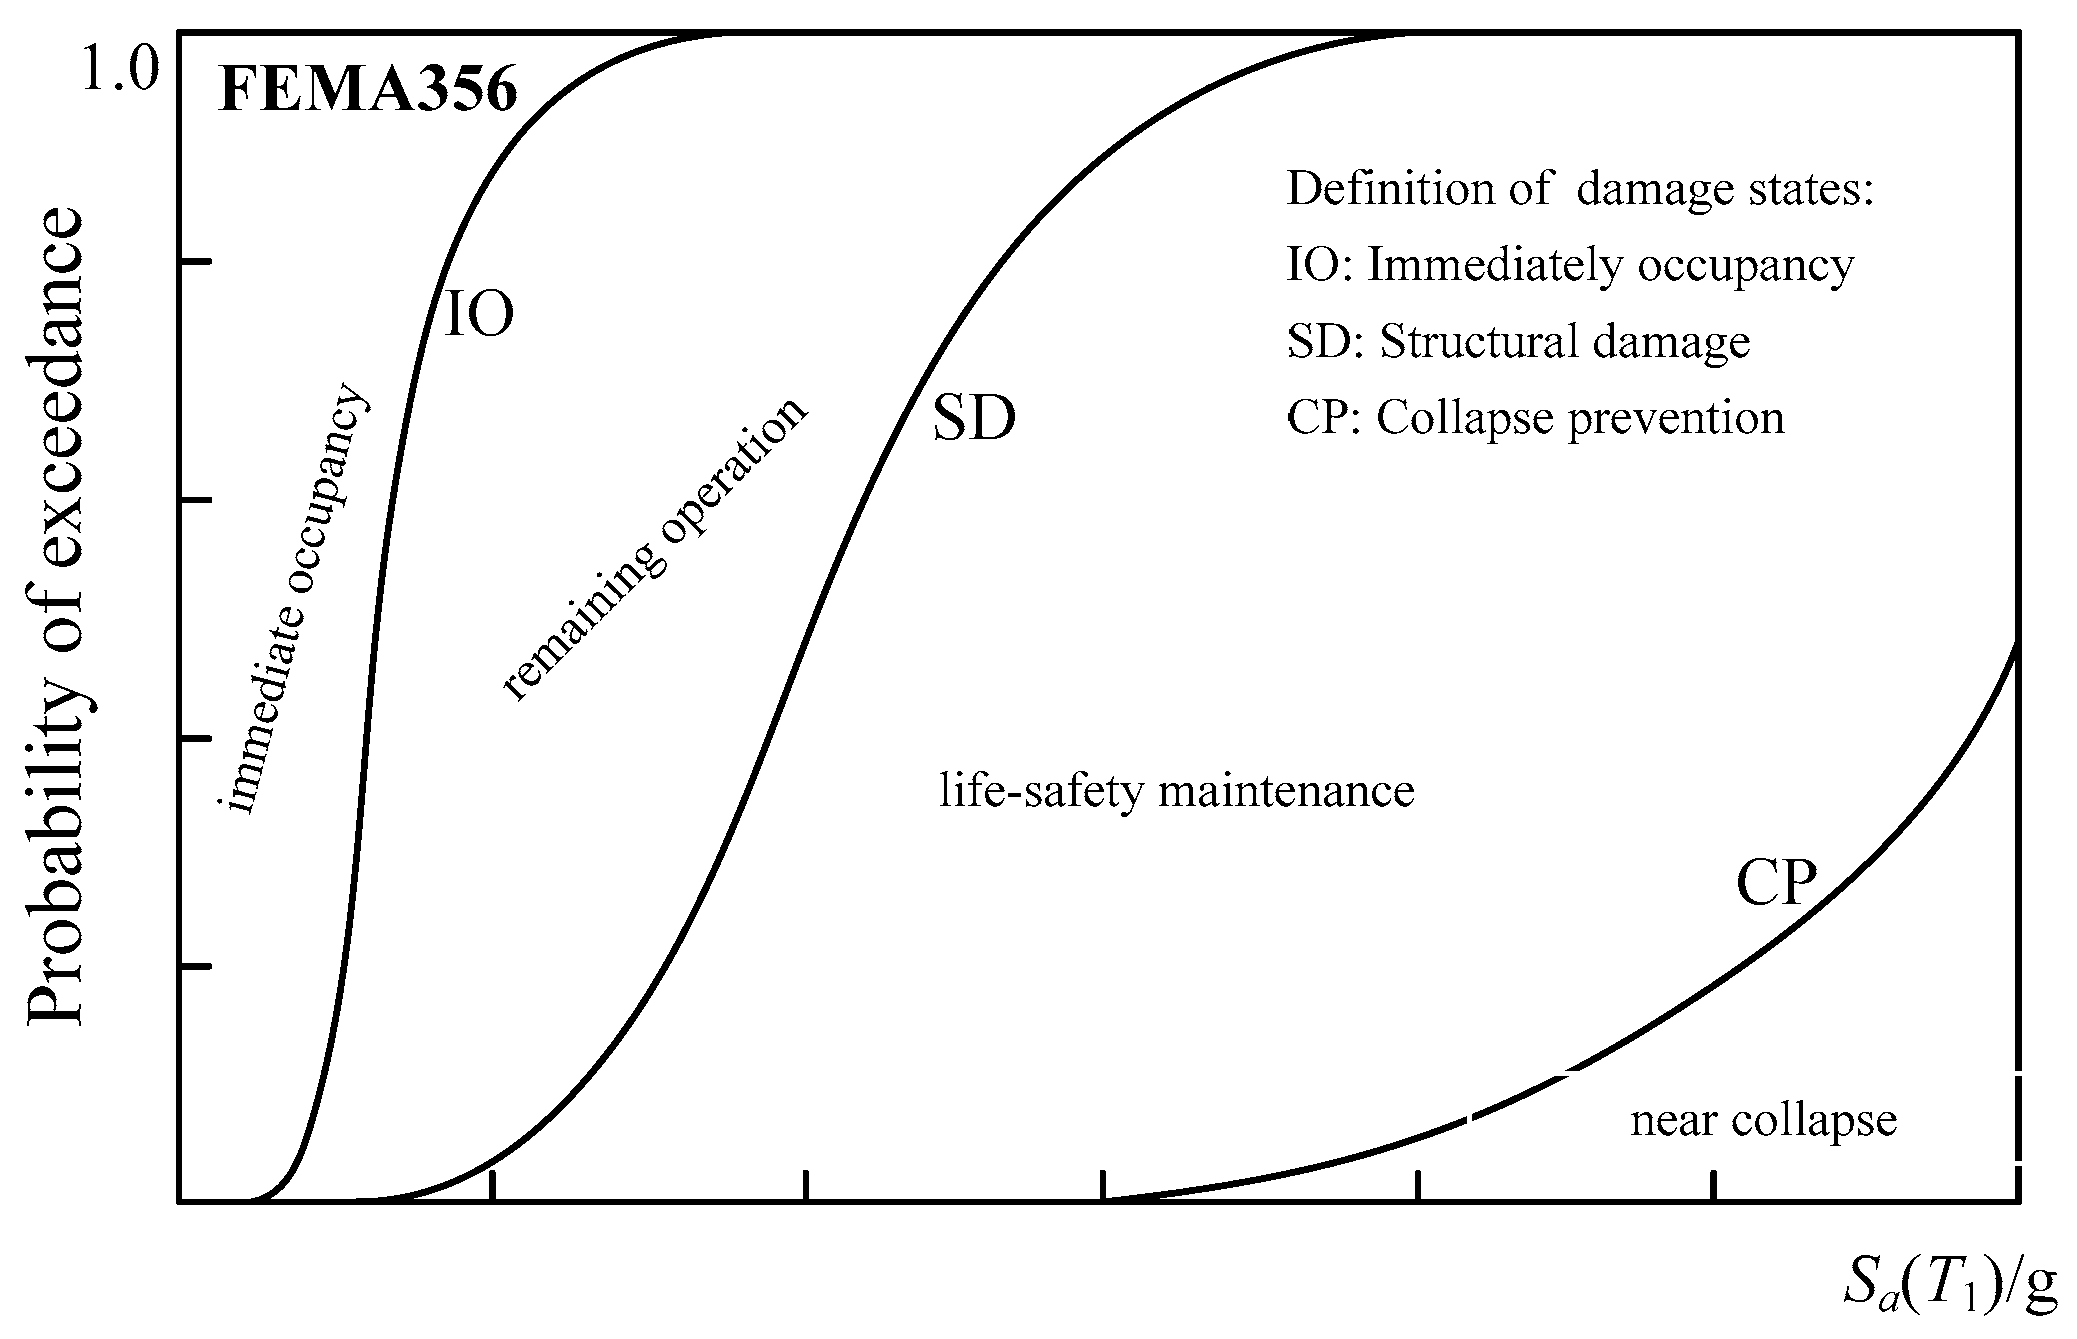
3.3. Determination of the Damage States
3.4. Fragility Curve Analysis
4. Loss Assessment of the SFVD
4.1. Economic Losses
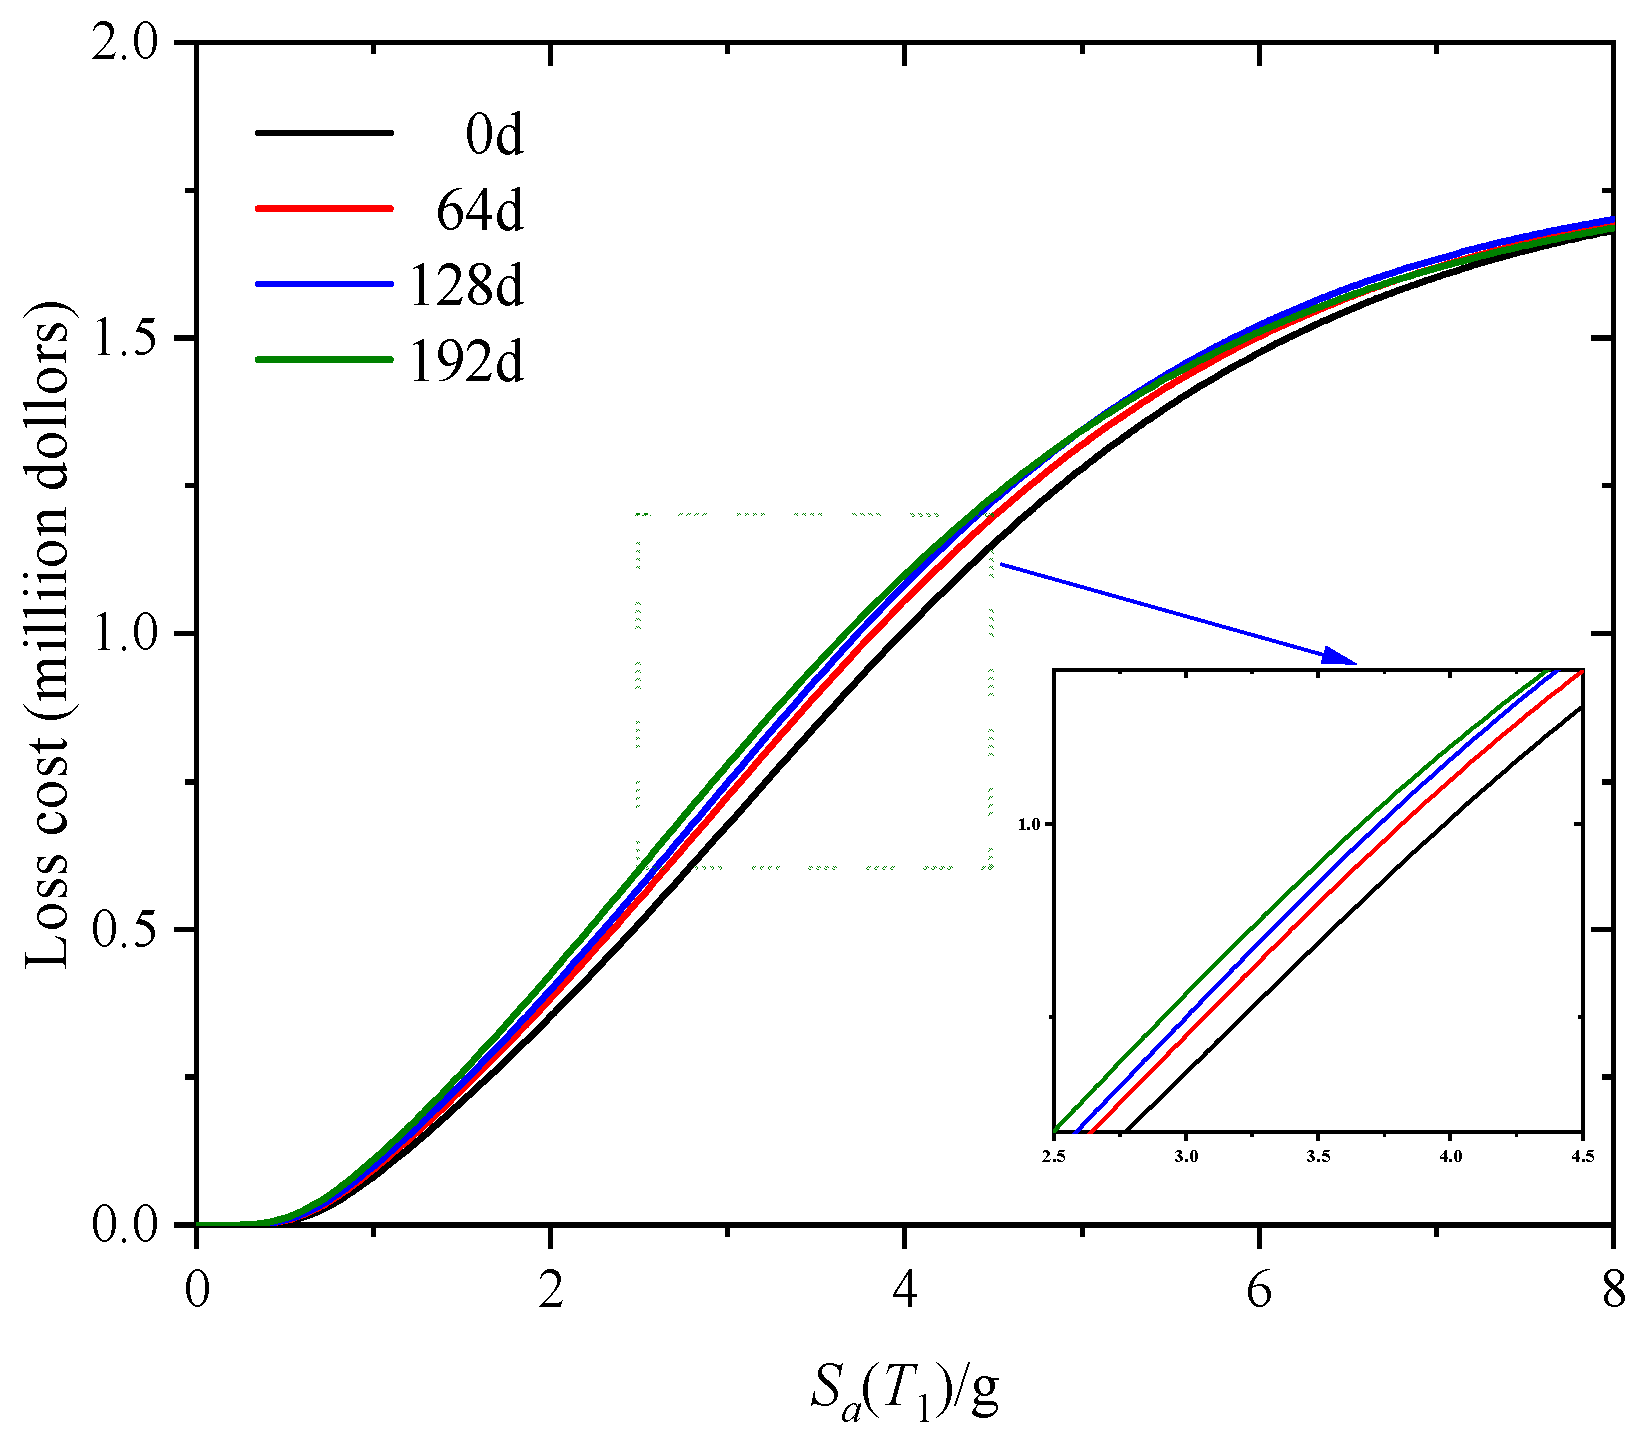
4.2. Assessment of Economic Losses
5. Conclusions
- With the increase of corrosion time, the mass loss rate and cross-section loss rate of steel gradually increase. Corrosion causes rust pits on the surface of steel, leading to a reduction in its effective cross-sectional area and thereby significantly lowering the mechanical property indices of steel, such as yield strength, ultimate tensile strength, and elongation. Although corrosion degrades the mechanical properties of steel, it does not affect its safety performance.
- The probability of exceedance of the SFVD in the limit state increases gradually with increasing corrosion time. This effect is relatively minor in the IO and SD states, while it becomes significant in the CP state.
- The economic losses of the SFVD increase with increasing corrosion time, with the maximum loss difference within the test seismic motion range being USD 103,582, which is about 9.52% of the initial cost. In addition, early-stage corrosion has a significantly pronounced impact on economic losses.
Author Contributions
Funding
Data Availability Statement
Conflicts of Interest
References
- Gatheeshgar, P.; Poologanathan, K.; Gunalan, S.; Shyha, I.; Sherlock, P.; Rajanayagam, H.; Nagaratnam, B. Development of affordable steel-framed modular buildings for emergency situations (COVID-19). Structures 2021, 31, 862–875. [Google Scholar] [CrossRef]
- Wasse, A.D.; Dai, K.; Wang, J.; Sharbati, R. State-of-the-art review: Seismic design and performance assessment of special concentrically braced frames developed for complex industrial building structures. Int. Steel. Struct. 2024, 24, 280–295. [Google Scholar] [CrossRef]
- Pourzangbar, A.; Vaezi, M.; Mousavi, S.M.; Saber, A. Effects of brace-viscous damper system on the dynamic response of steel frames. Int. J. Eng. Trans. B Appl. 2020, 33, 720–731. [Google Scholar]
- Zhou, C.; Wen, H.; Zhao, J.; Jiang, L.; Xu, X.; Zheng, H.; Tian, Y.; Liang, M.; Wang, X.; Zhang, H. Investigation of the Hysteresis Performance of Multi-Story Y-Shaped Eccentrically Bare Braced Steel Frame with Block Slit Damper (BSD). Buildings 2025, 15, 451. [Google Scholar] [CrossRef]
- Zhao, X.; Liao, X.; Hu, Z.; Li, X.; Nie, Y.; Liu, J.; Xu, Y. Seismic fragility analysis of steel pipe pile wharves with random pitting corrosion. Buildings 2023, 13, 2619. [Google Scholar] [CrossRef]
- Rajput, A.; Paik, J.K. Effects of naturally-progressed corrosion on the chemical and mechanical properties of structural steels. Structures 2021, 29, 2120–2138. [Google Scholar] [CrossRef]
- Guo, Q.; Wu, Z.; Xing, Y.; Lu, Y.; Zhang, F.; Li, W. Corrosion evolution and mechanical property deterioration of Q355NH weathering steel in long-term neutral salt spray environment. Constr. Build. Mater. 2024, 411, 134193. [Google Scholar] [CrossRef]
- Kong, Z.; Jin, Y.; Hossen, G.M.S.; Hong, S.; Wang, Y.; Vu, Q.; Truong, V.; Tao, Q.; Kim, S. Experimental and theoretical study on mechanical properties of mild steel after corrosion. Ocean. Eng. 2022, 246, 110652. [Google Scholar] [CrossRef]
- Gkatzogiannis, S.; Weinert, J.; Engelhardt, I.; Knoedel, P.; Ummenhofer, T. Correlation of laboratory and real marine corrosion for the investigation of corrosion fatigue behaviour of steel components. Int. J. Fatigue. 2019, 126, 90–102. [Google Scholar] [CrossRef]
- Wu, Q.; Chen, X.; Fan, Z.; Nie, D.; Wei, R. Corrosion fatigue behavior of FV520B steel in water and salt-spray environments. Eng. Fail. Anal. 2017, 79, 422–430. [Google Scholar] [CrossRef]
- Wang, H.; Liu, X.; Xu, S.; Hu, S. Experimental investigation on seismic performance of CHS T-joints in salt spray environment. J. Constr. Steel Res. 2024, 221, 108910. [Google Scholar] [CrossRef]
- Zhang, Y.; Fang, C.; Wang, W.; Wu, L.; Cao, P. Influence of corrosion on seismic performance of steel beam-to-column connections. Eng. Struct. 2024, 312, 118284. [Google Scholar] [CrossRef]
- Zhang, X.; Zheng, S.; Zhao, X. Experimental and numerical study on seismic performance of corroded steel frames in chloride environment. J. Constr. Steel Res. 2020, 171, 106164. [Google Scholar] [CrossRef]
- Zhang, X.; Zheng, S.; Zhao, X. Experimental and numerical investigations into seismic behavior of corroded steel frame beams and columns in offshore atmospheric environment. J. Constr. Steel Res. 2023, 201, 107757. [Google Scholar] [CrossRef]
- Lad, D.; Freddi, F.; Ghosh, J.; Rossetto, T. Impact of corrosion deterioration on the seismic performance of steel frame structures. In Proceedings of the SECED 2023 Conference, Cambridge, UK, 14 September 2023. [Google Scholar]
- Xu, S.; Zhang, Z.; Li, R.; Wei, L. A method for the seismic vulnerability assessment of corroded steel structures. J. Eng. Mech. 2018, 35, 107–115. (In Chinese) [Google Scholar]
- Lekeufack, B.C.; Fu, B.; Samuel, M.A.; Alam, S. Seismic resilience assessment of coastal carbon and weathering steel moment frame considering uniform atmospheric corrosion effects. Structures 2024, 69, 107274. [Google Scholar] [CrossRef]
- Jiang, L.; Jiang, L.; Hu, Y.; Ye, J.; Zheng, H. Seismic life-cycle cost assessment of steel frames equipped with steel panel walls. Eng. Struct. 2020, 211, 110399. [Google Scholar] [CrossRef]
- GB/T 228.1-2010; Metallic Materials Tensile Testing Part 1: Method of Test Method at Room Temperature. China Standards Press: Beijing, China, 2010. (In Chinese)
- GB/T 3075-2008; Metal Materials-Fatigue Testing Axial Force-Controlled Method. China Standards Press: Beijing, China, 2008. (In Chinese)
- Aditya, P.A.; Navvar, K.M.; Bahubali, J.K.; Pandikkadavath, M.S.; Mangalathu, S. Near-fault seismic vulnerability assessment of corrosion inflicted steel moment resisting frames. J. Constr Steel. Res. 2025, 229, 109527. [Google Scholar] [CrossRef]
- GB/T 19879-2005; Steel Plates for Building Structures. China Standards Press: Beijing, China, 2005. (In Chinese)
- Chen, X.; Lin, Z. Structural Nonlinear Analysis Program Opensees Theory and Tutorial; China Architecture & Building Press: Beijing, China, 2014. (In Chinese) [Google Scholar]
- Cornell, C.A.; Jalayer, F.; Hamburger, R.O.; Da, F. The probabilistic basis for the 2000 SAC/FEMA steel moment frame guidelines. Submitted to. J. Struct. Eng. 2002, 128, 526–533. [Google Scholar] [CrossRef]
- Cheng, X.; Jiang, L.; Yang, J.; Zhang, X.; Hu, Y. Seismic performance and risk mitigation of CFS shear walls with CFRP-reinforced screw connections and special-shape L-section end studs. J. Build. Eng. 2024, 88, 108824. [Google Scholar] [CrossRef]
- Ye, J.; Jiang, L. Seismic risk assessment of mid-rise cold-formed steel structures in China considering various uncertainties. China Civ. Eng. J. 2021, 54, 74–83. (In Chinese) [Google Scholar]
- Jiang, L.; Ye, J. Quantifying the effects of various uncertainties on seismic risk assessment of CFS structures. Bull. Earthq. Eng. 2020, 18, 241–272. [Google Scholar] [CrossRef]
- GB 50011-2010; Code for Seismic Design of Buildings. Architecture and Building Press: Beijing, China, 2016. (In Chinese)
- FEMA356. NEHRP Guidelines for the Seismic Rehabilitation of Buildings; Federal Emergency Management Agency: Washington, DC, USA, 2002. [Google Scholar]
- Jiang, L.; Ye, J. Risk-based overall seismic robustness assessment of cold-formed steel structures considering vulnerability and fragility. Bull. Earthq. Eng. 2022, 20, 7161–7184. [Google Scholar] [CrossRef]
- Liu, Y.; Hu, Y.; Zhao, J.; Jiang, L.; Sun, H.; Wang, D. Seismic risk mitigation of concrete-filled double-skin steel tube frames with beam-only-connected shear walls. Structures 2025, 71, 107949. [Google Scholar] [CrossRef]
- Silva, A.; Macedo, L.; Monteiro, R.; Castro, J.M. Earthquake-induced loss assessment of steel buildings designed to Eurocode 8. Eng. Struct. 2020, 208, 110244. [Google Scholar] [CrossRef]
- Nettis, A.; Di Mucci, V.M.; Ruggieri, S.; Uva, G. Seismic fragility and risk assessment of isolated bridges subjected to pre-existing ground displacements. Soil. Dyn. Earthq. Eng. 2025, 194, 109335. [Google Scholar] [CrossRef]
- ATC-13. Earthquake Damage Evaluation Data for California; Applied Technology Council: Redwood City, CA, USA, 1985. [Google Scholar]
- Zhu, J.; Zhao, J.; Tan, P.; Zhou, F. Seismic life-cycle loss estimation of single-story factory buildings. Earthq. Eng. Eng. Dyn. 2018, 38, 51–64. (In Chinese) [Google Scholar]
- Turner & Townsend and Federal Emergency Management Agency (FEMA). International Construction Cost Survey 2018–2019; Turner & Townsend: Mumbai, India, 2018. [Google Scholar]
- FEMA 227. A Benefit-Cost Model for the Seismic Rehabilitation of Building; Federal Emergency Management Agency: Washington, DC, USA, 1992; Volume 1. [Google Scholar]


| t/d | No. | ||||||
|---|---|---|---|---|---|---|---|
| 0 | S0 | 198.38 | 375.86 | 573.22 | 155.88 | 0.656 | 24.77% |
| 64 | S4 | 188.63 | 347.26 | 551.43 | 146.06 | 0.630 | 23.20% |
| S5 | 187.66 | 342.39 | 548.45 | 144.76 | 0.624 | 24.01% | |
| S6 | 184.43 | 338.61 | 543.93 | 144.10 | 0.623 | 23.97% | |
| 128 | S10 | 183.33 | 339.59 | 538.61 | 139.44 | 0.630 | 19.82% |
| S11 | 183.87 | 339.62 | 532.68 | 137.06 | 0.638 | 19.74% | |
| S12 | 184.61 | 345.95 | 521.68 | 134.74 | 0.663 | 18.54% | |
| 192 | S16 | —— | —— | —— | —— | —— | —— |
| S17 | 177.56 | 329.32 | 526.54 | 132.50 | 0.625 | 22.10% | |
| S18 | 179.45 | 332.30 | 532.11 | 134.14 | 0.625 | 20.16% |
| Corrosion Time (d) | IO | SD | CP | |
|---|---|---|---|---|
| θmax = 1% | θmax = 2% | θmax = 4% | ||
| 0 | m | 1.1434035 | 2.286815 | 4.573625 |
| β | 0.4282113 | 0.428214 | 0.428215 | |
| 64 | m | 1.0984700 | 2.1969300 | 4.3938750 |
| β | 0.4423005 | 0.4422966 | 0.4427271 | |
| 128 | m | 1.0741750 | 2.1483550 | 4.2967100 |
| β | 0.4431142 | 0.4431152 | 0.4431155 | |
| 192 | m | 1.0574000 | 2.1148017 | 4.2296018 |
| β | 0.4746999 | 0.4797504 | 0.4797512 |
| Categories | Cost Value | Calculation Formula [35] |
|---|---|---|
| Demolition | USD 404.9/m2 | USD 404.9/m2 × Total area × Damage factor |
| Contents costs | USD 875.4/m2 | USD 875.4/m2 × Total area × Damage factor |
| Relocation | USD 49.0/month/m2 | USD 49.0/month/m2 × Total area × Loss of function |
| Rental loss | USD 17.94/month/m2 | USD 17.94/month/m2 × Total area × Loss of function |
| Income loss | USD 252.6/month/m2 | USD 252.6/month/m2 × Total area × Loss of function |
| Minor injury | USD 2600/person | USD 2600/person × Occupancy × Minor injury |
| Serious injury | USD 26,000/person | USD 26,000/person × Occupancy × Serious injury |
| Human death | USD 4,758,000/life | USD 4,758,000/life × Occupancy × Fatality |
| Performance Level | Story Drift Ratio (%) | Damage Factor | Loss of Function (d) | Minor Injury (%) | Serious Injury (%) | Fatality (%) |
|---|---|---|---|---|---|---|
| I | θ < 0.2 | 0.0 | 0 | 0 | 0 | 0 |
| II | 0.2 < θ < 0.4 | 0.005 | 3.4 | 0.003 | 0.0004 | 0.0001 |
| III | 0.4 < θ < 0.7 | 0.05 | 12.08 | 0.03 | 0.004 | 0.001 |
| IV | 0.7 < θ < 1.5 | 0.2 | 44.72 | 0.3 | 0.04 | 0.01 |
| V | 1.5 < θ < 2.5 | 0.45 | 125.66 | 3 | 0.4 | 0.1 |
| VI | 2.5 < θ < 5.0 | 0.8 | 234.76 | 30 | 4 | 1 |
| VII | 5.0 < θ | 1.0 | 346.93 | 40 | 40 | 2 |
Disclaimer/Publisher’s Note: The statements, opinions and data contained in all publications are solely those of the individual author(s) and contributor(s) and not of MDPI and/or the editor(s). MDPI and/or the editor(s) disclaim responsibility for any injury to people or property resulting from any ideas, methods, instructions or products referred to in the content. |
© 2025 by the authors. Licensee MDPI, Basel, Switzerland. This article is an open access article distributed under the terms and conditions of the Creative Commons Attribution (CC BY) license (https://creativecommons.org/licenses/by/4.0/).
Share and Cite
Qiu, W.; Wen, H.; Gong, C.; Zhang, Z.; Li, W.; Li, S. Seismic Fragility and Loss Assessment of a Multi-Story Steel Frame with Viscous Damper in a Corrosion Environment. Buildings 2025, 15, 2515. https://doi.org/10.3390/buildings15142515
Qiu W, Wen H, Gong C, Zhang Z, Li W, Li S. Seismic Fragility and Loss Assessment of a Multi-Story Steel Frame with Viscous Damper in a Corrosion Environment. Buildings. 2025; 15(14):2515. https://doi.org/10.3390/buildings15142515
Chicago/Turabian StyleQiu, Wenwen, Haibo Wen, Chenhui Gong, Zhenkai Zhang, Wenjing Li, and Shuo Li. 2025. "Seismic Fragility and Loss Assessment of a Multi-Story Steel Frame with Viscous Damper in a Corrosion Environment" Buildings 15, no. 14: 2515. https://doi.org/10.3390/buildings15142515
APA StyleQiu, W., Wen, H., Gong, C., Zhang, Z., Li, W., & Li, S. (2025). Seismic Fragility and Loss Assessment of a Multi-Story Steel Frame with Viscous Damper in a Corrosion Environment. Buildings, 15(14), 2515. https://doi.org/10.3390/buildings15142515