1. Introduction
In the context of the burgeoning accumulation of urban construction waste and the imperatives of the “dual-carbon” goal, the resource utilization of construction waste has become an urgent necessity [
1]. Employing crushed waste concrete to substitute a portion of natural stone for the production of recycled concrete (RAC) holds the potential to promote sustainable development in the construction sector and improve the efficiency of waste utilization [
2]. It is worth noting that, compared with natural aggregate concrete (NAC), recycled aggregate concrete (RAC) has a lower density and a higher water absorption rate, and these characteristics lead to its poorer resistance to carbonation [
3,
4]. Although treating recycled aggregates can effectively enhance the carbonation resistance of RAC, the associated high costs and substantial workload pose formidable challenges, rendering its implementation in practical engineering arduous. Moreover, in the northern Shaanxi region, the minimum winter temperature can plunge to −20 °C, accompanied by a relatively pronounced diurnal temperature variation. Consequently, recycled aggregate concrete (RAC) is required to possess commendable frost-resistance capabilities.
In recent years, many experts around the world have studied the application of manufactured sand and fibers in concrete. Son et al. demonstrated that waste glass sand can improve the durability of concrete, including carbonation resistance, chloride ion resistance, and freeze–thaw cycle resistance [
5,
6,
7]. Bankir verified that glass fiber and steel fiber have a certain effect on the bond strength and carbonation resistance of concrete [
8]. Selva et al. examined the influence of manufactured sand, such as sand dune sand, on concrete durability. Their research demonstrated that combining manufactured sand with fibers and other materials can improve concrete’s durability [
9]. Shaanxi Province, China, possesses rich metal mineral resources, generating substantial metal tailings that offer a variety of alternatives for manufactured sand. As a new environmentally friendly material, basalt fiber has great potential for global sustainable development. Therefore, we chose to use iron tailings to make manufactured sand, which was added to the concrete together with basalt fibers to explore the impact on the durability of concrete.
Iron ore tailings (IOTs), a by-product of the iron ore beneficiation process, typically contain substantial quantities of oxides such as silicon, aluminum, calcium, and magnesium. Our findings indicate that the incorporation of IOTs into concrete can stimulate the secondary hydration reaction, expedite the consumption of cement clinker, and enhance the workability of concrete [
6,
10,
11]. Simultaneously, the quantity of IOTs exerts a profound influence on the strength, durability, and other properties of concrete [
12]. A judicious proportion of IOTs can augment the compressive strength and impermeability of concrete; however, excessive addition may lead to the degradation of concrete performance [
13,
14]. As the IOT substitution rate increases, the compressive and splitting tensile strengths of concrete initially increase and then decline, while the carbonation depth and porosity first decrease and subsequently increase [
15,
16]. Specifically, the compressive strength of IOT-incorporated concrete with a 30% substitution rate exceeded the target average strength, and the concrete with a 10% IOT content achieved the optimal compressive strength. Currently, the majority of studies limit the IOT substitution rate to within 30%. To enhance the efficiency of IOT utilization, therefore, it can be combined with other reinforcing materials. Xu et al. [
17] revealed that IOTs had a favorable strengthening effect on concrete strength, and the frost resistance was optimal at a 20% IOT substitution rate. Nevertheless, under sulfate freeze–thaw cycles, the surface scaling of recycled aggregate concrete (RAC) was more severe. Chen et al. [
18] verified that when the IOT substitution rate was 40%, the gradation of fine aggregate could be optimized.
Fibers are capable of significantly improving the internal structure of concrete and enhancing its carbonation resistance [
19,
20]. Basalt fiber (BF), an innovative green material that complies with environmental requirements, has found its application in concrete due to its high modulus, excellent resistance to heat and chemicals, and outstanding interfacial shear strength [
21]. Notably, BF exhibits a density and linear expansion coefficient relatively close to those of concrete, enabling it to be compatible with matrices [
22]. Jiang et al. [
23] demonstrated that, in comparison to concrete without BF, the compressive, splitting tensile, and flexural strengths of concrete mixed with 12 mm BF were enhanced. After subjecting the specimens to 150 cycles of sulfate erosion followed by wetting–drying, the mass loss and the decrease in the dynamic elastic modulus of basalt fiber-reinforced concrete (BFRC) with different BF contents were found to decline as the fiber content increased [
24]. When the volume fraction of BF reaches 0.3%, the concrete can withstand higher peak loads and exhibits better toughness. Furthermore, when the volume content of basalt fiber is less than 0.3%, the freeze–thaw damage endured by concrete diminishes as the basalt fiber content rises [
25]. Zhao et al. [
26] revealed that the incorporation of fibers could mitigate the damage inflicted by freeze–thaw cycles on the specimens, and the bending performance of concrete after undergoing freezing and thawing was optimized when the basalt fiber volume content was set at 2.0 kg·m
−3.
Based on the aforementioned studies, current applications of fibers and tailings in concrete have predominantly focused on enhancing mechanical properties and durability. However, the effects of varying types of manufactured sand and fiber categories on concrete performance differ significantly, reflecting the material-specific and compositional dependencies in these composite systems. This study investigates the synergistic effects of basalt fiber (BF) and iron ore tailings (IOTs) as replacements for natural sand in recycled aggregate concrete (RAC), with a focus on their impacts on durability performance. While previous studies have explored individual applications of IOTs or BF in concrete systems, relatively limited research has been conducted on the combined utilization of IOTs and BF to enhance carbonation resistance and frost durability in RAC. The dual incorporation of IOTs and BF serves two critical purposes: (1) it promotes the reuse of solid wastes including recycled aggregates and iron tailings, aligning with sustainable construction practices; (2) it systematically evaluates the resultant effects on concrete durability, thereby addressing existing knowledge gaps in multi-component waste-modified concrete systems. Consequently, this study adopted IOTs as partial replacement for natural sand and incorporated basalt fiber (BF) at varying volume fractions (0, 0.1%, 0.2%, 0.3%). Accelerated carbonation tests and rapid freeze–thaw cycle tests were then conducted to evaluate the synergistic effect of BF and IOTs on the carbonation and frost resistance of RAC.
2. Materials and Methods
2.1. Cement and Aggregate
In this experimental work, ordinary Portland cement of type PO42.5 was utilized, which is shown in
Table 1. Both the recycled aggregate (RA) and natural aggregate (NA), sourced from Yan’an, Shaanxi Province, China, were 10~20 mm graded crushed stone. The RA originated from crushed cubic C30 concrete test specimens, with detailed properties provided in
Table 2.
2.2. Iron Ore Tailings
The natural sand component within the sand–gravel mixture was sourced from a sand–gravel quarry in Yan’an, Shaanxi Province, China. It exhibited an apparent density of 2.65 g·cm
−3 and a mud content of 0.1%. The iron ore tailings were obtained from a site in Hanzhong, Shaanxi. Their performance metrics are presented in
Table 3.
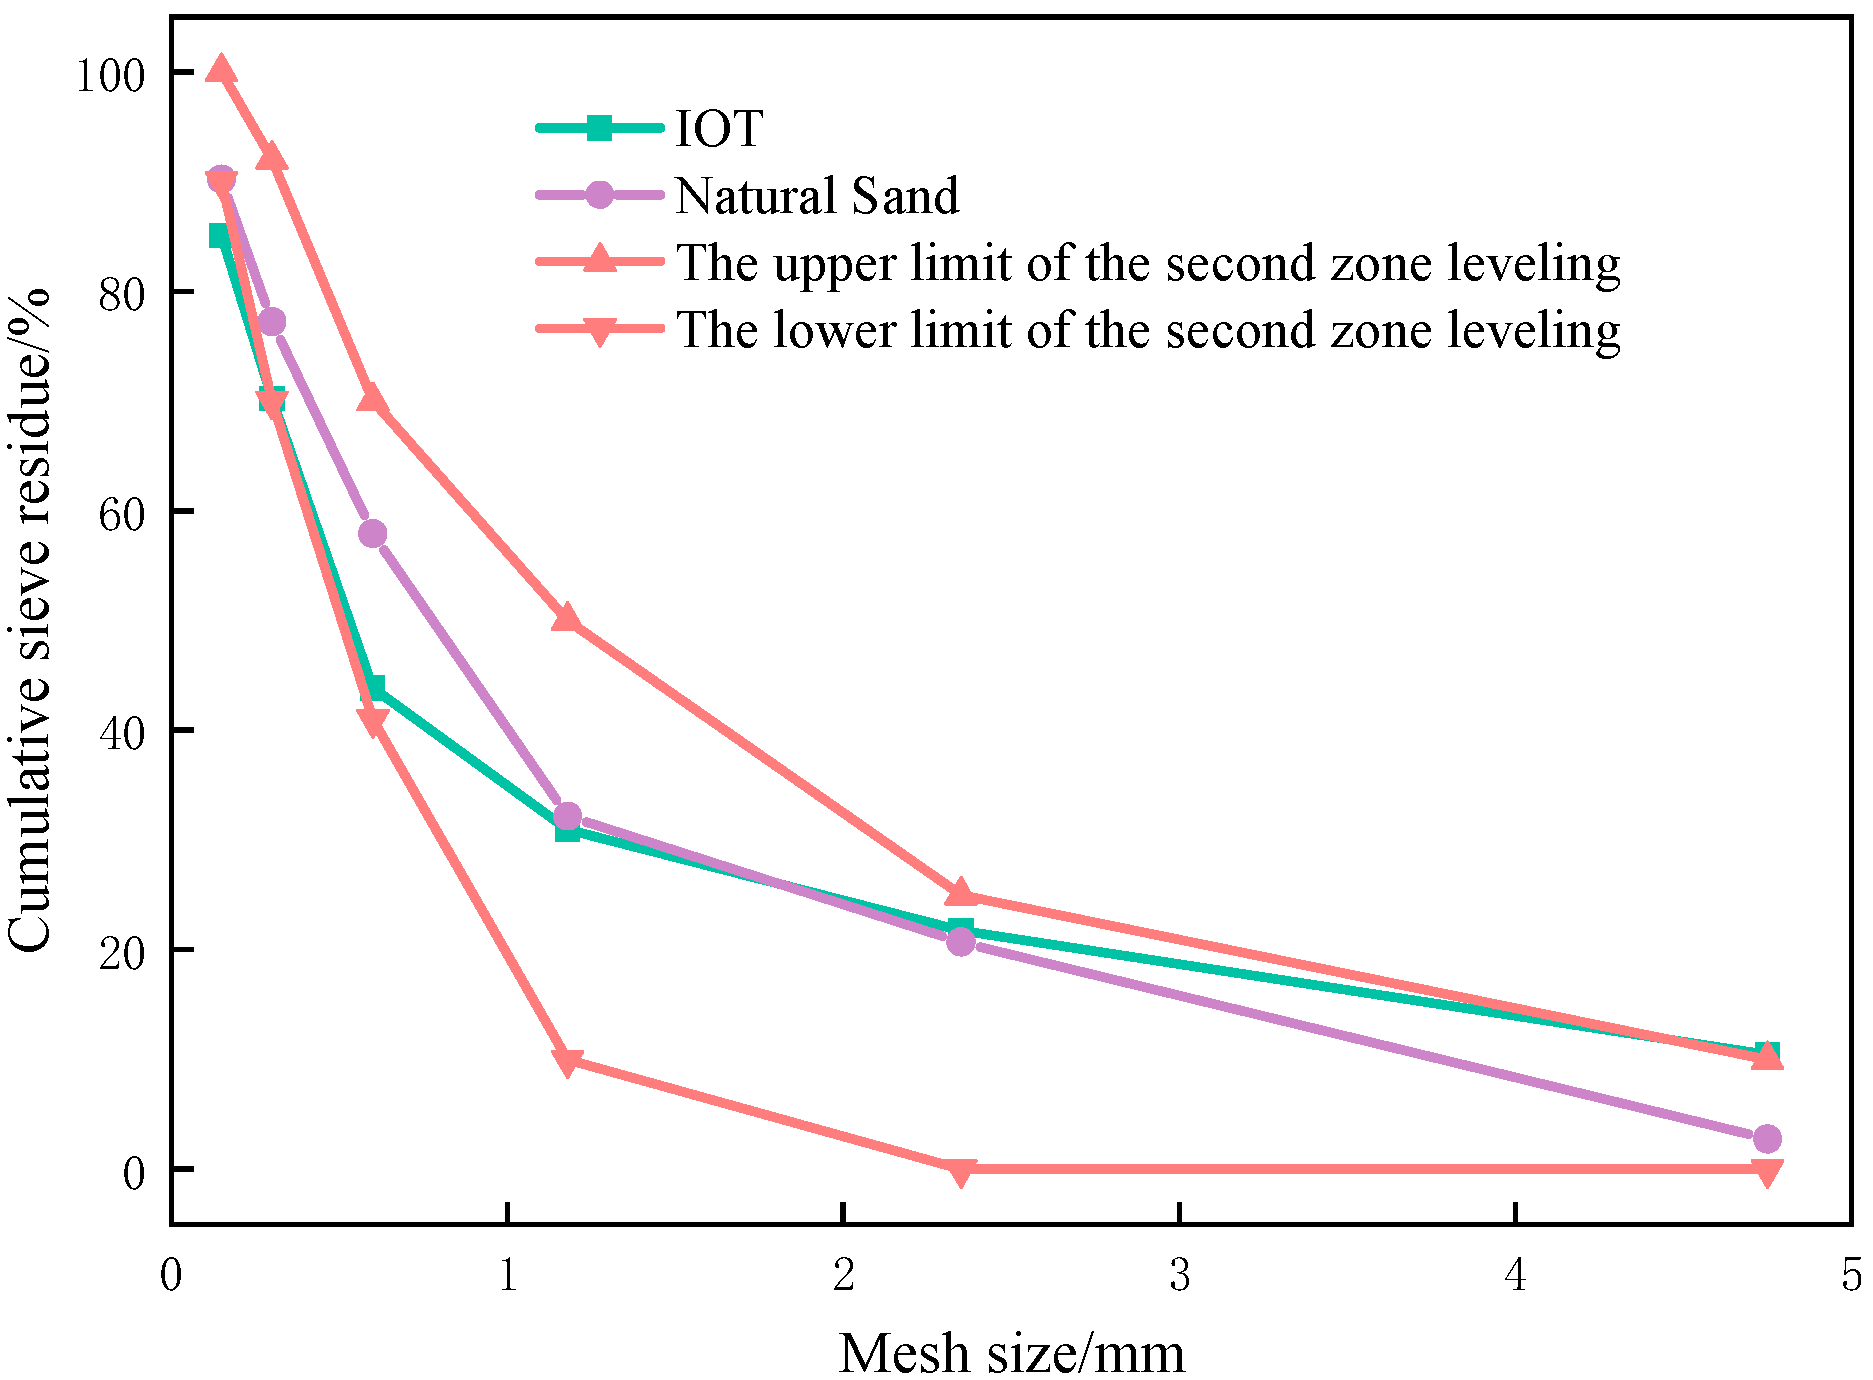
The physical properties of natural sand and iron ore tailings (IOTs) are presented in
Table 4, with their particle size distributions shown in
Figure 1.
2.3. Basalt Fiber
The basalt fiber is 18 mm chopped basalt fiber, and the main performance indexes are shown in
Table 5.
2.4. Mixture Proportion
The test mix proportions used in this study are shown in
Table 6. The designed concrete cube has a compressive strength of C30. Both the natural aggregate and recycled aggregate have a particle size range of 10–20 mm. The water-to-binder ratio (W/C) of the concrete was fixed at 0.5, and the designed slump of the concrete was specified to be within the range of 100–150 mm. A poly carboxylic-acid-based high-efficiency superplasticizer was employed, characterized by a water reduction rate exceeding 25% and a solid content of 20.1%. Laboratory tap water was used as the water source. Nine groups of concrete with distinct proportions were prepared. Among the first six groups, BF1T0 served as the control group. For BF1T40, BF2T40, and BF3T40, BF0T40 was designated as the control group.
2.5. Specimen Casting and Curing
To measure compressive strength post carbonation, 100 × 100 × 100 mm cube specimens were cast; for carbonation depth assessment, 100 × 100 × 400 mm prismatic specimens were prepared. The specimens were prepared by pre-wetting and secondary mixing, and 10% of the water and recycled aggregate were first put into the mixer and stirred for 2 min. Secondly, 50% of the cement and 50% of the water was added with continuous stirring for 0.5 min. Then, we added fine aggregate, the remaining water and cement, a fiber and water reducer, stirred for another 2 min, and finally poured the mixture into molds, which were vibrated to make a good mark. After demolding (24 h), the specimens were kept until reaching the test age. When loading, we used a spatula to press the cement against the walls of each mold and ensure that the mixture was higher than the mold mouth; we then placed the mold on the vibrating table to vibrate until the surface became a slurry. After vibrating and compacting, we used a scraper to shovel off the surface protrusion and modify the surface, and then covered the surface of each specimen with plastic wrap, followed by demolding and marking the specimen after 24 h. We placed each specimen in a standard curing box, with the temperature of the curing box kept at (20 ± 3) °C and the relative humidity greater than 95%. After the carbonation and freeze–thaw cycles for each group of concrete, three specimens were taken to measure the durability index, and the average value was taken.
2.6. Carbonation Test
According to (GB/T 50082-2024 [
27]) the “Standard for Test Methods for Long-term and Durability Performance of Ordinary Concrete (in Chinese)”, a rapid carbonation test of concrete was carried out. The carbonation environment was maintained at a temperature of 20 ± 2 °C, a relative humidity of 70 ± 5 %, and a CO
2 concentration of 20 ± 2 %. At the commencement of the test, observations and checks were conducted every 2 h. After the first 2 days, the checking interval was extended to 4 h. Once the specimens reached the corresponding carbonation ages, three specimens were randomly selected from each group to measure the carbonation depth and compressive strength. The average values of these measurements were then determined and recorded.
2.7. Carbonation Depth and Compressive Strength
For carbonation depth measurement, 100 mm × 100 mm × 100 mm specimens were employed, while 100 mm × 100 mm × 400 mm prisms were used for compressive strength testing. Every 7 days of carbonation, three corresponding samples were taken for each group of mixtures for carbonation depth testing and compressive strength testing, and the arithmetic average value was taken. The test results of the three samples were less than 10%. The compressive strength test is shown in
Figure 2. When a 100 × 100 × 400 mm prismatic block was split and a 1% phenolphthalein-alcohol solution was dropped onto the freshly cleaved surface, the uncarbonized regions exhibited a distinct purple coloration (
Figure 2). The calculation method for the carbonation depth at various ages is presented in Equation (1):
where
represents the average carbonation depth (in mm) of the specimen after
days of rapid carbonation,
denotes the number of carbonation measurement points, and
is the carbonation depth at each individual measurement point (in mm).
2.8. Freeze–Thaw Cycle Test
According to (GB/T 50082-2024) the “Standard for Test Methods for Long-term and Durability Performance of Ordinary Concrete (in Chinese)”, a freeze–thaw cycle test of concrete was carried out. Prior to commencing the freeze–thaw cycle test, the concrete specimens were immersed in water for four days, following which the curing age was officially marked. After these four days, the mass of each concrete specimen was measured.
Throughout the entire freeze–thaw cycle test, the concrete specimens were continuously exposed to a water-freezing and water-thawing regime. The freezing and thawing temperatures were maintained at −18 ± 2 °C and 5 ± 2 °C, respectively. Each complete freeze–thaw cycle took approximately 3.5–4 h. After every 25 freeze–thaw cycles, the mass loss rate, relative dynamic elastic modulus, and compressive strength of the concrete specimens were accurately measured. Subsequently, the measurement results were analyzed.
2.9. Test for Mass Loss Rate
After every 25 freeze–thaw cycles, a scale was used to determine the mass of each individual test sample. The mass loss rate calculation used 100 mm × 100 mm × 400 mm specimens, and each group of mixtures had 3 samples for quality testing. The average value of the arithmetic was taken, and the quality error of a single sample was kept within 10%. The formula for calculating the mass loss rate of a single specimen is shown below. The formula is derived from (GB/T 50082-2024) the “Standard for Test Methods for Long-term and Durability Performance of Ordinary Concrete (in Chinese)”.
where
represents the mass loss rate of the
i-th specimen after freeze–thaw cycles
n-th;
and
represent the masses (in grams) of the
i-th specimen after the 0th and
n-th freeze–thaw cycles, respectively.
2.10. Test for Relative Dynamic Elastic Modulus
At intervals of 25 freeze–thaw cycles, the DT-20 dynamic elastic modulus tester was employed to precisely measure the transverse fundamental frequency of the test specimens. The relative dynamic modulus test used 100 mm × 100 mm × 400 mm specimens. Three samples per mixture group underwent testing, with the results reported as arithmetic means, and the dynamic elastic modulus error was kept within 5%. The computational approach for determining the relative dynamic elastic modulus of an individual specimen is detailed in the formula presented below. The formula is derived from (GB/T 50082-2024) the “Standard for Test Methods for Long-term and Durability Performance of Ordinary Concrete (in Chinese)”.
represents the relative dynamic elastic modulus of the i-th specimen; and are the transverse fundamental frequencies (in Hz) of the -th specimen after and 0 freeze–thaw cycles, respectively.
For the mass loss rate, relative dynamic elastic modulus, and compressive strength, the arithmetic mean of the measurement results from three specimens was adopted as the measured value.
2.11. SEM Microscopic Observations
Upon completion of the tests, the concrete block was carefully crushed, and a 1-cubic-centimeter sample was retrieved for SEM (Scanning Electron Microscopy. The Carl Zeiss Group from Jena, Germany.) examination. The carbonation resistance of BF-IOT-RAC was then analyzed from a microscopic vantage point.
The specific method of SEM scanning is as follows:
Due to the poor conductivity of concrete, the concrete is first sprayed with gold, and then the sample is pasted onto the sample holder with conductive glue, and the sample is made to be firm and flat. After pasting, the sample surface is purged with clean compressed gas to remove dust and impurities. The sample must be completely dry before the test to avoid the influence of moisture on the test results.
After confirming that the voltage is accurate and stable, the main voltage regulator power supply is turned on and cooling water is circulated through the scanning electron microscope. The vacuum system is turned on. Vacuuming is started to ensure that the air pressure in the sample chamber meets the test requirements. Then, according to the instrument manual, the necessary preheating operation is carried. When ready, the acceleration voltage is set to 3 KV, the magnification factor is set to 5000, 10,000, etc., according to different requirements, and the work distance is set to 3.3 mm.
3. Results
3.1. BF-IOT-RAC Carbonation Depth
This section mainly explores the influence of BF and IOTs on the carbonation depth of RAC at different carbonation ages.
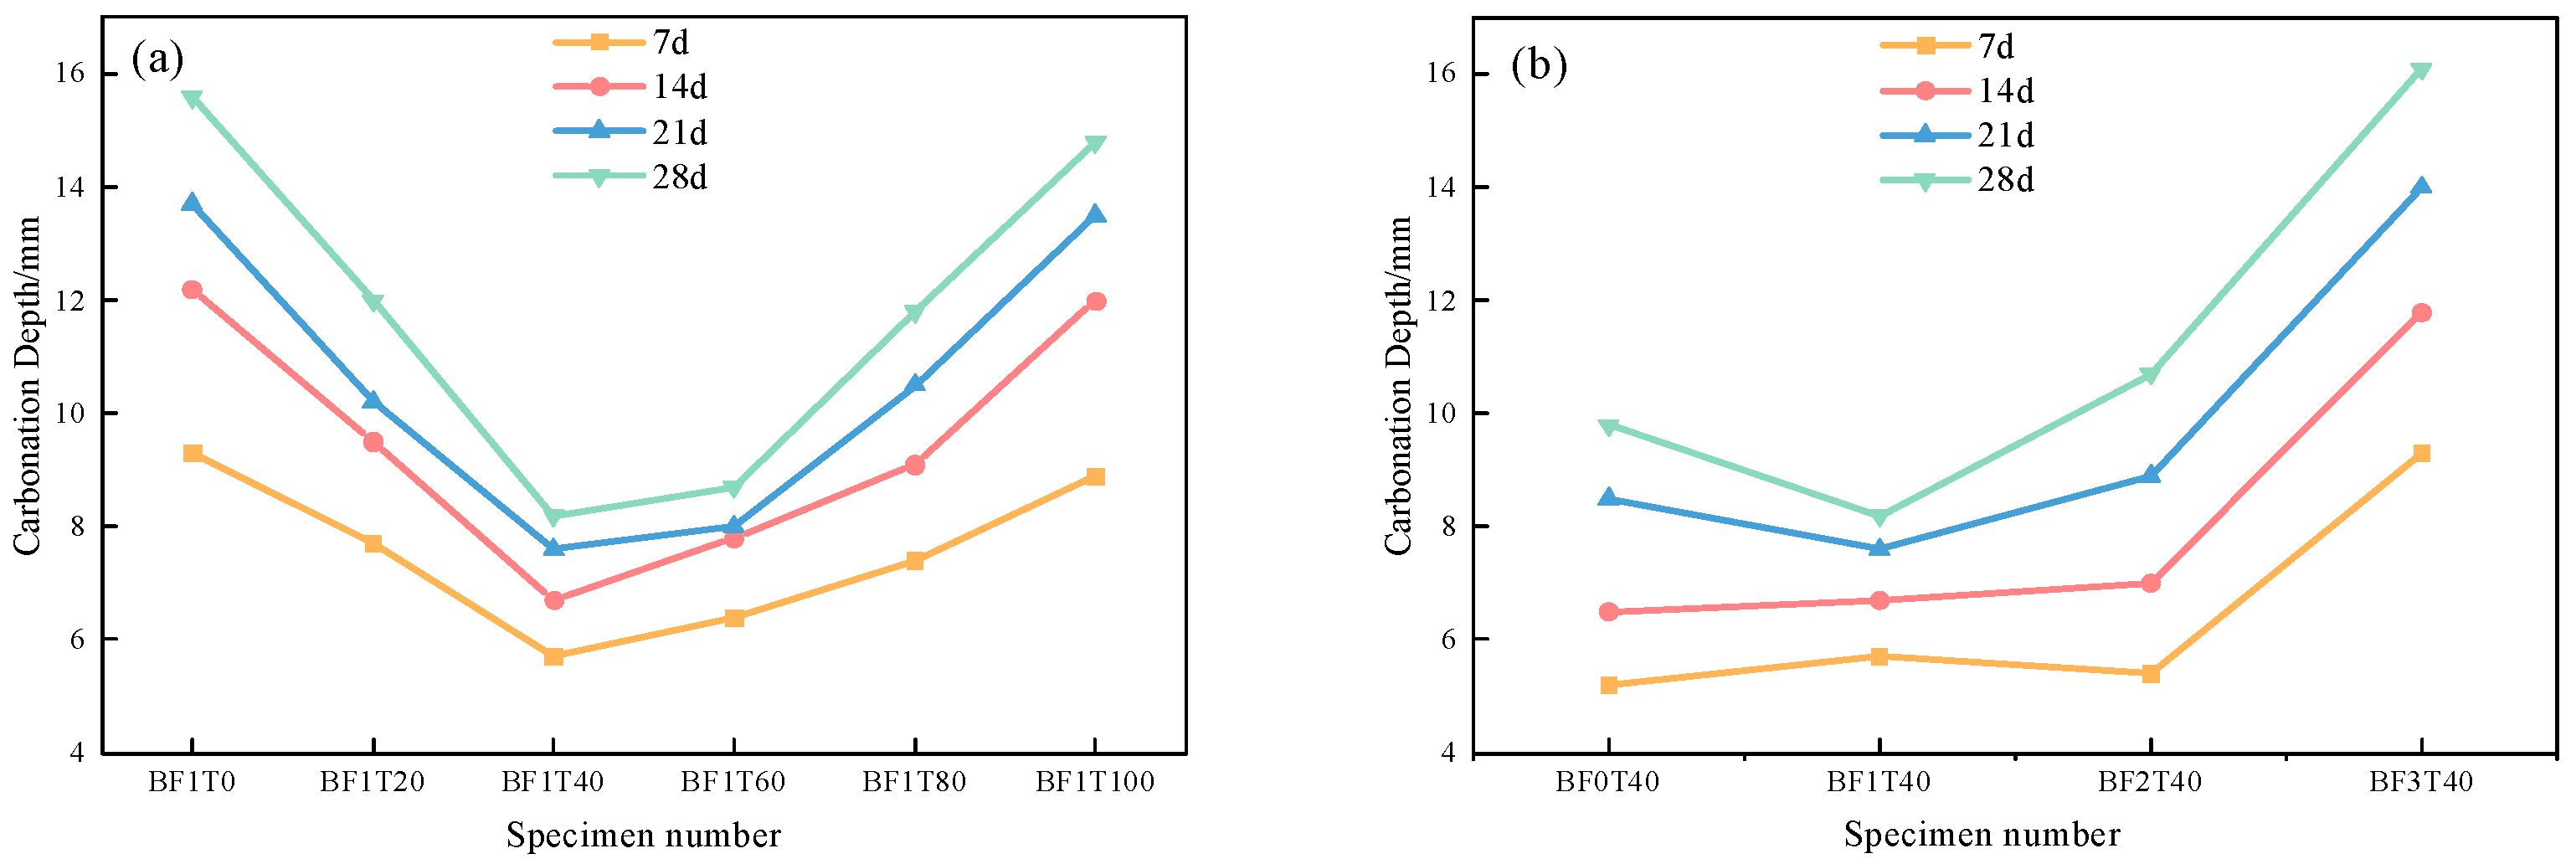
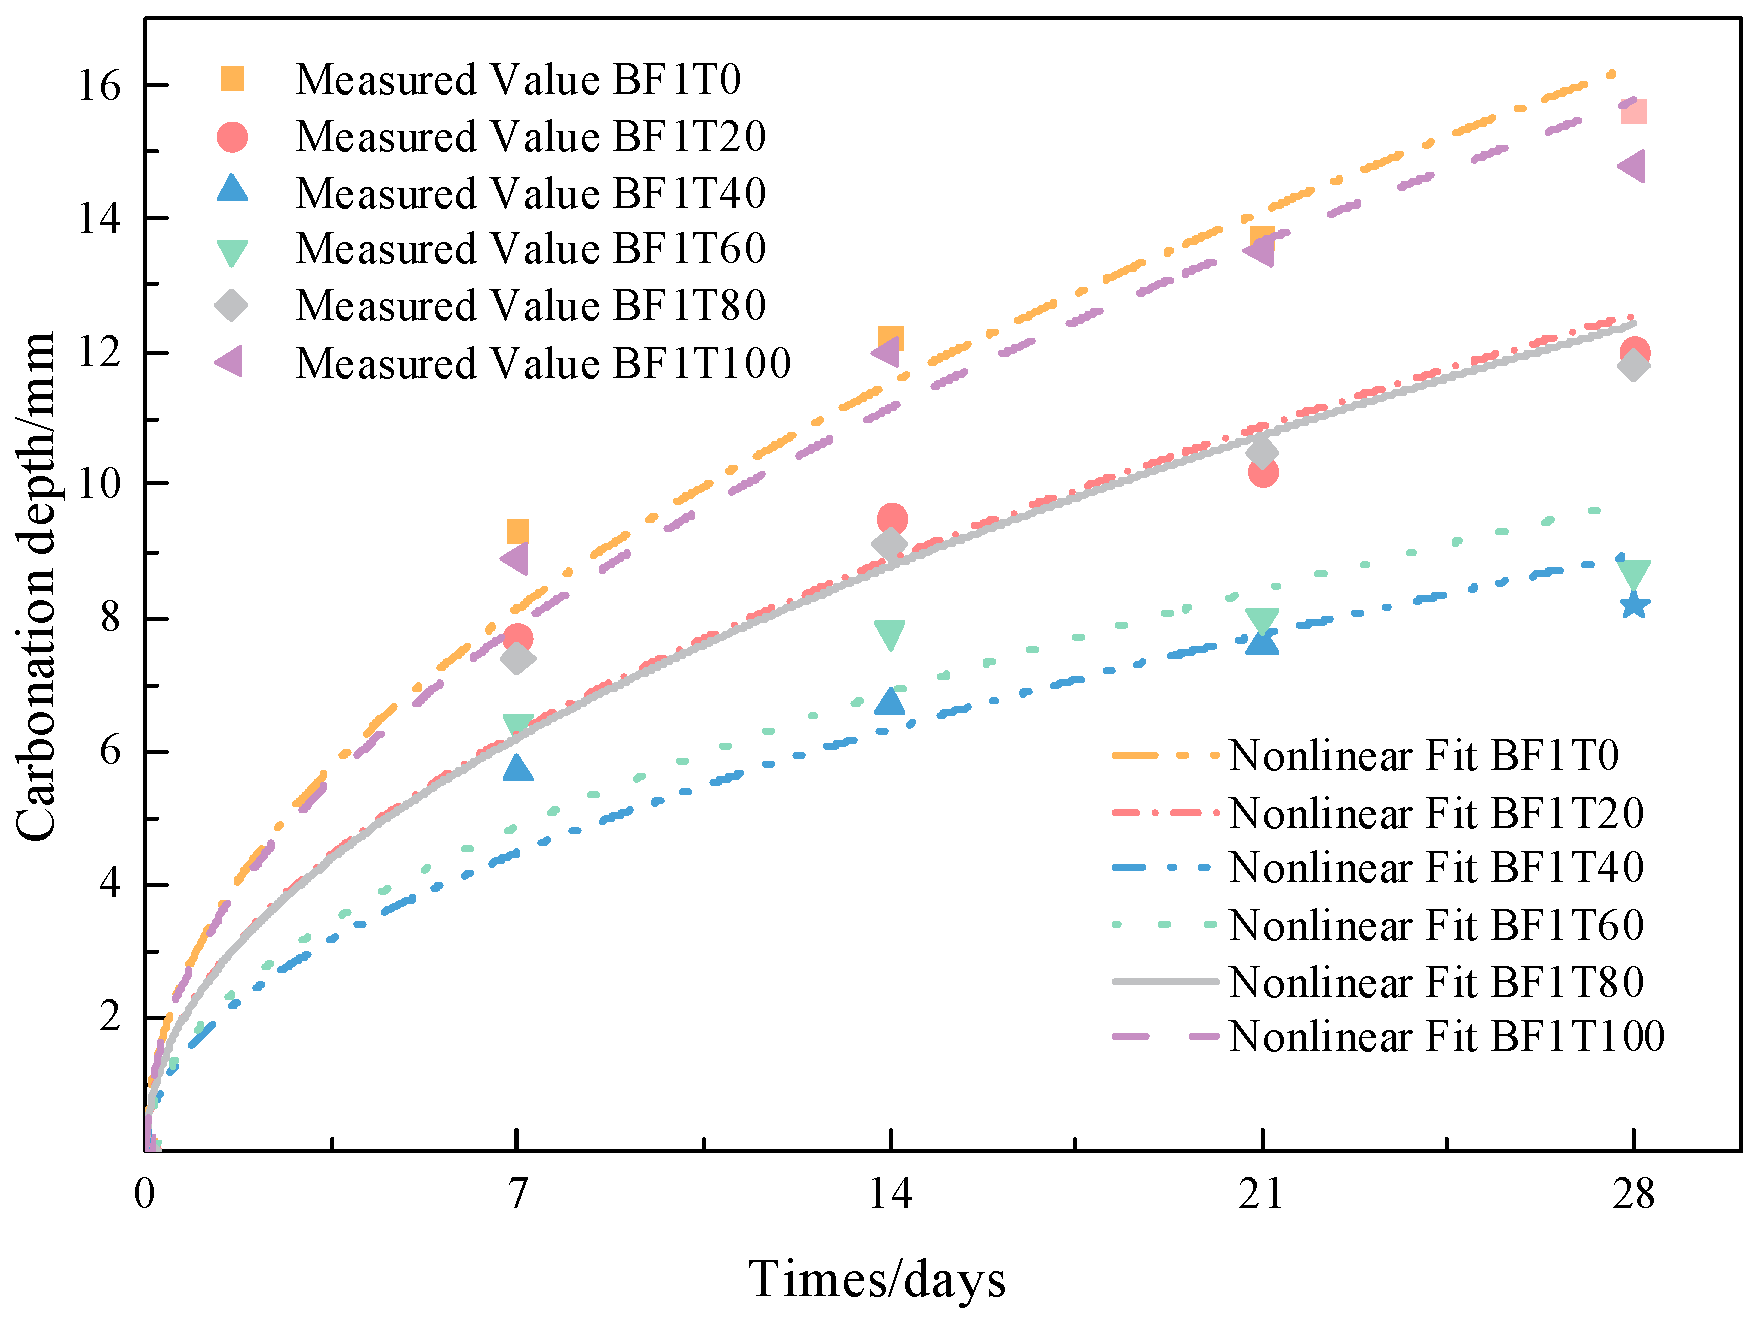
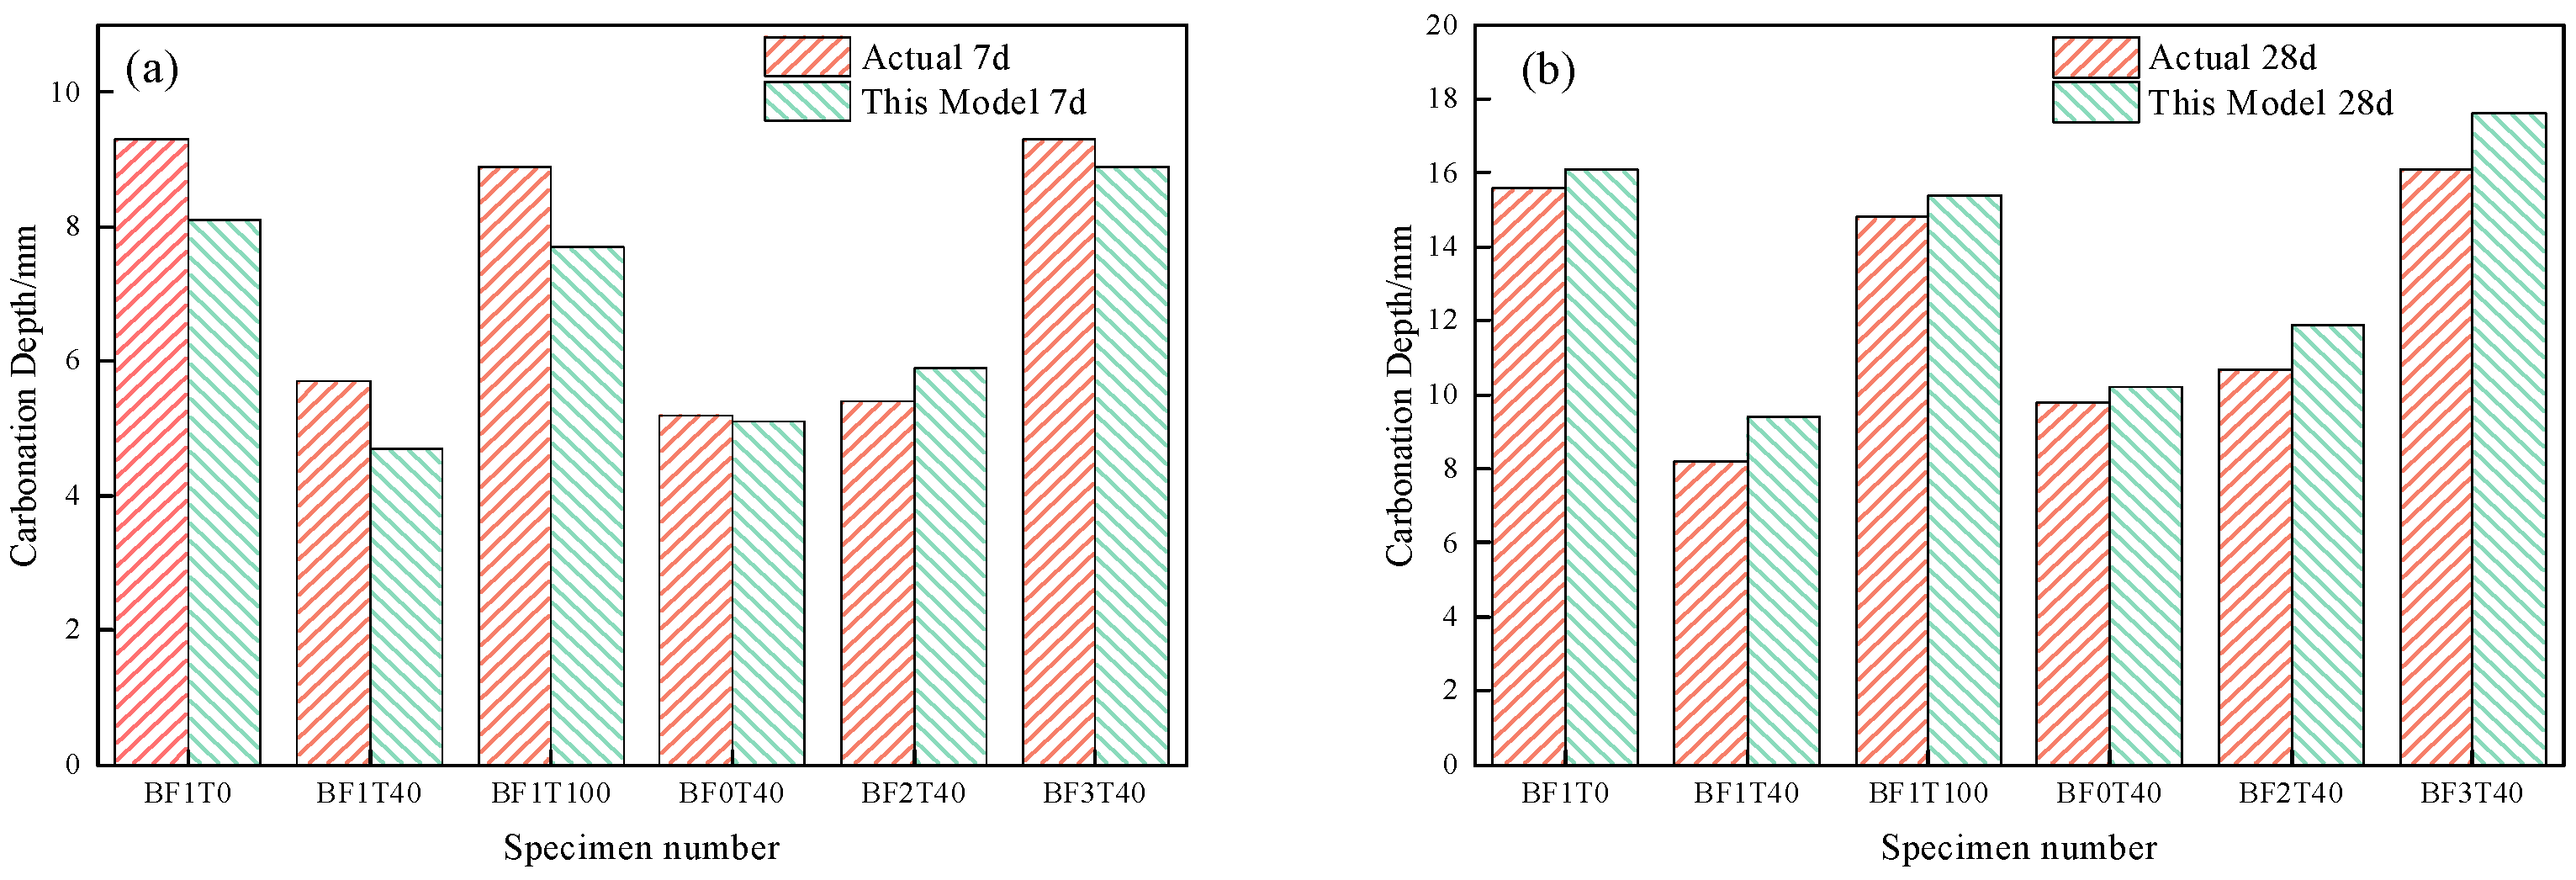
Figure 3a illustrates the variation trend of the carbonation depth of RAC under diverse IOT replacement rates when the BF content is fixed at 0.1%. As depicted in
Figure 3a, with the BF content remaining constant, as the IOT replacement rate increases, the carbonation depth of RAC at different carbonation ages initially decreases and subsequently increases. During the early stage of the carbonation test, as CO
2 permeates into the concrete and reacts with calcium hydroxide (Ca(OH)
2), a compact calcium carbonate (CaCO
3) film is formed on the concrete surface. This film serves to impede the ingress of CO
2 into the recycled concrete to a certain extent, thereby decelerating the carbonation rate of RAC [
24].
At a carbonation age of 7 days, the carbonation depth of BF1T40 attains the lowest value, which is 38.7% and 35.9% lower than that of BF1T0 and BF1T100, respectively. At a 40% IOT substitution rate, it is significantly better than RAC without IOTs. When the carbonation age reaches 28 days, the carbonation depth of BF1T40 is 47.4% and 44.6% lower than that of BF1T0 and BF1T100, respectively. This phenomenon may be due to the finer particles of the IOTs which are able to fill the pores and optimize the pore structure. Therefore, when the IOT substitution rate is 40%, both the compactness of RAC and the carbonization resistance are the best. With the increase in the substitution rate, it is more difficult for the optimization of the fine aggregate gradation of IOT fine particles to compensate for the disadvantages of its own porous and multi-water absorption. So, after the IOT substitution rate reaches 40%, the carbonization resistance is gradually weakened, and when the substitution rate is 100%, the carbonization resistance is the worst.
Figure 3b depicts the variation trend of the carbonation depth of RAC under different BF contents when the IOT replacement rate is fixed at 40%. As evident from
Figure 3b, throughout the entire carbonation period, when the volume content of BF is 0.1%, the carbonation depth of RAC consistently remains lower than that of the concrete without BF inclusion. As can be seen from the figure, at 28 days of carbonation, the carbonation depth of recycled concrete with 0.1% basalt fiber is about 16.3% lower than that of recycled concrete without basalt fiber. Conversely, the carbonation depth of BF2T40 is 9.2% higher than that of the non-fiber-added counterpart, and the carbonation depth of BF3T40 is 49% higher than that of BF0T40. This clearly indicates that, under the condition of a 40% replacement rate of iron ore tailings, as the BF content increases, the carbonation resistance of RAC initially improves and then deteriorates.
Due to the large specific surface area of BF, part of the water is adsorbed by BF during the concrete pouring process, and in addition, the IOTs will also absorb water from their own pores and cracks. When the BF volume content and IOT substitution rate are large, the drying shrinkage of the concrete matrix will be accelerated. This, in turn, creates additional porosity within the concrete. These newly formed pores provide more channels for CO2 to penetrate the concrete. The reason why BF1T40 exhibits the lowest carbonation depth is that it has the best ratio of fiber content as well as the best substitution rate of IOTs, which can be evenly dispersed in RAC. This allows for a strong connection between the fiber and the substrate. Obviously, this is the main factor that helps to enhance the resistance of RAC to carbonation when incorporated with fibers.
3.2. Compressive Strength of BF-IOT-RAC Carbonization Test
This section mainly explores the influence of BF and IOTs on the compressive strength of RAC at different carbonation ages.
Figure 4a presents the variation trend of the compressive strength of RAC at different carbonation ages under diverse IOT replacement rates when the BF content is maintained at 0.1%. As depicted in
Figure 4a, with the BF content held constant, as the IOT replacement rate increases, the initial compressive strength of BF-IOT-RAC initially rises and then declines. When CO
2 permeates into RAC, Ca(OH)
2 reacts with C-S-H to form CaCO
3, causing a reduction in the pH of RAC [
28]. Meanwhile, the generated carbonate fills the pores, thereby enhancing the compressive strength of RAC. When the IOT replacement rate is 40%, the initial compressive strength reaches its peak value of 41.3 MPa. In contrast, when the replacement rate is 0%, the initial compressive strength is 35.3 MPa, which represents the lowest value among the six groups of specimens. This indicates that, when the BF content is fixed, the addition of iron ore tailings can enhance the compressive strength of RAC to varying extents. At a carbonation age of 28 days, the compressive strength of BF1T40 amounts to 44.8 MPa, demonstrating the largest increase, which is 3.5 MPa higher than its initial compressive strength. When the replacement rate of IOTs is 100%, the compressive strength after 28 days of carbonation increases minimally, only reaching 1.8 MPa. This phenomenon may be attributed to the presence of a certain amount of calcium carbonate in the hydration products of the RAC containing added IOTs, which decompose into calcite during the carbonation process. On the other hand, the relatively large pores present in the larger particles of IOTs, when used in high quantities, result in an insufficient filling effect of CaCO
3 after carbonation to compensate for this shortcoming. Therefore, when IOTs are completely utilized as fine aggregate, their effect on enhancing the strength of RAC is not satisfactory. As can be seen from the figure, BF1T40 has significantly higher compressive strength than recycled concrete mixed with basalt fibers only.
Figure 4b depicts the variation trend of the compressive strength of RAC at different carbonation ages under distinct BF contents when the IOT replacement rate is set at 40%. As evident from
Figure 4b, with the IOT replacement rate fixed at 40%, the compressive strength of RAC with basalt fiber is significantly higher than that of recycled concrete without basalt fiber under the appropriate dosage. The initial compressive strength peaks at 44.5 MPa when the BF content is 0.2%. Nevertheless, the increase in compressive strength at 28 days of carbonation for this case is less than that of BF1T40. When the BF content is 0.3%, the compressive strength of the recycled concrete throughout the entire carbonation age is markedly lower than that of RAC without the BF addition. This indicates that an overly high BF content exerts a negative impact on the strength enhancement of BF-IOT-RAC. In comparison with
Figure 4a, BF3T40 represents the group of specimens with the least strength improvement. The reason lies in that prior to carbonation, an excessive BF content causes agglomeration within the matrix, enlarging the original pores. After carbonation, BF3T40 shows the most detrimental effect on the improvement in compressive strength. Under the combined influence of the calcite formed from the reaction between ettringite in the IOT hydration products and CO
2 and the large pores induced by the incorporation of a substantial amount of fiber, the structural compactness of RAC is substantially diminished.
3.3. Microscopic Topography Observation
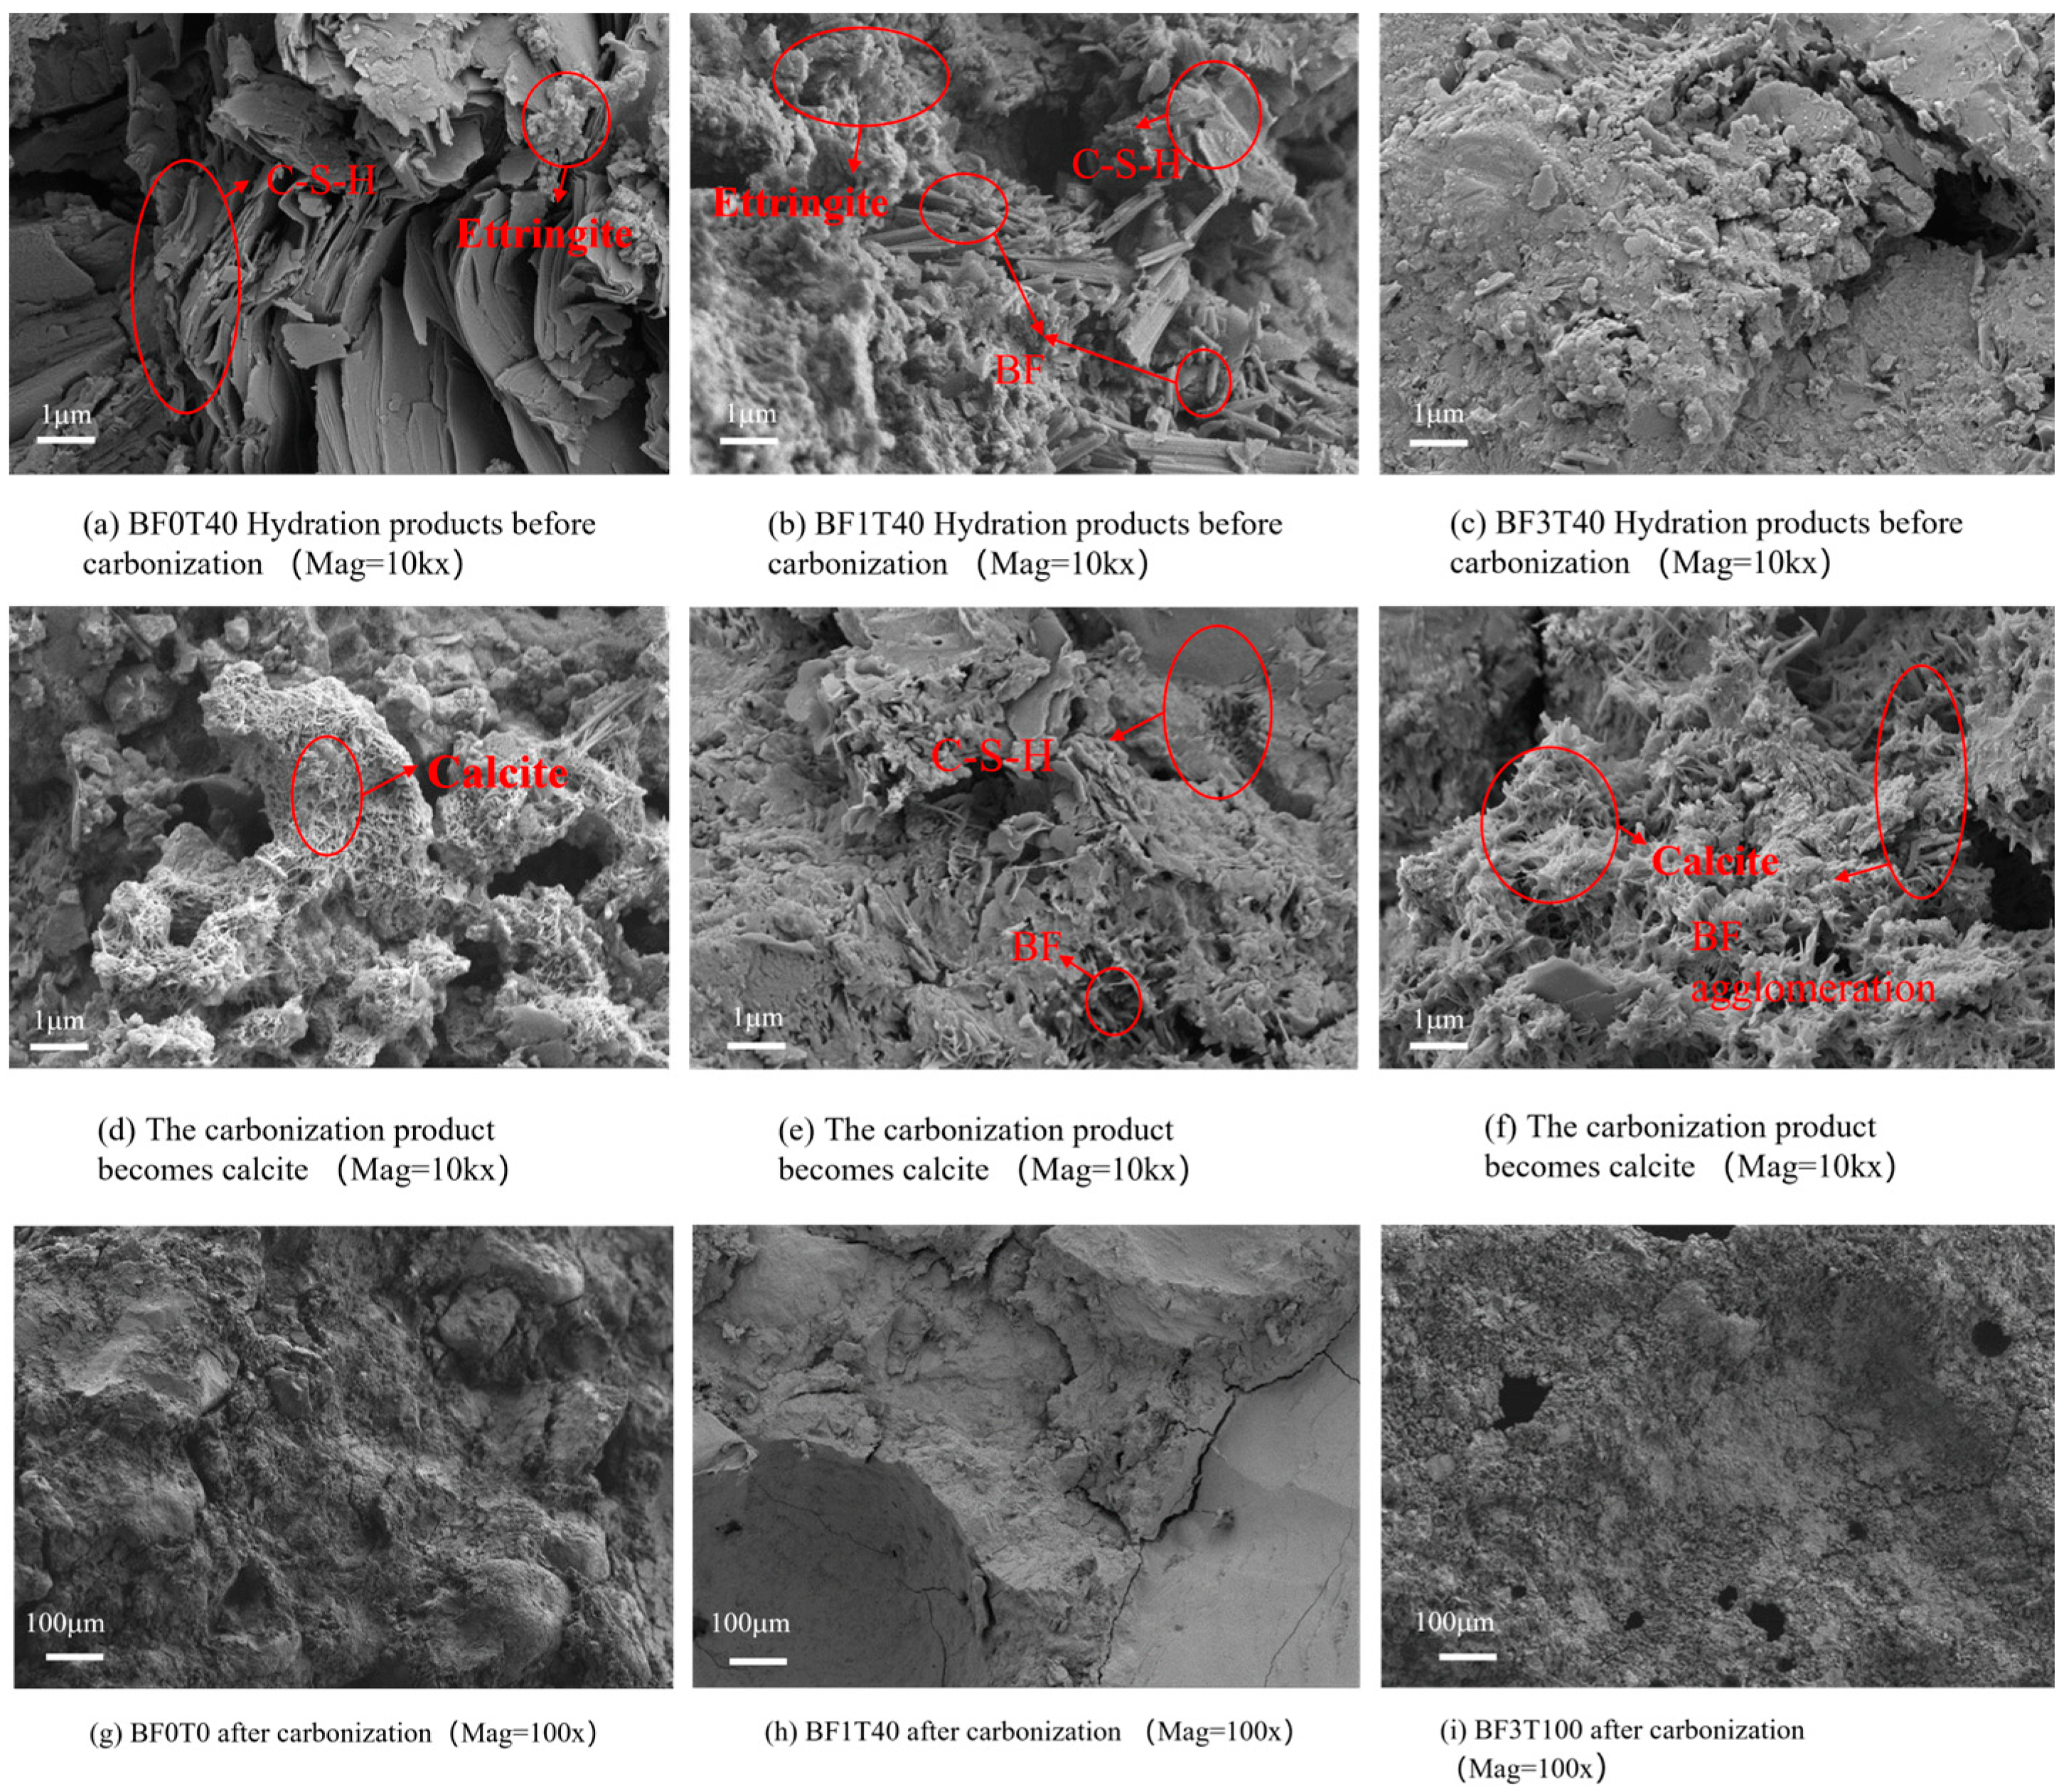
Figure 5 presents the microscopic morphology of fractured BF-IOT-RAC under electron microscopy. As observable from
Figure 5a,f, alongside hydrated calcium silicate (C-S-H), certain ettringite (3CaO·Al
2O
3·3CaSO
4·32H
2O) is also present. During the carbonation test, on one hand, CO
2 infiltrates into the RAC and reacts with calcium-vanadiumite, as depicted in Equation (4) [
29]. This reaction leads to the formation of a large number of reticulated calcite structures, all of which possess relatively more pores. On the other hand, during the carbonation of CH (calcium hydroxide), chemically bound water is released. This water reacts with the CO
2 and calcium carbonate present in the concrete, and the volume of the resulting calcite is larger than that of the original CH. In addition, the carbonation reaction itself can also lead to the shrinkage of concrete. These changes are the primary cause of the appearance of cracks in the RAC subsequent to carbonation.
As discernible from
Figure 5a,d, BF0T40 lacks BF. Prior to carbonation, distinct flake-shaped CH crystals and a small quantity of ettringite are visible. After 28 days of carbonation, a profusion of silk-meshed calcite structures are present on the surface of the hydration products. At this stage, it becomes nearly impossible to differentiate between calcite and C-S-H, and the interior of RAC appears relatively loose. As seen in
Figure 5b,e, in the BF1T40 matrix, although the distribution of BF might seem somewhat disproportionate, after 28 days of carbonation, while some of the ettringites have reacted to form calcite, calcite and C-S-H can still be clearly distinguished. This is attributed to the firm connection established between an appropriate amount of BF and the matrix. This connection restricts the pathways for CO
2 to enter RAC, effectively delaying or even inhibiting the propagation and formation of cracks during the carbonation process, thereby enhancing the anti-carbonation performance of RAC. In BF3T40, as shown in
Figure 5c, with a BF content of 0.3%, prior to carbonation, fiber agglomeration has led to the formation of certain pores. These pores provide more and larger channels for CO
2 to penetrate the matrix. As carbonation advances,
Figure 5f reveals that not only do these fibers fail to reinforce the structure, but the porosity resulting from agglomeration promotes the influx of CO
2, causing an increase in matrix pores. At this point, instead of enhancing the carbonation resistance of RAC, the presence of BF accelerates the erosion of BF-IOT-RAC by CO
2. Compared to BF0T40, the carbonation resistance of BF3T40 has decreased rather than increased.
Figure 5g presents the SEM-magnified (×100) morphology of RAC without BF and IOTs. It can be observed that while the aggregate and mortar are fairly well bonded, due to the presence of old mortar on the surface of the recycled aggregate, there are still some cracks and pores within the RAC. As seen in
Figure 5h, BF1T40 contains 0.1% BF and has an IOT substitution rate of 40%. The interior of RAC appears relatively smooth and compact. Excluding the cracks resulting from the test block crushing process, there are few pores and cracks. This is because the mechanism by which IOTs enhance concrete properties is as follows: When iron tailings are mechanically ground into fine-grained sand, their activity is stimulated to a certain degree. This stimulates the potential pozzolana activity of iron tailing sands, promotes the consumption of cement clinker, and accelerates the formation of hydration products. This process dynamically fills the interior of the concrete, making its internal structure denser [
28].
Furthermore, with a 0.1% BF content, the fibers are uniformly dispersed within the RAC. This results in a firm connection between the matrix and the fibers, further densifying the RAC and enhancing its anti-carbonation performance.
Figure 5i reveals that, after 28 days of carbonation, pores and cracks emerge on BF3T100, and its interior is relatively porous. This can be attributed to the fact that during the mining, crushing, and grinding processes, larger IOT particles can induce cracks. Thus, when the IOT substitution rate is high, a substantial quantity of large-sized IOT particles gives rise to more pores and cracks within the RAC, diminishing its compactness. Additionally, the 0.3% BF content in the RAC agglomerates, generating pores that offer channels for CO
2 ingress, thereby reducing the RAC’s carbonation resistance.
3.4. Mass Loss Rate
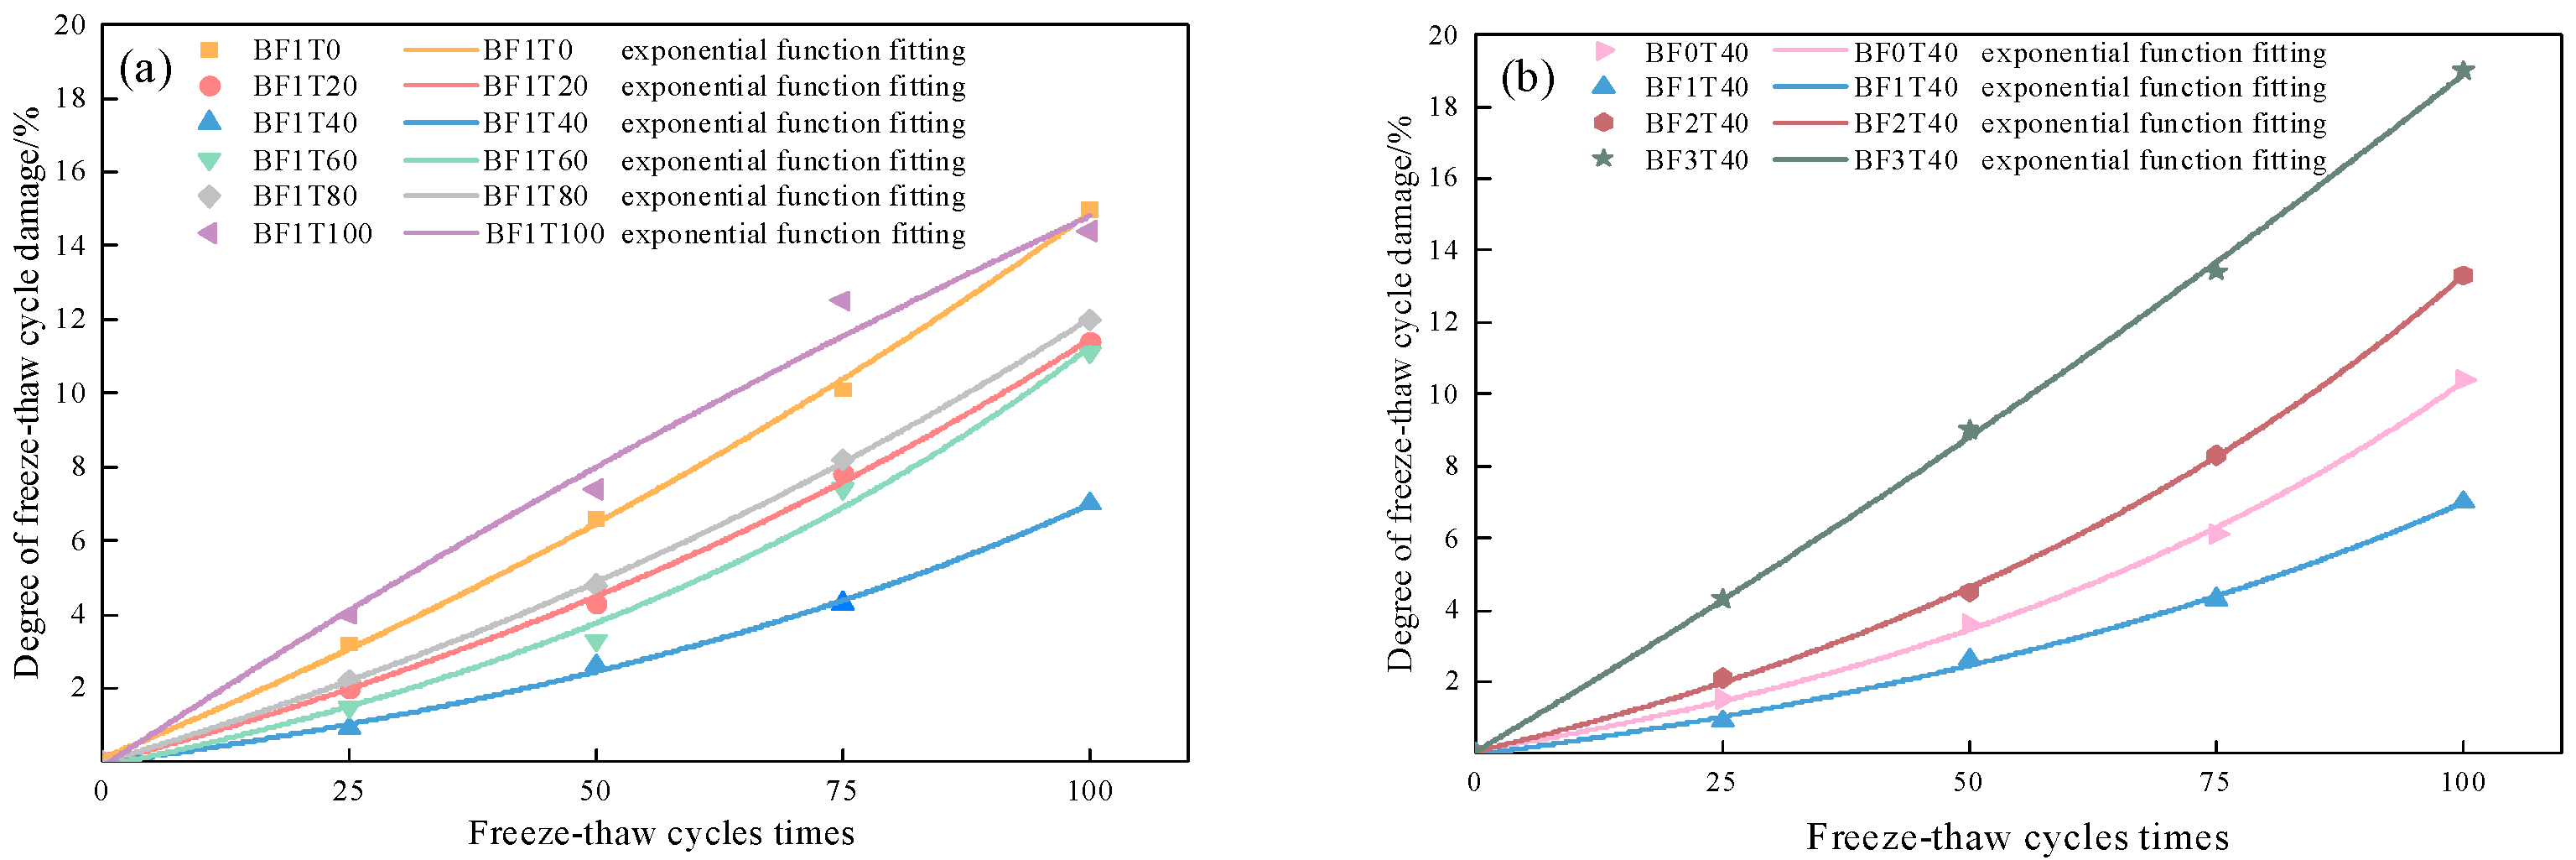
Figure 6 shows how mass loss rate evolves with freeze–thaw cycles for BF-IOT-RAC at different IOT replacement rates and BF contents. In
Figure 6, the mass loss rates of all specimens show a negative growth trend in the first 25 freeze–thaw cycles. This is because BF, IOTs, and RAC themselves all have a certain water absorption capacity. The external aqueous solution enters the interior of the concrete through capillary absorption. Moreover, in the early stage of the freeze–thaw cycles, the internal freeze–thaw tension after incorporating BF and IOTs is not sufficient to damage the specimens, resulting in an increase in the mass of the specimens [
30].
It can be seen from
Figure 6a that in the early stage of the freeze–thaw cycles, the mass loss rates of each group of concrete are not significantly different. This is because the freeze–thaw damage of each group of concrete is relatively small in the early stage of the freeze–thaw cycles, and the surface spalling of each group of specimens is not obvious in the first 25 freeze–thaw cycles. However, it can be seen in
Figure 6a,b that when the number of freeze–thaw cycles is 50 to 75, the concrete mass loss rate of each mix ratio is differentiated. In
Figure 6a, it can be seen that BF1T40 has the smallest mass loss rate and BF1T100 has the largest mass loss rate at 75 freeze–thaw cycles. At 100 freeze–thaw cycles, the mass loss rate of BF1T40 is the smallest, only 0.8%; the mass loss rate of BF1T0 is the largest at 100 freeze–thaw cycles, reaching 2.1%. This shows that compared with concrete without IOTs, the 40% IOT substitution rate can improve the frost resistance of recycled concrete. This is attributed to the fact that the finer particles in IOTs fill the internal pores of RAC better than natural sand and enhance the compactness of RAC. Although the mass loss rate of BF1T100 at 100 freeze–thaw cycles is lower than that of BF1T0, it is relatively close to it. This is because IOTs completely replace natural sand. Although the fine particles have a filling effect, the adhesion between the larger particles of IOTs and the aggregates is poor, and large-area particle spalling occurs after freeze–thaw, as shown in
Figure 7.
As shown in
Figure 6b, the mass loss rate of BF1T40 is minimal when the number of freeze–thaw cycles ranges from 50 to 75. However, when the BF content is 0.3%, and the mass loss rate of concrete without BF grows larger. The analysis indicates that a BF content of 0.1% is evenly and randomly distributed in the RAC, and the three-dimensional network structure formed tightly bonds the coarse and fine aggregates together, thereby reducing early-age water absorption of the concrete and the surface spalling phenomenon after freeze–thaw cycles. The mass loss rate of BF2T40 is the same as that of BF1T40 at 50 freeze–thaw cycles, but at 100 freeze–thaw cycles, the IOT mass loss rate is relatively large and is not significantly different from that of RAC without BF incorporated and RAC with a BF content of 0.3%. This is because when the BF content is relatively large, agglomeration will occur inside the concrete, resulting in the formation of pores. The freezing of pore water will cause the expansion of BF-IOT-RAC, reduce the bonding force between concrete particles [
31], increase surface particle spalling, and thus lead to a larger mass loss rate.
3.5. Relative Dynamic Modulus of Elasticity
The relative dynamic elastic modulus can reflect the internal compactness of concrete. Therefore, it is often used as an important indicator of the frost resistance of concrete to reflect the damage situation of concrete after freeze–thaw cycles [
32].
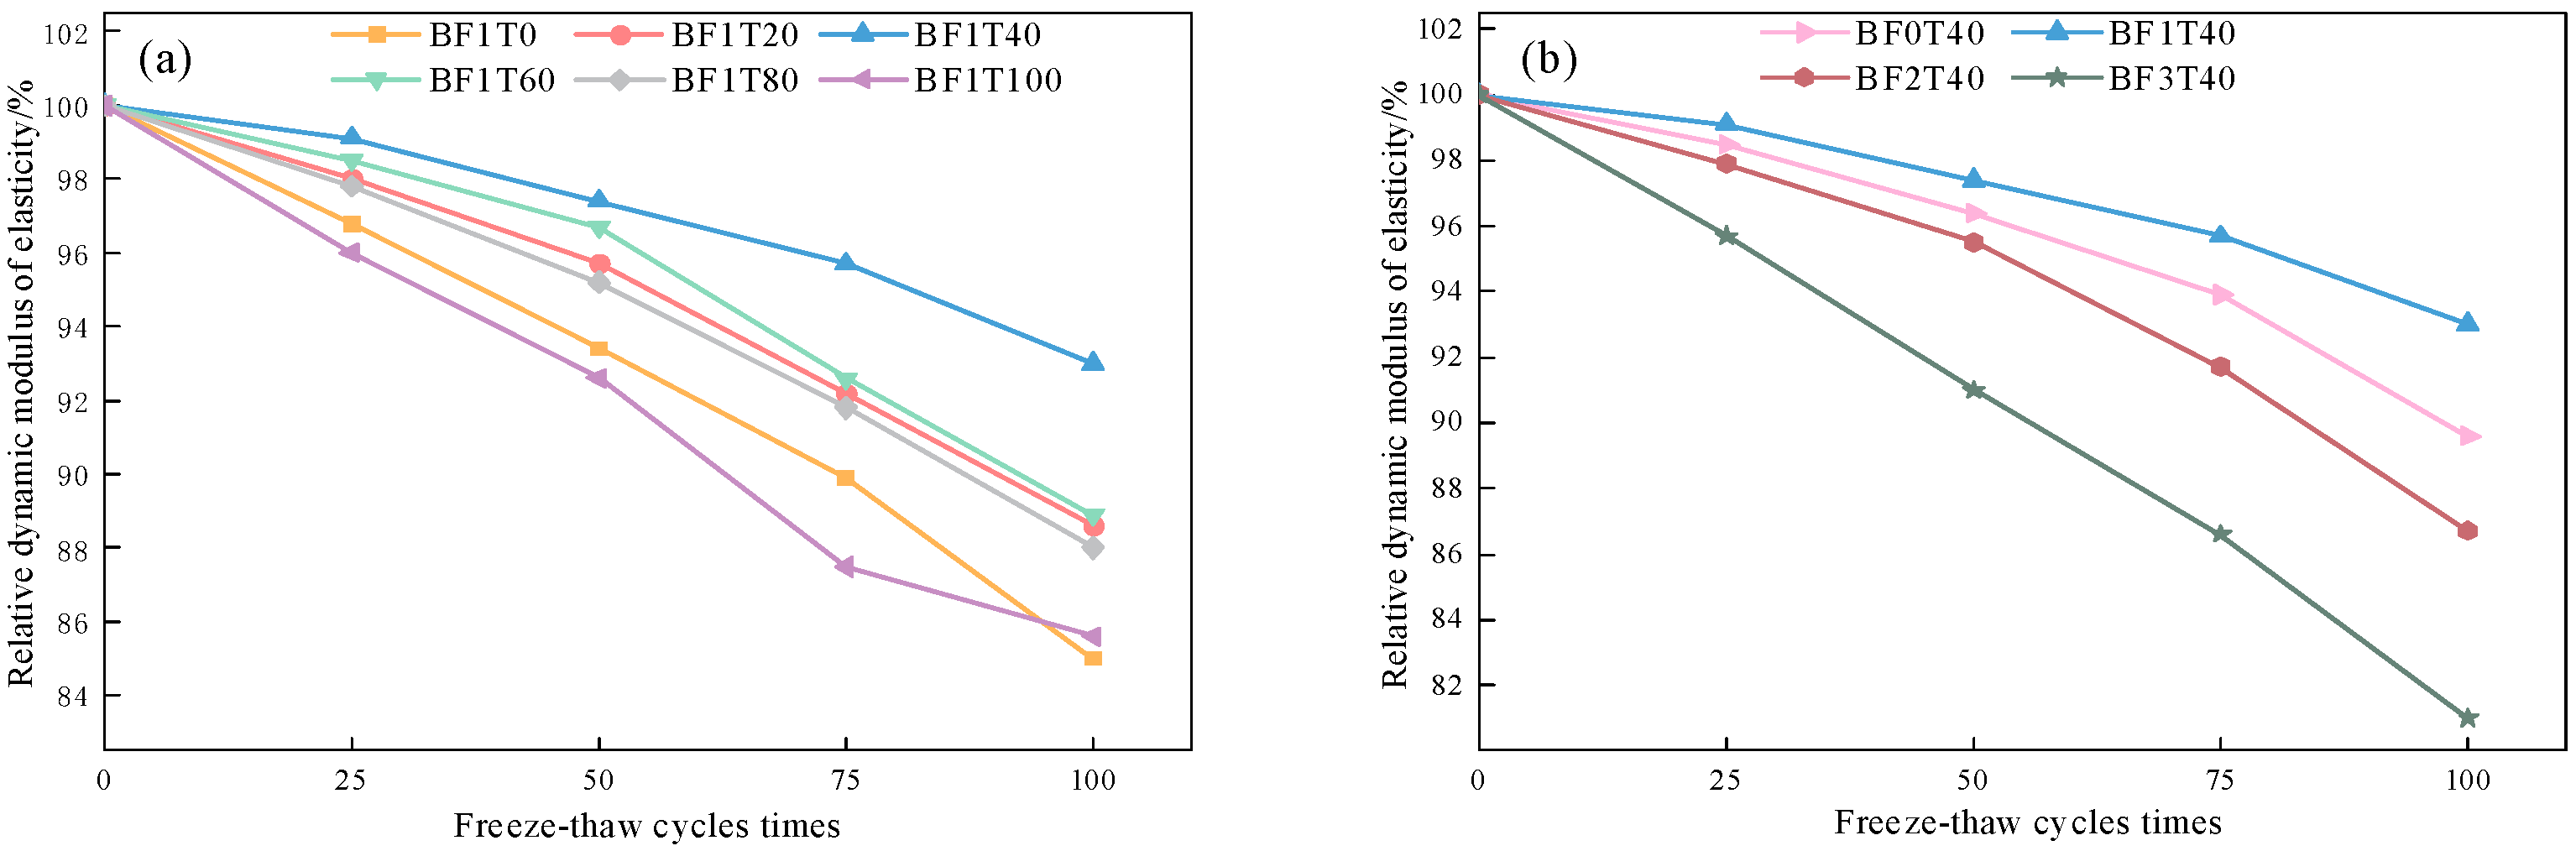
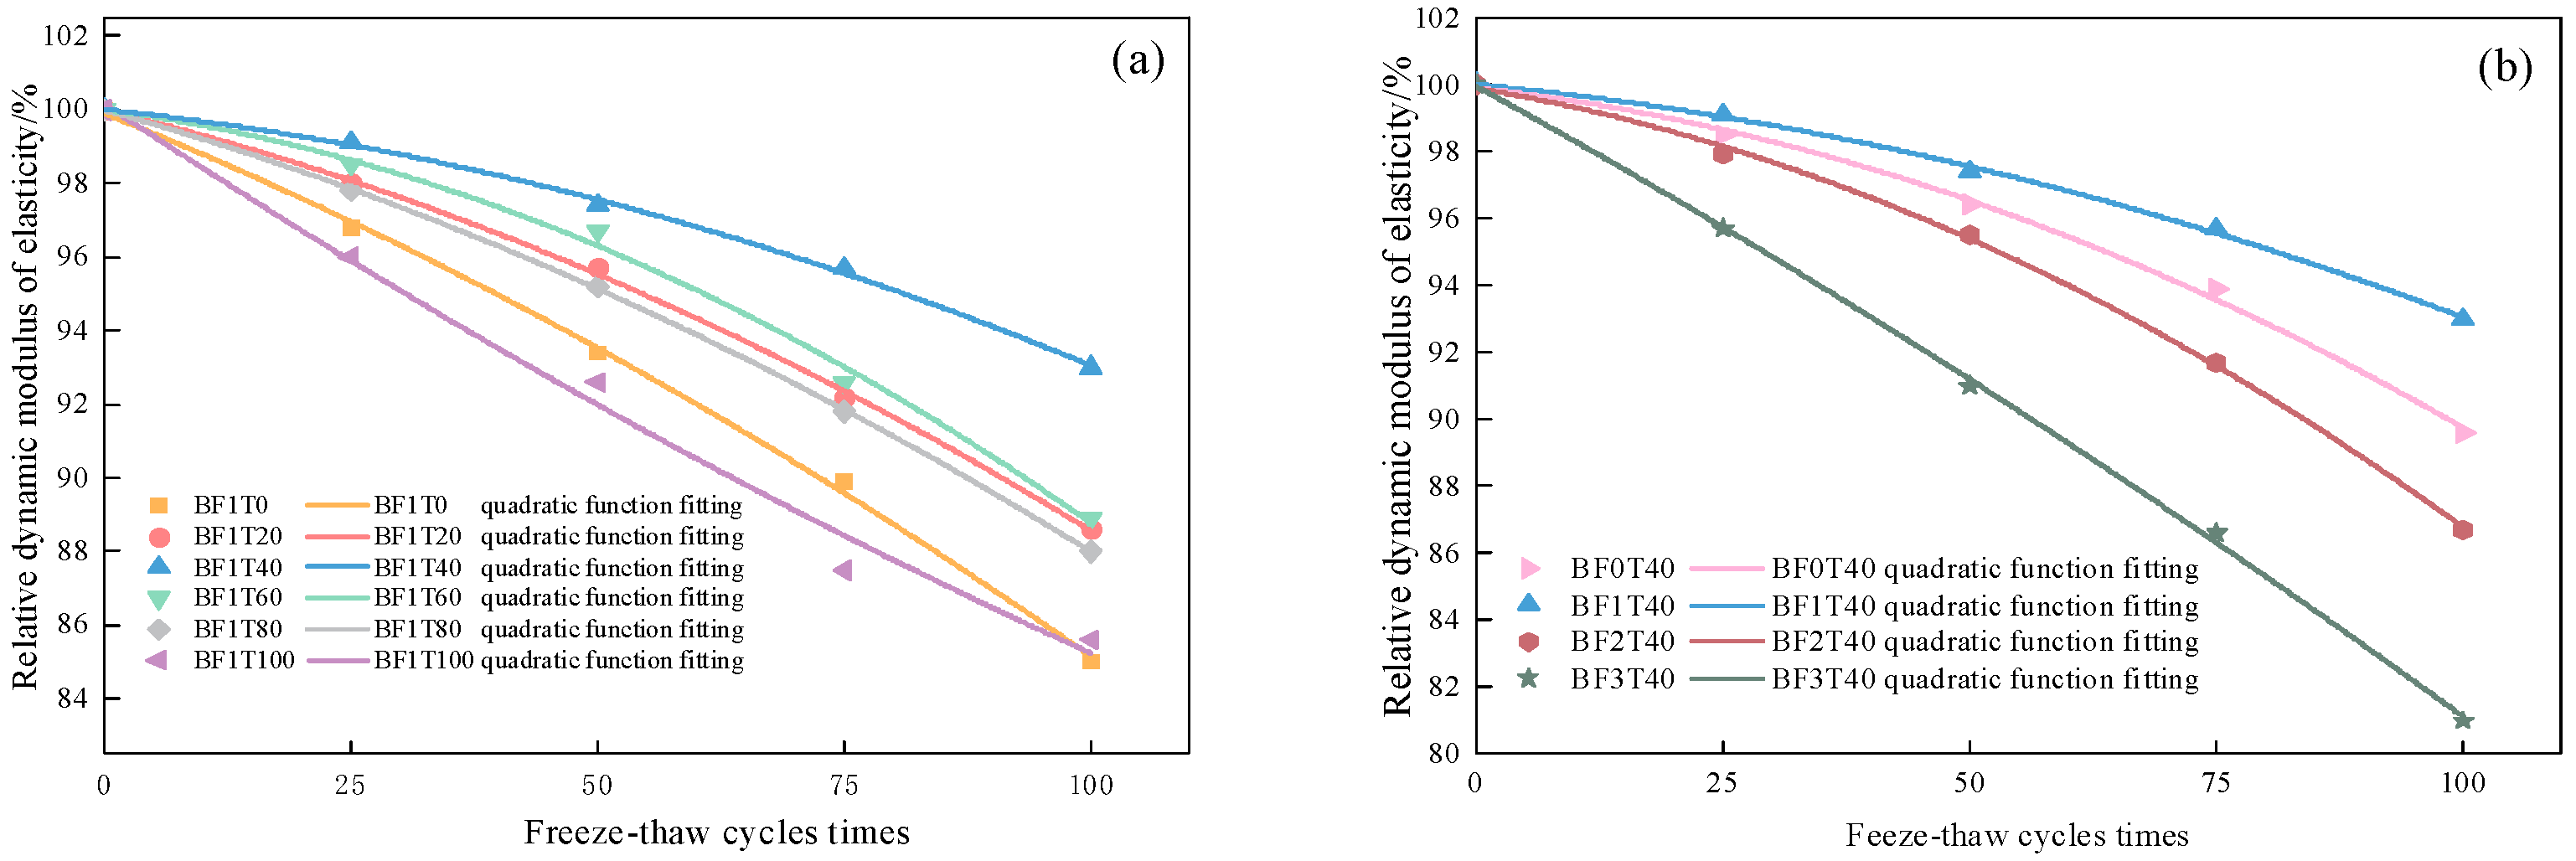
Figure 8 shows the variation law of the relative dynamic elastic modulus of each group of BF-IOT-RAC with the number of freeze–thaw cycles. It can be seen from
Figure 8 that as the number of freeze–thaw cycles increases, the differences in the relative dynamic elastic modulus of each group of concrete become larger and larger. This is because the freeze–thaw damage of concrete progresses gradually from the surface to the inside, and mainly the surface concrete is damaged in the early stage of freeze–thaw cycles. In general, an excessively high porosity will make the structure loose, increase the permeability, and have a negative impact on the frost resistance of concrete. When the replacement rate of IOTs is appropriate, the IOT filling effect can make the interior of BF-IOT-RAC become denser and reduce the internal pores. As can be seen from
Figure 8a, during the entire freeze–thaw cycle period, BF1T40 has the highest relative dynamic elastic modulus and the smallest damage amplitude. The relative dynamic elastic modulus of BF1T40 is 93% at 100 freeze–thaw cycles. Although the fine particles of IOTs have a certain filling effect on BF-IOT-RAC, the bonding performance between them and the coarse aggregates is relatively poor. When the replacement rate of IOTs is relatively large, the relative dynamic elastic modulus becomes smaller after freeze–thaw cycles.
BF has good compatibility with concrete. The three-dimensional network structure of the fiber plays a bridging role in the concrete, increases the integrity of the structure, and delays the generation and development of cracks. When BF-IOT-RAC experiences freeze–thaw damage, the three-dimensionally randomly distributed BF will jointly bear the ice pressure generated by the phase change of internal pore water in the RAC matrix [
33]. It can be seen that BF1T40 in
Figure 8b has the smallest decline in dynamic elastic modulus after freeze–thaw cycles. However, the content of BF does not conform to the greater the better. Excessive BF agglomeration will generate large pores, reduce the compactness of the concrete, and deteriorate IOT frost resistance. This is also the reason why the relative dynamic elastic modulus of BF2T40 and BF3T40 is always lower than that of BF0T40 during the freeze–thaw process.
In summary, compared with the concrete without BF and without IOTs, the appropriate BF content and IOT substitution rate can make the relative dynamic elastic modulus of recycled concrete higher.
3.6. Compressive Strength of BF-IOT-RAC Freeze-Thaw Cycle Test
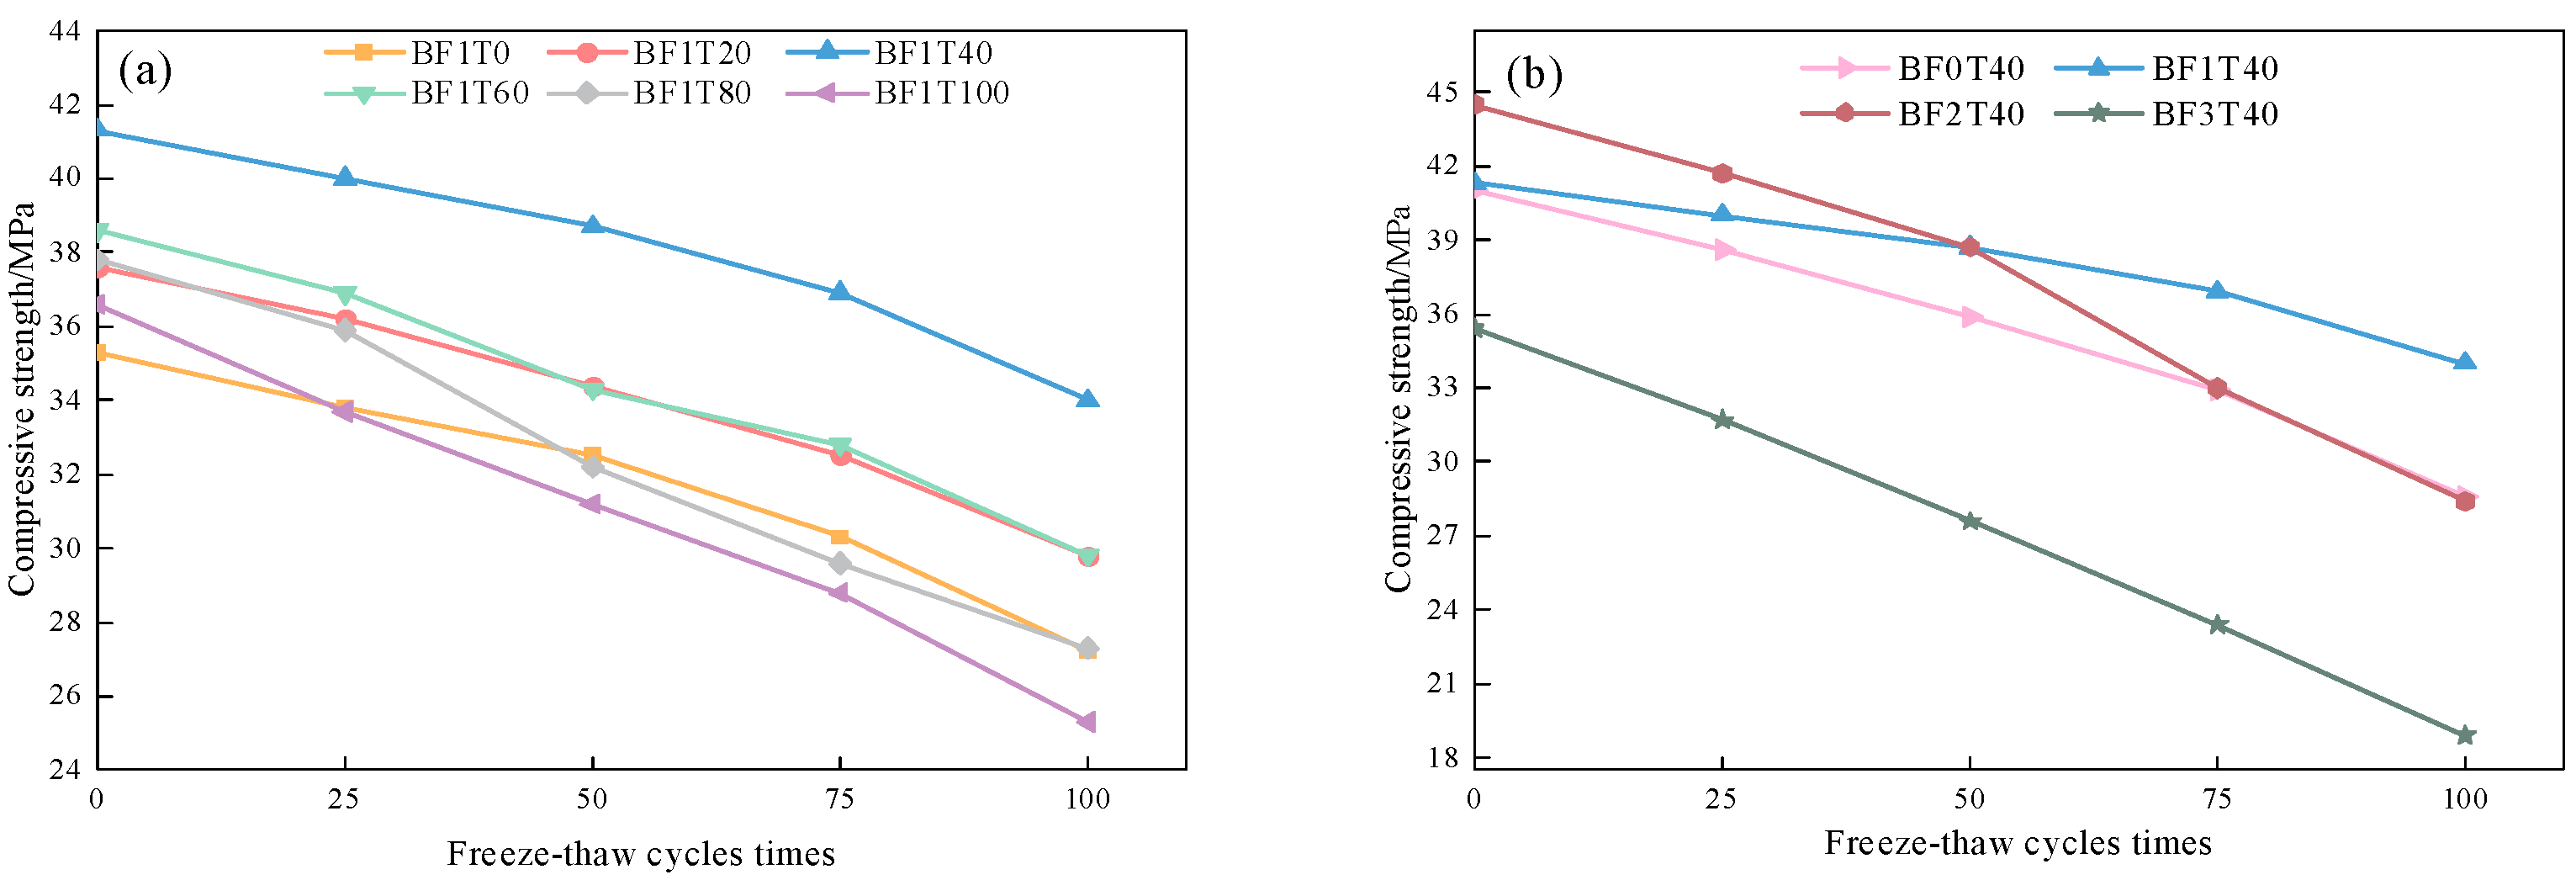
It can be seen from
Figure 9 that under the condition of freeze–thaw cycles, the interior of the concrete is continuously deteriorated, the structure becomes loose, and the compressive strength of the concrete continuously decreases as the number of freeze–thaw cycles increases. As shown in
Figure 9a, before the freeze–thaw cycles are carried out, the compressive strength of RAC with IOTs incorporated is greater than that of RAC without IOTs incorporated. On the one hand, this benefits from the filling effect of the finer particles of IOTs; on the other hand, the “pozzolanic activity” of IOTs can promote the secondary hydration reaction in BF-IOT-RAC, accelerate the formation of hydration products, and improve the compressive strength of recycled concrete. As shown in
Figure 9a, the compressive strength curve of BF1T40 is always the highest. After experiencing 100 freeze–thaw cycles, the compressive strength is 34 Mpa, a 20% higher compressive strength than that of recycled concrete without IOTs. When the IOT replacement rate is 100%, although the initial compressive strength is greater than that of BF1T0 without IOTs incorporated, the compressive strength is already lower than that of BF1T0 after 25 freeze–thaw cycles. After experiencing 100 freeze–thaw cycles, the compressive strength of BF1T100 is 1.9 MPa lower than that of BF1T0, and the compressive strength of RAC with an IOT replacement rate of 80% is only 0.1 MPa higher than that of RAC without IOTs incorporated. It can be seen that when the IOT replacement rate is relatively high, the frost resistance of the concrete is instead inferior to that of the concrete without IOTs incorporated. This is because although certain activity is activated during the crushing and grinding process of IOTs, many microcracks are also generated at the same time. When the IOT replacement rate is relatively high, there are more of these microcracks, which reduces the frost resistance of BF-IOT-RAC.
As shown in
Figure 9b, before the freeze–thaw cycles are carried out, the compressive strength of BF2T40 with a content of 0.2% is the largest. However, after 50 freeze–thaw cycles, the compressive strength becomes lower than that of BF1T40. After experiencing 100 freeze–thaw cycles, the compressive strength of BF2T40 is 15.1 MPa smaller than that of BF1T40. This is because although the BF with a volume content of 0.2% can play a bridging role in the concrete, the fiber itself has a relatively large specific surface area and strong water absorption capacity, and it has a negative impact on the compressive strength of BF-IOT-RAC after experiencing freeze–thaw cycles. As for BF-IOT-RAC with a BF content of 0.3%, due to the excessive fiber content, agglomeration occurs inside the concrete, resulting in the formation of large pores. Moreover, the freezing of the pore water in these pores further weakens the bonding performance of IOTs. Due to multiple factors, after 100 freeze–thaw cycles, the compressive strength of BF3T40 is only 18.9 MPa. During the whole freeze–thaw cycle, the compressive strength of BF1T40 is higher than that of recycled concrete without basalt fiber, which indicates that the anti-freezing effect of 0.1% BF and a 40% substitution rate of IOTs was due to the recycled concrete of a single material.
6. Conclusions
In this paper, through carbonation and freeze–thaw cycle tests of the two materials acting together within concrete, the effects of these two materials on the carbonation resistance and frost resistance of recycled concrete were investigated. Observations were carried out using a scanning electron microscope. The carbonation depth and the service life under freeze–thaw cycles were predicted. The specific conclusions are as follows:
- (1)
The incorporation of BF and IOTs can improve the carbonation resistance of RAC, but there is an optimal dose. Excessive BF leads to clumping within the matrix and increases porosity; if too many IOTs are used, the ettringite produced by the hydration reaction will decompose into calcite with carbonation, and cracks will appear in large-particle-size IOTs. Therefore, the coupling of the two materials will greatly reduce the carbonation resistance of RAC. When the BF content is 0.1% and the IOT substitution rate is 40%, the carbonation depth is 8.2 mm, the compressive strength is 44.8 MPa, and the carbonation resistance is the best.
- (2)
SEM observations of BF-IOT-RAC showed that the inside of the BF1T40 after carbonation was more solid. BF3T100 cracked due to fiber agglomeration and the presence of large-particle IOTs, resulting in a large number of cracks and pores after carbonation.
- (3)
Both BF and IOTs can improve the frost resistance of BF-IOT-RAC. However, too much BF can cause the matrix to agglomerate, resulting in porosity. As a result, the pore water freezes and loosens the concrete inside. IOTs develop microcracks. A high replacement rate will increase the number of matrix cracks. When these two materials act together on the RAC, they greatly reduce its frost resistance. When the BF content is 0.1% and the IOT substitution rate is 40%, the mass loss is 0.8%, the relative dynamic elastic modulus is 93%, and the compressive strength loss is 7.3 MPa under different freeze–thaw cycles.
- (4)
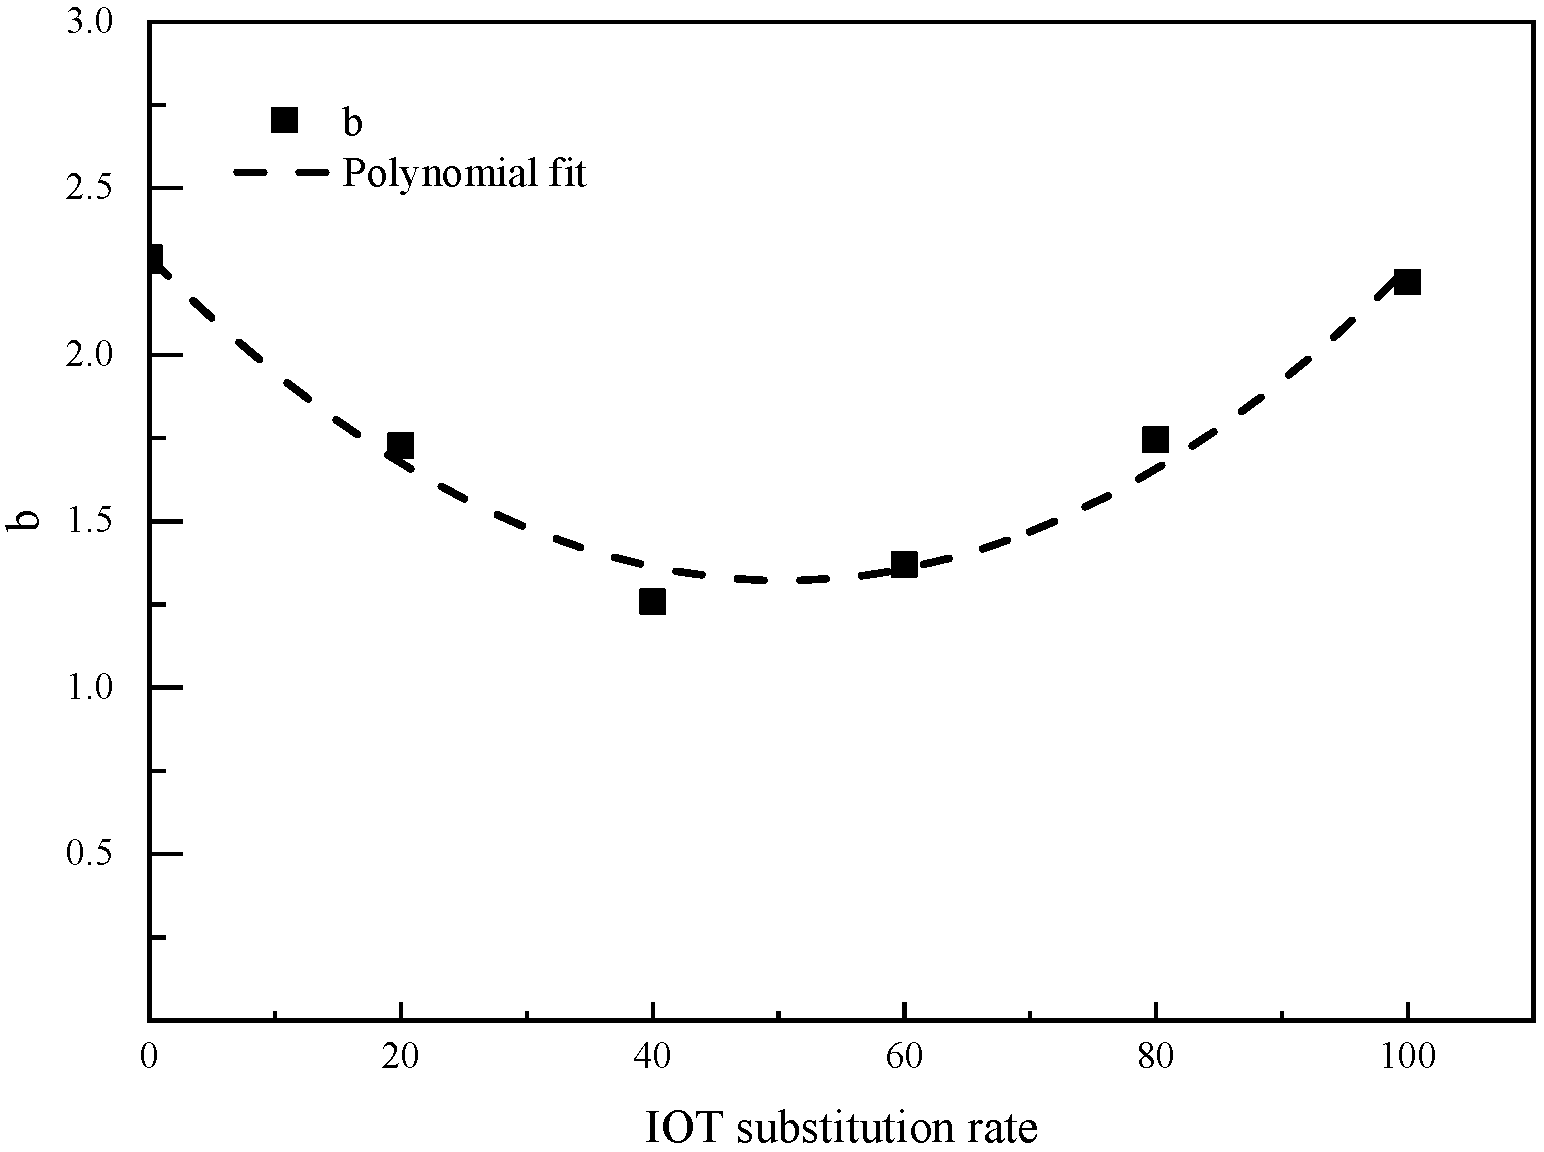
A BF-IOT-RAC carbonation depth prediction model was established, and by comparing it with two other models, we found that the proposed model can better predict the carbonation depth of the target concrete.
- (5)
The dynamic elastic modulus was selected as the key metric to formulate a freeze–thaw damage prediction model for BF-IOT-RAC. Subsequently, the service life of BF-IOT-RAC within the freeze–thaw environment characteristic of the cold northwestern region of China was projected. Through regression analysis, the goodness-of-fit of the model was found to be approximately 0.99, signifying a high degree of accuracy. The predictive results indicate that BF1T40 exhibits the longest service life, with an estimated range of 31.1–31.2 years.
Based on the above experimental data and conclusions, the effects of the combined addition of BF and IOTs on the carbonation resistance and frost resistance of recycled aggregate concrete (RAC) are demonstrated. This study holds certain reference value for the reuse of solid waste and research on the durability of RAC. These findings offer significant application value in enhancing the durability of recycled concrete. The combined use of BF—a new environmentally friendly material—and IOT mining waste significantly expands the applicability of recycled concrete. This approach simultaneously improves solid waste utilization rates and contributes to sustainable construction.
There still exist methodological constraints in this study: laboratory limitations, durability variations among recycled aggregate sources, and region-dependent physicochemical properties of IOTs. These factors represent significant limitations that will be addressed in subsequent research.


