Abstract
Enhancing the thermal performance of building façades is vital for reducing energy demand in hot desert climates, where envelope heat gain increases cooling loads. This study investigates the integration of biomimicry into opaque ventilated façade (OVF) systems as a novel approach to reduce façade surface temperatures. Thirteen bio-inspired façade configurations, modeled after strategies observed in nature, were evaluated using computational fluid dynamics simulations to assess their effectiveness in increasing airflow and reducing inner skin surface temperatures. Results show that all proposed biomimetic solutions outperformed the baseline OVF in terms of thermal performance, with the wide top mound configuration achieving the greatest temperature reduction—up to 5.9 °C below the baseline OVF and 16.4 °C below an unventilated façade. The study introduces an innovative methodology that derives façade design parameters from nature and validates them through simulation. These findings highlight the potential of nature-based solutions to improve building envelope performance in extreme climates.
1. Introduction
In the absence of intervention, energy use for space cooling could more than double by 2050; however, implementing passive design strategies—such as improved insulation, natural ventilation, and solar shading—can play a critical role in curbing demand and relieving stress on electricity systems [1]. Façades serve as a link between the building’s inner spaces and the surrounding environment, which in turn influences the amount of energy that is consumed. In this context, the efficiency of a building’s façade is an important factor to consider. Numerous studies have demonstrated that applying specific architectural concepts to the façades of a building plays a crucial role in regulating the building’s internal temperature.
In hot desert climates, heat gain via the façade can be especially problematic during the summer months, when it can lead to a large rise in the demand for air conditioning systems [2]. This can put a strain on the building’s ability to maintain a comfortable temperature. Various factors, including direct sunlight, ambient temperature, and wind, can cause heat gain through the façade. Research has shown that lowering the exterior façade surface temperature of buildings in hot desert locations significantly lowers the façade inside surface temperature, influencing internal thermal comfort [3]. Therefore, through the reduction in the façade surface temperature, we are able to minimize the requirement for mechanical cooling, which in turn leads to a reduction in the amount of energy that is consumed [4].
In spite of the variety of research and development in façade design strategies to save energy, there is still a lack of attention paid to sustainable bio-inspired solutions that emulate the flora, fauna, or ecosystems. Biota at any location live in perfect harmony without causing adverse impacts on the environment. It is evident from such designs and studies that nature serves as an inspiring and unlimited source of knowledge [5,6,7]. Millions of biota use smart strategies to adapt to their environments, but the number of practical applications emulating them is few. Therefore, it is important to investigate bio-inspired façades to reduce façade surface temperature. Therefore, the proposed façade seeks solutions from nature to protect the building against heat gain.
When considering façade design systems, opaque ventilated façades are among the most effective to consider. The opaque ventilated façade is a double-skin façade that is industrialized and consists of two layers of opaque material with a ventilation channel in between them [8]. An opaque ventilated façade is selected and investigated in this research among all façade solutions as it shows a significant reduction in heat transfer through the building envelope and can save from 20% to 55% of energy consumption in the summer [8,9,10,11]. Furthermore, an opaque ventilated façade system can be applied not only to new construction; it can also be a façade retrofit solution for existing buildings [12].
Researchers have conducted a variety of studies to evaluate the effectiveness of opaque ventilated façades in various climatic regions [8,9,10,11,13,14,15,16,17,18,19,20,21]. Surprisingly, despite significant advancements in opaque ventilated façade research, the potential for integrating biomimicry into these systems remains largely unexplored. Addressing this gap presents an exciting opportunity offering the potential to unlock new levels of efficiency, sustainability, and innovation in the fields of architectural design and building performance. This research will investigate opaque ventilated façade solutions based on bio-inspirations gleaned from nature to effectively lower the façade surface temperature, which in turn leads to a reduction in energy consumption.
2. Literature Review
2.1. Biomimicry in Architecture
In the 1950s, Otto Schmitt coined the term ‘biomimetics’ to name the transfer of nature’s strategies from biology to technology [22]. The term was added to the dictionary for the first time in 1974 as “the study of the formation, structure, or function of biologically produced substances and materials (as enzymes or silk) and biological mechanisms and processes (as protein synthesis or photosynthesis) especially for the purpose of synthesizing similar products by artificial mechanisms which mimic natural ones” [23].
There are many terms related to designs inspired by nature, such as synthetic biology, biodesign, bionic, and biophilia, as defined in Table 1. The most common terms are biomimicry and biomimetics. Some pioneers of the discipline, such as Göran Pohl and Werner Nachtigall, believe that the term biomimicry is not the same as biomimetics. Biomimicry is a mere imitation of nature, while in biomimetics, biological structures and processes are understood along with their comparable technological applications or methods. By contrast, Michael Pawlyn considers biomimicry and biomimetics to be synonymous [6]. The current study will use both terms interchangeably.

Table 1.
Definition of terms.
The ever-increasing demand for sustainable design solutions has driven architects and engineers to explore novel frontiers. Biomimetic designs can be seen in various disciplines, such as architecture, material science, and mechanical and structural engineering [25]. Biomimetic architecture goes beyond simply drawing aesthetic influence from nature. It is a scientific approach that entails a thorough examination of natural structures, materials, and processes, with the goal of converting what is learned into practical and sustainable architecture design [5,6].
All architectural biomimetic designs mimic nature on three levels: organism, behavioral, and ecosystem [26]. These levels are important for selecting the aspect of biology that needs to be mimicked. The organism level refers to the creature itself—flora or fauna—in whole or in part. The behavior level refers to emulating how an organism behaves in its environment. The ecosystem level involves mimicking the whole interconnected processes of an ecosystem. Each of these levels has five more dimensions: form, material, construction, process, and function [26].
Mazzoleni states that the “Skin is a complex organ that performs a multitude of functions; namely, it serves as a link between the body and the environment. Similarly, building envelopes act as interfaces between their inhabitants and external elements” [27]. In architectural design, understanding the similarities between skin and building envelopes is critical. Building envelopes, in the same way that skin protects the body from the environment, play an essential part in ensuring that people are protected from outside factors and that the inside of a building is comfortable.
Biomimetic approaches to constructing building façades have emerged as a potential path for sustainable and smart design solutions. Biomimicry provides a fundamental change in thinking by using biological systems as inspiration to develop building envelopes that are more adaptable and effective. An example of a bio-inspired design that has been inspired by the behavior of an organism is the kinetic façade system of the Thematic Pavilion, South Korea. The pavilion’s envelope design was inspired by the natural dynamic principles that govern the opening and closing of flowers as well as leaf orientations, allowing it to control the amount of sunlight entering the building [28].
Sheikh and Asghar [29] performed research in which they explored the design of a responsive façade that was inspired by the leaf of the Oxalis oregana plant. The purpose of this study was to address the issue of reducing energy consumption in buildings that are located in hot and humid climates. The façade’s goal is to reduce solar heat gain while ensuring that users remain visually comfortable. This novel façade design provides a solution for balancing energy consumption and user comfort in high-rise commercial buildings.
In a hot desert climate, many recent studies have mimicked nature to create high-performance façades [30,31,32,33]. Although opaque ventilated façades have been studied, their biomimetic adaptation remains largely unexplored. This represents a significant gap in the literature, particularly regarding the integration of biomimicry into opaque ventilated façade designs.
2.2. Frameworks and Methodology for Bio-Inspiration
An overview of the most widely used biomimetic frameworks and methodologies is provided in this section. Numerous studies have been published over the course of the past twenty years in an effort to determine techniques and frameworks that may be utilized in the process of designing and inventing bio-inspired products and buildings [34]. In spite of the fact that there are a variety of methodologies and frameworks, the majority of biomimetic designers and researchers are in agreement that there are two primary approaches to the development of biomimetic products. These approaches are the bottom-up (solution-based) and top-down (problem-based) approaches [5,26,35,36,37,38,39]. The bottom-up approach, also called the solution-based approach, begins with nature observation by biologists or ecologists who identify the interesting biological properties that lead to technical design. The top-down approach, also known as the problem-based approach, starts with an engineering problem and then seeks solutions from nature.
3. Methodology
Smart and novel approaches are necessary for the development of biomimetic opaque ventilated façade solutions that may effectively reduce façade surface temperature in hot desert regions. This study represents a novel methodology within the current state of the art, developed from the biomimetic top-down approach from the literature to create bio-inspired opaque ventilated façade solutions. To meet the research aim, the study was divided into three main phases, as seen in Figure 1.

Figure 1.
Research design and methodology.
Phase 1: Baseline opaque ventilated façade
This phase is based on the authors’ previous study, which aimed to systematically create a prototype to explore and determine the most influential design parameters impacting the performance of opaque ventilated façades in hot desert climates [40]. The insights gained from the baseline opaque ventilated façade study served as a crucial starting point for subsequent phases of this study.
Phase 2: Biological phase
This phase of the study entails a thorough exploration of biological solutions aimed at addressing the technical challenges identified in the baseline opaque ventilated façade phase. Through an extensive review of literature, various biological features are analyzed to understand their potential applicability in enhancing the performance of the opaque ventilated façade system. The objective is to uncover insights that could inform the development of innovative strategies leveraging nature-inspired solutions to improve the efficiency and sustainability of the opaque ventilated façade in a hot desert climate.
Phase 3: Concept and Sensitivity analysis
During this phase, bio-inspired features that have the potential to reduce opaque ventilated façade temperatures are extensively examined. These features are imitated and implemented in a test cell comparable to the baseline façade. Each bio-inspired solution undergoes individual testing to assess its effectiveness in addressing the technical challenge highlighted during the baseline façade phase. The behavior of every bio-inspired solution was evaluated by the implementation of computational fluid dynamic (CFD) simulations.
Regarding the CFD setup, the present study followed the exact process from the authors’ previous study [40]. Ansys Fluent was selected to conduct the CFD simulation in this research; simulations were performed using Reynolds-Averaged Navier–Stokes (RANS) equations at steady state mode; for the turbulence model, the RNG k–ε turbulence model was selected and the enhanced wall treatment was enabled; with regard to the radiation model, the DO radiation model was selected. During the concept and sensitivity analysis phase, an identical test cell of the baseline façade was used with similar boundary conditions. Boundary conditions were set, and solution tasks were prepared with appropriate convergence criteria, ensuring consistency in temperature and airflow velocity during simulation. All setup details are identical to those in the authors’ previous study and can be referred to for further information [40].
Mid-August is the hottest time of the year, so this date was selected accordingly [41]. The opaque ventilated façade was set to face east to simulate the highest temperature a façade can reach. Performing the CFD simulation for the building’s façade during the peak heat period in Riyadh is crucial for several reasons. First, designing for the worst-case scenario ensures that the façade will perform efficiently even under the most extreme conditions. This not only enhances the resilience of the building but also provides a margin of safety for unexpected temperature spikes. Second, the warmest time indicates the maximum thermal stress that the façade will experience. Simulating over this time period allows for the evaluation of maximal thermal loads and comprehension of how the façade design will function when subjected to excessive heat. Third, by running CFD simulations throughout this time, it is possible to pinpoint the locations with the greatest heat gains and adjust the design of the opaque ventilated façade to reduce them. This has the potential to result in large reductions in energy usage as well as operational expenses, particularly considering that Riyadh requires cooling equipment for almost eight months out of the year [41].
4. Baseline Façade Phase
A comprehensive study to define the baseline opaque ventilated façade in a hot arid climate [40]. The study progressed to the development of a baseline opaque ventilated façade tailored specifically for hot desert climates. This study involved the creation of a prototype to systematically explore and determine the most influential design parameters affecting the performance of such a façade system. An in-depth examination was conducted of different design parameters affecting the opaque ventilated façade, which were the outer skin materials, joint configuration, air cavity width, wind direction and velocity, and solar exposure. The study yielded some significant findings, as follows:
- The inner skin surface and the average air temperature within the cavity were reduced more effectively by selecting the autoclaved-aerated concrete panel for the outer skin. Furthermore, as the airflow velocity inside the cavity drops, the outer skin material type parameter becomes more effective.
- Closed-joint opaque ventilated façades reduced inner skin surface temperature more than open-joint ones because they allowed faster air circulation.
- In the CFD simulation of four cavity widths, the impact of the 10 and 20 cm cavities on the average inner skin surface temperature was nearly identical. Meanwhile, the 5 cm and 30 cm cavities cause a higher average inner skin surface temperature.
- Regardless of wind speed, the lowest average inner skin surface temperature can be achieved when the wind is facing a ventilated façade.
- When the wind velocity increases during the hours when the façade is fully exposed to sunlight, the inner skin heat reduction is more noticeable.
The following list presents the maximum average inner skin surface temperature reduction that was attained, arranged from highest to lowest, based on the CFD results of all the tested parameters:
- Increasing the airflow velocity inside the cavity can lead to a 6.0 °C reduction in the average inner skin surface temperature.
- Shading the opaque ventilated façade can lead to a 4.1 °C reduction in the average inner skin surface temperature.
- Changing the opaque ventilated façade’s outer skin material can lead to a 3.3 °C reduction in the average inner skin surface temperature.
- Closing the opaque ventilated façade’s joint configuration can lead to a 2.1 °C reduction in the average inner skin surface temperature.
- Adjusting the cavity width can lead to a 0.9 °C reduction in the average inner skin surface temperature.
As a result of the study, it has been found that the most influential design parameter was increasing the airflow velocity inside the cavity, so in the current study, it became the technical challenge to reduce the inner skin surface temperature, which in turn leads to a reduction in energy consumption.
5. The Biological Phase
This phase explores biological solutions in order to achieve a similar function to the identified technical challenge in the baseline façade phase. This phase’s purpose is to reveal insights that might influence the creation of novel techniques that leverage nature-inspired solutions to increase the efficiency and sustainability of the opaque ventilated façade in a hot desert climate. A comprehensive literature analysis is carried out to explore and comprehend the potential of different biological features to solve the technical challenge of the opaque ventilated façade.
It has been found during the baseline façade phase that the most influential design parameter was increasing the airflow velocity inside the cavity, which then became the technical challenge to reduce the inner skin surface temperature, which in turn leads to a reduction in energy consumption. For millions of years, organisms have shown a variety of successful examples of dealing with air movement. A large number of organisms were explored and reviewed from biological books, academic journals, articles, websites, and documentary films. Many of them have shown great adaptation to their environment, and many lessons can be learnt from each of them.
Sorting out the features and mechanisms of the relevant organisms with the identified challenges requires a deep contemplation of nature. Since increasing the airflow velocity inside the cavity reduces the inner skin surface temperature, nature’s mechanisms with features of airflow utilization were investigated. In order to explore the biological solutions to the identified technical challenge, organisms that look promising to solve this challenge are listed in Table 2.

Table 2.
The organisms that correspond to the identified challenges.
Rodent Burrows
Rodent burrows play a significant role in rodents’ adaptation to the environment and can be considered an “extended organism” [47]. Burrows, especially in hot, arid regions, provide shelter from extreme temperatures and predators. Furthermore, they are used for hibernating, food storage, and nesting [48]. Air movement through the tunnels of rodents’ burrows has been extensively studied. Biologists have found that air circulation through burrows is caused by wind-induced pressure differences and steady or quasi-steady gradients in partial pressure or air density [49]. In Turner and Pinshow’s study [49], additional dimensions of gas exchange in burrows were examined. The study explored and tested two mechanisms, pendelluft flow and eddy capture, and the authors believe there are even more possibilities for novel mechanisms of burrow ventilation to be explored [49].
Sundevall’s jird (Meriones crassus) is one of the most common rodents that live in hot deserts across North Africa to Pakistan [43]. The multi-entranced Sundevall’s jird burrows are ventilated even at low wind speeds [50]. The banner-tailed kangaroo rat (Dipodomys spectabilis), the cavy (Microcavia australis), and the European mole (Talpa europaea) are also species of rodent that dig their burrows with multi-entrances and take advantage of wind-induced ventilation [42,44,45].
The black-tailed prairie dog is a burrow maker whose tunnels can be found across North America. Even though these creatures do not live in hot, dry regions, they show a great mechanism of utilizing wind power. The burrow of the black-tailed prairie dog has entrances that are at opposite ends and surrounded by mounds of different heights. When the wind blows over the mounds, air flows into the lower entrances of the burrow and exits through the higher entrance (Vogel et al., 1973) [46].
Two physical principles, Bernoulli’s principle and “viscous sucking”, describe the phenomenon of air circulation through these burrows. “Bernoulli’s principle describes pressure differences generated by variations in velocity along a streamline,” while viscous sucking “depends on the resistance of real fluids to rapid shear rates and the consequent attraction of stagnant fluid by adjacent rapidly moving fluid” [46]. Therefore, a change in air pressure gives the higher burrow’s entrance greater air velocity, which in turn decreases the air pressure and allows the air to draw from the lower entrance (which has higher pressure) towards the higher entrance.
Vogel, Ellington, and Kilgore [46] conducted an experiment to measure the passive ventilation in prairie dogs’ burrows. They filled a 20-m-long burrow with smoke to measure the direction the smoke moved whenever a local breeze occurred and how long it took until the smoke was completely discharged from the burrow. They found that the smoke was released from the higher entrance of the burrow, and that a breeze just over 1 mph was required for the air to exchange completely in ten minutes [46].
In addition, throughout the experimental investigation, the authors found that “a sharp rim on a mound improves its performance as an exit hole over a similar mound with a rounded top” [46]: the raised crater mound accelerates the wind velocity, leading to pressure differences and faster flow rates. Furthermore, the airflow through the Burrows performs better when their diameter expands as they meet free streams.
Two bio-inspired features that might lead to an effective solution for enhancing the airflow velocity inside the cavity of the opaque ventilated façade should be investigated in the subsequent phase. Analysis of the wind-induced flow mechanism through rodent burrows has led to this determination. First, the raised air outlet in the burrow entrance of the black-tailed prairie dog, which looks similar to a crater mound, increases wind velocity. Second, the multi-entranced feature present in many rodents’ burrow systems enables ventilation of the tunnel, even during low wind speeds.
6. Concept and Sensitivity Analysis
The design of the opaque ventilated façade is based on biomimicry, drawing inspiration from the features of selected creatures during the biological phase. During this phase, the rodent burrows’ features that show potential for reducing heat gain in the opaque ventilated façade were carefully analyzed. These features were then mimicked and implemented in a test cell similar to the baseline façade. Each bio-inspired solution was tested independently to see how successful it is in increasing the airflow velocity inside the cavity, which reduces the inner skin surface temperature, as shown in Figure 2. The proposed design must fulfil certain fundamental goals. First, the opaque ventilated façade should be a passive design that requires zero energy. Second, it should achieve a lower façade surface temperature than both the baseline façade and an unventilated façade during the hottest time of the year.
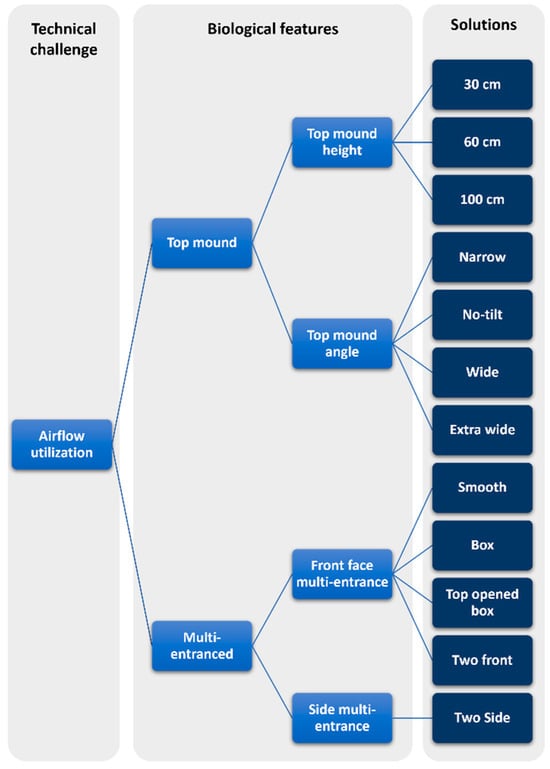
Figure 2.
Bio-inspired solutions mimic process hierarchy.
6.1. Top Mound Feature
The first solution emulates the wind-induced flow mechanism through rodent burrows. Like the black-tailed prairie dog’s burrow entrances, the opaque ventilated façade has a cavity with two openings at different heights to allow the air to circulate. One opening is on the bottom as an air inlet, and the second one is on top as an outlet. When a breeze occurs, the raised top hole that mimics the high entrance shape of the black-tailed prairie dog’s crater mound, as seen in Figure 3, accelerates the wind velocity when it passes over it and allows the air to draw faster from the bottom entrance.
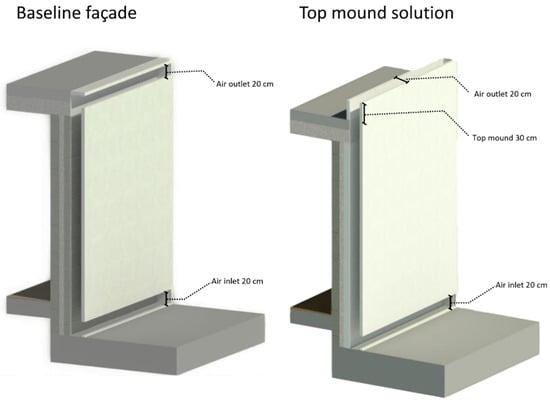
Figure 3.
The raised top hole that mimics the high entrance shape of the black-tailed prairie dog’s mound compared to the baseline façade.
The results of the simulations for an autoclaved-aerated concrete panel outer skin are presented in Table 3. The simulation was performed at three different times of the day and under three different wind speeds. The shaded top mound opaque ventilated façade solution exhibited significantly lower average inner skin surface temperature compared to the sun-exposed façade, similar to the baseline façade. Under a calm 5 km/h breeze, the variation in average inner skin surface temperature was 2.5 °C between 11:00 a.m. and 4:00 p.m. scenarios. This difference was reduced to 1.7 °C when the wind speed was increased to 10 km/h, and further decreased to 1.1 °C when the wind speed reached 20 km/h.

Table 3.
The CFD results of the top mound solution.
The results show that the mimicked crater mound solution of the black-tailed prairie dog accelerates the average air velocity within the cavity by up to 350% more than the baseline façade. In other words, the ventilated cavity of the baseline façade reduces the average airflow inside the cavity compared to the wind velocity by about 70%, while the biomimetic top mound solution only decreases the airflow by about 12% compared to the wind speed. For example, during a 10 km/h light wind, the average air velocity inside the cavity of the baseline façade was approximately 2.7 km/h, whereas the biomimetic top mound solution experienced an average air velocity of approximately 8.8 km/h. This resulted in a significant decrease in the average air temperature inside the cavity for this solution, which in turn led to a lower average inner skin surface temperature, as illustrated in Figure 4 and Figure 5.
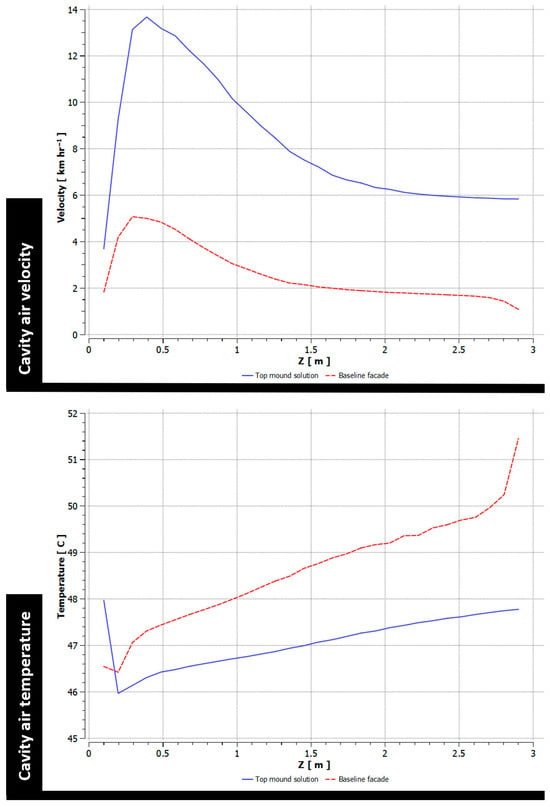
Figure 4.
The air velocity and temperature inside the cavities of the baseline façade and the top mound solution.
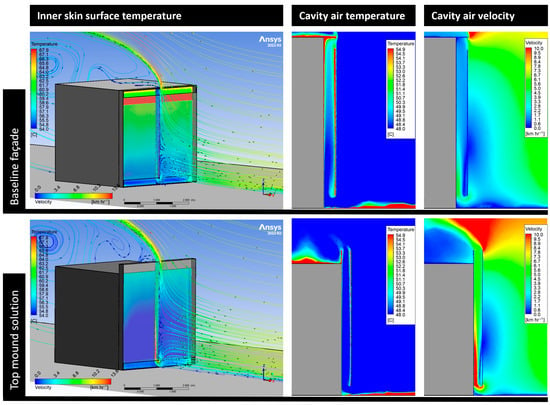
Figure 5.
The baseline façade and the top mound solution comparison during a 10 km/h light wind.
When comparing the results of this solution with the baseline façade and an unventilated façade, several findings can be noticed. Figure 6 displays the effect of 10 km/h light windward on the inner skin surface temperature of these façades when they were fully exposed to sunlight. The average inner skin surface temperature of the opaque ventilated façade with the top mound solution, when it is fully exposed to solar radiation and during windward, was 54.9 °C, which is 5.4 °C lower than the baseline façade and 15.9 °C lower than the unventilated façade, as seen in Table 4. The difference between the top mound solution and the baseline façade, when they were fully shaded, decreased to 3.6 °C, and only 0.5 °C between this biomimetic top mound solution and the unventilated façade.
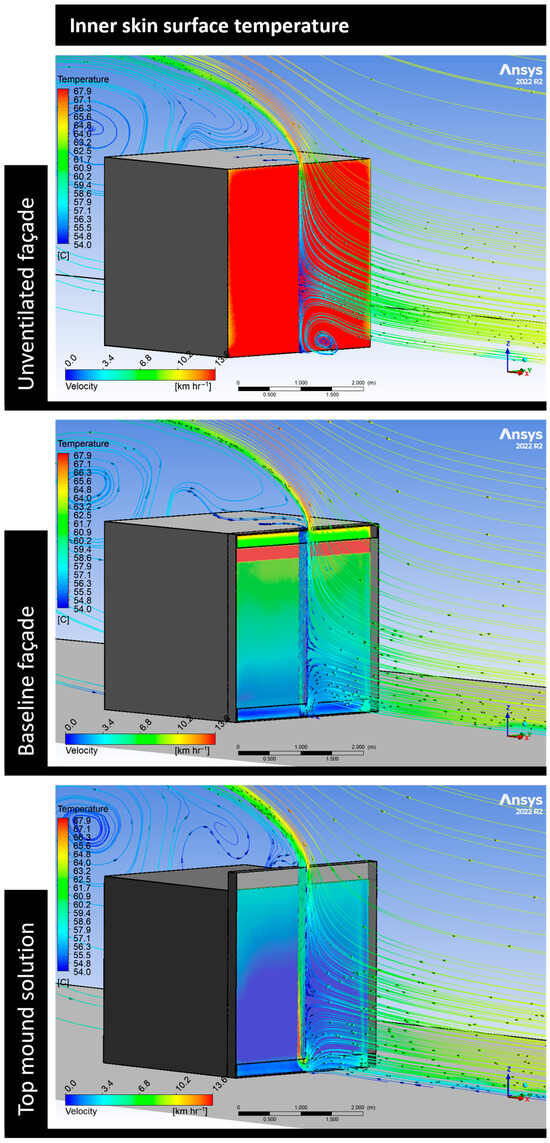
Figure 6.
Comparison of the inner skin surface temperature and the cavity performance of the façades.

Table 4.
Comparison of the unventilated façade, baseline façade with the top mound solution.
Table 4 demonstrates that, in the majority of situations, the top mound solution had superior performance in decreasing the average inner skin surface temperature, with only a few exceptions. The baseline façade performance was better only during the leeward wind, when the façades were partially shaded, with 0.6 °C lower average temperature on the inner skin surface than the top mound solution. Additionally, the average inner skin temperature in the unventilated façade was lower than the top mound solution when they were fully shaded and during leeward and side winds, with a maximum difference of 3.3 °C.
The 30 cm raised top outlet that mimics the high entrance shape of the black-tailed prairie dog’s mounds showed an effective solution to reduce the inner skin surface temperature; however, the height of a real crater mound is not always 30 cm; it can range from 30 cm to 100 cm [46]. Therefore, further simulations for 60 cm and 100 cm mound heights were conducted to discover the effect of the height parameter on the thermal performance of the top mound solution, as seen in Figure 7. In addition to the mound height, Vogel, Ellington, and Kilgore [46] discovered that a sharp rim on a mound and the expansion of the burrow diameter as it meets the free stream improve its performance. As a result, narrow, wide, and extra-wide angles of the top mound width were examined to find the impact of the expansion of the cavity width as it meets the free stream, as shown in Figure 7.
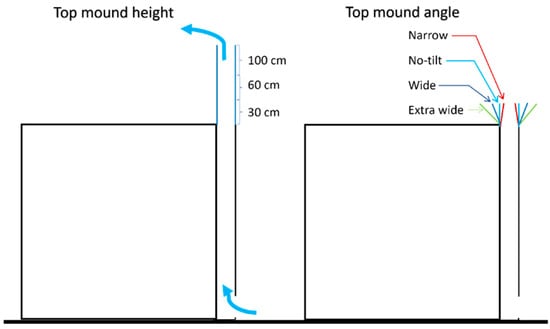
Figure 7.
The tested heights and angles of the biomimetic top mound solution.
For the top mound height solutions, three CFD simulations were conducted for each height. For the top mound angle solutions, four CFD simulations were performed with 30 cm high mounds. All these top mound solution options were tested only during a 10 km/h light windward as an indicator of the impact of these changes on their performance. It is not necessary to simulate every option under all scenarios in this study, as the purpose of these simulations is to determine whether changes in the top mound solution affect its performance, thereby defining them as input parameters for a future optimization study.
6.1.1. Top Mound Height
Increasing the top mound height is important to be tested to determine the optimal design. Figure 8 displays the CFD simulation results of 30, 60, and 100 cm mound heights under light windward conditions when they were fully exposed to sunlight. The results indicate that an increase in mound height leads to an increase in the average air velocity inside the cavity, which in turn causes a decrease in the average temperature of the inner skin surface. For example, the difference in the average air velocity inside the cavity between the 30 cm and 100 cm mounds was 0.8 km/h and 0.5 °C in the average inner skin surface temperature, as shown in Table 5. It can be noticed from the results that the thermal performance difference is not considerable, especially when it is compared against the buildability and the material quantity required to build it, which will be discussed in more detail in a future optimization study. Accordingly, the next step, which investigates the top mound angles, was carried out with a mound height of 30 cm.
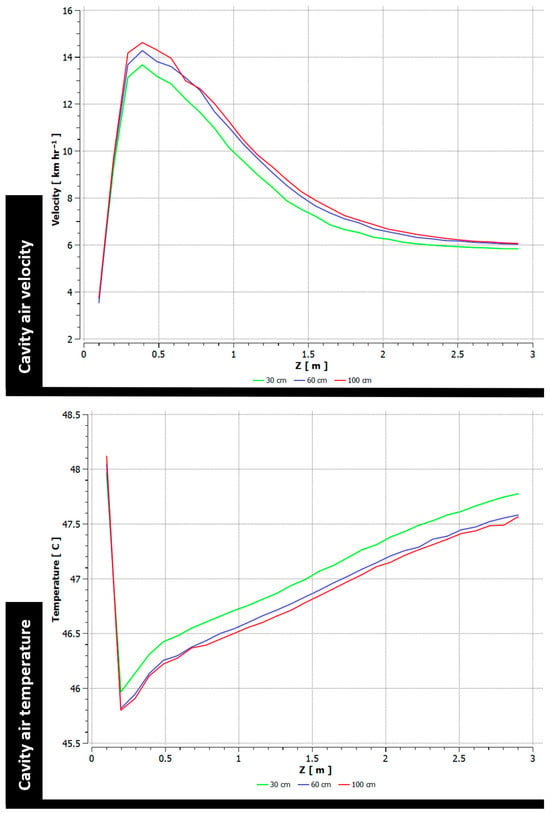
Figure 8.
The air velocity and temperature inside the cavities of the three top mound height solutions.

Table 5.
CFD simulation results for the top mound height solutions.
6.1.2. Top Mound Angles
The burrow performance of the black-tailed prairie dogs is improved when the burrow diameter increases upon meeting the free stream, so the proposed biomimetic top mound is expanded to wide and extra-wide angles. A narrow-angle investigation was also conducted to determine whether this bio-inspired feature is applicable to the opaque ventilated façade, Table 6 illustrating the CFD simulation results of all tested top mound angles.

Table 6.
CFD simulation results for the top mound angle solutions.
The findings confirm that, as the morphological feature of the prairie dog’s mound, the wider outlet of the opaque ventilated façade accelerates the airflow velocity through the cavity, while the narrow outlet reduces the airflow speed, as displayed in Figure 9 and Figure 10. Compared to the no-tilt mound, whose average air velocity inside the cavity was 8.8 km/h, the wide mound boosted the airflow speed to 10.6 km/h, which in turn reduced the average inner skin surface temperature by 0.5 °C. Nonetheless, the extra-wide outlet tended to perform less effectively than the wide outlet.
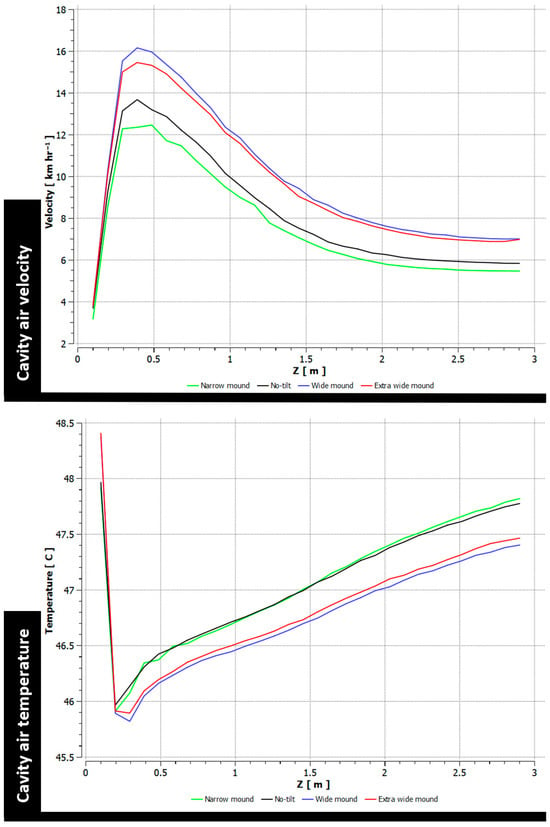
Figure 9.
The air velocity and temperature inside the cavities of the four top mound angle solutions.
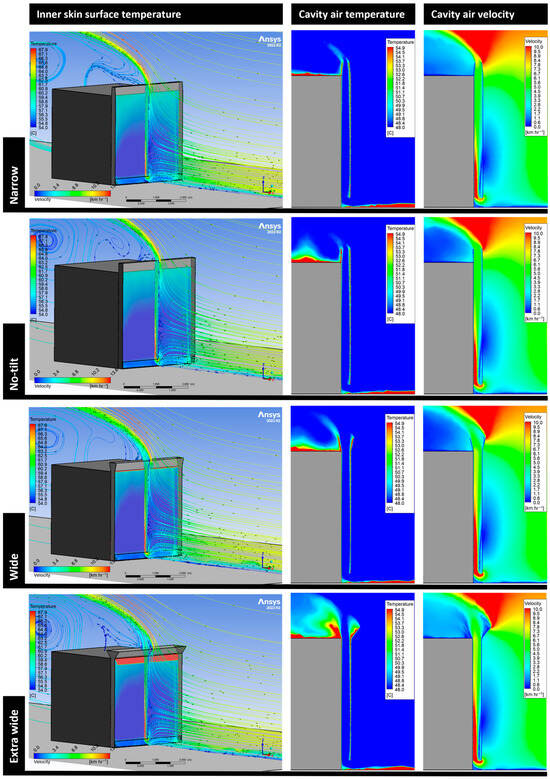
Figure 10.
Comparison of the inner skin surface temperature and the cavity performance of the four top mound angle solutions.
6.2. Multi-Entranced Feature
The multi-entranced feature can be found in many rodents’ burrow systems, which allow the burrow to be ventilated even at low wind speeds. The front and side faces of the opaque ventilated façade were examined for potential aperture designs because rodents often build their burrow entrances in various places and positions. In order to create multi-entrances without allowing solar radiation to reach the inner skin surface, extra surfaces that shade the apertures should be made. The number of design possibilities that can be made is uncountable, so only three designs in the front face and three in the side faces were investigated to find whether the multi-entranced solution is effective. All multi-entranced solutions were created by using the baseline façade as a base and modifying it solely by adding extra apertures to the outer skin.
6.2.1. Front Face Multi-Entranced Solution
In the baseline façade, the airflow streamlines in the first meter from the ground head down to the bottom inlet, as can be seen in Figure 11. The remainder of the airflow streamlines move adjacent to the outer skin to move towards the top of the building. Consequently, several design tweaks have been investigated to make the most of airflow streamlines entering the cavity as they go up and adjacent to the outer skin. The first design idea involves incorporating an additional entrance in the middle, enabling the airflow that travels upwards and alongside the outer skin to smoothly access the cavity, as illustrated in Figure 12.
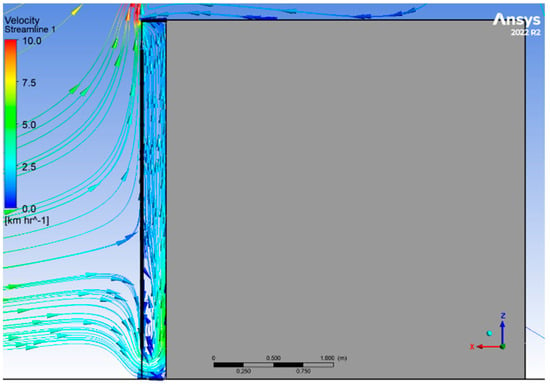
Figure 11.
The streamlines pattern in the baseline façade.
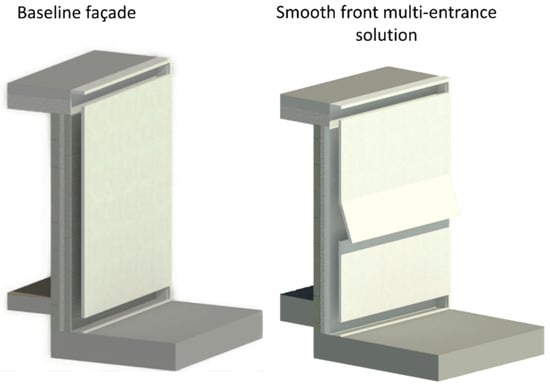
Figure 12.
Smooth front multi-entrance solution compared to the baseline façade.
The CFD simulation results of this smooth front entrance solution, which are illustrated in Table 7, show some interesting findings. As can be seen in Figure 13, the airflow velocity through the lower part of the cavity until the additional entrance declined to 1.6 km/h, compared to the baseline façade, which was 2 km/h. As a result, the temperature of the lower area of the inner skin surface in the baseline façade was lower than that of this smooth front multi-entrance solution, as can be seen in Figure 14. In contrast, the upper part of the cavity in this smooth front multi-entrance solution showed better thermal performance. The overall average inner skin surface temperature of the smooth front multi-entrance solution was 60.1 °C, which was only 0.2 °C lower than the baseline façade.

Table 7.
The CFD simulation results of the smooth front multi-entrance solution compared to the baseline façade.
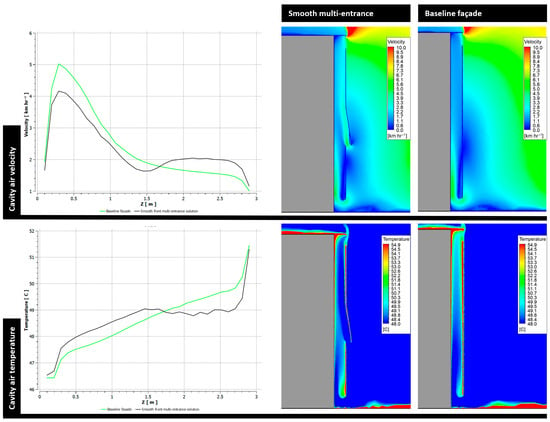
Figure 13.
The cavity thermal performance of the smooth front multi-entrance solution compared to the baseline façade.
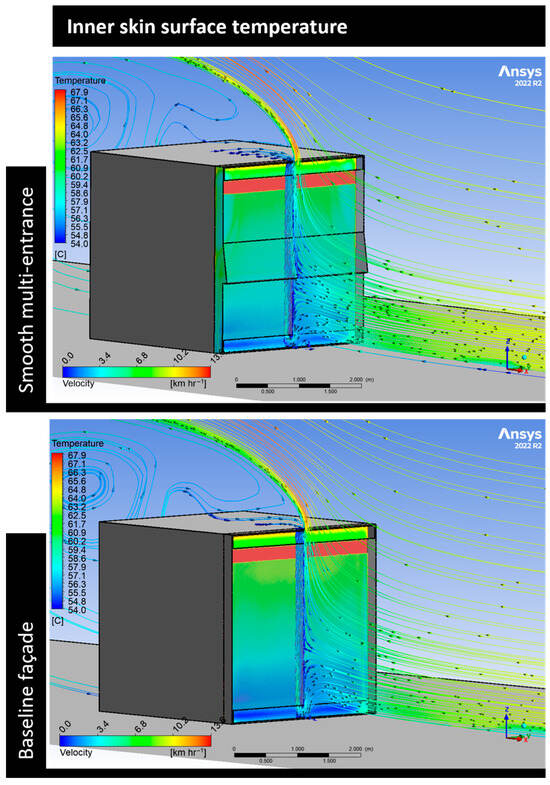
Figure 14.
The inner skin surface temperature of the smooth front multi-entrance solution compared to the baseline façade.
The second multi-entrance solution on the front face was similar in appearance to the smooth entrance solution except for the presence of a box over the extra aperture, as shown in Figure 15. The reason for this geometrical change is to direct the airflow when it enters the cavity to be closer to the inner skin instead of being adjacent to the inner surface of the outer skin, as in the case of the smooth entrance solution. Although this solution showed only a 0.1 difference in both airflow velocity inside the cavity and the average inner skin surface temperature compared to the smooth entrance solution, it leads to an additional front entrance modification that allows the airflow to enter the box from both the bottom and the top, as displayed in Figure 15, to further direct the airflow streamlines to travel adjacent to the inner skin, as illustrated in Figure 16.
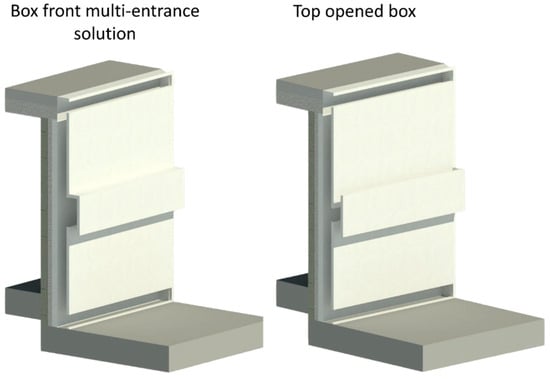
Figure 15.
Box front multi-entrance solution compared to the baseline façade.
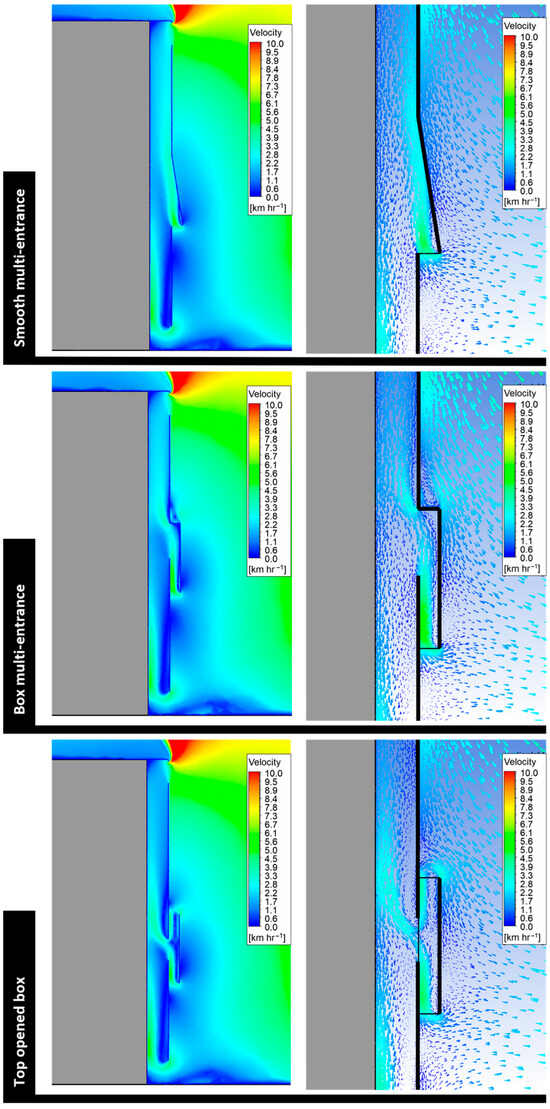
Figure 16.
Cross sections of the airflow pattern and velocity for all front multi-entrance solutions.
The CFD simulation of this top-opened box solution shows that the additional cover to the aperture that is open from the top and the bottom allowed the air to enter from opposite directions, which caused an increase in the velocity when they meet and pushed the airflow to be near the inner skin surface. Despite the fact that the average airflow velocity inside the cavity increased by almost 0.4 km/h compared to the other front face multi-entrance solutions, the average inner skin surface temperature remained the same, as seen in Table 8. The reason was that this solution directed the airflow straight away to hit the inner skin with very high speed, then dramatically declined while it travelled up to the outlet, as shown in Figure 17.

Table 8.
The CFD simulation results of top-opened box compared to the other solutions and the baseline façade.
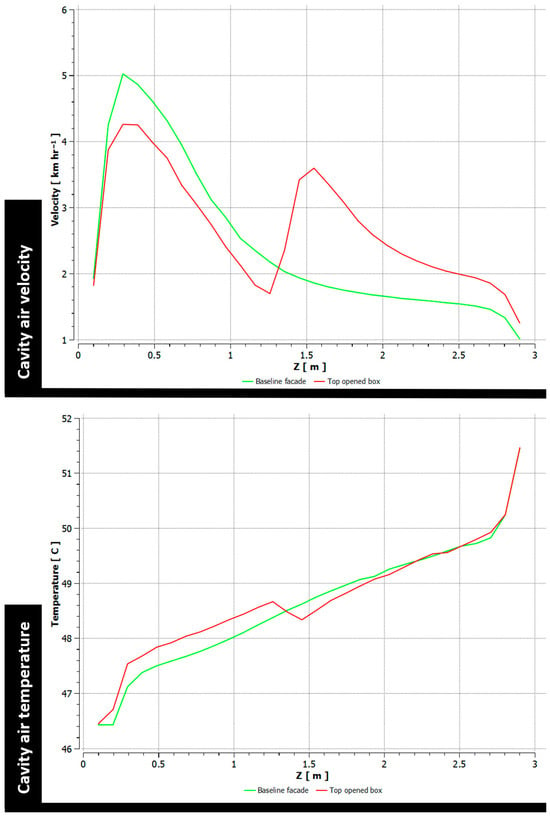
Figure 17.
The air velocity and temperature inside the cavities of the top-opened box solution compared to the baseline façade.
All three front face multi-entrance solutions showed very slight improvements in the overall thermal performance of the opaque ventilated façade. The modifications that were made to the geometry of the additional entrance did not appear to have a significant impact. Therefore, a further test was carried out to investigate the impact of adding an additional entrance to the front face, as shown in Figure 18. The results of this solution showed an improvement in the overall thermal performance, as shown in Table 9. Compared to the baseline façade, the average airflow speed through the cavity in this solution was 3 km/h, which is 0.3 km/h higher, as displayed in Figure 19. Furthermore, the average inner skin surface temperature also showed a decrease of 1 °C, from 60.3 °C in the baseline façade to 59.3 °C in this two-front multi-entrance solution.
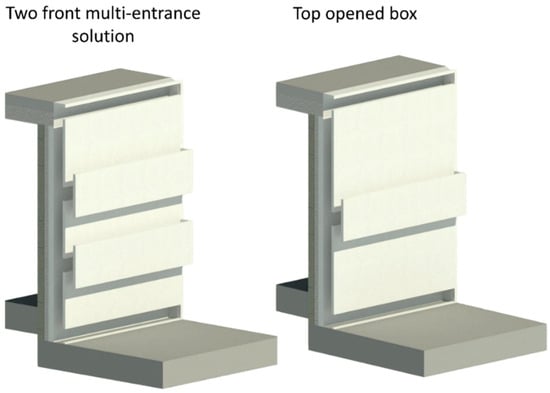
Figure 18.
Two-front multi-entrance solution compared to the box front multi-entrance solution.

Table 9.
The CFD simulation results of the two-front multi-entrance solution compared to the baseline façade.
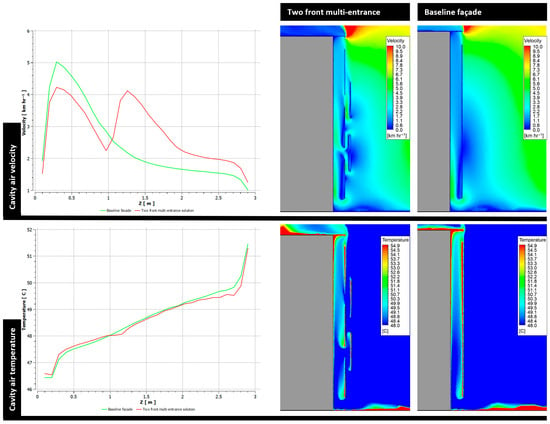
Figure 19.
The air velocity and temperature inside the cavities of Two-front multi-entrance solution compared to the baseline façade.
6.2.2. Side Multi-Entranced Solution
The position and geometry of the built side multi-entrance solution are comparable to the two-front face multi-entrance solution, since it was the highest multi-entrance solution that contributed to lowering the average inner skin surface temperature. This side multi-entrance solution is shown in Figure 20. The results of the simulation reveal a pattern of airflow that is different from the one anticipated by the front face solution. The mechanism of a side multi-entrance solution functions in a manner that is completely different from that of front face solutions, as seen in Figure 21, which displays a front elevation of the façade to illustrate the point. In particular, these entrances act as additional outlets for the air rather than inlets, as is the case with front face solutions.
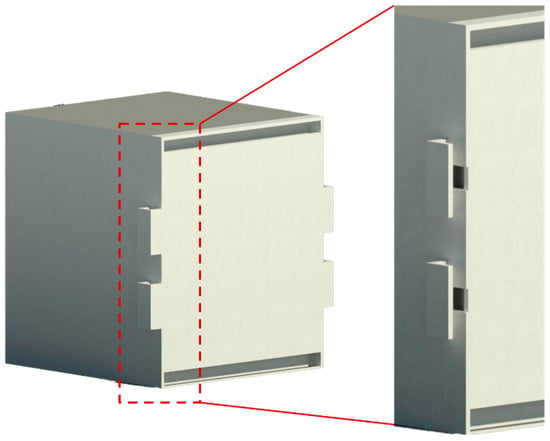
Figure 20.
The geometry of the side multi-entrance solution.
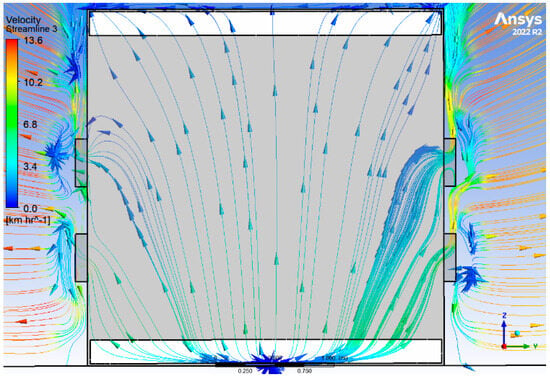
Figure 21.
Airflow pattern of the side multi-entrance solution.
The reason that these side apertures act as outlets is because of the consequent attraction of slower fluid by adjacent rapidly moving fluid. This is because when the air hits a building, the air turbulence that is created by sudden corners can produce a noticeable increase in velocity that is higher than the air velocity inside the cavity. This consequent attraction of slower fluid by adjacent rapidly moving fluid made these side apertures act as outlets.
Chart comparisons of the average airflow velocity and temperature inside the cavity of the baseline façade, the front multi-entranced solution, and the side multi-entranced solution are presented in Figure 22. The average airflow speed inside the cavity was highest for the side multi-entrance solution at 5.8 km/h in the first meter from the ground, compared to 4.4 km/h for the baseline façade and 3.6 km/h for the front multi-entrance solution. In the second meter up until the top of the cavity, the average airflow speed in the front multi-entrance solution had a higher velocity than the side multi-entrance solution by a difference of 0.3 km/h.
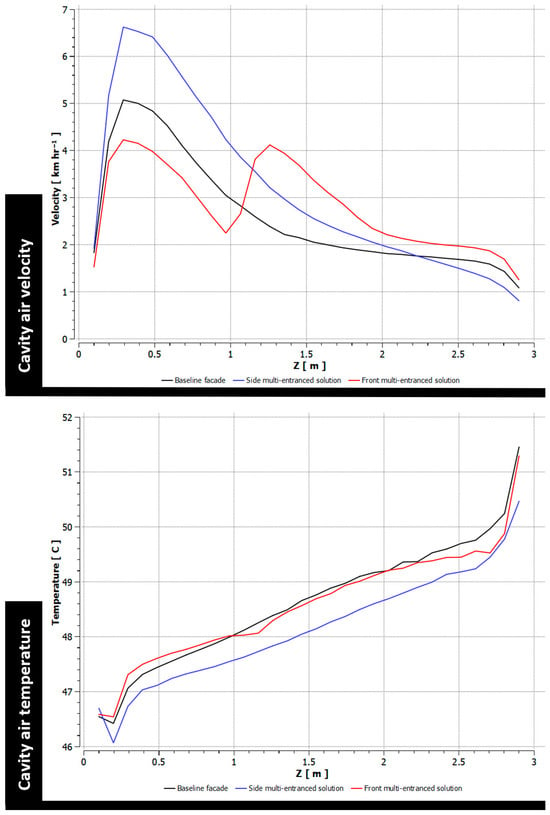
Figure 22.
The air velocity and temperature inside the cavities of front and side multi-entrance solutions compared to the baseline façade.
Table 10 displayed that when the side multi-entrance solution was compared to the baseline façade’s effect on the average temperature of the inner skin surface, the side multi-entrance solution achieved a reduction of 0.6 °C. None of the tested side or front multi-entrance solutions could significantly lower the average inner skin surface temperature. As a result, one final attempt was made to combine the front and side multi-entrances into a single design, as shown in Figure 23.

Table 10.
The CFD simulation results of the side multi-entrance solution compared to the baseline façade.
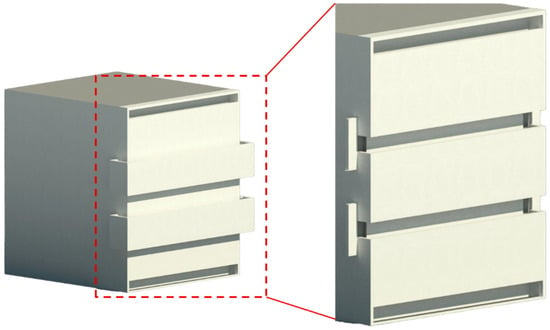
Figure 23.
The geometry of the combined front and side multi-entrances solution.
Figure 24 presents a chart that compares the average airflow velocity and temperature inside the cavity of the baseline façade, the front multi-entranced solution, the side multi-entranced solution, and the combined front and side multi-entranced solution. The combined front and side multi-entrance solution resulted in the cavity having the coolest average air temperature overall, as illustrated in Table 11. The combined front and side multi-entrance solution had the highest average airflow speed inside the cavity compared to any other multi-entranced solution. This was due to the fact that it utilized both the mechanism of the consequent attraction of slower fluid by adjacent rapidly moving fluid from the side and the utilization of airflow streamlines to enter the cavity that were travelling up and adjacent to the outer skin from the front, as can be seen in Figure 25. The results of the investigation were that the combined front and side multi-entranced solution had an average inner skin surface temperature that was 1.5 °C lower than the baseline façade.
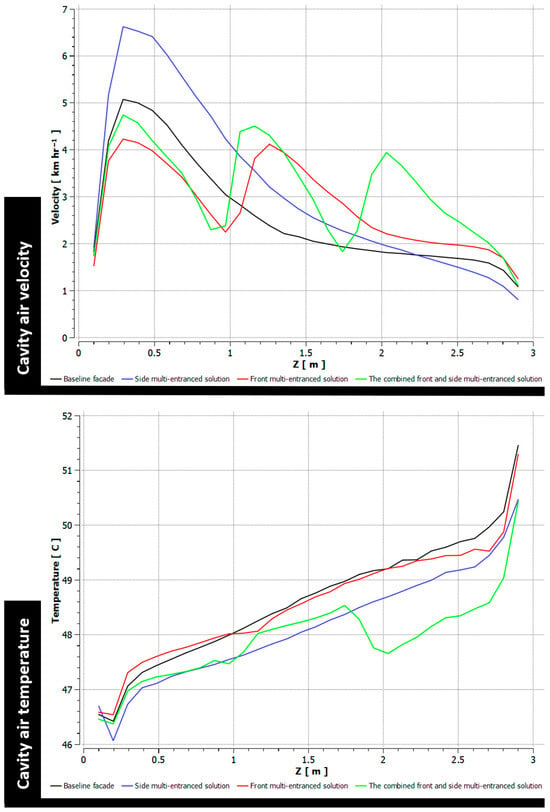
Figure 24.
The air velocity and temperature inside the cavities of the baseline façade, the front multi-entranced solution, the side multi-entranced solution, and the combined front and side multi-entranced solution.

Table 11.
The CFD simulation results of the baseline façade, the front multi-entranced solution, the side multi-entranced solution, and the combined front and side multi-entranced solution.
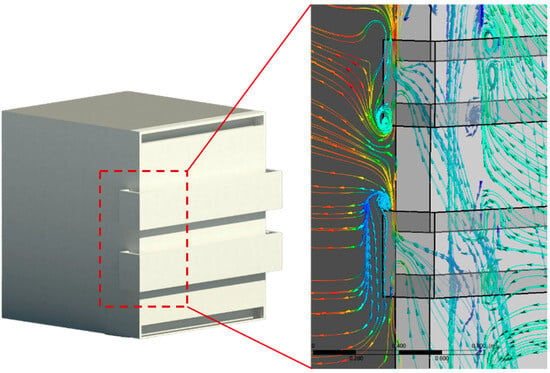
Figure 25.
The airflow pattern of the combined front and side multi-entranced solution.
7. Discussion
Within the concept and sensitivity analysis phase, thirteen bio-inspired solutions were individually examined using CFD simulations to determine their efficiency in boosting airflow velocity within the cavity, which in turn reduces the inner skin surface temperature. All the proposed bio-inspired solutions were successful in achieving better thermal performance than the baseline façade. The average inner skin surface temperature, the average air temperature, and the velocity inside the cavity all showed considerable improvements because of some of these solutions. In comparison to the baseline façade, Table 12 shows the average inner skin surface temperature, average air temperature, and velocity inside the cavity for each proposed solution. It also highlights the positive impact in green, the negative impact in red, and the slight improvement in pale green.

Table 12.
The proposed solutions in comparison to the baseline façade.
According to the findings, all of the top mound solutions were successful in achieving the greatest reduction in the average inner skin surface temperature, by at least 5 °C lower than the temperature of the baseline façade. Regarding the multi-entranced solutions, the findings indicate that each of these solutions showed slight improvements in lowering the average inner skin surface temperature by no more than one degree Celsius. The only solution that can be considered noteworthy is the combined front and side solution. This solution contributed to lowering the average temperature of the inner skin surface by 1.5 °C. As a result, the wide top mound solution offered the best thermal performance compared to all of the other solutions, including top mound solutions.
This research presents a novel biomimetic opaque ventilated façade solution in a hot desert climate. It serves as evidence that biomimicry is a very efficient problem-solving approach, leveraging nature’s designs and strategies to develop novel and sustainable opaque ventilated façade solutions. Comparing the results, the wide mound solution significantly reduced the average inner skin surface temperature compared to both the baseline and unventilated façades. The average inner skin surface temperature of the opaque ventilated façade with the wide mound solution, when it is fully exposed to solar radiation and during light windward, was 54.4 °C, which is 5.9 °C lower than the baseline façade and 16.4 °C lower than the unventilated façade.
In comparison with previous studies on opaque ventilated façades, such as those by Ibañez-Puy et al. [8], Fantucci et al. [9], and Gagliano and Aneli [10], which demonstrated energy savings between 20% and 55% in summer climates, the bio-inspired enhancements proposed in this study provide an additional layer of innovation through nature-based optimization. While earlier work primarily focused on wall layer configurations and material properties to reduce thermal gain, this research demonstrates how geometric manipulation inspired by natural forms, such as termite mounds or burrow structures, can drive passive air movement to enhance convective cooling within ventilated cavities. This study introduces a design methodology derived from biomimicry that strategically addresses aerodynamic flow and surface temperature regulation. These additions complement and extend the thermal performance findings of the aforementioned literature.
Although the findings of this study are promising, there are some limitations that should be considered. First, this research focused on studying the effects of a biomimetic opaque ventilated façade on the thermal performance of building façades in hot desert climates. This implies that the study’s proposed biomimetic opaque ventilated façade is not applicable in other climate zones. However, the approach and framework that were created can be used in other climates. Second, the installation of the proposed biomimetic opaque ventilated façade onto a real building façade could offer significant benefits for studying its life cycle assessment. Nevertheless, limitations in time and budget currently impede this exploration. Finally, the proposed biomimetic opaque ventilated façade was evaluated for its applicability for a low-rise building façade. Whether or not this façade solution is suitable for mid-rise and high-rise buildings is unknown.
8. Conclusions
This study developed and evaluated a novel biomimetic opaque ventilated façade system specifically designed for hot desert climates. Through a sensitivity analysis and CFD simulations, thirteen distinct bio-inspired configurations were explored to assess their impact on enhancing airflow within the façade cavity and reducing inner skin surface temperature. All proposed designs achieved measurable improvements in thermal performance compared to a conventional unventilated façade, with the most effective being the wide top mound solution, which achieved a reduction of 16.4 °C in average inner surface temperature and significantly enhanced airflow velocity within the cavity compared to the baseline ventilated façade.
The results highlight the effectiveness of integrating biomimicry into opaque ventilated façade systems—an approach that remains largely underexplored in existing literature. By mimicking natural forms such as termite mounds and burrows, the study demonstrates that airflow and thermal behavior can be optimized not only through material selection and traditional passive design strategies but also through geometry inspired by biological systems. This positions biomimicry as a promising design methodology that complements and enhances current approaches to sustainable architecture.
The study also introduced a unique methodology that combines parametric design, performance-based analysis, and biological analogies to generate façade solutions. This framework offers a replicable process for architects and engineers to derive high-performance, climate-responsive designs across various contexts. The approach can be adapted to other climates by modifying design parameters and drawing inspiration from locally adapted species, thereby expanding the relevance of the findings beyond hot desert regions.
The research’s findings and limitations identify several recommendations and opportunities for future work. First, while the current study focused on hot desert climates, the framework developed for the biomimetic opaque ventilated façade can be adapted for other climate zones. Future research is recommended to investigate the necessary modifications for the façade to function effectively in temperate, humid, or cold climates. This could involve finding different effective parameters for the thermal performance, defining other bio-inspired solutions, and overall developing other novel biomimetic opaque ventilated façade solutions. Second, future research should prioritize the installation of this façade on a low-rise building to gather real-world data on its thermal performance, durability, and maintenance requirements. This data can then be used to conduct a comprehensive life cycle assessment, considering environmental impact, energy consumption, and cost-effectiveness over its lifespan. Third, the current study evaluated the biomimetic façade for low-rise buildings. Future research should investigate its applicability for mid-rise and high-rise buildings. This may involve analyzing wind loads, structural support requirements, and potential modifications needed to maintain effectiveness at different heights. Finally, due to time constraints, this study did not delve into the tectonics of the façade, which explores how individual design elements come together as a cohesive system. Future research should develop a detailed tectonic design demonstrating how each component integrates to create a functionally pleasing whole. This exploration can inform the construction process and ensure optimal performance of the façade. By addressing these limitations and recommendations, future research can broaden the applicability of the proposed biomimetic opaque ventilated façade, establish its viability in real-world settings, and contribute to the development of more sustainable and high-performing building envelopes.
Author Contributions
Conceptualization, A.A.; Data curation, A.A.; Formal analysis, A.A.; Investigation, A.A., S.L. and W.J.; Methodology, A.A.; Resources, A.A.; Software, A.A.; Supervision, S.L. and W.J.; Validation, A.A. and S.L.; Visualization, A.A.; Writing—original draft, A.A.; Writing—review and editing, A.A. All authors have read and agreed to the published version of the manuscript.
Funding
This research received no external funding.
Data Availability Statement
The original contributions presented in this study are included in the article. Further inquiries can be directed to the corresponding author.
Acknowledgments
This work is based on Ahmed Alyahya’s doctoral dissertation. Some sections of the text closely follow or replicate the original content from my Ph.D. thesis and have been included here with the consent of the editors.
Conflicts of Interest
The authors declare no conflicts of interest.
References
- International Energy Agency. Space Cooling—Analysis; IEA: Paris, France, 2023; Available online: https://www.iea.org/reports/space-cooling (accessed on 25 June 2025).
- Elnabawi, M.H.; Saber, E.; Bande, L. Passive Building Energy Saving: Building Envelope Retrofitting Measures to Reduce Cooling Requirements for a Residential Building in an Arid Climate. Sustainability 2024, 16, 626. [Google Scholar] [CrossRef]
- Saifi, N.; Belatrache, D.; Dadamoussa, A.; Settou, N. Effects of green roofs and vertical greenery systems on building thermal comfort in dry climates: An experimental study. J. Build. Pathol. Rehabil. 2023, 8, 35. [Google Scholar] [CrossRef]
- Haggag, M.; Hassan, A.; Qadir, G. Energy and Economic Performance of Plant-Shaded Building Façade in Hot Arid Climate. Sustainability 2017, 9, 2026. [Google Scholar] [CrossRef]
- Gruber, P. Biomimetics in Architecture. In Architecture of Life and Buildings; Springer: Berlin/Heidelberg, Germany, 2011. [Google Scholar] [CrossRef]
- Pawlyn, M. Biomimicry in Architecture; RIBA Publishing: London, UK, 2016. [Google Scholar] [CrossRef]
- Pohl, G.; Nachtigall, W. Biomimetics for Architecture & Design. In Biomimetics for Architecture & Design; Springer: Berlin/Heidelberg, Germany, 2015. [Google Scholar] [CrossRef]
- Ibañez-Puy, M.; Vidaurre-Arbizu, M.; Sacristán-Fernández, J.A.; Martín-Gómez, C. Opaque Ventilated Façades: Thermal and energy performance review. Renew. Sustain. Energy Rev. 2017, 79, 180–191. [Google Scholar] [CrossRef]
- Fantucci, S.; Serra, V.; Carbonaro, C. An experimental sensitivity analysis on the summer thermal performance of an Opaque Ventilated Façade. Energy Build. 2020, 225, 110354. [Google Scholar] [CrossRef]
- Gagliano, A.; Aneli, S. Analysis of the energy performance of an Opaque Ventilated Façade under winter and summer weather conditions. Sol. Energy 2020, 205, 531–544. [Google Scholar] [CrossRef]
- Maciel, A.C.F.; Carvalho, M.T. Operational energy of opaque ventilated façades in Brazil. J. Build. Eng. 2019, 25, 100775. [Google Scholar] [CrossRef]
- Sarihi, S.; Mehdizadeh Saradj, F.; Faizi, M. A Critical Review of Façade Retrofit Measures for Minimizing Heating and Cooling Demand in Existing Buildings. Sustain. Cities Soc. 2021, 64, 102525. [Google Scholar] [CrossRef]
- Astorqui, J.; Porras-Amores, C. Ventilated Façade with double chamber and flow control device. Energy Build. 2017, 149, 471–482. [Google Scholar] [CrossRef]
- Azkorra-Larrinaga, Z.; Romero-Anton, N.; Martin-Escudero, K.; Lopez-Ruiz, G.; Giraldo-Soto, C. Comparative summer thermal performance analysis between open ventilated facade and modular living wall. Case Stud. Therm. Eng. 2024, 53, 103919. [Google Scholar] [CrossRef]
- Ciampi, G.; Spanodimitriou, Y.; Scorpio, M.; Rosato, A.; Sibilio, S. Energy performance of PVC-Coated polyester fabric as novel material for the building envelope: Model validation and a refurbishment case study. J. Build. Eng. 2021, 41, 102437. [Google Scholar] [CrossRef]
- Coma, J.; Pérez, G.; de Gracia, A.; Burés, S.; Urrestarazu, M.; Cabeza, L.F. Vertical greenery systems for energy savings in buildings: A comparative study between green walls and green facades. Build. Environ. 2017, 111, 228–237. [Google Scholar] [CrossRef]
- Mora-Pérez, M.; López-Patiño, G.; Amparo López-Jiménez, P. Quantification of Ventilated Façade Effect Due to Convection in Buildings Buoyancy and Wind Driven Effect. Res. Appl. Mech. Eng. 2014, 3, 1–11. Available online: http://www.seipub.org/rame (accessed on 25 June 2025).
- Pujadas-Gispert, E.; Alsailani, M.; van Dijk, K.C.A.; Rozema, A.D.K.; ten Hoope, J.P.; Korevaar, C.C.; Moonen, S.P.G. Design, construction, and thermal performance evaluation of an innovative bio-based ventilated façade. Front. Archit. Res. 2020, 9, 681–696. [Google Scholar] [CrossRef]
- Rahiminejad, M.; Louis Marie Pâris, A.; Ge, H.; Khovalyg, D. Performance of lightweight and heavyweight building walls with naturally ventilated passive and active facades. Energy Build. 2022, 256, 111751. [Google Scholar] [CrossRef]
- Sotelo-Salas, C.; Escobar-del Pozo, C.; Esparza-López, C.J. Thermal assessment of spray evaporative cooling in opaque double skin facade for cooling load reduction in hot arid climate. J. Build. Eng. 2021, 38, 102156. [Google Scholar] [CrossRef]
- Stazi, F.; Ulpiani, G.; Pergolini, M.; Di Perna, C.; D’Orazio, M. The role of wall layers properties on the thermal performance of ventilated facades: Experimental investigation on narrow-cavity design. Energy Build. 2020, 209, 109622. [Google Scholar] [CrossRef]
- Vincent, J.F.V.; Bogatyreva, O.A.; Bogatyrev, N.R.; Bowyer, A.; Pahl, A.K. Biomimetics: Its practice and theory. J. R. Soc. Interface 2006, 3, 471–482. [Google Scholar] [CrossRef] [PubMed]
- Harkness, J.M. A Lifetime of Connections: Otto Herbert Schmitt, 1913–1998. Phys. Perspect. 2002, 4, 456–490. [Google Scholar] [CrossRef]
- Wilson, E.O. Biophilia; Harvard University Press: Cambridge, MA, USA, 1984. [Google Scholar]
- Volstad, N.L.; Boks, C. On the use of Biomimicry as a Useful Tool for the Industrial Designer. Sustain. Dev. 2012, 20, 189–199. [Google Scholar] [CrossRef]
- Zari, M.P. Biomimetic approaches to architectural design for increased sustainability. Sustain. Build. Conf. 2007, 14, 87–98. [Google Scholar]
- Mazzoleni, I. Architecture Follows Nature: Biomimetic Principles for Innovative Design; Price, S., Ed.; CRC: Boca Raton, FL, USA, 2013. [Google Scholar]
- Knippers, J.; Jungjohann, H.; Scheible, F.; Oppe, M. Bio-inspired Kinetic GFRP-façade for the Thematic Pavilion of the EXPO 2012 in Yeosu. Int. Symp. Shell Spat. Struct. (IASS 2012) 2012, 90, 341–347. [Google Scholar] [CrossRef]
- Sheikh, W.T.; Asghar, Q. Adaptive biomimetic facades: Enhancing energy efficiency of highly glazed buildings. Front. Archit. Res. 2019, 8, 319–331. [Google Scholar] [CrossRef]
- Golzan, S.S.; Pouyanmehr, M.; Naeini, H.S. Recommended angle of a modular dynamic façade in hot-arid climate: Daylighting and energy simulation. Smart Sustain. Built Environ. 2023, 12, 27–37. [Google Scholar] [CrossRef]
- Hosseini, S.M.; Mohammadi, M.; Schröder, T.; Guerra-Santin, O. Bio-inspired interactive kinetic façade: Using dynamic transitory-sensitive area to improve multiple occupants’ visual comfort. Front. Archit. Res. 2021, 10, 821–837. [Google Scholar] [CrossRef]
- Kuru, A.; Oldfield, P.; Bonser, S.; Fiorito, F. A Framework to Achieve Multifunctionality in Biomimetic Adaptive Building Skins. Buildings 2020, 10, 114. [Google Scholar] [CrossRef]
- Soliman, M.E.; Bo, S. An innovative multifunctional biomimetic adaptive building envelope based on a novel integrated methodology of merging biological mechanisms. J. Build. Eng. 2023, 76, 106995. [Google Scholar] [CrossRef]
- Baumeister, D.; Benyus, J.M.; Dwyer, J.; Ritter, S.; Tocke, R. Biomimicry Resource Handbook: A Seed Bank of Best Practices; Biomimicry 3.8: Missoula, MT, USA, 2013. [Google Scholar]
- DTI Global Watch Mission. Biomimetics: Strategies for product design inspired by nature—A mission to the Netherlands and Germany. In Watch, Global Report, Mission, January; DTI Global Watch Mission: Melton Mowbray, UK, 2007; p. 64. [Google Scholar]
- Gamage, A.; Hyde, R. Architectural Science Review A model based on Biomimicry to enhance ecologically sustainable design A model based on Biomimicry to enhance ecologically sustainable design. Archit. Sci. Rev. 2012, 55, 224–235. [Google Scholar] [CrossRef]
- Helms, M.; Vattam, S.; Yen, J.; Weissburg, M. Problem-Driven and Solution-Based Design: Twin Processes of Biologically Inspired Design. In Silicon + Skin: Biological Processes and Computation, Proceedings of the 28th Annual Conference of the Association for Computer Aided Design in Architecture (ACADIA), Minneapolis, MN, USA, 16–19 October 2008; Association for Computer Aided Design in Architecture: Fargo, ND, USA, 2008; pp. 94–101. ISBN 978-0-9789463-4-0. [Google Scholar]
- Knippers, J.; Speck, T. Design and construction principles in nature and architecture. BioInspir. Biomim. 2012, 7, 15002. [Google Scholar] [CrossRef] [PubMed]
- Speck, T.; Speck, O. Process sequences in biomimetic research. WIT Trans. Ecol. Environ. 2008, 114, 3–11. [Google Scholar] [CrossRef]
- Alyahya, A.; Lannon, S.; Jabi, W. CFD simulation for opaque ventilated facades in hot arid climate based on literature review design parameters. Build. Simul. Conf. Proc. 2023, 18, 909–916. [Google Scholar] [CrossRef]
- Alyami, M. Building energy performance simulation: A case study of modelling an existing residential building in Saudi Arabia. Environ. Res. Infrastruct. Sustain. 2021, 1, 035001. [Google Scholar] [CrossRef]
- Kay, F.R.; Whitford, W.G. The Burrow Environment of the Banner-Tailed Kangaroo Rat, Dipodomys spectabilis, in Southcentral New Mexico. Am. Midl. Nat. 1978, 99, 270–279. [Google Scholar] [CrossRef]
- Krasnov, B.R.; Shenbrot, G.I.; Khokhlova, I.S.; Degen, A.A.; Rogovin, K.A. On the biology of Sundevall’s jird (Meriones crassus Sundevall, 1842) (Rodentia: Gerbillidae) in the Negev Highlands, Israel. Mammalia 1996, 60, 375–392. [Google Scholar] [CrossRef]
- Olszewski, J.L.; Skoczeń, S. The airing of burrows of the mole, Talpa europaea Linnaeus, 1758. Acta Theriol. 1965, 10, 181–193. [Google Scholar] [CrossRef]
- Taraborelli, P.; Borruel, N.; Sandobal, A.J.; Giannoni, S. Influence of biotic and abiotic factors on the structure of burrows of the cavy Microcavia australis. Mastozool. Neotrop. 2009, 16, 411–421. [Google Scholar]
- Vogel, S.; Ellington, C.P.; Kilgore, D.L. Wind-Induced Ventilation of the Burrow of the Prairie-Dog, Cynomys ludovicianus. J. Comp. Physiol 1973, 85, 1–14. [Google Scholar] [CrossRef]
- Turner, S. The extended organism. In Bibliovault OAI Repository; The University of Chicago Press: Chicago, IL, USA, 2000. [Google Scholar]
- Kucheruk, V.V. Mammal Burrows—Their Structure, Topology and Use. Fauna Ecol. Rodents 1983, 15, 5–54. (In Russian) [Google Scholar]
- Turner, J.S.; Pinshow, B. Transient-state mechanisms of wind-induced burrow ventilation. J. Exp. Biol. 2015, 218, 170–175. [Google Scholar] [CrossRef] [PubMed][Green Version]
- Brickner-Braun, I.; Zucker-Milwerger, D.; Braun, A.; Turner, J.S.; Pinshow, B.; Berliner, P. Ventilation of multi-entranced rodent burrows by boundary layer Eddies. J. Exp. Biol. 2014, 217, 4141–4148. [Google Scholar] [CrossRef] [PubMed][Green Version]
Disclaimer/Publisher’s Note: The statements, opinions and data contained in all publications are solely those of the individual author(s) and contributor(s) and not of MDPI and/or the editor(s). MDPI and/or the editor(s) disclaim responsibility for any injury to people or property resulting from any ideas, methods, instructions or products referred to in the content. |
© 2025 by the authors. Licensee MDPI, Basel, Switzerland. This article is an open access article distributed under the terms and conditions of the Creative Commons Attribution (CC BY) license (https://creativecommons.org/licenses/by/4.0/).