Article

Micro-Mechanism of Strength for Cement-Treated Soil Based on the SEM Experiment: Qualitative and Quantitative Analysis

1
Department of Civil Engineering, Hangzhou City University, Hangzhou 310015, China
2
Research Center of Coastal and Urban Geotechnical Engineering, Zhejiang University, Hangzhou 310058, China
3
Engineering Research Center for Geological Environment and Underground Space of Jiangxi Province, East China University of Technology, Nanchang 330013, China
4
School of Civil & Architecture Engineering of ECUT, East China University of Technology, Nanchang 330013, China
*
Author to whom correspondence should be addressed.
Buildings 2025, 15(13), 2370; https://doi.org/10.3390/buildings15132370
Submission received: 24 December 2024 / Revised: 9 February 2025 / Accepted: 13 February 2025 / Published: 6 July 2025
(This article belongs to the Section Building Materials, and Repair & Renovation)

Abstract

The strength of cement-treated soil (CTS) is influenced by a range of complex factors. Investigating the microstructure of cement-treated soil provides a fundamental understanding of its strength evolution. This study explores the micro-mechanism of strength in cement-treated soil through qualitative and quantitative analyses. Unconfined compressive strength (UCS) tests were conducted on two types of cement-treated soils with different curing ages. Microstructural images were obtained via Scanning Electron Microscopy (SEM), from which micro-parameters—including image porosity ( n s ), mean shape factor ( F ), particle grading entropy ( G e ), and directional probability entropy ( H m )—were obtained. Finally, the Grey Relation Analysis (GRA) method was employed to evaluate the relative importance of these micro-parameters in influencing strength. And the micro-mechanism of strength was discussed. Results show that these variations of cement-treated soil strength are primarily governed by porosity, particle shape, size, and arrangement. GRA results indicate that particle grading entropy ( G e ) has the greatest impact on CTS strength, followed by image porosity ( n s ). In contrast, mean shape factor ( F ) and directional probability entropy ( H m ) have relatively lower impacts. The order of influence is G e > n s > F   a n d   H m , suggesting that changing particle grading entropy ( G e ) is recommended to achieve higher CTS strength more efficiently. Finally, a polynomial relation between G e and strength is proposed and the sensitivity analysis indicates that the best value of G e for Hangzhou CTS is 0.3125 and for Taizhou CTS is 0.5. The corresponding UCSs are 56.96 kPa and 425.8704 kPa, respectively. These findings contribute to optimizing the strength of cement-treated soils and provide insights into the micro-mechanisms underlying macro-scale material properties.

1. Introduction

Cement-treated soil (CTS) is increasingly recognized as a sustainable and cost-effective building material widely used in civil engineering and construction. By blending soil with a controlled amount of cement, CTS achieves enhanced strength, durability, and stability, making it suitable for applications such as subgrade layers in road and railway construction [1,2] and soft soil stabilization for foundation systems [3,4]. Its versatility and performance have positioned CTS as a key material in modern infrastructure development.
The strength of CTS is a critical parameter in structural design and performance evaluation. Since macro-scale properties of soil are inherently governed by its microstructure [5,6], understanding the micro-mechanisms underlying strength evolution is essential for optimizing material performance. Cement hydration plays a pivotal role in improving soil strength [7], with influencing factors, such as clay-water/cement ratio, curing time, and cement content, being extensively studied [8,9,10]. These studies have significantly advanced our understanding of macro-scale behavior. However, they largely overlook the micro-scale mechanisms responsible for strength development [11,12,13,14,15].
Scanning Electron Microscopy can be used to observe the hydration process of CTS from the micro-scale [16,17]. Research suggests that hydration products can fill the small pore space and bond small particles [18,19], changing the microstructure of cement-treated soil. Despite these findings, two critical questions remain: (1) How can the hydration products be quantitatively characterized by micro-parameters? (2) Which micro-parameter exerts the greatest influence on CTS strength? These questions are important for understanding the micro-mechanism of strength for cement-treated soil.
This study seeks to answer these questions. Two types of cement-treated soil from Hangzhou and Taizhou were studied. Then, the unconfined compressive strength (UCS) tests and Scanning Electron Microscope (SEM) tests were conducted. Finally, the microstructure morphology of CTS was analyzed, key micro-parameters were quantified, and their influences on UCS were discussed. This work can provide deeper insights into the micro-mechanisms governing CTS strength and contributing to more effective material design and optimization.

2. Materials and Methods

2.1. Materials

Two kinds of soil were used to prepare the cement-treated soil samples in this study: Hangzhou soil, sourced from Zhejiang University, and Taizhou soil from the Taizhou Binhai Industrial Zone. Their basic physical properties are summarized in Table 1 and Table 2.

2.2. Sample Preparation

The preparation steps for cement-treated soil samples were as follows [20]: At first, both the original Hangzhou soil and Taizhou soil were oven-dried at 105 °C for 24 h and then they were pulverized to pass through a 2 mm sieve to prepare the soil powder. After that, the soil powder was mixed with 42.5 ordinary Portland cement and water to produce the CTS mixture. Then, the mixture was compacted into a standard mold, whose height is 80 mm and diameter is 39.1 mm. Later, these original CTS samples were left under natural conditions (room temperature of around 20–25 °C and ambient humidity of 60–70%) for 24 h. After this period, these samples were carefully removed from the mold and wrapped in vinyl film. They were stored in a humidity chamber with a constant temperature of 20 ± 5 °C and relative humidity of 90% until the planned curing time. The cement content and curing age of these samples are shown in Table 3. The cement content refers to the weight of the cement added relative to the dry weight of the soil powder.
The next step was to prepare the undisturbed surfaces for Scanning Electron Microscopy (SEM) tests [21]. The untested cement-treated soil sample was cut into a strip (2.0 cm (length) × 1.5 cm (width) × 1.5 mm (height)) from the center point at first. Two parallel grooves (0.5 mm deep) were carved in the middle of the strip, spaced 0.5 mm apart. The CTS strip was then dried before it was broken along the grooves to obtain the undisturbed surfaces. To make the clay conductive, the surface was coated with gold using an SBC-12 ion sputterer from KYKY.

2.3. Unconfined Compression Tests

The unconfined compressive tests could be conducted once the porosity of all untested samples in Table 3 has been measured. The porosity was determined based on the density and the volume measurements of the samples. Later, the microcomputer-controlled electronic universal testing machine (WDW-T50 type, Test Machine Factory, Jinan, China) was used to measure the unconfined compressive strength of the CTS. During the test, the load was applied by the vertical displacement at a speed of 1 mm/min. The microcomputer is used to record the data of stress and strain and then the unconfined compressive strength of CTS can be obtained.

2.4. Scanning Electron Microscope Tests

The Scanning Electron Microscope (SEM) from the FEI company in Amsterdam, The Netherlands (FEG650 type) was used to take photos of CTS samples. SEM images of all of the samples in Table 3 were taken. Based on these SEM images, image processing could be conducted. Finally, the micro-parameters that could represent the clay microstructure were calculated by PCAS software and Matlab software. The criteria for determining these micro-parameters using the software have been given in our previous research [22].

3. Results

3.1. Microscopic Morphology of CTS

Figure 1a presents the SEM image of Hangzhou CTS after 28 days of curing (Sample No. 1). Compared to Figure 1b, which shows Hangzhou CTS at 3 days of curing (Sample No. 3), Figure 1a exhibits more needle-like formations, dense structures and reticular structures. Among these, the needle-like structures are identified as ettringite (i.e., Ca4Al2(SO4)3(OH)12(H2O)26, AFt) [23,24]. The denser structures, identified as C-S-H (i.e., 3CaO·2SiO2·3H2O), play a critical role in binding soil particles together [25,26,27]. Additionally, the small lamellar particles observed in Figure 1a correspond to calcium hydroxide (i.e., Ca(OH)2, CH) [28,29], which forms within the pore spaces and solid matrix as hydration progresses. The presence of CH contributes to pore structure refinement and serves as a calcium source that facilitates further C-S-H growth, thereby enhancing microstructural connectivity and load-bearing capacity.
Therefore, the cement hydration process induces significant microstructural changes in CTS, influencing particle arrangement, density, morphology, and size distribution. Based on this microstructural mechanism, a conceptual model (Figure 2) has been developed to illustrate these morphological transformations in CTS.

3.2. Quantitative Analysis of CTS

For further quantitative analysis on CTS, the arrangement, density, shape, and size of particles in the conceptual model should be quantitatively characterized by corresponding micro-parameters. Many micro-parameters can be obtained from the Scanning Electron Microscope tests; among them, the four micro-parameters, directional probability entropy H m , image porosity n s , mean shape factor F , and particle grading entropy G e , are selected to represent the arrangement, density, shape, and size of particles in the cement-treated soil, respectively. Their definitions are listed in Table 4.

3.3. UCS and Micro-Parameter Analysis

The unconfined compressive strength (UCS) of cement-treated soil samples is presented in Table 5 and Table 6. For Hangzhou CTS, UCS values ranged from 12.42 kPa to 54.08 kPa while, for Taizhou CTS, they varied between 10.21 kPa and 158.26 kPa, depending on the curing duration. As expected, the UCS of cement-treated soil increased with curing time. Notably, the UCS of the Taizhou CTS sample at 14 days (24.75 kPa) and 28 days (158.26 kPa) exhibited a substantial difference despite having the same cement slurry content. This significant variation can be primarily attributed to the nonlinear progression of cement hydration. In Taizhou CTS with 15% cement content, the hydration reaction proceeds relatively slowly during the first 14 days, resulting in a gradual strength gain. After this period, as more cement particles dissolve and hydration products continue to develop, the reaction accelerates, leading to a sharp increase in strength by 28 days. Additionally, other factors may have contributed to this variation. Slight differences in curing conditions (such as temperature and humidity) could have influenced hydration kinetics while minor inconsistencies in sample preparation and mixing uniformity might have affected early-stage strength development. Although every effort was made to maintain consistency, small variations in cement dispersion could have led to localized differences in strength.
The measured micro-parameters are also listed in Table 5 and Table 6, with their evolution over curing age illustrated in Figure 3. The trends observed for cement-treated Hangzhou soil and cement-treated Taizhou soil are similar. Specifically, the micro-parameter of G e exhibits more significant variation, attributed to the generation of finer particles during the hydration process. In contrast, both n s and F show slight changes with increasing curing time while H m remains nearly constant. The above analysis provides a qualitative description of the trends. To further explore the relationship between each micro-parameter and UCS, a Grey Relation Analysis (GRA) should be performed.

4. Discussion

4.1. Grey Relation Analysis Method

The Grey Relation Analysis (GRA) method [30,31] was adopted to analyze the influence of each microscopic parameter on the UCS of CTS. GRA is a multi-factor statistical analysis method in which the CTS strength and its influencing factors collectively form a grey system. The effect of each influencing factor on strength can be quantitatively characterized by the grey relational grade γ 0 i calculated using the GRA method. The detailed steps are as follows.

4.1.1. Generation of Grey Relational Sequence

In Grey Relation Analysis, two variable sequences need to be generated: a reference sequence and a comparative sequence. Since this study investigates the influence of various factors on UCS, the values of CTS strength are defined as the reference sequence, x 0 , and the values of the four influencing factors are defined as the comparative sequences, x i   i = 1 , 2 , 3 , 4 . Let x i k represent the value of the i th influencing factor at the k th position. Given that the purpose of Grey Relation Analysis is to explore the most significant micro-parameter affecting strength, in the revised manuscript, we have merged the experimental data for both the Taizhou and Hangzhou cemented clay samples and conducted a unified Grey Relation Analysis. There are nine samples in total. Therefore, each comparative sequence consists of nine values and k = 9 , i.e.,
x 0 = x 0 1 x 0 2 x 0 3 x 0 4 x 0 5 x 0 6 x 0 7 x 0 8 x 0 9
x i = x i 1 x i 2 x i 3 x i 4 x i 5 x i 6 x i 7 x i 8 x i 9

4.1.2. Grey Relational Normalization

Normalization scales the variable sequences x 0 and x i i = 1 , 2 , 3 , 4 , transforming them into the numerical sequences x 0 and x i   i = 1 , 2 , 3 , 4 , with values ranging from 0 to 1, as shown below:
x 0 k = x 0 k / x 0 1
x i k = x i k / x i 1

4.1.3. Calculation of Grey Relational Coefficients

The grey relational coefficient ε 0 i k measures the degree of association between the reference sequence x 0 and the comparative sequence x i . A higher ε 0 i k value indicates a stronger association and can be calculated using:
ε 0 i k = min i           k x 0 k x i k + ξ max i           k x 0 k x i k x 0 k x i k + ξ max i           k x 0 k x i k
where the coefficient ξ (commonly set to 0.5) is the distinguishing coefficient and min i           k x 0 k x i k and max i           k x 0 k x i k are the minimum and maximum absolute differences between x 0 k and x i k .

4.1.4. Calculation of Grey Relational Grade

The grey relational grade γ 0 i represents the influence of each micro-parameter on UCS and can be calculated using Equation (6). In this study, each sequence contains nine values ( N = 9 ). A higher γ 0 i indicates a stronger influence on UCS:
γ 0 i = 1 N k = 1 N ε 0 i k

4.2. The Influence of Micro-Parameters on Strength

The clay strength and its influence factors form a grey system. And the influence can be quantitatively analyzed by the grey relational grade γ 0 i obtained from GRA. The results are shown in Figure 4 and Table 7. The reference sequence “all samples” includes experimental data from both cement-treated Hangzhou clay and cement-treated Taizhou clay samples in Table 3.
As shown in Figure 4 and Table 7, a higher grey relational grade γ 0 i indicates a more significant influence of the corresponding micro-parameter on UCS. Among the micro-parameters, the grey relational grade γ 0 i for particle grading entropy G e is the highest, followed closely by the grey relational grade γ 0 i of image porosity n s . The grey relational grades γ 0 i of mean shape factor F and directional probability entropy H m have slightly lower values. The results indicate that the order of the importance of micro-parameters regarding UCS for cement-treated soil is as follows: G e > n s > F   a n d   H m .

4.3. Micro-Mechanism of UCS

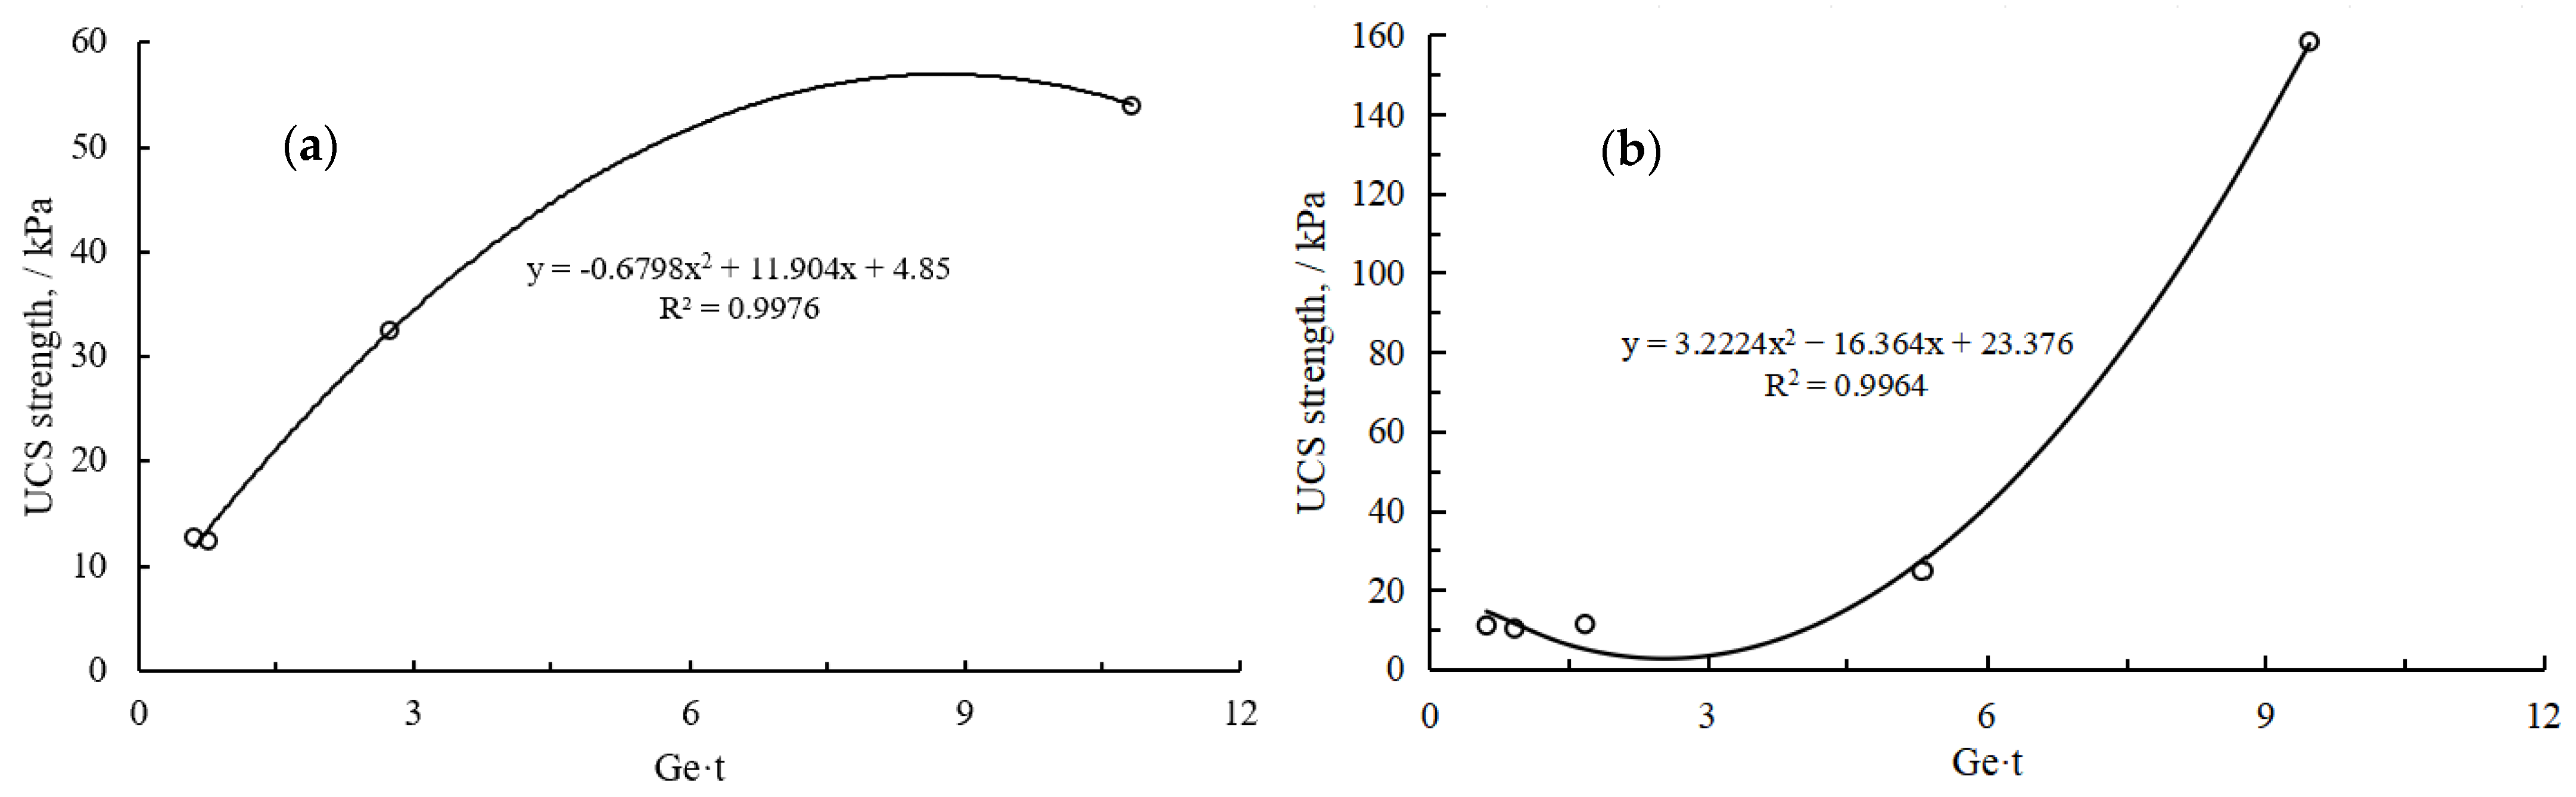
4.3.1. Relation Between UCS and Particle Grading Entropy

Based on the result of the Grey Relation Analysis (GRA), particle grading entropy ( G e ) is identified as the most influential factor affecting the UCS of CTS. Therefore, this section further explores the relationship between particle grading entropy ( G e ) and the UCS. Since the UCS is also influenced by curing age, this factor is incorporated into the analysis. Using a data-fitting approach, the relationship between UCS and particle grading entropy G e for Hangzhou CTS, considering varying curing age, is illustrated in Figure 5a. The corresponding fitting equation is expressed as:
y = 0.6798 x 2 + 11.904 x + 4.85
Similarly, the relationship for Taizhou CTS is shown in Figure 5b, with the fitting equation given as:
y = 3.2224 x 2 16.364 x + 23.376
Since the UCS of both soils can be well represented by a polynomial function, a unified empirical relationship can be established as follows:
y = a x 2 b x + c
where, y is the UCS of CTS; x is the product of particle grading entropy G e and curing age t , i.e., x = G e · t ; and a, b, and c are fitting parameters determined by the soil type.

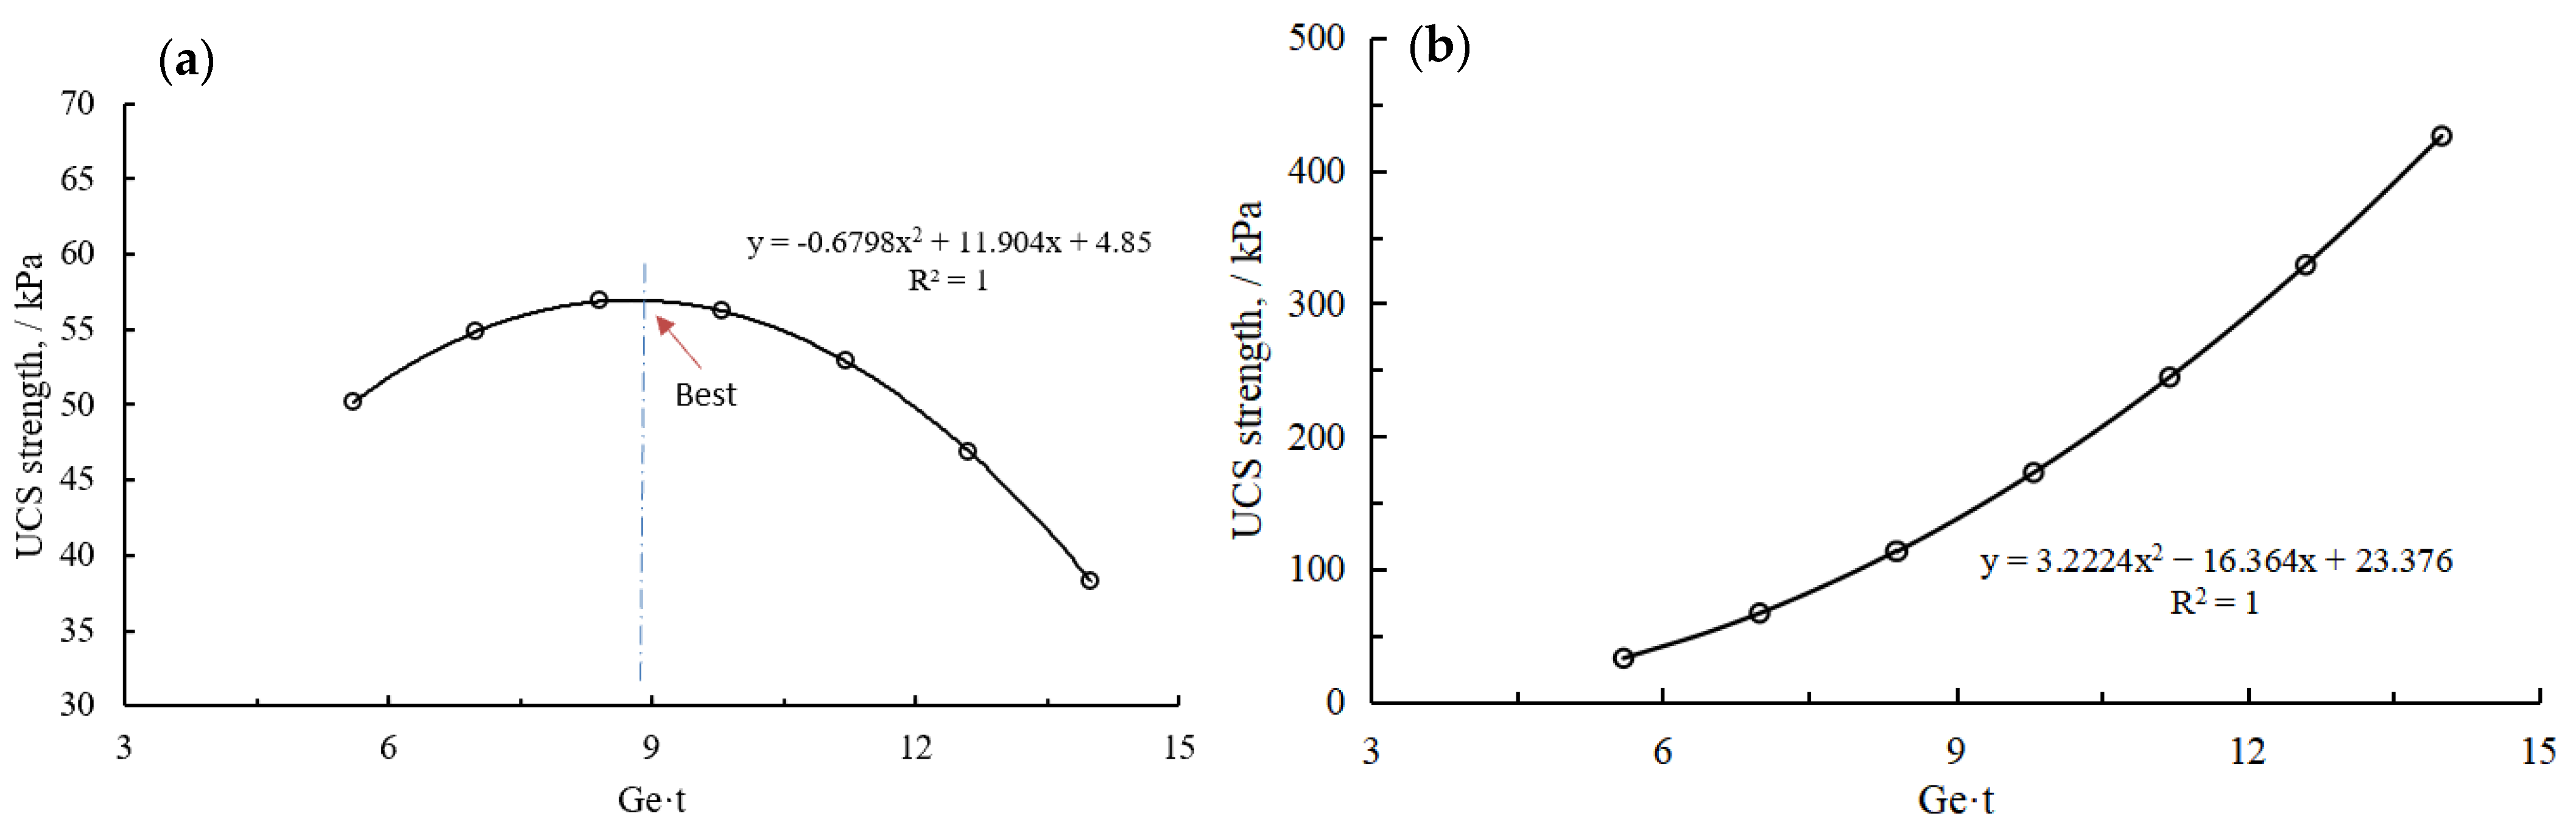
4.3.2. Sensitivity Analysis of Particle Grading Entropy

As particle grading entropy can be adjusted through cement hydration or by mixing sand and small gravel into the soil, understanding its impact on UCS is of practical significance. In this section, a sensitivity analysis is conducted to examine how variations in particle grading entropy affect UCS. Assuming G e varies within the range of 0.2 to 0.5, with increments of 0.05, and the curing age is fixed at 28 days, the optimal G e value for enhancing CTS strength can be determined through sensitivity analysis. The results are presented in Figure 6.
As shown in Figure 6a, for Hangzhou CTS, UCS initially increases with G e , reaches a peak, and then declines. The optimal G e value, corresponding to the maximum UCS, is 0.3125, with a UCS of 56.96 kPa. In contrast, Figure 6b demonstrates that for Taizhou CTS, UCS increases monotonically with G e . The optimal value within the studied range is 0.5, yielding a UCS of 425.87 kPa.

5. Conclusions

This study investigates the micro-mechanism of strength development in cement-treated soils (CTSs) through qualitative and quantitative analyses. The following conclusions are drawn:
1.
Microstructural modifications govern strength improvement in CTS. Key microstructural parameters—including image porosity ( n s ), mean shape factor ( F ), particle grading entropy ( G e ), and directional probability entropy ( H m )—effectively capture the micro-mechanisms underlying strength development. These parameters provide a reliable framework for analyzing strength evolution in cement-treated soils;
2.
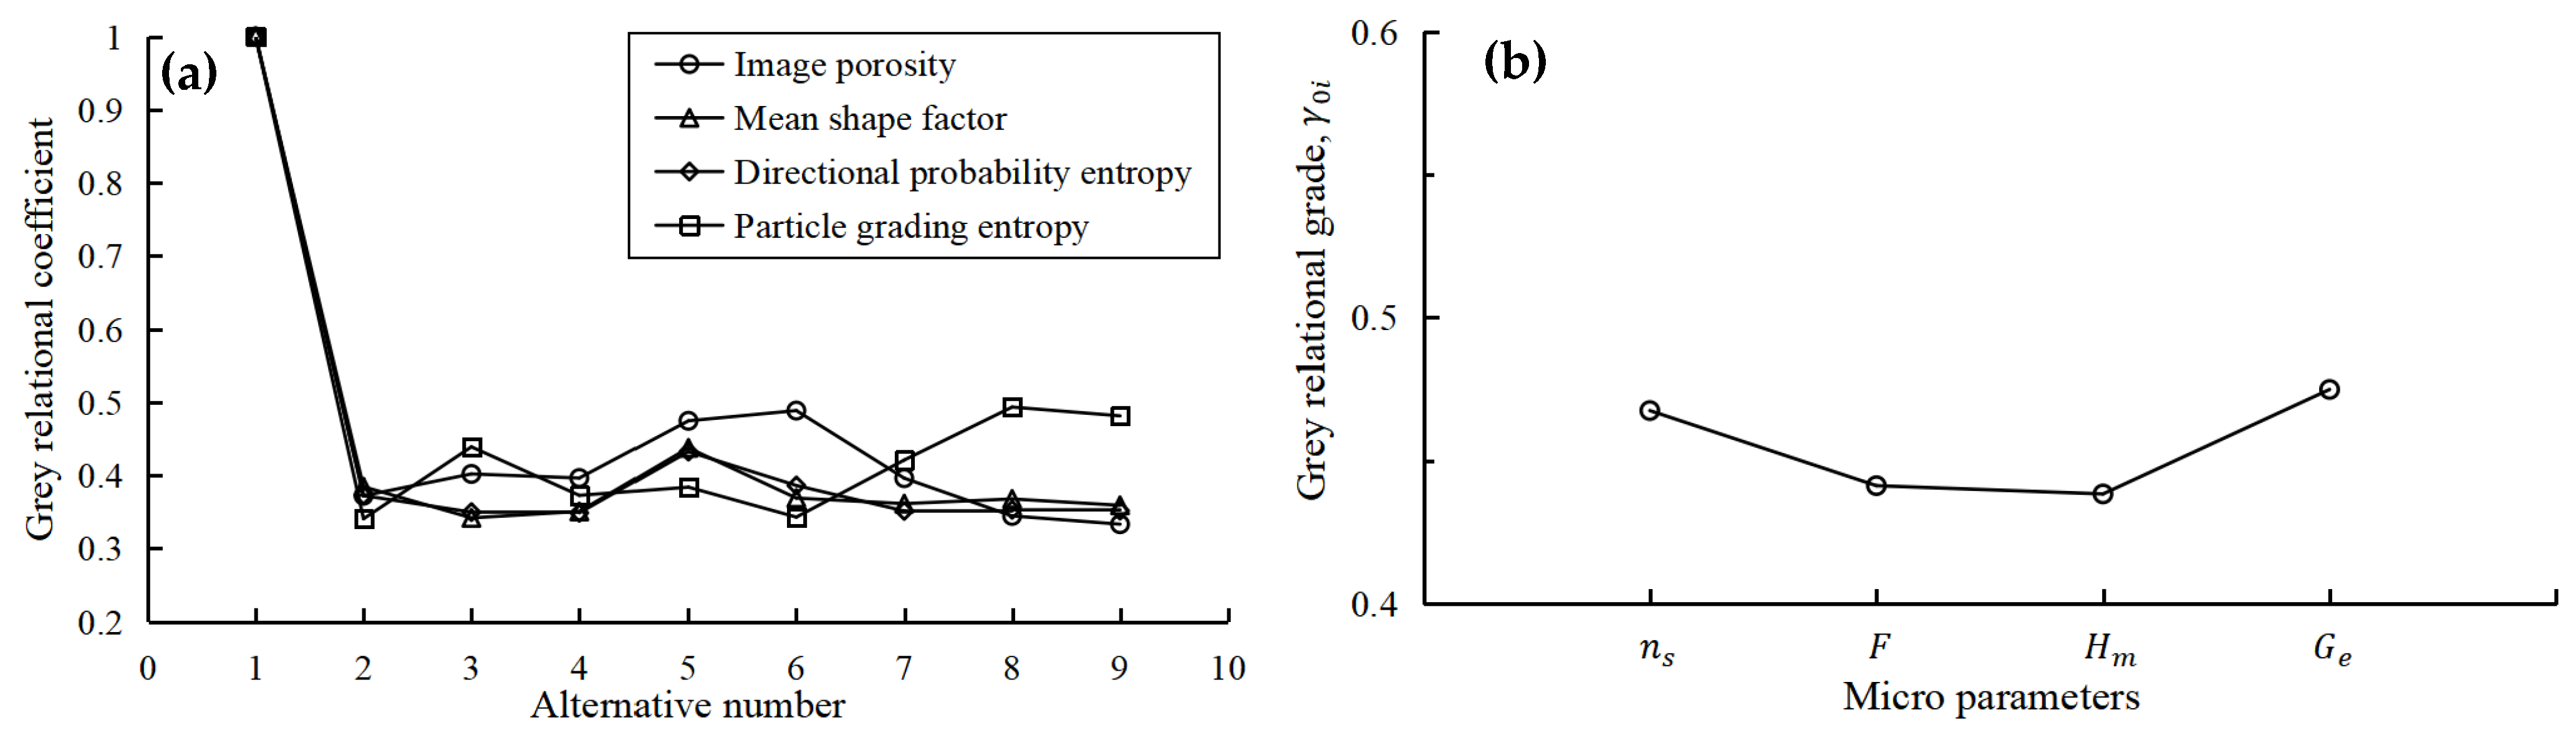
Sensitivity analysis highlights the dominant microstructural factors influencing strength. Grey Relation Analysis (GRA) reveals the relative importance of these parameters, with the order of influence being G e > n s > F   a n d   H m . Changing particle grading entropy ( G e ) is therefore recommended as a practical strategy for achieving higher CTS strength;
3.
This study establishes a quantitative foundation for strength optimization. A polynomial relationship has been established between particle grading entropy G e and macro-scale strength behavior, providing a quantitative basis for strength optimization. Sensitivity analysis indicates that the optimal value of G e for enhancing Hangzhou CTS strength is 0.3125 while, for Taizhou CTS, it is 0.5. This study offers valuable insights for material design and optimization in engineering applications.
Future work will focus on expanding the methodology to different soil types, cement contents, and curing durations to enhance its general applicability. Additionally, incorporating advanced image analysis techniques, such as 3D imaging and machine learning models, could further improve the predictive accuracy of microstructural assessments, providing a more detailed understanding of CTS performance under varying environmental conditions.

Author Contributions

Conceptualization, Z.D. and R.X.; methodology, L.X.; software, Q.L.; formal analysis, C.Y.; resources, R.X.; data curation, G.F.; writing—original draft preparation, L.X.; writing—review and editing, L.X.; visualization, Z.D.; supervision, R.X.; funding acquisition, Z.D. and C.Y. All authors have read and agreed to the published version of the manuscript.

Funding

This research was funded by the Key Research and Development Program of Zhejiang, grant number 2023C03182; the National Natural Science Foundation of China, grant numbers 52178400 and 52278418; the Key Project of Zhejiang Provincial Natural Science Foundation, grant number LHZ20E080001; the Zhejiang Provincial Key Research and Development Project, grant number 2020C01102; Open Fund from Engineering Research Center for Geological Environment and Underground Space of Jiangxi Province, grant number JXDHJJ2024-004; the Opening Fund of State Key Laboratory of Frozen Soil Engineering (grant number: SKLFSE202012); the National Natural Science Foundations of China (grant number: 42107203); the Natural Science Foundation Projects of Jiangxi Province (grant number: 20232BAB214077, 20242BAB25305); and Underground Engineering Risk Digital Control Research Center of Jiangxi Province (grant number: JXDFJJ2024-007).

Data Availability Statement

The raw data supporting the conclusions of this article will be made available by the authors upon request.

Conflicts of Interest

The authors declare no conflicts of interest.

Abbreviations

The following abbreviations are used in this manuscript:
CTSCement-Treated Soil
UCSUnconfined Compressive Strength
SEMScanning Electron Microscopy
PCASPore/Crack Analysis System
GRAGrey Relation Analysis

References

  1. Feng, G.H.; Xu, C.J.; Liang, L.J.; Tey, M.W.; Chi, M.L.; Ge, S.Q. Simplified method for evaluating shield tunnel deformation induced by adjacent excavation. Int. J. Numer. Anal. Methods Geomech. 2023, 47, 54–81. [Google Scholar] [CrossRef]
  2. Khan, Z.A.; Balunaini, U.; Nguyen, N.H.; Costa, S. Evaluation of cement-treated recycled concrete aggregates for sustainable pavement base/subbase construction. Constr. Build. Mater. 2024, 449, 138417. [Google Scholar] [CrossRef]
  3. Liu, C.; Berard, C.; Deng, L. Engineering behavior of cement-treated stiff clay subjected to freezing/thawing cycles. Cold Reg. Sci. Technol. 2023, 206, 103743. [Google Scholar] [CrossRef]
  4. Niu, W.; Guo, B.; Li, K.; Ren, Z.; Zheng, Y.; Liu, J.; Lin, H.; Men, X. Cementitous material based stabilization of soft soils by stabilizer: Feasibility and durabiliy assessment. Constr. Build. Mater. 2024, 425, 136046. [Google Scholar] [CrossRef]
  5. Chen, W.B.; Zhou, W.H.; Yin, Z.Y. Recent Development on Macro–Micro Mechanism of Soil-Structure Interface Shearing Through DEM. Arch. Comput. Methods Eng. 2023, 30, 1843–1862. [Google Scholar] [CrossRef]
  6. Cotecchia, F.; Guglielmi, S.; Cafaro, F.; Gens, A. Micro to macro investigation of clays advising their constitutive modelling-part I. Soils Rocks 2024, 47, e2024011723. [Google Scholar] [CrossRef]
  7. Gaucher, E.C.; Blanc, P. Cement/clay interactions-a review: Experiments, natural analogues, and modeling. Waste Manag. 2006, 26, 776–788. [Google Scholar] [CrossRef]
  8. Lorenzo, G.A.; Bergado, D.T. Fundamental parameters of cement-admixed clay—New approach. J. Geotech. Geoenviron. Eng. 2004, 130, 1042–1050. [Google Scholar] [CrossRef]
  9. Ng, C.; Alengaram, U.J.; Wong, L.S. A review on microstructural study and compressive strength of geopolymer mortar, paste and concrete. Constr. Build. Mater. 2018, 186, 550–576. [Google Scholar] [CrossRef]
  10. Bi, J.; Chian, S.C. Modelling of three-phase strength development of ordinary Portland cement-and Portland blast-furnace cement-stabilised clay. Geotechnique 2020, 70, 80–89. [Google Scholar] [CrossRef]
  11. Uddin, K.; Balasubramaniam, A.; Bergado, D. Engineering behavior of cement-treated Bangkok soft clay. Geotech. Eng. 1997, 28, 89–119. [Google Scholar]
  12. Horpibulsuk, S.; Miura, N.; Nagaraj, T. Assessment of strength development in cement-admixed high water content clays with Abrams’ law as a basis. Geotechnique 2003, 53, 439–444. [Google Scholar] [CrossRef]
  13. Horpibulsuk, S.; Miura, N.; Nagaraj, T.S. Clay-water/cement ratio identity for cement admixed soft clays. J. Geotech. Geoenvironmental Eng. 2005, 131, 187–192. [Google Scholar] [CrossRef]
  14. Horpibulsuk, S.; Rachan, R.; Suddeepong, A.; Chinkulkijniwat, A. Strength development in cement admixed Bangkok clay: Laboratory and field investigations. Soils Found. 2011, 51, 239–251. [Google Scholar] [CrossRef]
  15. He, S.H.; Yin, Z.Y.; Ding, Z.; Li, R.D. Particle morphology and principal stress direction dependent strength anisotropy through torsional shear testing. Can. Geotech. J. 2024. [Google Scholar] [CrossRef]
  16. Horpibulsuk, S.; Rachan, R.; Chinkulkijniwat, A.; Raksachon, Y.; Suddeepong, A. Analysis of strength development in cement-stabilized silty clay from microstructural considerations. Constr. Build. Mater. 2010, 24, 2011–2021. [Google Scholar] [CrossRef]
  17. Li, R.; Yin, Z.-Y.; He, S.H. 3D reconstruction of arbitrary granular media utilizing vision foundation model. Appl. Soft Comput. 2025, 169, 112599. [Google Scholar] [CrossRef]
  18. Guo, Q.; Wei, M.L.; Wu, H.L.; Gu, Y. Strength and micro-mechanism of MK-blended alkaline cement treated high plasticity clay. Constr. Build. Mater. 2020, 236, 117567. [Google Scholar] [CrossRef]
  19. Lei, H.Y.; Wang, L.; Jia, R.; Jiang, M.; Zhang, W.; Li, C. Effects of chemical conditions on the engineering properties and microscopic characteristics of Tianjin dredged fill. Eng. Geol. 2020, 269, 105548. [Google Scholar] [CrossRef]
  20. Zhu, K.L. Study on Solidification of Mucky Soil and Road Performance. Ph.D. Thesis, Zhejiang University, Hangzhou, China, 2021. [Google Scholar]
  21. Deng, Y.W. Soft Clay Micro-Quantitative Research and Its Application. Ph.D. Thesis, Zhejiang University, Hangzhou, China, 2015. [Google Scholar]
  22. Xu, L.Y.; Xu, R.Q.; Shashank, B.S.; Chen, X.H.; Yu, J.L.; Wu, C.Z. An Improved Quantification Method for Characterization of Clay Microstructure Using SEM. Environ. Geotech. 2022, 11, 319–338. [Google Scholar] [CrossRef]
  23. Wang, J.; Xie, J.; Wang, Y.; Liu, Y.; Ding, Y. Rheological properties, compressive strength, hydration products and microstructure of seawater-mixed cement pastes. Cem. Concr. Compos. 2020, 114, 103770. [Google Scholar] [CrossRef]
  24. Wang, Y.; Zhang, W.; Wang, J.; Huang, R.; Lou, G.; Luo, S. Effects of coarse aggregate size on thickness and micro-properties of ITZ and the mechanical properties of concrete. Cem. Concr. Compos. 2024, 154, 105777. [Google Scholar] [CrossRef]
  25. Mota, B.; Matschei, T.; Scrivener, K. Impact of NaOH and Na2SO4 on the kinetics and microstructural development of white cement hydration. Cem. Concr. Res. 2018, 108, 172–185. [Google Scholar] [CrossRef]
  26. Xu, L.; Wang, J.; Li, K.; Li, M.; Lin, S.; Hao, T.; Wang, T.; Guo, Y.; Ling, Z. Investigations on the rehydration of recycled blended SCMs cement. Cem. Concr. Res. 2023, 163, 107036. [Google Scholar] [CrossRef]
  27. Xu, L.; Wang, J.; Huang, R.; Li, B.; Ran, B.; Hu, X. Investigations on micro-mechanical properties of the ITZs between recycled aggregates and recycled cement paste. Constr. Build. Mater. 2024, 450, 138640. [Google Scholar] [CrossRef]
  28. Peng, Y.; Zhao, G.R.; Wang, P.M.; Liu, X.P.; Zhang, G.F. Study on the retardation of re-dispersible polymer powders on cement hydration based on morphologies of Ca(OH)2. J. Chin. Electron Microsc. Soc. 2016, 35, 490–495. [Google Scholar]
  29. He, J.H. Evolution Characteristics and Mechanism of Microstructure and Properties of High Early Strength Cement Paste. Ph.D. Thesis, Central South University, Changsha, China, 2022. [Google Scholar]
  30. Tan, X.R.; Deng, J.L. Grey relational analysis: A new method of multi-factor statistical analysis. Stat. Res. 1995, 11, 46–48. [Google Scholar]
  31. Kuo, Y.; Yang, T.; Huang, G.W. The use of grey relational analysis in solving multipleattribute decision-making problem. Comput. Ind. Eng. 2008, 55, 80–93. [Google Scholar] [CrossRef]
Figure 1. SEM images of Hangzhou CTS (magnification 5000×). (a) 28 days curing time. (b) 3 days curing time.
Buildings 15 02370 g001
Figure 2. Conceptual model of strength micro-mechanism. (a) Uncemented soil. (b) Cement-treated soil.
Buildings 15 02370 g002
Figure 3. Evolution of micro-parameters with curing age. (a) Hangzhou CTS; (b) Taizhou CTS.
Buildings 15 02370 g003
Figure 4. Results of Grey Relation Analysis. (a) Grey relational coefficients of all cemented clay samples. (b) Grey relational grades of all cemented clay samples.
Buildings 15 02370 g004
Figure 5. Relationship between UCS and particle grading entropy G e . (a) Hangzhou CTS. (b) Taizhou CTS.
Buildings 15 02370 g005
Figure 6. Sensitivity analysis of particle grading entropy G e . (a) Hangzhou CTS. (b) Taizhou CTS.
Buildings 15 02370 g006
Table 1. Physical properties of Hangzhou soil.
Water   Content ,   ω (%) Unit   Weight ,   γ (kN·m−3) Specific   Gravity ,   d s Liquid   Limit ,   ω L Plastic   Limit ,   ω P
30.020.12.50538.021.4
Table 2. Physical properties of Taizhou soil.
Water   Content ,   ω (%) Unit   Weight ,   γ (kN·m−3) Specific   Gravity ,   d s Liquid   Limit ,   ω L Plastic   Limit ,   ω P
59.817.32.81751.924.5
Table 3. Cement content and curing age of cemented clay samples.
No.Original ClayWater Content (%)Cement Content (%)Curing Age (Days)
1Hangzhou clay381528
2Hangzhou clay38157
3Hangzhou clay38153
4Hangzhou clay38163
5Taizhou clay401528
6Taizhou clay401514
7Taizhou clay40157
8Taizhou clay40153
9Taizhou clay40163
Table 4. Definition of micro-parameters for the quantitative analysis of CTS.
No.Micro-ParameterDefinitionCalculation EquationMeaning of Parameters
1Directional probability entropy,
H m
Orderliness of particles’ arrangement H m = i = 1 k P i α p l o g k P i α p α is the direction of the solid, α belongs to [0–180°];
k is the total number of equally divided areas in the whole solid direction range [0–180°]. In this paper, it is set as k = 18 ;
F i α is the percentage of solids whose directions α belong to a specific range, such as [0°, 10°).
2Image porosity, n s Ratio of pore area to total image area n s = A 1 A 0 Pore area A 1 in the image;
Total image area A 0 in the image.
3Mean shape factor,
F
Shape of particles F = i = 1 m F i m
F i = P S
m is the total number of particles;
F i is the shape factor of the No. i th solid;
P is the perimeter of a circle that has the same area as the particle;
S is the actual perimeter of the same particle.
4Particle grading entropy,
G e
Distribution of particles’ size G e = i = 1 l G i d l o g l G i d
d = d i d m a x
d is the normalized diameter of the solid, its value belongs to (0,1];
d i is the diameter of each solid, while d m a x is the biggest diameter of all;
l is the total number of equally divided areas in the whole solid diameter range. In this paper, it is set l = 20 ;
G i d is the percentage of solids whose normalized diameter d belongs to a specific range, such as [0, 0.1).
Table 5. Micro-parameters of untested Hangzhou CTS samples.
No.Cement Slurry
Content
(%)
Curing Age
(Days)
Porosity Before Test,
n
UCS
(kPa)
Micro-Parameter Value
n s G e H m F
115280.488454.080.35800.38620.98910.4220
21570.493832.550.29140.39250.99120.4546
31530.492812.420.33570.25840.99190.4121
41630.495712.90.41250.20070.98900.4031
Table 6. Micro-parameters of untested Taizhou CTS samples.
No.Cement Slurry
Content
(%)
Curing Age
(Days)
Porosity Before Test,
n
UCS
(kPa)
Micro-Parameter Value
n s G e H m F
115280.5575158.260.40080.33840.99380.4298
215140.567324.750.39940.37920.98970.4100
31570.528811.330.32570.23970.99130.4430
41530.552910.210.32990.30560.98840.4242
51630.5913110.42720.20510.98120.4120
Table 7. Grey relational grade γ 0 i of comparative sequences.
Reference SequenceGrey Relational Grade of Comparability Sequences
γ 0 i   of   n s γ 0 i   of   F γ 0 i   of   H m γ 0 i   of   G e
all samples0.46760.44130.43840.4750
Disclaimer/Publisher’s Note: The statements, opinions and data contained in all publications are solely those of the individual author(s) and contributor(s) and not of MDPI and/or the editor(s). MDPI and/or the editor(s) disclaim responsibility for any injury to people or property resulting from any ideas, methods, instructions or products referred to in the content.

