Article

Two-Dimensional Geometry Representation Learning-Based Construction Workers Activities Detection with Flexible IMU Solution

1
School of Management Science and Real Estate, Chongqing University, Chongqing 400044, China
2
Zhejiang Jiangnan Project Management Co., Ltd., Hangzhou 310013, China
3
School of Computer Science and Technology, Zhejiang Sci-Tech University, Hangzhou 310018, China
*
Author to whom correspondence should be addressed.
Buildings 2025, 15(13), 2372; https://doi.org/10.3390/buildings15132372
Submission received: 4 June 2025 / Revised: 24 June 2025 / Accepted: 1 July 2025 / Published: 6 July 2025

Abstract

Recognizing construction workers’ activities is essential for effective construction management. The complexity of construction sites and the varied, dynamic nature of workers’ actions make automatic monitoring of their behaviors challenging. This study introduces a flexible IMU solution to detect construction worker activities, aiming to bypass the need for IMU devices to be rigidly attached to workers. The approach employs a 2D geometric representation algorithm that extracts features at the application level, independent of the IMU axes. Evaluations using the VTT-ConIoT public dataset for construction worker activities demonstrated that the proposed method performed effectively without fixed IMU attachments, enhancing practicality in real-world contexts.

1. Introduction

Although information technologies and robotic equipment are increasingly being employed at construction sites, the construction industry undoubtedly remains labor-intensive. Construction workers continue to play critical roles in the field. Therefore, recognizing their activities is essential for various aspects of construction management, including productivity, safety, and project progress [1].
Vision and IMU are two primary technologies used to recognize construction workers’ activities automatically. Computer vision technologies enable site cameras to capture abundant scene information, facilitating the recognition of workers’ activities. However, obstructions at construction sites present significant challenges, limiting the vision method to the monitoring of specific areas. IMU methods involve using inertial sensors to monitor workers’ kinetics and physical data, allowing the deduction of their behaviors. Since IMU sensors are attached to the workers’ bodies through wearable devices, obstructions do not hinder the recognition of their activities.
Because the human body is a complex kinetic system, capturing the detailed behaviors of workers requires multiple IMU sensors to be attached at specific locations on their bodies. This approach is impractical for widespread use at real construction sites, particularly for long-term observation [2]. Therefore, we believe the key is to eliminate the necessity for sensors to be rigidly attached to workers during the action recognition process.
We propose a construction work activity recognition method that does not require IMU sensors to be fixed to the human body. The key contribution of this paper is a 2D geometric representation algorithm. This algorithm converts raw IMU data into high-level application features, without relying on the axis of the IMU device. As a result, it supports more flexible and efficient recognition of worker activities. All code and data can be accessed through https://github.com/hainan89/2D-Geometry-Representation-Learning (accessed on 3 June 2025).
The remainder of this paper is structured as follows: Section 2 reviews related research on construction work activity recognition. Section 3 outlines the methodology of the proposed model. Section 4 presents the case study. Section 5 provides the conclusions and a summary of the research.

2. Related Work

Technologies for recognizing and monitoring construction workers’ activities are categorized into three main types: computer-vision-based, inertial sensor (IMU)-based, and fusion methods [3]. In vision-based approaches, deep learning models demonstrate strong capabilities in processing images and videos; they are widely used to identify unsafe worker behaviors [4,5,6]. Convolutional Neural Networks (CNNs) are utilized for real-time alerts of personnel intrusion [7], and models such as Faster R-CNN are employed to detect compliance with helmet-wearing [8]. Some research has incorporated Long Short-Term Memory (LSTM) networks to handle temporal video data [9], and Transformer models are used to capture spatiotemporal features [6]. Attention-based image description techniques assist in extracting unsafe worker behaviors from complex scenes [10]. Although vision-based methods can capture detailed scene information under ideal conditions, they heavily depend on image quality and lighting, with occlusion being a significant challenge, especially in crowded construction sites [11].
Attaching IMU sensors to construction workers’ bodies addresses the challenge of continuous observation, offering clear advantages in activity detection. IMU devices primarily gather motion data, using machine learning for behavior recognition and classification [12,13]. These studies aim to automatically monitor worker activities and alert them to potential safety risks. Mekruksavanich et al. proposed a method that combines CNNs, residual blocks, and multi-branch aggregation modules to recognize complex worker activities, achieving high accuracy on the public IMU dataset VTT-ConIoT [14]. Hong et al. classified scaffolding worker safety behaviors using a Gramian Angular Field (GAF) CNN, demonstrating the ability to automatically assess safety protocol compliance [15]. Choo et al. developed an automated system integrating barometers and IMUs to identify high-altitude work and detect safety hook connections [16].
On the other hand, researchers have identified that wearable sensors are susceptible to environmental disturbances, impacting their reliability [17,18]. Although multi-modal data fusion attempts to mitigate these issues, limitations in IMU technology persist. Sun et al. emphasized that construction sites feature frequent interactions among people, networks, and physical environments, complicating an IMU’s ability to capture and analyze risks comprehensively [19]. Hu et al. and Duan et al. noted that IMU-based methods often overlook personalized worker stability features, diminishing the effectiveness of interventions [20,21]. Kim et al. observed during SCST tests on small construction sites that current IMU-based perception methods require sensors to be attached to specific body areas, placing additional burdens on workers engaged in heavy labor [22]. As a result, without appropriate technological enhancements, integrating sensor technology with construction workers’ tasks at real construction sites remains challenging.
Fusion techniques have been proposed to overcome the limitations of computer vision and IMU-based methods [23]. Integrating IMU sensors with computer vision for worker behavior recognition and monitoring has shown promising progress. Research has explored deep learning models such as CNNs [7], RNNs, and LSTMs [24] for activity recognition using IMU and video data. Transformer-based models are being investigated for capturing spatial and temporal features in video data [6]. Furthermore, some studies have examined multi-modal fusion strategies that combine data from various sensors to enhance classification performance, especially under challenging environmental conditions [25].
Summarizing current research, studies have primarily focused on specific tasks such as helmet detection [26], fall detection [27], or intrusion detection in hazardous zones [28,29]. Vision-based recognition accuracy is compromised under adverse conditions like low lighting and occlusion [18]. IMU-based detection presents challenges due to its inflexible setup, which hinders worker acceptance. Therefore, improving sensor deployment strategies is essential for effective long-term activity monitoring.

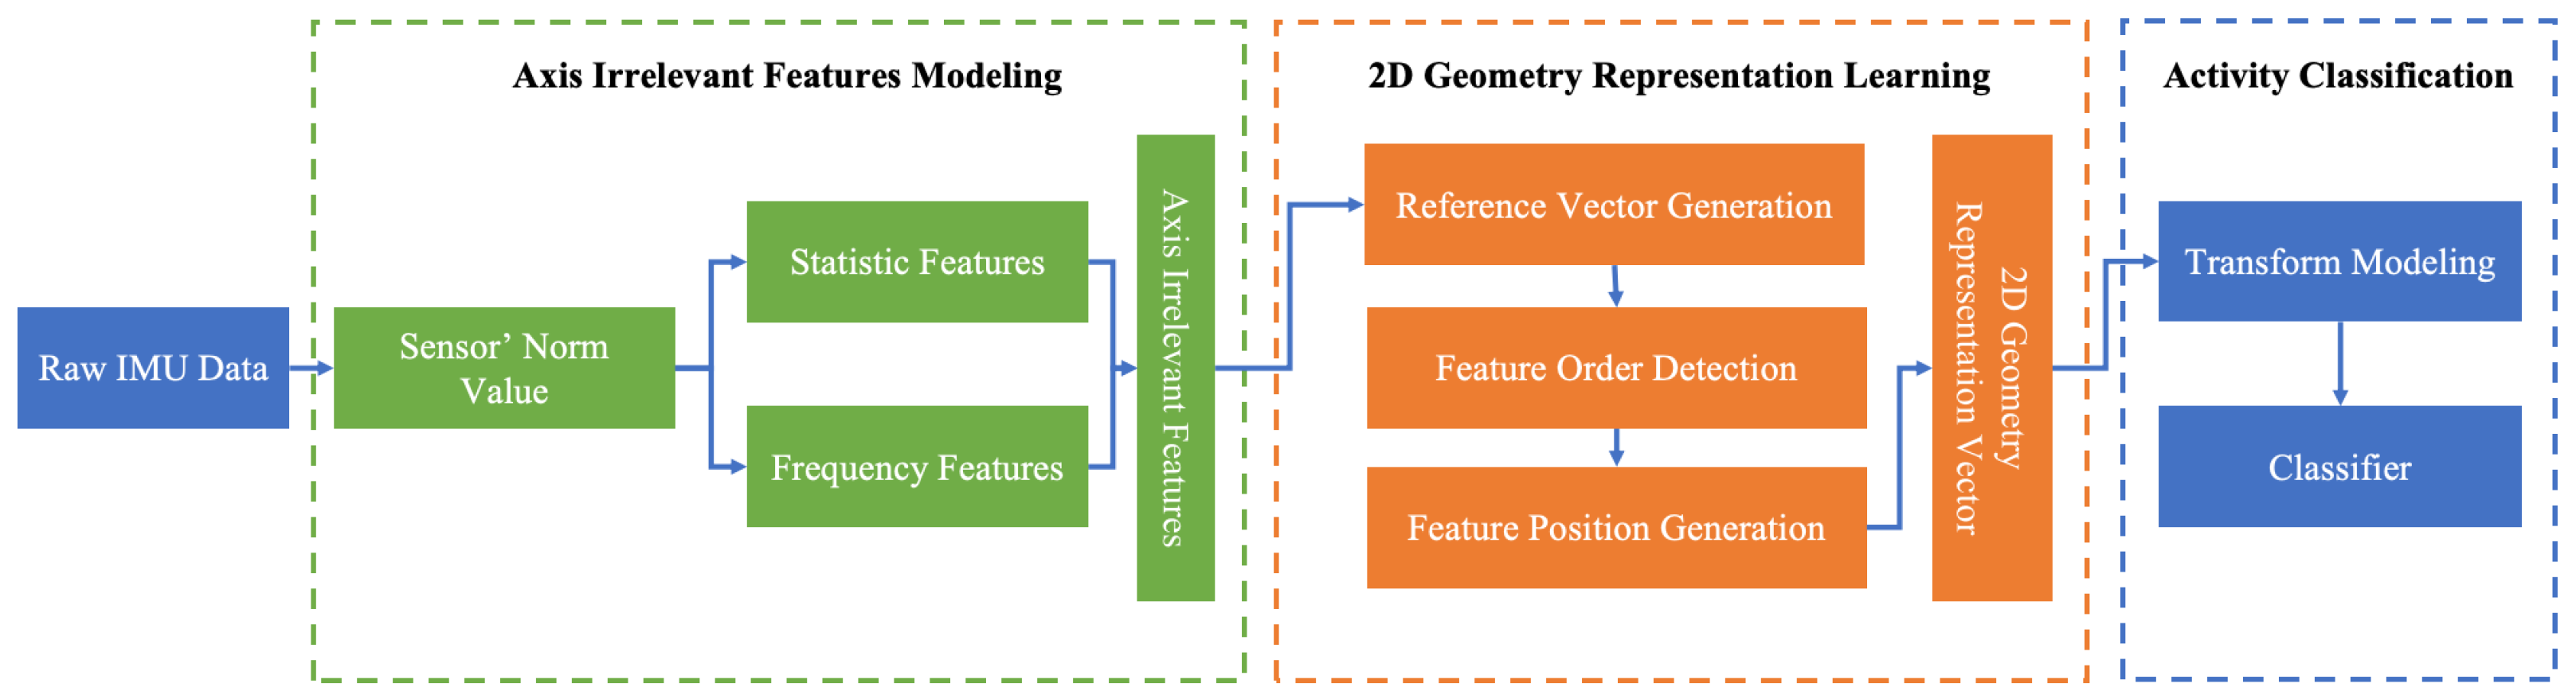
3. Flexible IMU Solution for Construction Worker Activity Detection

IMU-based construction worker activity recognition generally follows three steps: (1) deploying IMU devices, (2) capturing kinetic data from workers, and (3) recognizing worker activities. However, in traditional methods, the IMU sensor deployment strategy significantly affects the implementation of activity recognition models, because it dramatically alters the features used.
To mitigate the impact of the sensor deployment strategy, the proposed model includes a step that models features independently of individual data axes. A high-dimensional data skeleton projection algorithm was also designed (2D Geometry Representation Learning) to further classify construction worker activities. The overall framework is illustrated in Figure 1.

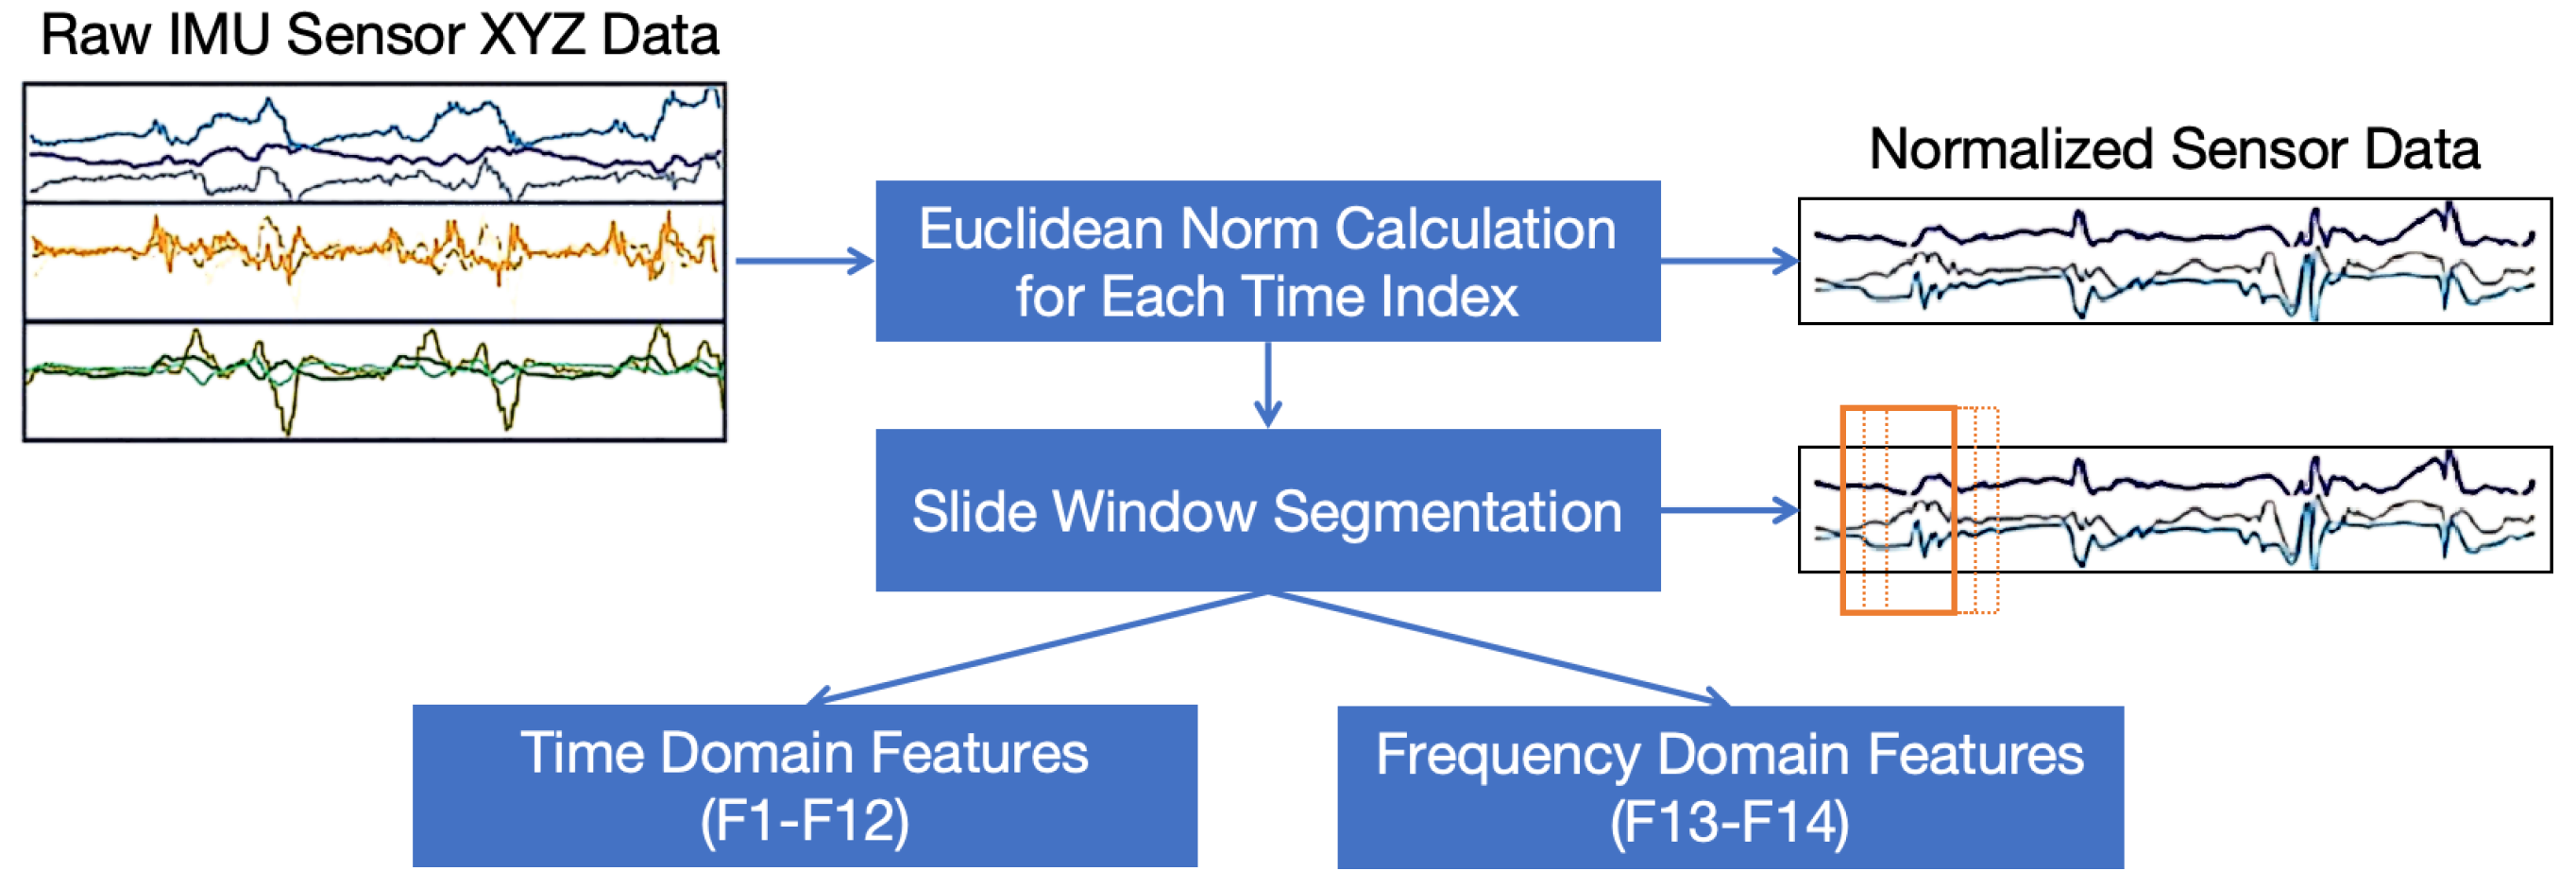
3.1. IMU Data Axis-Irrelevant Feature Modeling

An IMU device typically contains three sensors: an accelerometer, a gyroscope, and a magnetometer, forming a 9-axis dataset. A fixed attachment sensor deployment strategy can provide prior knowledge, ensuring the sensor axes maintain constant directions, such as on the front, back, or left and right sides of the construction worker’s body. However, when considering non-fixed-attachment IMU deployment, this prior knowledge becomes ineffective, as the IMU device may change its direction at any time, thereby altering the sensors’ global coordinate system. Therefore, generating axis-irrelevant features is crucial.
The absolute norm of the sensor data is used as the base feature. This feature represents the absolute motion strength as a scalar value, which remains unaffected by changes in the global coordinate system. Considering the temporal characteristics of worker activities, this base feature is then examined in both the time and frequency domains. The time domain statistic features include Maximum ( Ma ), Minimum ( Mi ), Mean ( Me ), Standard Deviation ( SD ), Mean Absolute Deviation ( MAD ), Median ( Md ), Skewness ( Sk ), Kurtosis ( Ku ), Root Mean Square ( RMS ), Peak-to-Peak ( PP ), Inter-quartile Range ( IQR ), and Entropy ( En ). The main amplitude ( AMF ) and phase ( PF ) coefficients are employed in the frequency domain.
With axis-irrelevant feature modeling, the original 9-dimensional axis-related data are first reduced to 3-dimensional scalar data corresponding to the three sensors. Subsequently, each scalar dimension is further expanded into 12-dimensional statistical features and a series of frequency features through time and frequency domain analysis. The overall procedure is illustrated in Figure 2. The number of frequency features depends on the size of the time window (w) and the sensor sample rate (r). According to human behavior research theory, worker behavior typically involves low-frequency activities (less than 6 Hz). Following Shannon’s Sampling Theorem, the dimensions of the frequency features are w × r / 2 .
Table 1 illustrates the outcome of the axis-irrelevant feature modeling. The 9-dimensional axis features can then be transformed into high-dimensional scalar features. All the formulas are listed to support detailed feature transformation. For the features F13 and F14, the classical fast Fourier transform algorithm [30] is used, all default parameters are used.

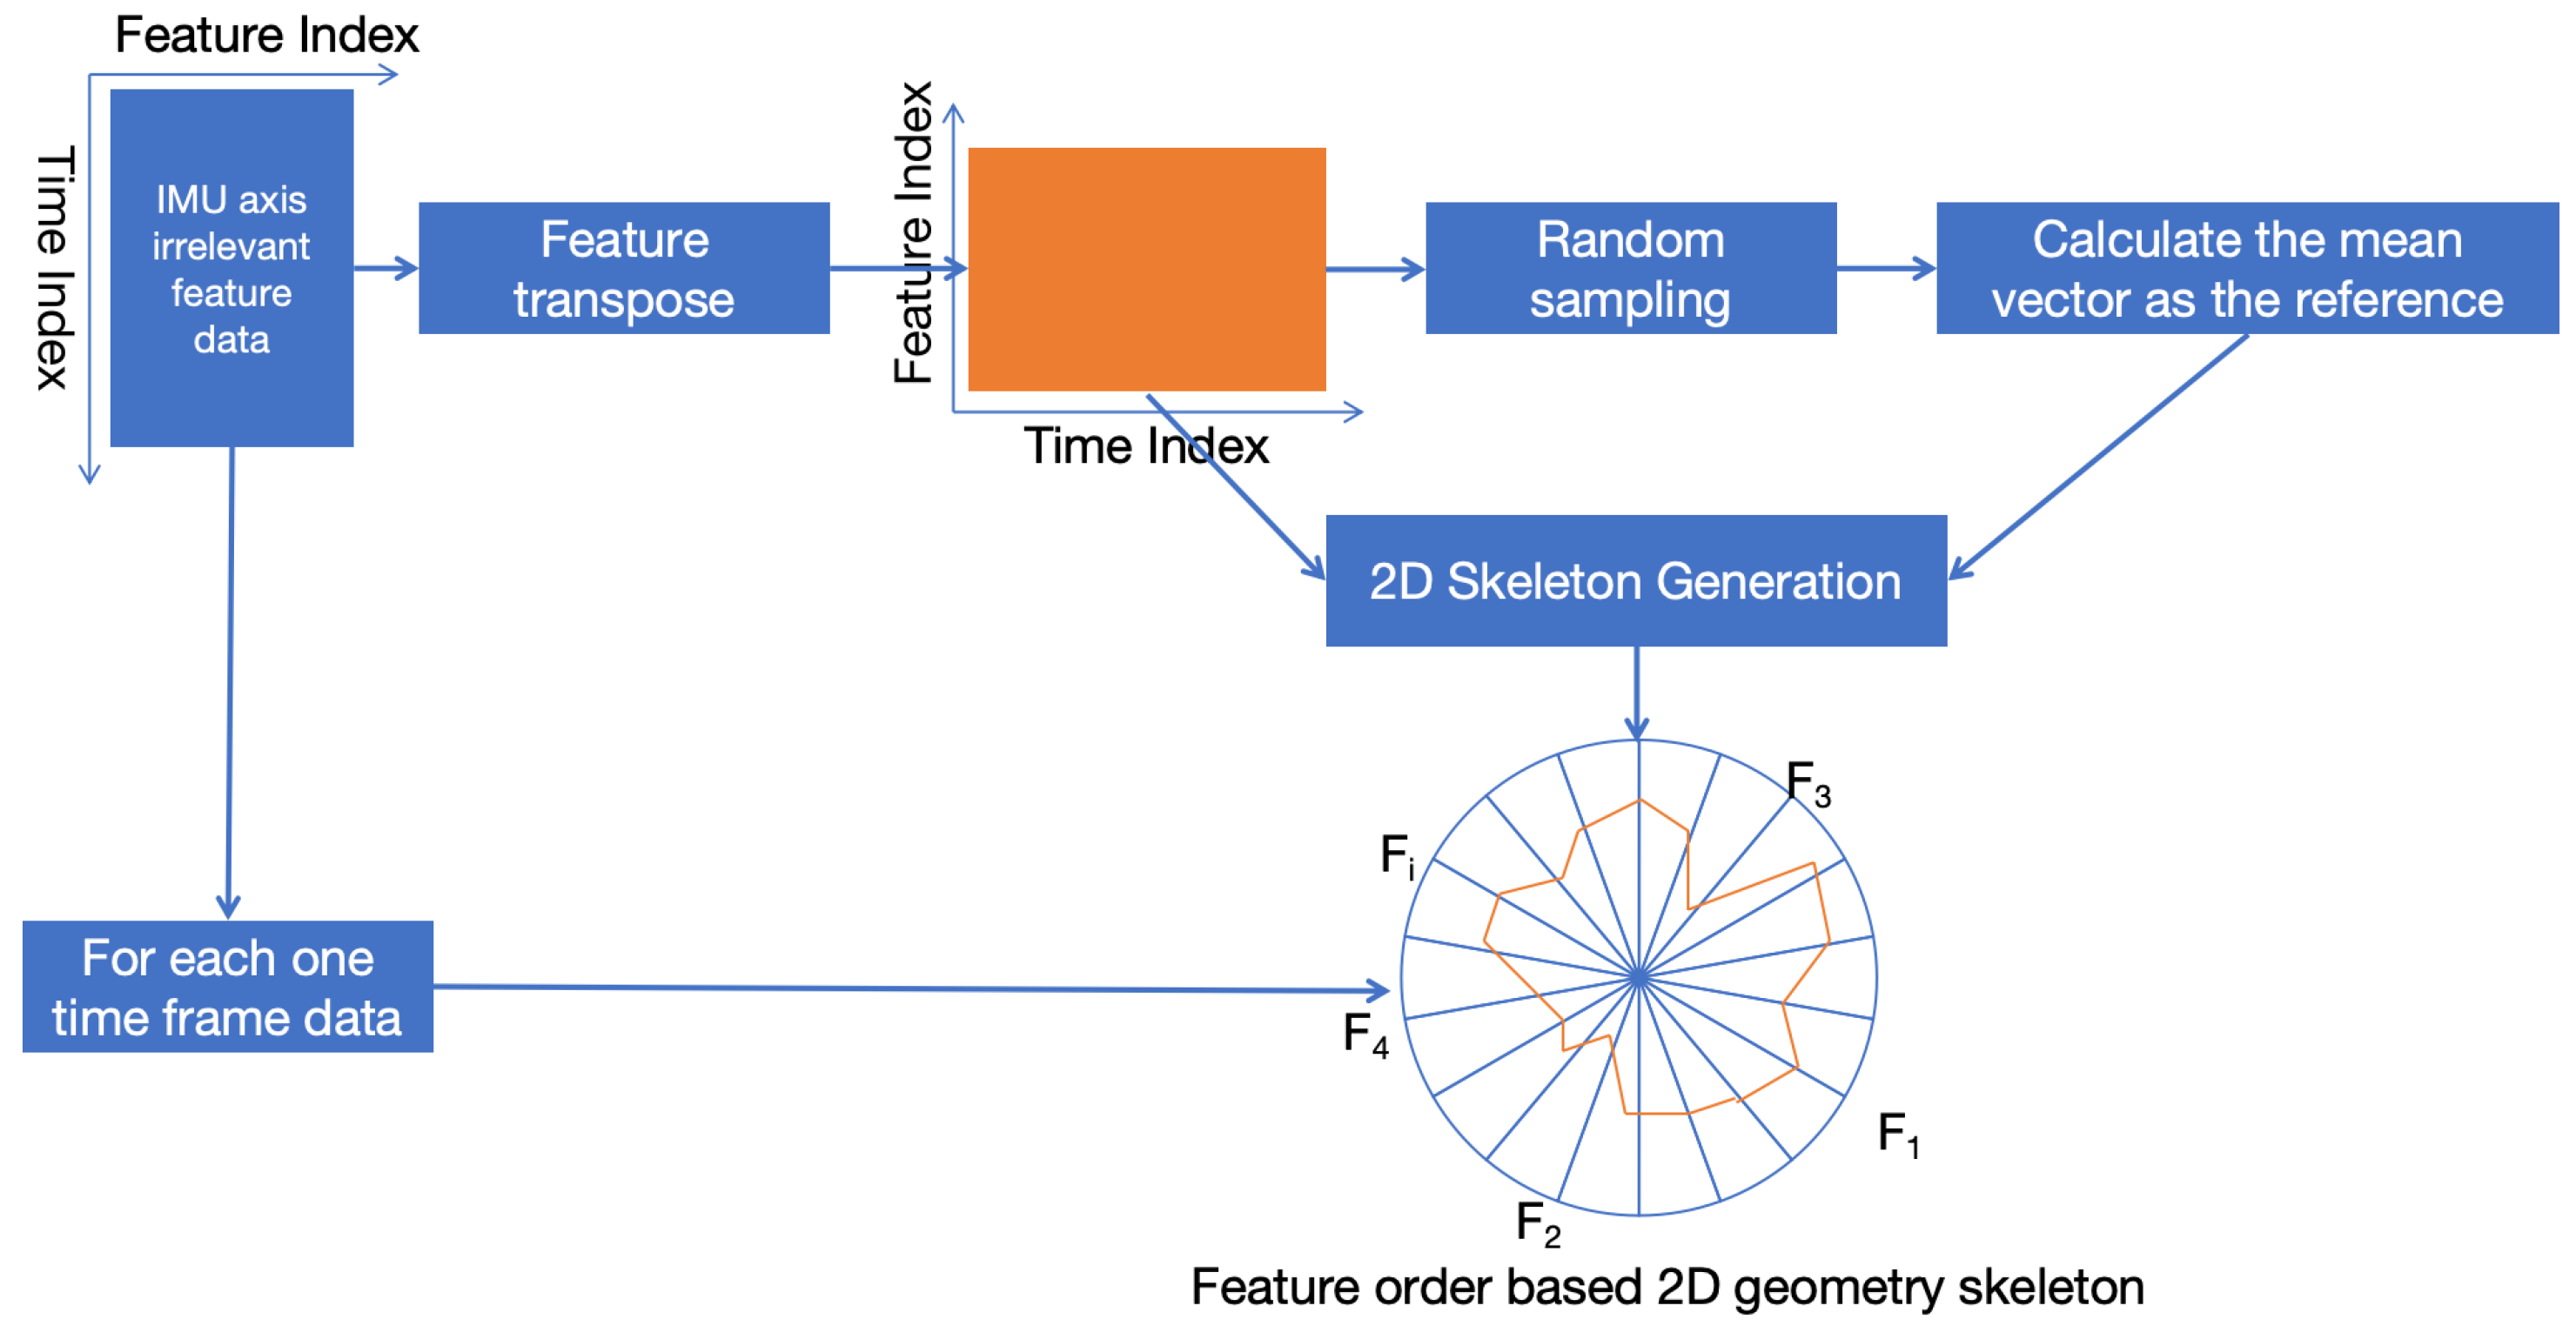
3.2. Two-Dimensional Geometry Representation Learning for IMU Data

Two-dimensional geometry representation learning uses 2D geometric vertices to represent each feature, with the precise feature values indicated by the positions of the corresponding vertices. Algorithm 1 outlines the detailed procedure for the 2D geometry representation learning process. Figure 3 presents the overall procedure.
D is randomly selected from the IMU axis-irrelevant feature data, represented as a 2D matrix, where columns denote features and rows are samples. Dt is the transposition of D, transforming features into samples. Dt is used to generate a geometry skeleton for the data D. The mean point of Dt serves as the reference vector ( Ref ). For each sample ( one _ dt ) in Dt , calculate the angle with the reference vector ( Ref ) to determine the offset angles for each feature of D ( feature _ angle ) in a polar coordinate system. Each raw sample of D is mapped onto a 2D polar coordinate system using the generated feature angles. The feature angle becomes the offset angle ( theta _ i ), while the feature value ( feature _ i ) represents the distance to the origin in the direction of the offset angle. The polar system is then converted into a Cartesian coordinate system. Each feature value has three parameters: x-axis location ( xi ), y-axis location ( yi ), and offset angle ( theta _ i ). The feature values are reordered in ascending order of theta _ i ( Dp _ order ). All the sorted location values of each feature are then combined, allowing the raw IMU feature data to be represented by feature geometry locations.
Algorithm 1 Two-dimensional geometry representation learning
1:
Input: D
2:
Dt = TRANSPOSE(D)
3:
Ref = MEAN(Dt)
4:
feature_angle = []
5:
for one_dt IN Dt do
6:
   theta = GET_INCLUDED_ANGLE(one_r, Ref)
7:
   feature_angle.append(theta)
8:
end for
9:
Dp = []
10:
for one_d IN D do
11:
   sample_i = []
12:
   for feature_i IN one_d do
13:
      idx = one_d.INDEX(feature_i)
14:
      theta_i = feature_angle[idx]
15:
      xi = feature_i * COS(theta_i)
16:
      yi = feature_i * SIN(theta_i)
17:
      sample_i.append([xi, yi, theta_i])
18:
   end for
19:
   Dp.append(sample_i)
20:
end for
21:
Dp_order = SORT(Dp, by=”theta”)
22:
Return: FLAT(Dp_order)

3.3. Activity Classification

With 2D geometry representation learning, each construction worker IMU data frame is transformed into a 2D geometric line. A geometric drawing or a set of position points can also represent the generated geometric line. Then, the worker activity classification can be converted to a geometry semantic classification.

4. Case Validation

A public IMU-based dataset, VTT-ConIoT [31], was used to validate the proposed construction worker activity recognition method. The VTT-ConIoT dataset includes data from 13 construction workers aged 25 to 55, capturing six of the most important and typical tasks, each comprising 2 or 3 activities, totaling 16 activities (as outlined in Table 2). The dataset utilizes a 10-DOF IMU, which includes a 3-axis accelerometer, 3-axis gyroscope, 3-axis magnetometer, and a barometer, making it representative of most IMU-based worker activity recognition scenarios. The original sampling rates were 0.033 Hz for the barometer, 97 Hz for the gyroscope and magnetometer, and 103 Hz for the accelerometer. Given that the crucial frequency components for human activity recognition are below 6 Hz, linear interpolation was used to resample and synchronize the data from the barometer (0.033 Hz), magnetometer (97 Hz), and gyroscope (97 Hz) to match the accelerometer data (103 Hz). As the raw dataset lacked data for Participant 6’s activity 11, the complete dataset was organized into 207 separate CSV files (13 participants × 16 activities − 1), each containing 1 min records.

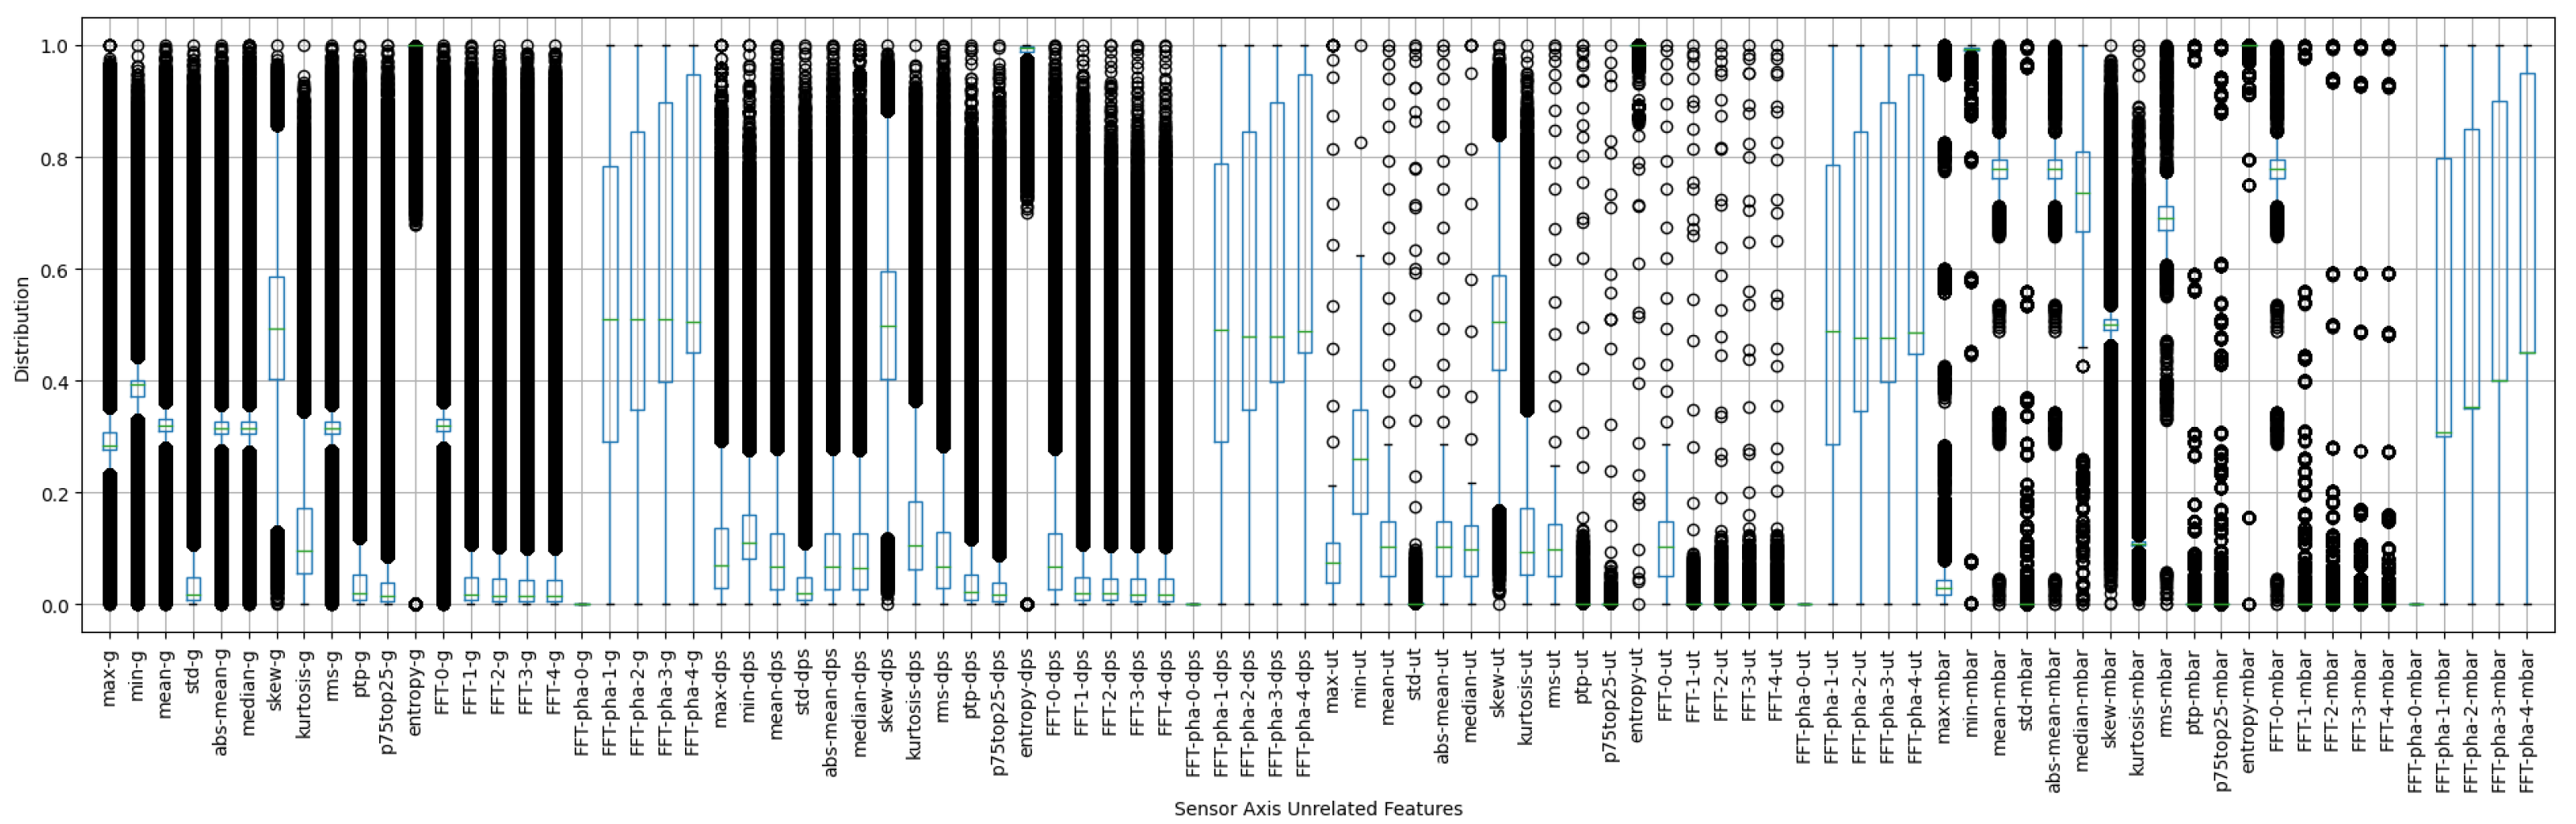
4.1. IMU Axis-Irrelevant Feature Modeling

Considering that human activity is a continuous action, a time window is necessary to recognize these activities. In this context, sliding windows of 10 steps, 20 steps, and 30 steps were applied, corresponding to time windows of 1 s, 2 s, and 3 s, respectively, to independently segment the IMU raw data. According to the axis-irrelevant feature definition (Table 1), there were 12 statistical features. Regarding frequency features, there were half-window-length amplitude features and half-window-length phase features for a given sliding window. Therefore, for sliding windows of 10, 20, and 30 steps, there were 10, 20, and 30 frequency (amplitude and phase) features, respectively. Consequently, for the four sensors (3-axis accelerometer, 3-axis gyroscope, 3-axis magnetometer, and a barometer), there were a total of 88, 128, and 168 features for the three types of sliding window settings. Figure 4 illustrates the normalized value distribution of the 1 s time window, showing significant volatility and many outliers, indicating the complexity of construction worker activity recognition.
Figure 5a–c illustrate the silhouette score distribution of the constructed axis-irrelevant features for all 13 participants. On the x-axis, Pi indicates the i t h participant, while L 0 , L 1 , and L 2 denote sensor locations for the “trousers”, “back”, and “hand”, respectively. The figures show that all scores were lower than or close to 0 across the different sliding window sizes and sensor locations. This suggests that directly using these axis-irrelevant features is unlikely to yield optimal activity classification results.

4.2. Construction Worker Activities Detection with Flexible IMU Deployment

(1) Two-dimensional geometry feature modeling
Through 2D geometry representation learning, a single frame of construction work activity, initially represented by constructing axis-irrelevant features, could be further expressed as a 2D geometric line. Figure 6 provides examples of 16 activities represented using the 2D geometry learning results. Axis-irrelevant feature records from 13 participants across three sensor locations were used for each activity. The figure reveals that the 2D lines were constrained to a specific pattern for a given activity. Notably, at the left end of these lines, the records for a single activity nearly converge to one line. When comparing these 16 activities, the patterns of the corresponding 2D lines can be intuitively distinguished.
Figure 7 presents the mid-line of 16 activities. For each activity, 2336 examples, selected randomly from 13 participants across three different sensor locations, were used to calculate the mid-line. The figure indicates three areas (labeled A, B, and C in Figure 7 and Figure 8) that show great potential for identifying the type of activities.
Figure 6 further illustrates this finding, showing that the spatial distribution of the 2D geometry feature lines had noticeable variations in sections A, B, and C. In contrast, other sections remained almost consistently aligned along a single line.
(2) Activity Classification Validation
To validate the effectiveness of the designed 2D geometry representation learning, participant IDs and sensor location labels were removed from the raw VTT-ConIoT datasets. Only the activity type label was retained, using the datasets to test whether the classification method could manage variations introduced by different participants and sensor locations. Classic classification algorithms such as KNN, SVM, and Decision Tree were employed. To ensure clear explainability, deep neural network type algorithms were not considered. The scale of the datasets is shown in Table 3.
Table 4 demonstrates the final classification performance, with adjustments made by weighting sample counts. The 2D geometry representation learning significantly contributed to all three selected algorithms. Notably, while the KNN and SVM algorithms exhibited similar performance during the training stage for the 2D geometry representation learning datasets and the sensor axis-unrelated datasets, they performed better during the test stage with the 2D geometry representation learning. This indicates that the 2D geometry representation learning uncovered additional potential features to enhance classification. Table 5 and Table 6 provide detailed insights into the training and testing procedures.
(3) Feature Importance Analysis
The decision tree algorithm demonstrated excellent performance in classifying construction workers’ activities based on 2D geometry representation learning. Analyzing the feature significance in the decision tree classification revealed that the barometer contributed the most, with the top eight essential features. Following the barometer, the magnetometer and accelerometer played secondary roles, with their minimum and maximum values being significant for activity classification. As for the gyroscope sensor, only its maximum value significantly contributed to the process. Figure 9 illustrates the result of feature importance analysis.
The paramount importance of the barometer can be closely linked to specific construction activities. Activities like A6 (Climbing stairs), A7 (Jumping down), and A16 (Stairs Up-down) involved significant vertical displacements. During these actions, the barometer captured noticeable changes in atmospheric pressure due to elevation variations, which served as crucial discriminative features for classification. For instance, the pressure drop when a worker climbs up three steps in A6 is distinctly different from the stable pressure readings during flat-ground activities.
Conversely, for activities such as A1 (Roll Painting), A2 (Spraying Paint), and A3 (Leveling paint) that are performed at a relatively constant elevation, the barometer provided limited discriminatory power. These activities mainly involve horizontal arm movements and tool operations. In this case, features from the accelerometer and magnetometer became more critical. The minimum and maximum values of the accelerometer could effectively capture the intensity and rhythm of arm swings during painting, while the magnetometer could detect changes in orientation when the worker adjusted the position of the painting tool.
Activities like A4 (Vacuum Cleaning), A11 (Crouch floor), and A12 (Kneel floor) that occur close to the ground also rely less on barometer data. Here, the gyroscope’s maximum value could play a role in identifying sudden changes in body posture. For example, when a worker suddenly stood up from a crouching position during A11, the gyroscope recorded a significant angular velocity change.
However, this feature importance hierarchy has limitations. External factors can disrupt the effectiveness of these sensors. For example, in windy conditions, barometer readings may be affected during any activity, regardless of elevation changes, introducing noise that can mislead the classification model. In the case of A14 (Walk winding) and A15 (Pushing cart), if the site has uneven ground or strong air currents, the accelerometer and barometer data may be distorted, reducing the accuracy of activity recognition.
Moreover, the significance of sensor features can vary depending on individual worker behavior. Some workers may perform activities with different intensities or postures, which can affect the sensor readings. Future research should focus on developing more adaptive feature selection methods that can account for these variations, such as using machine learning techniques to dynamically weight the importance of different sensors based on real-time activity characteristics and environmental conditions. This would enhance the generalization ability of the activity classification model across various construction scenarios and worker behaviors.

5. Discussion

The latest work employing the same public IMU dataset as our study was used as a benchmark [14]. It reported F1 scores of 0.999, 0.993, and 0.948, with time windows of 10 s, 5 s, and 2 s respectively, using three fixed-attached IMU devices. Our study addressed a more practical scenario with shorter time windows (1 s, 2 s, and 3 s) and a stricter condition where the IMU was not fixed to the worker’s body, allowing the relative orientations of the IMU to change at any time. This reflects real construction sites where sensor data can be collected through construction workers’ smartphones rather than specialized IMU devices. Consequently, we developed IMU Data Axis-Irrelevant Feature Modeling. For a robust comparison, we re-implemented the WorkerNeXt model and conducted tests using IMU Data Axis-Irrelevant Features as input. The results, as shown in Table 7, indicate that by completely removing the sensor axis impact and reducing the time window size, the F1 score decreased significantly.
It is evident that a more sophisticated model enhanced the final activity detection performance. Additionally, it is worth noting that the 2D geometry representation provided better stability throughout the process. With 2D geometry representation learning, WorkerNeXt performed better by increasing the time window size. In comparison, models that lack 2D representation learning showed no clear improvement; in fact, for models like KNN, SVM, and Decision Tree, there was even a decline in performance. This indicates that as the time window size was increased, this introduced diversity into the process, and the 2D geometry representation leveraged this advantage to support improved activity detection.

6. Conclusions

IMU-based activity recognition for construction workers holds significant potential for managing worker behavior, particularly due to its advantages in privacy protection and long-term unobstructed tracking compared to computer-vision-based methods. By focusing on optimizing IMU sensor deployment strategies for detecting construction worker activities, a 2D geometry representation learning approach was developed to support the modeling of sensor-axis-unrelated features. The effectiveness of flexible sensor deployment for worker activity detection was validated using a public IMU dataset and three classic, highly interpretable machine learning algorithms (KNN, SVM, and Decision Tree). The results clearly show that with a more comprehensive feature modeling method, IMU sensors do not need to be fixed to the worker’s body, offering a more practical solution for IMU-based activity observation.
Feature importance analysis indicated that with a free IMU sensor deployment strategy, the height of the work platform and the energy intensity of work activities are two critical factors. Barometer values represent work platform height. The maximum, peak-to-peak, and main amplitude values of a accelerometer, gyroscope, and magnetometer within a single time window represent the work activity energy intensity.
This study proposes a flexible IMU sensor solution for recognizing worker activities. However, the lack of high-quality annotated IMU datasets presents challenges for more robust analysis. Additionally, while simple classification algorithms achieved an overall F1 score of 0.7, there is room for optimization compared to state-of-the-art solutions that have achieved F1 scores of up to 0.9 under strict IMU deployment constraints. In the future, more powerful algorithms, such as deep neural networks with multiple attention strategies, could be designed to optimize performance using 2D geometry representation learning, further advancing the application of flexible IMU solutions in observing construction worker activities.

Author Contributions

Conceptualization, H.C. and G.L.; methodology, validation, formal analysis, investigation, and writing—original draft preparation, H.C.; resources and writing—review and editing, J.L.; supervision, G.L. All authors have read and agreed to the published version of the manuscript.

Funding

This research received no external funding.

Data Availability Statement

Publicly available datasets were analyzed in this study. This data can be found here: https://zenodo.org/record/4683703 (accessed on 3 June 2025).

Conflicts of Interest

Author Hainan Chen and Jianjun Li are employed by the Zhejiang Jiangnan Project Management Co., Ltd. The remaining authors declare that the research was conducted in the absence of any commercial or financial relationships that could be construed as a potential conflict of interest.

References

  1. Khazen, M.; Nik-Bakht, M.; Moselhi, O. Monitoring workers on indoor construction sites using data fusion of real-time worker’s location, body orientation, and productivity state. Autom. Constr. 2024, 160, 105327. [Google Scholar] [CrossRef]
  2. Ashry, S.; Das, S.; Rafiei, M.; Baumbach, J.; Baumbach, L. Transfer Learning of Human Activities based on IMU Sensors: A Review. IEEE Sens. J. 2024, 25, 4115–4126. [Google Scholar] [CrossRef]
  3. Sherafat, B.; Ahn, C.R.; Akhavian, R.; Behzadan, A.H.; Golparvar-Fard, M.; Kim, H.; Lee, Y.C.; Rashidi, A.; Azar, E.R. Automated methods for activity recognition of construction workers and equipment: State-of-the-art review. J. Constr. Eng. Manag. 2020, 146, 03120002. [Google Scholar] [CrossRef]
  4. Li, J.; Miao, Q.; Zou, Z.; Gao, H.; Zhang, L.; Li, Z.; Wang, N. A review of computer vision-based monitoring approaches for construction workers’ work-related behaviors. IEEE Access 2024, 12, 7134–7155. [Google Scholar] [CrossRef]
  5. Li, P.; Wu, F.; Xue, S.; Guo, L. Study on the Interaction Behaviors Identification of Construction Workers Based on ST-GCN and YOLO. Sensors 2023, 23, 6318. [Google Scholar] [CrossRef]
  6. Yang, M.; Wu, C.; Guo, Y.; Jiang, R.; Zhou, F.; Zhang, J.; Yang, Z. Transformer-based deep learning model and video dataset for unsafe action identification in construction projects. Autom. Constr. 2023, 146, 104703. [Google Scholar] [CrossRef]
  7. Zhao, J.; Xu, Y.; Zhu, W.; Liu, M.; Zhao, J. Real-Time Early Safety Warning for Personnel Intrusion Behavior on Construction Sites Using a CNN Model. Buildings 2023, 13, 2206. [Google Scholar] [CrossRef]
  8. Yu, W.D.; Liao, H.C.; Hsiao, W.T.; Chang, H.K.; Wu, T.Y.; Lin, C.C. Real-time Identification of Worker’s Personal Safety Equipment with Hybrid Machine Learning Techniques. Int. J. Mach. Learn. Comput. 2022, 12, 79–84. [Google Scholar]
  9. Li, X.; Hao, T.; Li, F.; Zhao, L.; Wang, Z. Faster R-CNN-LSTM Construction Site Unsafe Behavior Recognition Model. Appl. Sci. 2023, 13, 700. [Google Scholar] [CrossRef]
  10. Zhai, P.; Wang, J.; Zhang, L. Extracting Worker Unsafe Behaviors from Construction Images Using Image Captioning with Deep Learning-Based Attention Mechanism. J. Constr. Eng. Manag. 2023, 149. [Google Scholar] [CrossRef]
  11. Lee, B.; Hong, S.; Kim, H. Determination of workers compliance to safety regulations using a spatio-temporal graph convolution network. Adv. Eng. Informat. 2023, 56. [Google Scholar] [CrossRef]
  12. Wang, M.; Chen, J.; Ma, J. Monitoring and evaluating the status and behaviour of construction workers using wearable sensing technologies. Autom. Constr. 2024, 165, 105555. [Google Scholar] [CrossRef]
  13. Park, S.; Youm, M.; Kim, J. IMU Sensor-Based Worker Behavior Recognition and Construction of a Cyber–Physical System Environment. Sensors 2025, 25, 442. [Google Scholar] [CrossRef]
  14. Mekruksavanich, S.; Jitpattanakul, A. Automatic Recognition of Construction Worker Activities Using Deep Learning Approaches and Wearable Inertial Sensors. Intell. Autom. Soft Comput. 2023, 36, 2111–2128. [Google Scholar] [CrossRef]
  15. Hong, S.; Yoon, J.; Ham, Y.; Lee, B.; Kim, H. Monitoring safety behaviors of scaffolding workers using Gramian angular field convolution neural network based on IMU sensing data. Autom. Constr. 2023, 148, 104748. [Google Scholar] [CrossRef]
  16. Choo, H.; Lee, B.; Kim, H.; Choi, B. Automated detection of construction work at heights and deployment of safety hooks using IMU with a barometer. Autom. Constr. 2023, 147, 104714. [Google Scholar] [CrossRef]
  17. Chen, S.; Zhu, C.; Chen, X.; Yi, J. Machine Learning-Based Real-Time Walking Activity and Posture Estimation in Construction with a Single Wearable Inertial Measurement Unit. IEEE Trans. Autom. Sci. Eng. 2025, 22, 16144–16156. [Google Scholar] [CrossRef]
  18. Xiahou, X.; Li, Z.; Xia, J.; Zhou, Z.; Li, Q. A Feature-Level Fusion-Based Multimodal Analysis of Recognition and Classification of Awkward Working Postures in Construction. J. Constr. Eng. Manag. 2023, 149, 04023138. [Google Scholar] [CrossRef]
  19. Sun, Z.; Zhu, Z.; Xiong, R.; Tang, P.; Liu, Z. Dynamic human systems risk prognosis and control of lifting operations during prefabricated building construction. Dev. Built Environ. 2023, 14, 100143. [Google Scholar] [CrossRef]
  20. Hu, Z.; Chan, W.T.; Hu, H. Personalized Construction Safety Interventions Considering Cognitive-Related Factors. J. Constr. Eng. Manag. 2023, 149, 04023137. [Google Scholar] [CrossRef]
  21. Duan, P.; Goh, Y.M.; Zhou, J. Personalized stability monitoring based on body postures of construction workers working at heights. Saf. Sci. 2023, 162, 106104. [Google Scholar] [CrossRef]
  22. Kim, Y.S.; Lee, J.Y.; Yoon, Y.G.; Oh, T.K. Effectiveness analysis for smart construction safety technology (SCST) by test bed operation on small-and medium-sized construction sites. Int. J. Environ. Res. Public Health 2022, 19, 5203. [Google Scholar] [CrossRef]
  23. Gong, Y.; Seo, J.; Kang, K.S.; Shi, M. Automated recognition of construction worker activities using multimodal decision-level fusion. Autom. Constr. 2025, 172, 106032. [Google Scholar] [CrossRef]
  24. Li, Z.; Zhang, A.; Han, F.; Zhu, J.; Wang, Y. Worker Abnormal Behavior Recognition Based on Spatio-Temporal Graph Convolution and Attention Model. Electronics 2023, 12, 2915. [Google Scholar] [CrossRef]
  25. Li, Z.; Li, D. UWB and IMU Fusion Construction Worker Localization Method Based on Transformer Correction. J. Comput. Civ. Eng. 2025, 39, 04025034. [Google Scholar] [CrossRef]
  26. Wan, H.P.; Zhang, W.J.; Ge, H.B.; Luo, Y.; Todd, M.D. Improved Vision-Based Method for Detection of Unauthorized Intrusion by Construction Sites Workers. J. Constr. Eng. Manag. 2023, 149, 04023040. [Google Scholar] [CrossRef]
  27. Guo, H.; Zhang, Z.; Yu, R.; Sun, Y.; Li, H. Action Recognition Based on 3D Skeleton and LSTM for the Monitoring of Construction Workers’ Safety Harness Usage. J. Constr. Eng. Manag. 2023, 149, 04023015. [Google Scholar] [CrossRef]
  28. Mei, X.; Zhou, X.; Xu, F.; Zhang, Z. Human Intrusion Detection in Static Hazardous Areas at Construction Sites: Deep Learning–Based Method. J. Constr. Eng. Manag. 2023, 149, 04022142. [Google Scholar] [CrossRef]
  29. Huang, H.; Hu, H.; Xu, F.; Zhang, Z.; Tao, Y. Skeleton-based automatic assessment and prediction of intrusion risk in construction hazardous areas. Saf. Sci. 2023, 164, 106150. [Google Scholar] [CrossRef]
  30. Cooley, J.W.; Tukey, J.W. An algorithm for the machine calculation of complex Fourier series. Math. Comput. 1965, 19, 297–301. [Google Scholar] [CrossRef]
  31. Mäkela, S.M.; Lämsä, A.; Keränen, J.S.; Liikka, J.; Ronkainen, J.; Peltola, J.; Häikiö, J.; Järvinen, S.; Bordallo López, M. Introducing VTT-ConIot: A realistic dataset for activity recognition of construction workers using IMU devices. Sustainability 2021, 14, 220. [Google Scholar] [CrossRef]
Figure 1. Overall framework of flexible IMU solution for worker activity detection.
Buildings 15 02372 g001
Figure 2. IMU axis-irrelevant feature modeling procedures.
Buildings 15 02372 g002
Figure 3. Two-dimensional geometry representation learning procedures.
Buildings 15 02372 g003
Figure 4. Sensor axis-unrelated features value distribution for 1 s time window.
Buildings 15 02372 g004
Figure 5. Silhouette score distribution of the constructed axis-irrelevant features for different time slide window sizes. (a) Time Slide Window Size 1 s (10 steps). (b) Time Slide Window Size 2 s (20 steps). (c) Time Slide Window Size 3 s (30 steps).
Buildings 15 02372 g005aBuildings 15 02372 g005b
Figure 6. Two-dimensional geometry representation learning examples for 16 activities.
Buildings 15 02372 g006
Figure 7. Comparison of 16-activity 2D geometry representation learning.
Buildings 15 02372 g007
Figure 8. Two-dimensional geometry feature lines space distribution.
Buildings 15 02372 g008
Figure 9. Feature importance analysis for the 2D-geometry-representation-learning-based activity classification.
Buildings 15 02372 g009
Table 1. Extended axis-irrelevant features.
IndexExtended FeaturesCalculation Formula
F1Maximum (Ma) Max ( X )
F2Minimum (Mi) Min ( X )
F3Mean (Me) ( i X i ) / N
F4Standard Deviation (SD) ( i | X i M e | 2 ) N
F5Mean Absolute Deviation (MAD) 1 N i N | X i |
F6Median (Md) Order ( X ) [ N / 2 ]
F7Skewness (Sk) N ( N 1 ) N 2 · ( 1 / N ) × i N ( X i M e ) 3 ( ( 1 / N ) × i N ( X i M e ) 2 ) 3 / 2
F8Kurtosis (Ku) ( 1 / N ) × i N ( X i M e ) 4 ( ( 1 / N ) × i N ( X i M e ) 2 ) 2 3
F9Root Mean Square (RMS) i N ( X i ) 2 N
F10Peak-to-Peak (PP) Ma Mi
F11Inter-quartile Range (IQR) X [ 0.75 × ( N 1 ) ] X [ 0.25 × ( N 1 ) ]
F12Entropy (En) i = 1 N X i × log ( X i )
F13Amplitude of Main Frequency (AMF) | FFT ( X ) | [ 0 : N / 2 ]
F14Phase of Frequency (PF) Angle ( FFT ( X ) ) [ 0 : N / 2 ]
Table 2. VTT-ConIoT dataset activity labels and descriptions.
Activity IndexActivity NameActivity Description
A1Roll PaintingThe subject uses a paint roller on a wall.
A2Spraying PaintThe subject uses a tube (that mimics a machine) to perform movements depicting the spraying of paint on a wall.
A3Leveling paintThe subject uses a tool to mimic the spreading of screed or paint on a wall.
A4Vacuum CleaningThe subject uses a vacuum cleaner on the floor.
A5Picking objectsThe subject picks up objects from the floor with
their hands and throws them into a bin.
A6Climbing stairsThe subject goes up three steps on a stair, turns around,
and goes down three steps.
A7Jumping downThe subject goes up three steps on a stair, turns around,
and jumps down the three steps.
A8Laying backThe subject mimics working with his hands up
while laying back on a mid-level surface.
A9Handsup highThe subject mimics working on tubes with their hands high above the head.
A10Handsup lowThe subject mimics working on tubes
with their hands at the head or shoulder level.
A11Crouch floorThe subject works on the floor, placing tiles while crouching.
A12Kneel floorThe subject works on the floor, placing tiles while kneeling.
A13Walk straightThe subject walks straight along a corridor for 20 m, turns around, and walks back.
A14Walk windingThe subject walks winding around seven cones for 20 m,
turns around, and walks back.
A15Pushing cartThe subject walks along a corridor for 20 m pushing a cart,
turns around, and pushes it back.
A16Stairs Up-downThe subject climbs stairs for 30 s, turns around, and comes back.
Table 3. Dataset scale.
TypeTrain Dataset SupportTest Dataset Support
A123,357210,208
A223,357210,211
A323,357210,217
A423,359210,230
A523,357210,211
A623,358210,216
A723,357210,217
A823,358210,219
A923,357210,214
A1023,357210,217
A1121,561194,052
A1223,358210,222
A1323,357210,217
A1423,358210,216
A1523,357210,217
A1623,358210,219
Total371,9233,347,303
Table 4. Sample weight adjusted classification performance comparison.
Sensor Axis Unrelated Datasets2D Geometry Represent Learning Datasets
KNNSVMDecision TreeKNNSVMDecision Tree
PRF1PRF1PRF1PRF1PRF1PRF1
Train0.580.500.540.210.210.210.680.690.690.580.500.540.200.200.200.830.740.78
Test0.190.120.150.160.170.160.600.590.600.220.180.190.200.200.200.750.670.71
Table 5. Classification performance of training procedure.
Sensor Axis Unrelated Datasets2D Geometry Represent Learning Datasets
KNNSVMDecision TreeKNNSVMDecision Tree
PRF1PRF1PRF1PRF1PRF1PRF1
A10.390.900.540.180.080.110.660.690.670.390.900.540.170.070.100.840.690.76
A20.380.780.510.280.160.200.660.670.660.380.780.510.270.140.180.880.770.82
A30.390.660.490.150.100.120.620.590.600.390.660.490.140.090.110.790.840.81
A40.410.560.470.200.210.200.620.630.620.410.560.470.190.180.180.790.710.75
A50.480.610.540.210.260.230.700.680.690.480.610.540.200.250.220.870.800.83
A60.450.500.470.160.000.000.680.660.670.450.500.470.160.000.000.860.720.78
A70.540.500.520.190.200.190.690.680.680.540.500.520.190.200.190.810.650.72
A80.560.460.510.220.370.280.630.720.670.560.460.510.210.340.260.830.640.72
A90.590.360.450.130.250.170.700.700.700.590.360.450.130.270.180.840.770.80
A100.610.360.450.170.300.220.690.700.690.610.360.450.160.340.220.860.690.77
A110.730.390.510.260.220.240.700.690.690.730.390.510.280.210.240.780.630.70
A120.680.290.410.160.100.120.640.660.650.680.290.410.130.070.090.800.870.83
A130.670.420.520.260.300.280.700.720.710.670.420.520.240.290.260.880.840.86
A140.760.510.610.280.310.290.760.760.760.760.510.610.270.290.280.780.780.78
A150.770.340.470.210.120.150.680.690.680.770.340.470.210.090.130.850.630.72
A160.820.420.560.280.390.330.780.780.780.820.420.560.270.380.320.780.730.75
Table 6. Classification performance of test procedure.
Sensor Axis Unrelated Datasets2D Geometry Represent Learning Datasets
KNNSVMDecision TreeKNNSVMDecision Tree
PRF1PRF1PRF1PRF1PRF1PRF1
A10.130.120.120.170.070.100.600.640.620.120.310.170.150.060.090.790.600.68
A20.130.120.120.180.160.170.620.670.640.130.310.180.260.120.160.800.690.74
A30.110.100.100.140.090.110.520.500.510.110.190.140.140.090.110.750.750.75
A40.120.120.120.190.100.130.550.550.550.120.170.140.200.200.200.790.670.73
A50.180.130.150.100.150.120.490.520.500.190.240.210.200.250.220.690.680.68
A60.130.150.140.160.000.000.530.570.550.130.140.130.120.000.000.720.630.67
A70.190.120.150.190.200.190.470.490.480.190.160.170.180.190.180.680.570.62
A80.210.120.150.120.170.140.670.740.700.210.160.180.210.340.260.740.620.67
A90.170.100.130.130.250.170.700.630.660.160.090.120.130.270.180.830.740.78
A100.190.110.140.170.300.220.690.660.670.190.110.140.160.350.220.840.650.73
A110.330.120.180.160.120.140.710.680.690.320.140.190.270.200.230.750.600.67
A120.180.070.100.160.100.120.610.610.610.190.080.110.130.070.090.730.820.77
A130.310.170.220.160.190.170.580.590.580.340.180.240.240.290.260.740.730.73
A140.230.150.180.180.310.230.660.600.630.430.260.320.260.290.270.740.760.75
A150.280.100.150.110.130.120.520.460.490.250.100.140.210.090.130.710.610.66
A160.220.170.190.180.390.250.640.600.620.430.170.240.270.370.310.730.620.67
Table 7. Model Performance Comparison.
Sensor Axis Unrelated Datasets2D Geometry Represent Learning Datasets
Time Window SizeModelPRF1PRF1
KNN0.190.120.150.220.180.19
1sSVM0.160.170.160.200.200.20
Decision Tree0.600.590.600.750.670.71
WorkerNeXt0.600.600.600.800.720.76
KNN0.200.120.150.250.200.22
2sSVM0.170.170.170.230.250.24
Decision Tree0.580.590.580.750.730.74
WorkerNeXt0.650.630.640.820.820.82
KNN0.120.110.110.230.200.21
3sSVM0.120.150.130.210.210.21
Decision Tree0.540.520.530.750.700.72
WorkerNeXt0.650.660.650.820.840.83
Disclaimer/Publisher’s Note: The statements, opinions and data contained in all publications are solely those of the individual author(s) and contributor(s) and not of MDPI and/or the editor(s). MDPI and/or the editor(s) disclaim responsibility for any injury to people or property resulting from any ideas, methods, instructions or products referred to in the content.

