Abstract
This study aims to develop fluid–solid coupled similar materials to enhance the reliability of geotechnical model tests simulating reservoir slope stability under water-level fluctuations. Using an orthogonal experimental method, materials were prepared with quartz sand and barite as aggregates, cement and gypsum as binders, and water as the regulator. Tests on density, uniaxial and triaxial compressive strength, and flow properties determined the relationships between material properties and raw components. Uniaxial compressive strength tests under dry–wet cycles revealed that cement-to-binder ratio primarily influenced density, uniaxial compressive strength, cohesion, and hydraulic conductivity, while the binder-to-aggregate ratio affected elastic modulus and internal friction angle. Uniaxial compressive strength continuously degraded with cycles but at a decreasing rate. A water-damage resistance coefficient was defined to quantify degradation. Multiple linear regression analysis established a robust model for uniaxial compressive strength prediction, providing a theoretical basis for material proportioning. These findings improve the simulation accuracy in hydrologically active zones, with applications in designing stable reservoir slopes.
1. Introduction
With the gradual implementation of national water resource development strategies, several large and medium-sized reservoirs, including the Three Gorges, Zi Ping Pu, Xi Luo Du, Xiang Jia Ba, Gou Pi Tan, Xiao Wan, and Shui Bu Ya, have been constructed. However, reservoir construction also poses the risk of landslides. For instance, the Qian Jiang Ping landslide occurred on the 33rd day following the initial impoundment of the Three Gorges Reservoir. The primary cause was the significant influence of the rising reservoir water level on the stability of the slope due to water storage. Such landslides endanger the lives and property of those living in the reservoir area [,,]. The research into slope stability can address potential landslide risks at reservoir banks and provide a theoretical foundation for the safe operation of projects. The stability of reservoir slopes is largely affected by the interaction between the stress and seepage fields, making it essential to investigate the distribution and evolution of the stress, seepage, and displacement fields under fluid–solid coupling [,,]. Similarity simulation experiments, based on the principle of similarity to replicate a prototype and draw conclusions about the prototype’s mechanical behaviour, are crucial scientific methods. These experiments allow for an effective qualitative analysis of mining structures, with the selection and proportioning of similar materials playing a critical role in the accuracy of experimental outcomes [,,].
Numerous studies have explored the physical and mechanical properties of conventional similar materials through various experimental methods. Significant progress has been made in the field of ordinary single-phase solid materials. For instance, Cheng et al. [] utilised calcareous sand, white cement, silicone oil, and purified water as raw materials, conducting 25 groups of orthogonal proportion tests and sensitivity analyses of different factors on coral reef limestone with similar materials. Pang et al. [] developed similar materials for simulated coal seam sampling at appropriate scales and successfully carried out experiments using a self-developed drill test rig, further demonstrating the reliability of the scale model. Other researchers have employed orthogonal experiments to investigate the influence of different materials and proportions, obtaining physical and mechanical properties, such as density [], uniaxial compressive strength [], elastic modulus [], cohesive forces, and permeability [], which are influenced by the proportioning of raw materials. Several researchers have examined a new type of similar fluid-solid coupled material. Shi et al. [] developed materials to address fluid–solid coupling challenges in engineering, experimentally measuring the density, uniaxial compressive strength, elastic modulus, cohesion, internal friction angle, softening coefficient, permeability coefficient, dynamic Poisson’s ratio, and dynamic elastic modulus of various mixtures. Li et al. [] conducted extensive experiments with multiple group proportions to develop new types of similar materials suited to fluid–solid coupling model tests and established a constitutive model suitable for fluid–solid coupling similar materials. To meet the physical and mechanical requirements of geotechnical model tests, numerous researchers have conducted extensive laboratory experiments to develop novel similar materials. For instance, Wu [] performed orthogonal tests to formulate a granular mixture for underwater tunnel model tests, successfully replicating hydraulic conductivity and compressive strength under fluid–solid coupling conditions. Similarly, Zan [] conducted proportioning experiments to create rock-like materials for slope stability models, achieving strength degradation characteristics matching prototype rocks after wet–dry cycles. Additionally, Cui [] utilized regression analysis to optimize the proportions of fluid–solid coupling materials, validating their applicability in karst tunnel water inrush simulations. These extensive experimental efforts [,,] underscore the critical role of laboratory testing in developing reliable similar materials, particularly for complex conditions, like fluid–solid interactions, thereby highlighting the need for further research into materials that can simulate reservoir slope behaviour under cyclic wet–dry conditions. Various researchers have applied single and multiple regression analyses and other mechanical methods to derive regression equations for different factors, analysing empirical equations suitable for the mechanical properties of various similar materials []. Recent studies have extended these traditional methods with advanced predictive models to address complex environmental challenges. Such models enhance the prediction of material and structural performance under stresses, like wetting and drying cycles, which significantly affect material behaviour [,]. These approaches underpin our study’s use of multivariate linear regression and dry–wet cycle tests to optimize fluid–solid coupled materials for reservoir slope stability. However, the existing research has not thoroughly examined similar fluid–solid coupling materials that meet both solid mechanical properties and permeability requirements. Most studies have focused on the physical and mechanical analyses of other materials under drying and wetting cycles [,]. Limited research has been conducted on the physical and mechanical behaviour of similar materials under such cycles, and no quantitative standards or influence coefficients have been established for the hydrological characteristics of similar fluid–solid coupling materials.
Therefore, in this study, quartz sand, barite, cement, and gypsum were employed as raw materials in model experiments to create similar materials. Through density testing, uniaxial strength testing, triaxial strength testing, and seepage experiments, basic physical and mechanical parameters, including density, uniaxial compressive strength, elastic modulus, cohesive forces, internal friction angle, and hydraulic conductivity, were determined. Empirical formulas were developed to describe the relationships between these physical and mechanical parameters and the raw materials, using orthogonal experimental design for sensitivity analysis and multiple linear regression. The physical and mechanical characteristics of similar fluid–solid coupled materials were evaluated under varying numbers of dry–wet cycles. Additionally, a water-damage resistance coefficient, affecting the uniaxial compressive strength of the materials, was identified and defined based on the hydrological characteristics of the fluid–solid coupled materials. This coefficient effectively quantifies the relationship between the raw materials and uniaxial compressive strength after dry–wet cycling, offering a theoretical foundation for future research into the proportioning of model experiments with similar materials.
2. Research and Production of Similar Materials
2.1. Experimental Materials
To explore the relationship between the basic physical and mechanical parameters of similar fluid–solid coupled materials and the raw materials, quartz sand, barite, cement, and gypsum were selected for experimentation. Quartz sand with a particle size of 40–80 mesh and a fineness modulus of 2.33 was used. Barite, with a very-fine particle size of 2000 mesh provided high compatibility. P O 42.5 Portland cement was employed to regulate the strength of the materials, ensuring they would not disintegrate upon contact with water. Gypsum, conforming to the “GB/T 9776-2008” standard, was utilised to adjust the solid deformation and permeability of the material. Tap water from the laboratory was used. The main components of similar materials are illustrated in Figure 1.
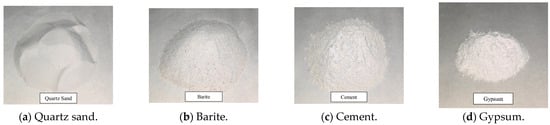
Figure 1.
Main components of similar materials.
2.2. Orthogonal Test
The mass ratio of the binder to the aggregate was designated as Factor A, the mass ratio of quartz sand in the aggregate as Factor B, and the mass ratio of cement in the binder as Factor C. In accordance with references [,,], the levels of each factor were controlled within specified ranges: Factor A (the mass ratio of binder to aggregate) was set between 1:5 and 1:9, Factor B (the mass ratio of quartz sand in the aggregate) was set between 30% and 70%, and Factor C (the mass ratio of cement in the binder) was also set between 30% and 70%. Each factor was averaged across five levels, and an orthogonal table of was used to design the 25 experimental groups (see Table 1).

Table 1.
Orthogonal test table.
2.3. Preparation Protocol
The process of making similar material specimens with a static pressure loading device was meticulously executed as follows. First, the aggregate and binder materials were accurately weighed by mass. These materials were then thoroughly mixed to ensure uniformity. Afterward, a specific mass ratio of water was added, and the mixture was stirred to achieve the desired consistency. A constant water-to-binder ratio of 0.4 was maintained across all mixes to isolate the effects of binder proportions. The prepared mixture was then placed into moulds and compacted in five stages to ensure uniformity between the top and bottom sections of each specimen. Once compacted, the specimens were demoulded and cured at room temperature for 10 days. Following the curing period, the specimens were ground into standard samples with a diameter of , in accordance with the “Regulations for Rock Tests in Hydraulic and Hydroelectric Engineering” (DLT5368-2007). Compressive strength testing was conducted using an RMT-150C rock mechanics testing instrument. Both uniaxial and triaxial compressive strength tests were performed with four confining pressures: 0 MPa, 1 MPa, 2 MPa, and 3 MPa. Initially, the method was switched to displacement control at a loading rate of , followed by a switch to displacement control at a loading rate of , where an axial load was steadily applied until the specimen failed. Hydraulic conductivity testing was performed using the HYS-4-2-type single-fracture hydro-rock coupling instrument. The confining pressure for the seepage tests was set between 0.3 and 0.5 MPa, as required by the equipment, with three different inlet pressures designed: 0.3 MPa, 0.6 MPa, and 0.9 MPa. The processes for configuring the similar materials and the test programs are depicted in Figure 2.
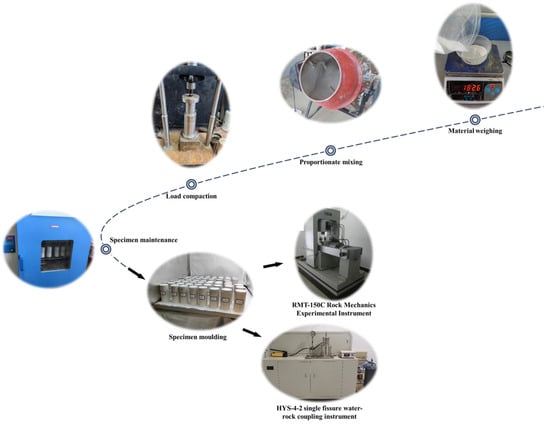
Figure 2.
Similar material configuration processes and test programs.
3. Characterisation of Physical and Mechanical Properties and Sensitivity Analysis
3.1. Characterisation of Mechanical Properties
The tests were conducted in strict accordance with the orthogonal test design scheme, involving 25 groups of materials with different ratios. These tests aimed to measure and obtain the following parameters: density , uniaxial compressive strength , elastic modulus , cohesive force , internal friction , and hydraulic conductivity , as presented in Table 2.
Table 2.
Test results for the physical properties of similar materials.
Under the applied loading conditions, the similar material samples exhibited distinct failure modes accompanied by the formation of cracks. As the samples failed, the differences in surface deformation evolution characteristics became more pronounced with varying material ratios. Specifically, when the proportion of aggregates in the material increased, the damage to the samples intensified, leading to more developed cracks on the surface. Conversely, as the cement mass proportion increased, the number of fracture surfaces displayed by the samples in the splitting state gradually increased. This phenomenon is primarily attributed to the larger internal friction angle between particles, which relies on mechanical interlocking forces for cohesion. Once the externally applied force exceeded these interlocking forces, the strength of the samples rapidly declined, displaying brittle failure characteristics.
However, as the mass proportion of the binding materials increased, the number of failure cracks in the samples also increased significantly, yet these cracks did not fully interconnect, as shown in Figure 3. This is because the binding materials primarily serve a bonding function in the samples, introducing a ductile or plastic influence during the failure process. Consequently, despite the high number of cracks, no major interconnected failure surfaces were formed.
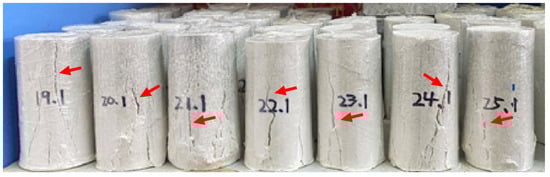
Figure 3.
Failure mode.
3.2. Sensitivity Analysis
The range analysis method is characterised by its simplicity in calculations, visual intuitiveness, and ease of understanding. By employing range analysis, the primary and secondary factors influencing the experimental results could be identified. The range represents the degree to which different levels of a particular factor impact a specific experimental indicator. In contrast, the analysis of variance (ANOVA) examines whether factors significantly affect results by comparing the variances within and between groups. ANOVA serves as a critical statistical tool for investigating differences across multiple groups and determining the effects of various factors on outcomes. While more complex than range analysis, ANOVA provides a statistically robust approach to analysing data variability and factor significance. In this study, a three-way analysis of variance (ANOVA) was conducted to evaluate the effects of Factor A (the mass ratio of binder to aggregate), Factor B (the mass ratio of quartz sand in the aggregate), and Factor C (the mass ratio of cement in the binder) on the physical and mechanical properties, with each factor having four degrees of freedom and the error term having 12 degrees of freedom. The results of the range and variance analyses for the physical and mechanical properties of similar materials are shown in Table 3 and Figure 4, respectively.
Table 3.
Analysis of variance for each factor.
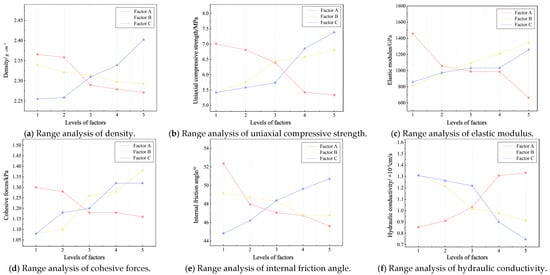
Figure 4.
Sensitivity analysis.
Table 3 and Figure 4a reveal that Factor C exhibited the largest range and variance, indicating the greatest data dispersion. Consequently, the cement–binder ratio had the most significant influence on the density of the similar materials, with a positive correlation observed between the sample density and the cement–binder ratio. Conversely, Factor B showed the smallest range and variance, indicating good data consistency and a minimal effect on the density of the similar materials. From the analysis of the trend line, a clear inverse relationship between the density of the similar materials and both Factors A and B emerged. This is because quartz sand has a relatively low density, whereas barite typically possesses a high density. Cement itself has a specific density, and its hydration products further increase the material’s density, thus exerting the greatest impact on the overall density of the similar materials.
From Figure 4b, it can be observed that the dominant factor influencing the uniaxial compressive strength of similar materials was Factor C. After hydration, cement forms strong hydration products that bind tightly to the aggregates. Analysis of the trend line showed a positive correlation between the two variables. Additionally, Factor B was found to significantly affect this indicator, also exhibiting a positive correlation. This is due to quartz sand, a component of the aggregate, having high hardness and good wear resistance, providing strong skeletal support and enhancing the material’s compressive performance. These findings suggest that the uniaxial compressive strength of similar materials can be primarily controlled by adjusting the cement content. As the proportion of cementitious materials in the mix decreased, the uniaxial compressive strength of the similar materials decreased accordingly.
The ranges and influence patterns of the various factors on the elastic moduli of similar materials are presented in Table 3 and Figure 4c. Among these, Factor A exhibited the largest range, indicating its significant impact. This is because aggregates have a high elastic modulus, forming the reinforcing phase in composite materials. The elastic modulus of the aggregate directly affects the overall stiffness of the composite material when combined with the binding material. Additionally, the interface transition zone between the aggregate and binding material acts as a weak link in the material. As the proportion of aggregates increases, so does the number and area of these interface transition zones. Therefore, the proportion of aggregates has the greatest influence on the elastic modulus of similar materials. The ranges of Factors B and C decreased successively, indicating their progressively lower impact on this property.
As presented in Figure 4d, the cohesion of similar materials shows a positive correlation with the proportion of quartz sand in the aggregate, indicating a negative correlation with the proportion of barite. Quartz sand, as an aggregate, can effectively fill voids within the cementing material, creating a more compact structure, which enhances the interparticle forces. In contrast, barite has a higher density and larger particle size, making it more difficult to disperse uniformly during mixing, leading to the formation of larger clusters. These clusters reduce the effective contact area between particles and weaken the mechanical interlocking force, thus negatively affecting cohesion. Cohesion is also positively correlated with the proportion of cement in the binder, while it shows a negative correlation with the proportion of gypsum. An increase in gypsum content corresponds to a reduction in cement or other binders that promote cohesion. Cement, as the primary binder component, undergoes hydration upon mixing with water, producing gel-like substances, such as calcium silicate hydrate and calcium hydroxide. These gels fill the voids between particles, forming a strong bonding network that significantly boosts material cohesion. Therefore, substituting gypsum reduces the material’s cohesion. The ratio of aggregate to binder has the least influence on cohesion, but generally exhibits a negative correlation.
The mean values and ranges for each level of the factors affecting the internal friction angle in the orthogonal test results are presented in Figure 4e. The binder–aggregate ratio exhibited the largest range, followed by the cement–binder ratio, while the sand–aggregate ratio displayed the smallest range. This indicates that the internal friction angle of similar materials is significantly influenced by the binder–aggregate ratio and less influenced by the sand–aggregate ratio. The binder plays a crucial role in binding the aggregates within the similar materials. An increase in the binder–aggregate ratio implies a higher proportion of binder in the total volume, which enhances the adhesive forces between the aggregate particles. This increased adhesive force requires greater energy to induce sliding when the material is subjected to shear, thus raising the internal friction angle. Additionally, the hardening characteristics of the binder significantly affect the internal friction angle. As the binder content, particularly that of cement, increases, the material’s degree of hardening improves, resulting in a denser and more stable internal structure. This enhancement, in turn, increases the material’s shear resistance, thereby elevating the internal friction angle. Conversely, changes in the sand–aggregate ratio primarily impact the contact area and porosity among aggregate particles. While these factors can influence the internal friction angle, their effects are often overshadowed by the binding effect of the binder. When the binder–aggregate ratio is relatively high, the binder’s binding effect becomes the dominant factor, diminishing the impact of changes in the sand–aggregate ratio on the internal friction angle.
For the hydraulic conductivity of similar materials, the variance levels of the factors were ranked as Factor C > Factor A > Factor B, and the range levels followed the same pattern: Factor C > Factor A > Factor B. Factor A had the most significant influence on hydraulic conductivity, while Factors B and C had smaller, relatively similar impacts. The hydraulic conductivity of similar materials increased as Factor A decreased and decreased as Factors B and C increased. This pattern arises because the particle size of the aggregate is much larger than that of the binder. An increase in aggregate content leads to the formation of larger pore channels, resulting in localized high permeability. However, the overall permeability decreases due to the effects of other factors. The hydration products of the binder can fill the voids between aggregates, enhancing the material’s density and thereby significantly reducing its hydraulic conductivity. This interplay between aggregate size, binder hydration, and the resulting material structure governs the observed trends in hydraulic conductivity.
The sensitivity analysis clearly highlights that cement has a far greater impact on the physical and mechanical properties of similar materials compared to the other components. Among binders, cement primarily affects the density, uniaxial compressive strength, cohesion forces, and hydraulic conductivity of similar materials. Cement primarily influences key properties, such as density, uniaxial compressive strength, cohesion forces, and hydraulic conductivity, underscoring its decisive role as the main binder. Factors such as the hydration reaction, hardening characteristics, and the resulting microstructure collectively determine the overall performance of the material. The binder exerts the greatest influence on the elastic modulus and internal friction angle, both of which decrease as the binder–aggregate ratio decreases. While aggregates also contribute to the material’s performance, their role is less dominant compared to that of the binder. Nevertheless, aggregates provide essential structural support and help fill voids when the binder content is sufficient. The interaction between the binder and aggregates is complex and vital, with changes in the binder–aggregate ratio directly impacting the effectiveness of this interaction. This interaction, in turn, significantly influences the physical and mechanical properties of the material.
3.3. Multiple Linear Regression Analysis
Using SPSS (Statistics 27.0.1.0) software and employing multiple linear regression analysis, the physical and mechanical parameter indicators of similar materials were designated as dependent variables, while the proportions of each raw material relative to the total mass were used as independent variables. The analysis was refined by defining , , , and as the proportions of quartz sand, barite, cement, and gypsum to the total mass, respectively, where is the proportion of quartz sand to the total mass. Through multiple linear regression analysis, the following expressions can be obtained:
Based on Equation (1), where the proportion ranges are defined as ,
, , , the results of the multiple linear regression analysis for the mix ratio of similar materials should remain within these specified limits. Should the calculated results exceed this defined range, it suggests that a similar material formulated with cement and gypsum as binders, along with quartz sand and barite as aggregates, may not meet the experimental requirements. In such cases, it may be necessary to modify the mix by incorporating additives or selecting alternative raw materials to achieve the desired properties in the formulation.
The residual plot in Figure 5 indicates that the residuals across various factor levels are randomly and uniformly distributed around the horizontal axis, oscillating near the zero line. Notably, there were no discernible linear or nonlinear trends or periodic patterns present in the residual plots. The range of residuals was moderate, with the majority falling within a reasonable scope. Moreover, the Durbin–Watson statistic for each factor level exceeded 1.85, confirming that the regression curves for each level exhibited a high degree of satisfaction and adequately fit the data, making the prediction results highly reliable. A back-substitution test was performed using the derived multivariate prediction equation, and the fit chart comparing the actual and predicted values is illustrated in Figure 6.
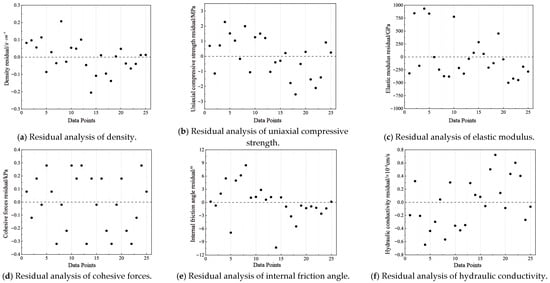
Figure 5.
Residual analysis.
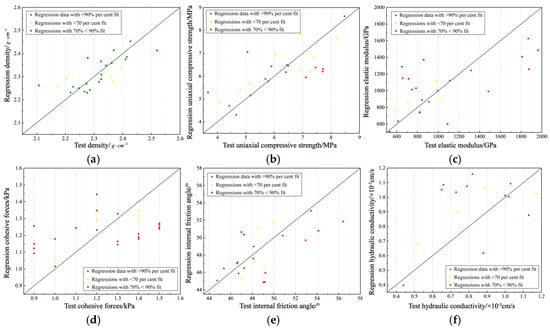
Figure 6.
Multiple linear regression analysis. (a) Multiple linear regression analysis of density, (b) multiple linear regression analysis of uniaxial compressive strength, (c) multiple linear regression analysis of elastic modulus, (d) multiple linear regression analysis of cohesive forces, (e) multiple linear regression analysis of internal friction angle, and (f) multiple linear regression analysis of hydraulic conductivity.
Utilising the equation established through multiple linear regression analysis for back-substitution testing, the fit between the predicted and actual data was notably high, with trends aligning closely. The absolute error in the density prediction results ranged from 0.003 to 0.154 , yielding an average error of 0.01 . For uniaxial compressive strength, the absolute error ranged from 0.005 to 2.001 MPa, with an average error of 0.002 MPa. The elastic modulus predictions showed absolute errors ranging from 5.684 to 166.806 GPa, averaging at 0.007 GPa. The cohesion prediction results had absolute errors ranging from 0.015 to 0.156 kPa, with an average error of 0.012 kPa. For the internal friction angle, the absolute error ranged from 0.321° to 8.132°, averaging 0.01°. Finally, the permeability coefficient predictions exhibited absolute errors ranging from 0.002 cm/s to 0.169 cm/s, with an average error of 0.004 cm/s. Generally, the errors for each factor satisfied the established requirements.
Thus, the equation established through multiple linear regression can be employed to calculate the density, uniaxial compressive strength, elastic modulus, cohesive forces, internal friction angle, and hydraulic conductivity of the prepared similar materials, based on the contents of quartz sand, barite, cement, and gypsum.
4. Analysis of Water Properties Under Dry-Wet Cycles
4.1. Hydrological Characterisation
Currently, the raw materials used to manufacture similar materials primarily include iron powder, quartz sand, fine river sand, barite, in situ soil, cement, gypsum, and putty powder. The physical and mechanical properties of these similar materials are directly influenced by the choice of raw materials, particularly concerning their susceptibility to water permeation, which significantly affects their uniaxial compressive strength. To investigate the changes in the physical and mechanical characteristics of similar solid–fluid coupling materials under the influence of water permeation, a dry–wet cycle experiment was conducted using the oven drying and vacuum saturation method, as illustrated in Figure 7.
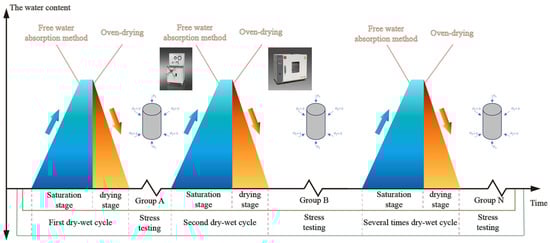
Figure 7.
Dry–wet cycle test path.
The dispatching pattern of the pumped-storage reservoir in Fuxin City, where the reservoir water level fluctuates between elevations of 70 m and 160 m, informed the experimental design. The midpoint of this fluctuation, at an elevation of 115 m, was taken as a reference for the dry–wet cycle duration of the rock mass. The indoor dry–wet cycle experiment was designed based on the anticipated annual soaking time of the rock body at a reservoir bank slope of 115 m, which is approximately between 170 and 195 days. Consequently, the dry–wet action time ratio for the rock body was established at approximately 1:0.87 and 1:1.15. For the indoor dry–wet cycle experiment, a 1:1 ratio was selected, with a dry cycle of one day followed by a soaking cycle of one day. Three dry–wet cycles were included in the design, with one set of samples tested for each cycle. The absence of disintegration throughout the dry–wet cycles indicates that the samples prepared with cement and gypsum as binders exhibit good hydrophobic properties.
The mechanical characterisation analysis of similar materials under various mix ratios revealed that as the proportion of cement and gypsum in the total mass decreased, the deterioration of the uniaxial compressive strength of the materials became more pronounced. In a material mix, aggregates contribute to the formation of a structural framework that provides support, while binders primarily serve to bond granular or blocky materials into a cohesive structure. Compared to the binders, the raw materials used for aggregates are more susceptible to disintegration in aqueous solutions. This observation highlights that the binders possess a stronger resistance to water erosion and deterioration effects than the aggregates.
As the proportion of cement in the binder gradually increased, the deterioration of the uniaxial compressive strength of similar materials became less severe. Once set, cement forms hard hydration products that exhibit significant water resistance. In contrast, gypsum tends to decompose when immersed in water. Prolonged exposure to water can lead to the complete decomposition of gypsum, damaging its original structure and shape. Consequently, cement demonstrates superior water resistance. The pattern of changes in uniaxial compressive strength under different numbers of dry–wet cycles is illustrated in Figure 8.
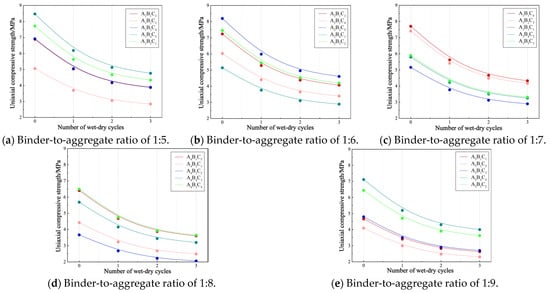
Figure 8.
Changes in uniaxial compressive strength pattern under different numbers of dry–wet cycles.
With an increasing proportion of quartz sand in the aggregates, the deterioration in the uniaxial compressive strength of similar materials became less pronounced. This is attributed to the low water absorption rate of quartz sand, which, even after prolonged immersion, does not cause expansion or cracking in the similar materials due to water intrusion. In contrast, barite possesses perfectly cleaved planes that intersect at nearly right angles. Prolonged soaking can saturate these cleavage gaps with water, weakening the physical and mechanical properties of the similar materials. Therefore, quartz sand exhibits good water resistance. The water resistance of the four raw materials used in this experiment can be ranked as follows: cement > quartz sand > barite > gypsum.
4.2. Multivariate Linear Regression Analysis of Hydraulic Properties
The multivariate linear regression analysis method for the uniaxial compressive strength of similar materials under different numbers of dry–wet cycles revealed a gradual decrease in uniaxial compressive strength as the dry–wet cycle counts increased. The uniaxial compressive strength consistently deteriorated under the effects of these cycles, with the rate of deterioration gradually decreasing. During the transition from one to three dry–wet cycles, the uniaxial compressive strength of 25 groups of similar materials exhibited a decrease ranging from 1.177 MPa to 2.718 MPa, starting from an initial range of 3.669 MPa to 8.475 MPa. The average reductions in compressive strength were approximately 26.98%, 17.14%, and 7.09% for the first, second, and third cycles, respectively. The multivariate linear regression fitting functions for the uniaxial compressive strength of similar materials under varying numbers of dry–wet cycles are detailed in Table 4.
Table 4.
Multivariate linear regression fitting function for uniaxial compressive strength under different numbers of dry–wet cycles.
In the formula, Y1 represents the proportion of quartz sand in the total mass; ; Y2 is the proportion of barite in the total mass; , Y3 is the proportion of cement in the total mass, ; and Y4 is the proportion of gypsum in the total mass, .
The R2 values ranging from 0.743 to 0.792 indicate that the multiple linear regression models explain 74.3% to 79.2% of the variance in uniaxial compressive strength under wet–dry cycles. These values are considered acceptable in geotechnical engineering due to the inherent variability in material properties and cyclic loading conditions []. After one dry–wet cycle, the absolute error in the predicted uniaxial compressive strength results ranged from 0.004 to 1.461 MPa, with an average error of 0.0018 MPa and a fitting confidence level of 84.3%. Following two dry–wet cycles, the absolute error ranged from 0.003 to 1.21 MPa, with an average error of 0.08 MPa and a fitting confidence level of 87.4%. After three dry–wet cycles, the absolute error was between 0.003 and 1.125 MPa, with an average error of 0.358 MPa and a fitting confidence level of 89.7%. The multivariate linear regression fitting function for uniaxial compressive strength under different numbers of dry–wet cycles is illustrated in Figure 9.
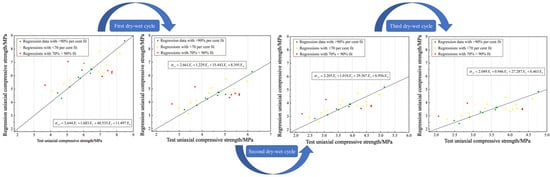
Figure 9.
Multivariate linear regression fitting function for uniaxial compressive strength under different numbers of dry–wet cycles.
4.3. Water-Damage Effect
By analysing the variation characteristics of uniaxial compressive strength and the number of dry–wet cycles of similar materials, it was observed that aqueous solutions significantly damage these materials, a phenomenon referred to as the water-damage effect. This effect arises from the invasion and evaporation of water, leading to a decline in physical and chemical properties. During the dry–wet cycling process, the materials experience repeated cycles of water absorption and expansion, followed by drying and contraction. This cyclic action can compromise the internal structure of the materials, resulting in decreased strength and durability. The composition of similar materials reflects the raw materials’ ability to resist water damage after undergoing the dry–wet cycle process. The data obtained from the quantitative characterisation of this resistance and the corresponding uniaxial compressive strength were defined as the water-damage resistance coefficient, denoted as S. To determine the water-damage resistance coefficient of similar materials, the least-squares curve fitting method was applied to fit and obtain the coefficient for each raw material, as shown in Table 5.
Table 5.
Water-damage resistance coefficient reference table.
Based on Equation (2), represents the number of dry–wet cycles, represents the uniaxial compressive strength after the dry–wet cycle, denotes the uniaxial compressive strength under natural conditions, indicates the proportion of quartz sand in the total mass, refers to the proportion of barite in the total mass, signifies the proportion of cement in the total mass, and symbolises the proportion of gypsum in the total mass.
The relationship between the water-damage resistance coefficients of the four raw materials followed the order: > > > . Quartz sand, primarily composed of silicon dioxide, exhibits stable chemical properties and is not easily reactive with water. During dry–wet cycling, quartz sand demonstrated relatively good durability and was not prone to significant performance degradation due to moisture changes. Barite, with barium sulphate as its main component, may experience relatively weak erosion from acidic and alkaline components. In contrast, gypsum may develop microcracks in its hardened structure due to repeated water absorption during the dry–wet cycling process, which can adversely affect its overall strength and durability. However, cement may contain components that do not fully react during the hardening process. Continuous contact with water can promote the hydration reaction of these components, further increasing the compressive strength of similar materials. The water-damage resistance coefficient effectively validated the comparative results of the water resistance of the four raw materials obtained from the previous experimental summary.
5. Conclusions
This study aimed to develop fluid–solid coupled similar materials to enhance the reliability of geotechnical model tests simulating reservoir slope stability under water-level fluctuations. Through an orthogonal experimental design, comprehensive mechanical and hydrological tests, and multivariate regression analysis, we systematically investigated the physical and mechanical properties of materials with varying proportions. The key findings are:
(1) The orthogonal experimental design with 25 proportioning schemes across five levels of binder–aggregate, quartz sand–aggregate, and cement–binder ratios, combined with sensitivity analysis, established a robust framework for quantifying material properties and revealed a clear influence hierarchy: cement > quartz sand > barite > gypsum, guiding optimal proportioning.
(2) Higher cement-to-binder ratios enhance bulk density (1.92–2.15 g/cm3), uniaxial compressive strength (2.15–4.82 MPa), cohesion, and reduce hydraulic conductivity (1.8 × 10⁻⁶ cm/s), outperforming gypsum, while binder-to-aggregate ratios govern elastic modulus and internal friction angle (25.4°–37.6°), critical for slope stability simulation.
(3) Uniaxial compressive strength degrades under dry–wet cycles, with diminishing deterioration rates (error reduced from 8.7% to 5.2% after five cycles), and the water-damage resistance coefficient quantifies material durability against water-induced damage in hydrologically active zones.
(4) Multivariate regression analysis demonstrated strong linear relationships between raw materials and properties, enabling predictive equations with low errors (5.2%) and supporting the design of stable reservoir slopes and water-prone structures, like coastal embankments.
By addressing water-induced degradation, this study improves the simulation of reservoir slope behaviour under fluctuating water levels. Future research should explore: (1) alternative binders, such as polymers, to further enhance water resistance; (2) dynamic degradation models incorporating real-time water flow and stress interactions; (3) scaling effects in large-scale model tests to bridge laboratory and field conditions; (4) field validation of material performance in actual reservoir slope projects; and (5) mechanistic studies of water-damage effects to refine the resistance coefficient. These directions will advance the development and application of fluid–solid coupled materials in geotechnical engineering.
Author Contributions
Writing—original draft preparation and Experiment, C.S.; Resources, X.X.; Data curation, L.W. All authors have read and agreed to the published version of the manuscript.
Funding
Special Scientific and Technological Project for Work Safety in Hubei Province (SJZX20230909); National Natural Science Foundation of China (52479103).
Data Availability Statement
The original contributions presented in this study are included in the article. Further inquiries can be directed to the corresponding author(s).
Conflicts of Interest
We do not hold any positions, consultancies, or stock ownership in any company or organization that may gain or lose financially from the publication of this manuscript. All sources of funding for this research are disclosed in the manuscript, and there are no other relationships or activities that could appear to have influenced the submitted work.
References
- Tang, M.; Xu, Q.; Yang, H.; Li, S.; Iqbal, J.; Fu, X.; Huang, X.; Cheng, W. Activity law and hydraulics mechanism of landslides with different sliding surface and permeability in the Three Gorges Reservoir Area, China. Eng. Geol. 2019, 260, 105212. [Google Scholar] [CrossRef]
- Huang, D.; Gu, D.M. Influence of filling-drawdown cycles of the Three Gorges reservoir on deformation and failure behaviors of anaclinal rock slopes in the Wu Gorge. Geomorphology 2017, 295, 489–506. [Google Scholar] [CrossRef]
- Yi, X.; Feng, W.; Wu, M.; Ye, Z.; Fang, Y.; Wang, P.; Li, R.; Dun, J. The initial impoundment of the Baihetan reservoir region (China) exacerbated the deformation of the Wangjiashan landslide: Characteristics and mechanism. Landslides 2022, 19, 1897–1912. [Google Scholar] [CrossRef]
- Zhang, J.; Zhu, D.; Zhang, S. Shallow slope stability evolution during rainwater infiltration considering soil cracking state. Comput. Geotech. 2020, 117, 103285. [Google Scholar] [CrossRef]
- Nian, G.Q.; Chen, Z.H.; Bao, M.; Zhang, L.; Zhu, T. Rainfall infiltration and three-dimensional stability analyses of fractured rock slopes considering preferential flow. Nat. Hazards 2023, 118, 2629–2656. [Google Scholar] [CrossRef]
- Zhang, C.Y.; Yin, Y.P.; Yan, H.; Li, H.; Dai, Z.; Zhang, N. Reactivation characteristics and hydrological inducing factors of a massive ancient landslide in the three Gorges Reservoir, China. Eng. Geol. 2021, 292, 102673. [Google Scholar] [CrossRef]
- Song, C.P.; You, S.; Ji, H.G.; Sun, L. Orthogonal testing of compressive strength of similar materials and influence coefficient of material strength. Mater. Rep. 2023, 37, 64–69. (In Chinese) [Google Scholar]
- Zhao, J.H.; Chen, J.T.; Zhang, X.G.; Ning, J.; Zhang, Y.Z. Distribution characteristics of floor pore water pressure based on similarity simulation experiments. Bull. Eng. Geol. Environ. 2020, 79, 4805–4816. [Google Scholar] [CrossRef]
- Liu, X.S.; Song, S.L.; Tan, Y.L.; Fan, D.Y.; Ning, J.G.; Li, X.B.; Yin, Y.C. Similar simulation study on the deformation and failure of surrounding rock of a large section chamber group under dynamic loading. Int. J. Min. Sci. Technol. 2021, 31, 495–505. [Google Scholar] [CrossRef]
- Cheng, B.W.; Huang, J.H.; Liu, T.T.; Wang, N.; Li, X. Research and application of coral reef limestone similar material development and model testing. J. Build. Eng. 2023, 80, 107940. [Google Scholar] [CrossRef]
- Pang, J.; Zhang, X.H.; Zhang, B.L. Orthogonal Experimental Study on the Construction of a Similar Material Proportional Model for Simulated Coal Seam Sampling. Processes 2023, 11, 2125. [Google Scholar] [CrossRef]
- Luo, Y.; Tao, Y.H.; Zhang, M.C.; Gong, H.; Li, X. Experimental study on mix proportions of similar materials to reef limestone. Constr. Build. Mater. 2023, 365, 130111. [Google Scholar] [CrossRef]
- Sun, L.; Wang, W.-X.; Xu, J.-S. Study on Proportioning Scheme of Coal System Rocky Similar Material Based on Orthogonal Test. Materials 2023, 16, 7113. [Google Scholar] [CrossRef]
- Yang, X.L.; Dong, J.Y.; Yang, J.H.; Han, X. Similar Material Proportioning Tests and Mechanical Properties Based on Orthogonal Design. Materials 2023, 16, 6439. [Google Scholar] [CrossRef] [PubMed]
- Zeng, C.L.; Zhou, Y.J.; Xu, X.D. Research on the ratio of similar materials in water-absorbent mudstone based on fuzzy mathematics. Sci. Rep. 2024, 14, 4289. [Google Scholar] [CrossRef] [PubMed]
- Shi, W.P.; Zhang, J.W.; Xin, C.L.; Song, D.; Hu, N.; Li, B. Proportioning Test on the Similar Materials of the Rock Mass Physical Model Test Considering Seepage and Dynamic Characteristics. J. Mar. Sci. Eng. 2023, 11, 1815. [Google Scholar] [CrossRef]
- Li, B.P.; Cheng, Y.H.; Li, F.H. Development and Constitutive Model of Fluid–Solid Coupling Similar Materials. Sustainability 2023, 15, 3379. [Google Scholar] [CrossRef]
- Wu, W.L.; Guo, J.Q.; Liu, X.L.; Zhu, Z.; Wang, E. Experimental Study on Similar Materials for Fluid–Solid Coupling for Model Test of Water Inrush in Karst Tunnel. Geotech. Geol. Eng. 2023, 41, 4119–4135. [Google Scholar] [CrossRef]
- Zan, W.B.; Lai, J.X.; Zhang, W.J.; Yang, Q.; Qin, Y.; Su, X. Experimental and applied research on similar materials to granular mixtures for solid-liquid coupling model test of an underwater tunnel. Constr. Build. Mater. 2024, 416, 135170. [Google Scholar] [CrossRef]
- Cui, Y.; Xu, C.; Xue, L.; Dong, J.; Jiang, T. Experimental study on the reasonable proportions of rock-like materials for water-induced strength degradation in rock slope model test. Sci. Rep. 2023, 13, 9288. [Google Scholar] [CrossRef]
- Liu, S.L.; Liu, W.T. Experimental Development Process of a New Fluid–Solid Coupling Similar-Material Based on the Orthogonal Test. Processes 2018, 6, 211. [Google Scholar] [CrossRef]
- Zhao, W.S.; Guo, H.; Chen, W.Z.; Liu, J.; Peng, W.; Zhou, S. Experimental study on similar materials for tunnel lining concrete in geomechanical model tests. Eng. Fail. Anal. 2023, 152, 107456. [Google Scholar] [CrossRef]
- Xu, Z.L.; Luo, Y.B.; Chen, J.X.; Su, Z.; Zhu, T.; Yuan, J. Mechanical properties and reasonable proportioning of similar materials in physical model test of tunnel lining cracking. Constr. Build. Mater. 2021, 300, 123960. [Google Scholar] [CrossRef]
- Tian, Q.Y.; Zhang, J.T.; Zhang, Y.L. Similar simulation experiment of expressway tunnel in karst area. Constr. Build. Mater. 2018, 176, 1–13. [Google Scholar] [CrossRef]
- Lazaridis, P.C.; Kavvadias, I.E.; Demertzis, K.; Iliadis, L.; Vasiliadis, L.K. Structural Damage Prediction of a Reinforced Concrete Frame under Single and Multiple Seismic Events Using Machine Learning Algorithms. Appl. Sci. 2022, 12, 3845. [Google Scholar] [CrossRef]
- Alice, W.; Adel, A.; Olivier, C. Impact of wetting and drying cycles on the mechanical behaviour of a cement-treated soil. Transp. Geotech. 2022, 36, 100804. [Google Scholar] [CrossRef]
- Zhang, C.; Jiang, F.L.; Tan, B.; Hao, Y.; Zhang, M.; Li, H.; Yang, X.; Mo, Y.; Hu, T.; Li, S.; et al. Determination of optimal blending proportions for similar materials of uranium-bearing quasi-granite using orthogonal design. J. Radioanal. Nucl. Chem. 2023, 332, 539–551. [Google Scholar] [CrossRef]
- Yang, Y.M.; Yue, H.; Zhao, Y.Q.; Zhang, S.; Zhang, J.; Wang, Z.; Yang, W. Experimental Study on Ratio Optimization of Similar Materials for Underground Mining of Shendong Coalfield: A Case Study of Shangwan Coal Mine. Processes 2023, 11, 1352. [Google Scholar] [CrossRef]
- Yang, M.Z.; Yang, Y.; Zhao, B. Study on the Proportion of Conglomerate Similar Materials Based on the Orthogonal Test. Shock Vib. 2021, 2021, 6657323. [Google Scholar] [CrossRef]
- Wen, C.X.; Jia, S.P.; Fu, X.F.; Meng, L.; Zhao, Z. Experimental Research and Sensitivity Analysis of Mudstone Similar Materials Based on Orthogonal Design. Adv. Mater. Sci. Eng. 2020, 2020, 2031276. [Google Scholar] [CrossRef]
- Jiao, P.F.; Zhang, X.; LI, X.Z.; Liu, B.; Zhang, H. Experimental Study on the Ratio of Similar Materials in Weak Surrounding Rock Based on Orthogonal Design. J. Eng. 2018, 2018, 2591758. [Google Scholar] [CrossRef]
- Draper, N.R.; Smith, H. Applied Regression Analysis, 3rd ed.; Wiley: New York, NY, USA, 1998. [Google Scholar]
Disclaimer/Publisher’s Note: The statements, opinions and data contained in all publications are solely those of the individual author(s) and contributor(s) and not of MDPI and/or the editor(s). MDPI and/or the editor(s) disclaim responsibility for any injury to people or property resulting from any ideas, methods, instructions or products referred to in the content. |
© 2025 by the authors. Licensee MDPI, Basel, Switzerland. This article is an open access article distributed under the terms and conditions of the Creative Commons Attribution (CC BY) license (https://creativecommons.org/licenses/by/4.0/).