Author Contributions
All authors contributed to the study conception and design. Formal analysis, Z.S., W.F., X.Z., X.M. and Z.F.; investigation, Z.S., W.F., X.Z., X.M. and Z.F.; validation, Z.S., W.F., X.Z., X.M. and Z.F.; writing—original draft, W.Z.; and all authors commented on previous versions of the manuscript. All authors have read and agreed to the published version of the manuscript.
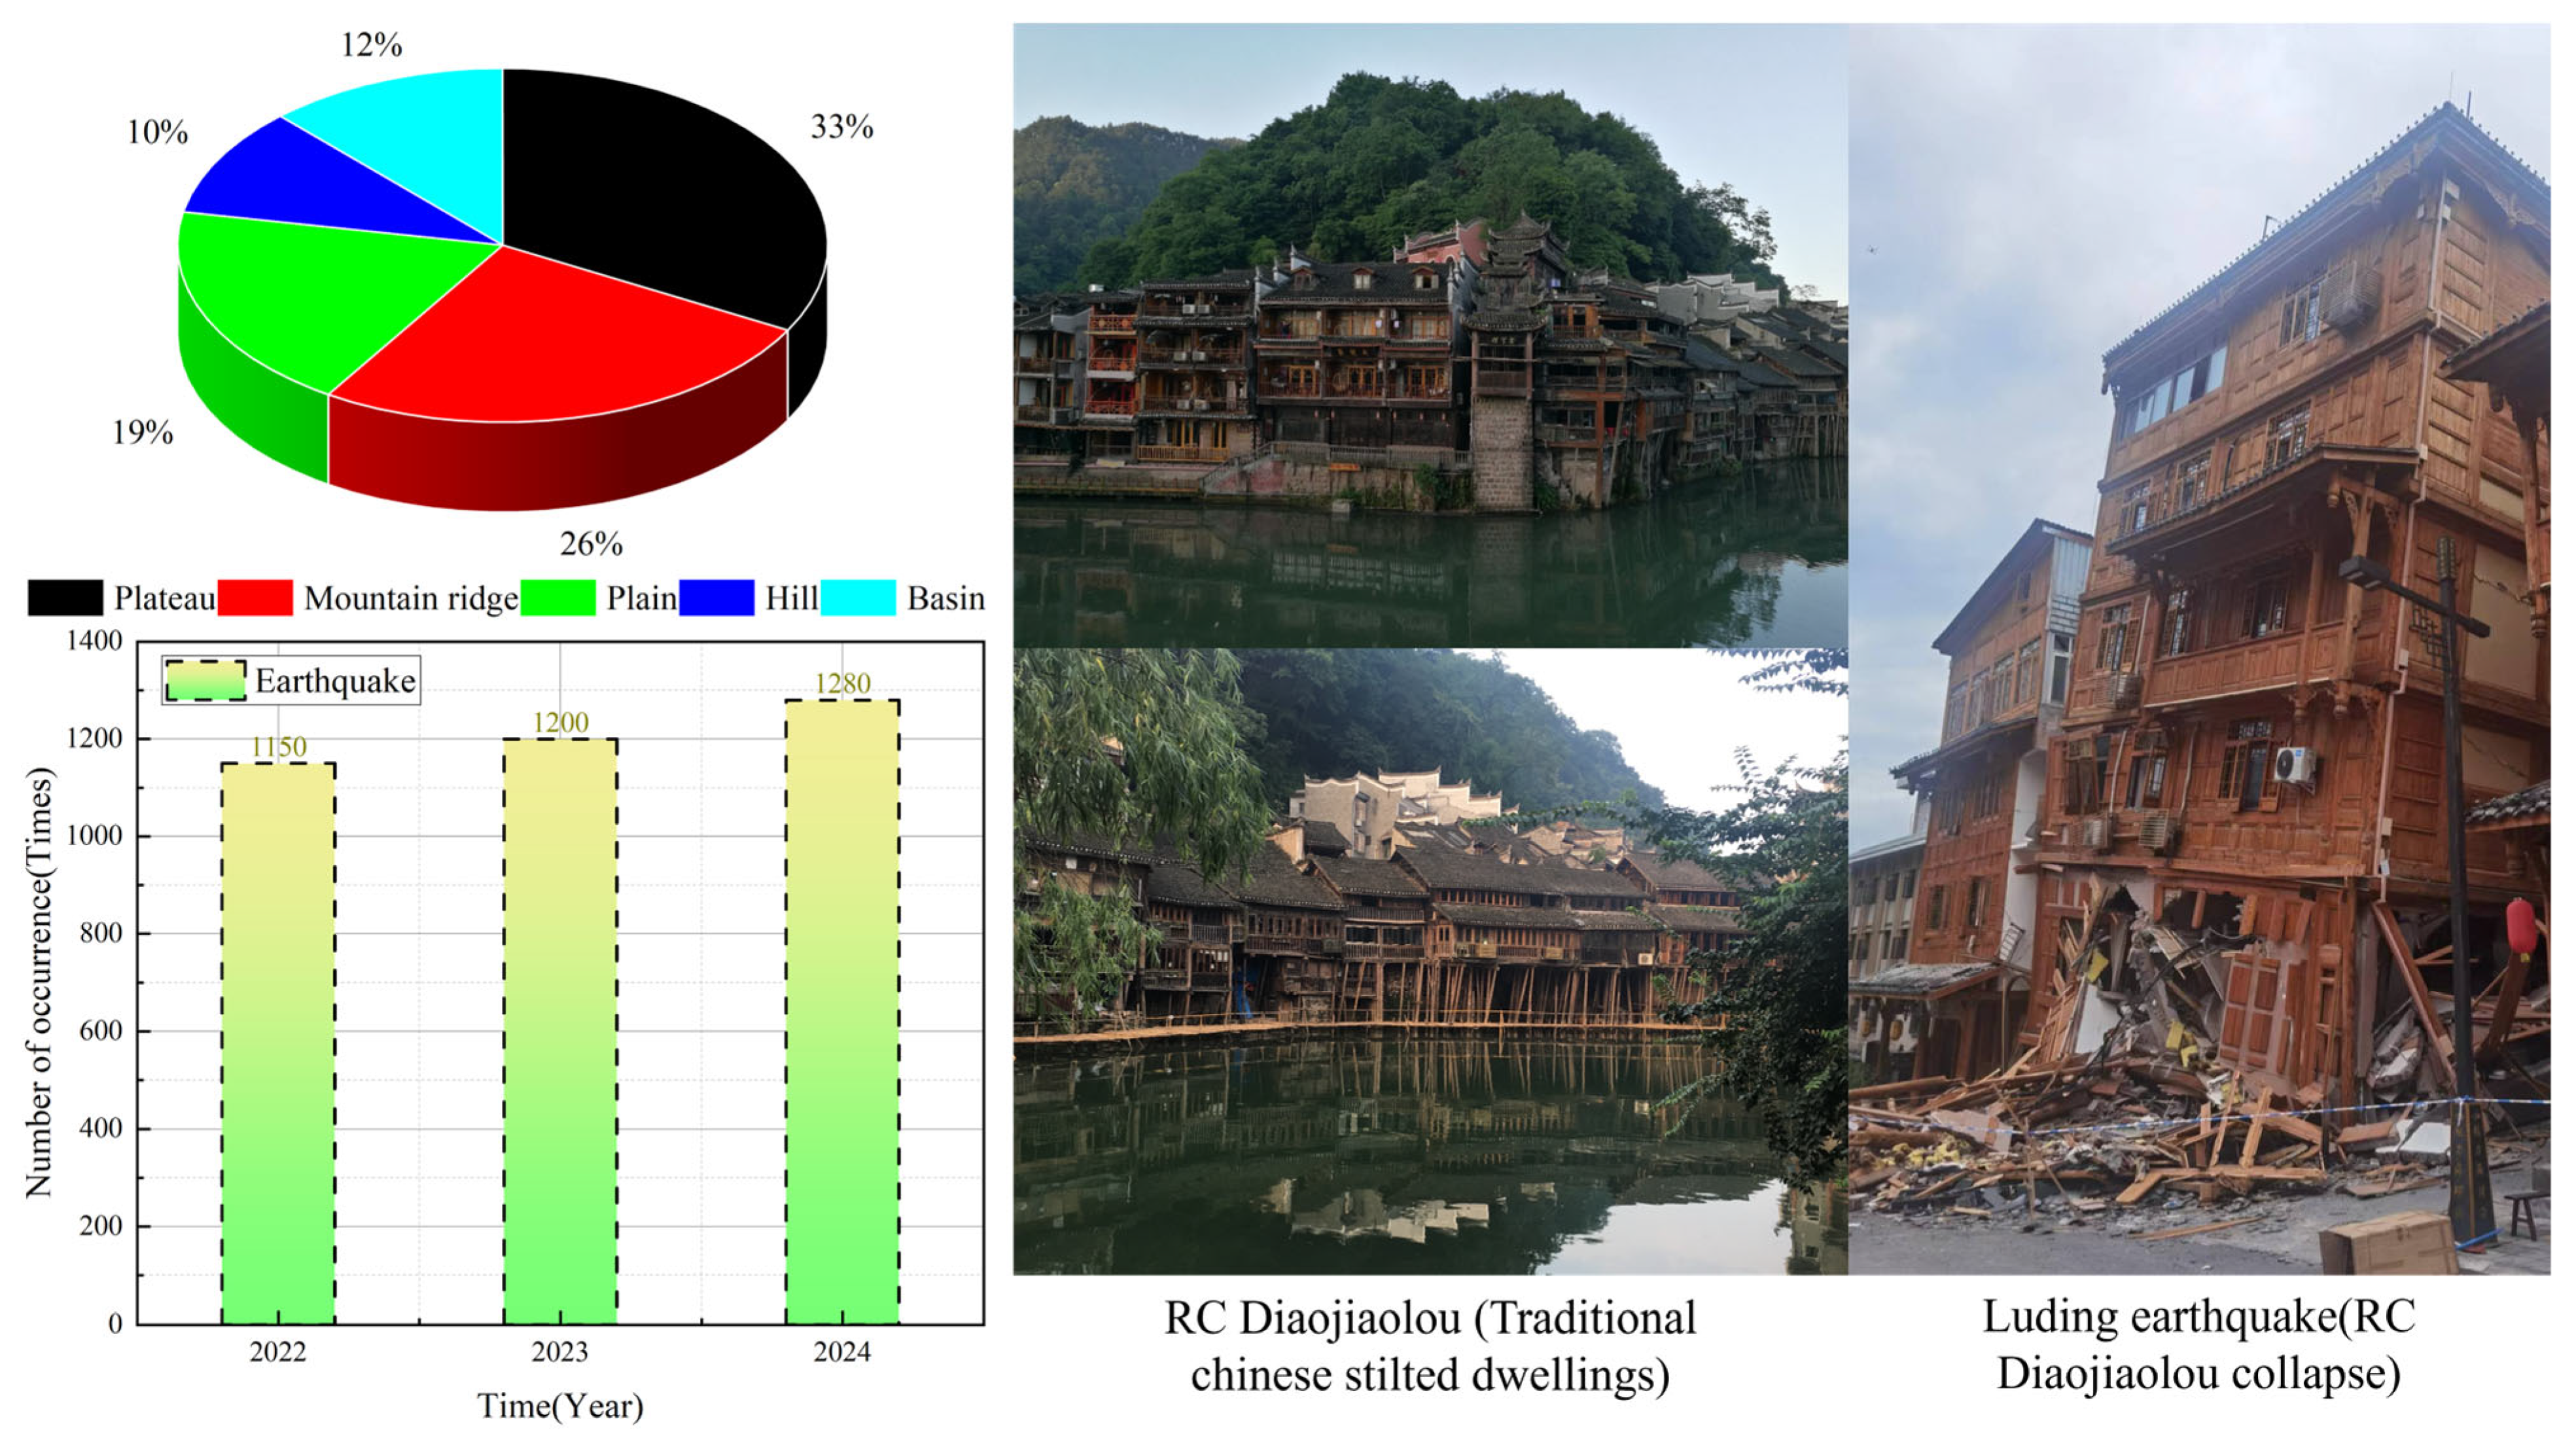
Figure 1.
The proportions of the terrain, the number of seismic activities, and RC Diaojiaolous.
Figure 1.
The proportions of the terrain, the number of seismic activities, and RC Diaojiaolous.
Figure 2.
Test equipment.
Figure 2.
Test equipment.
Figure 3.
Prototype structure of Diaojiaolou.
Figure 3.
Prototype structure of Diaojiaolou.
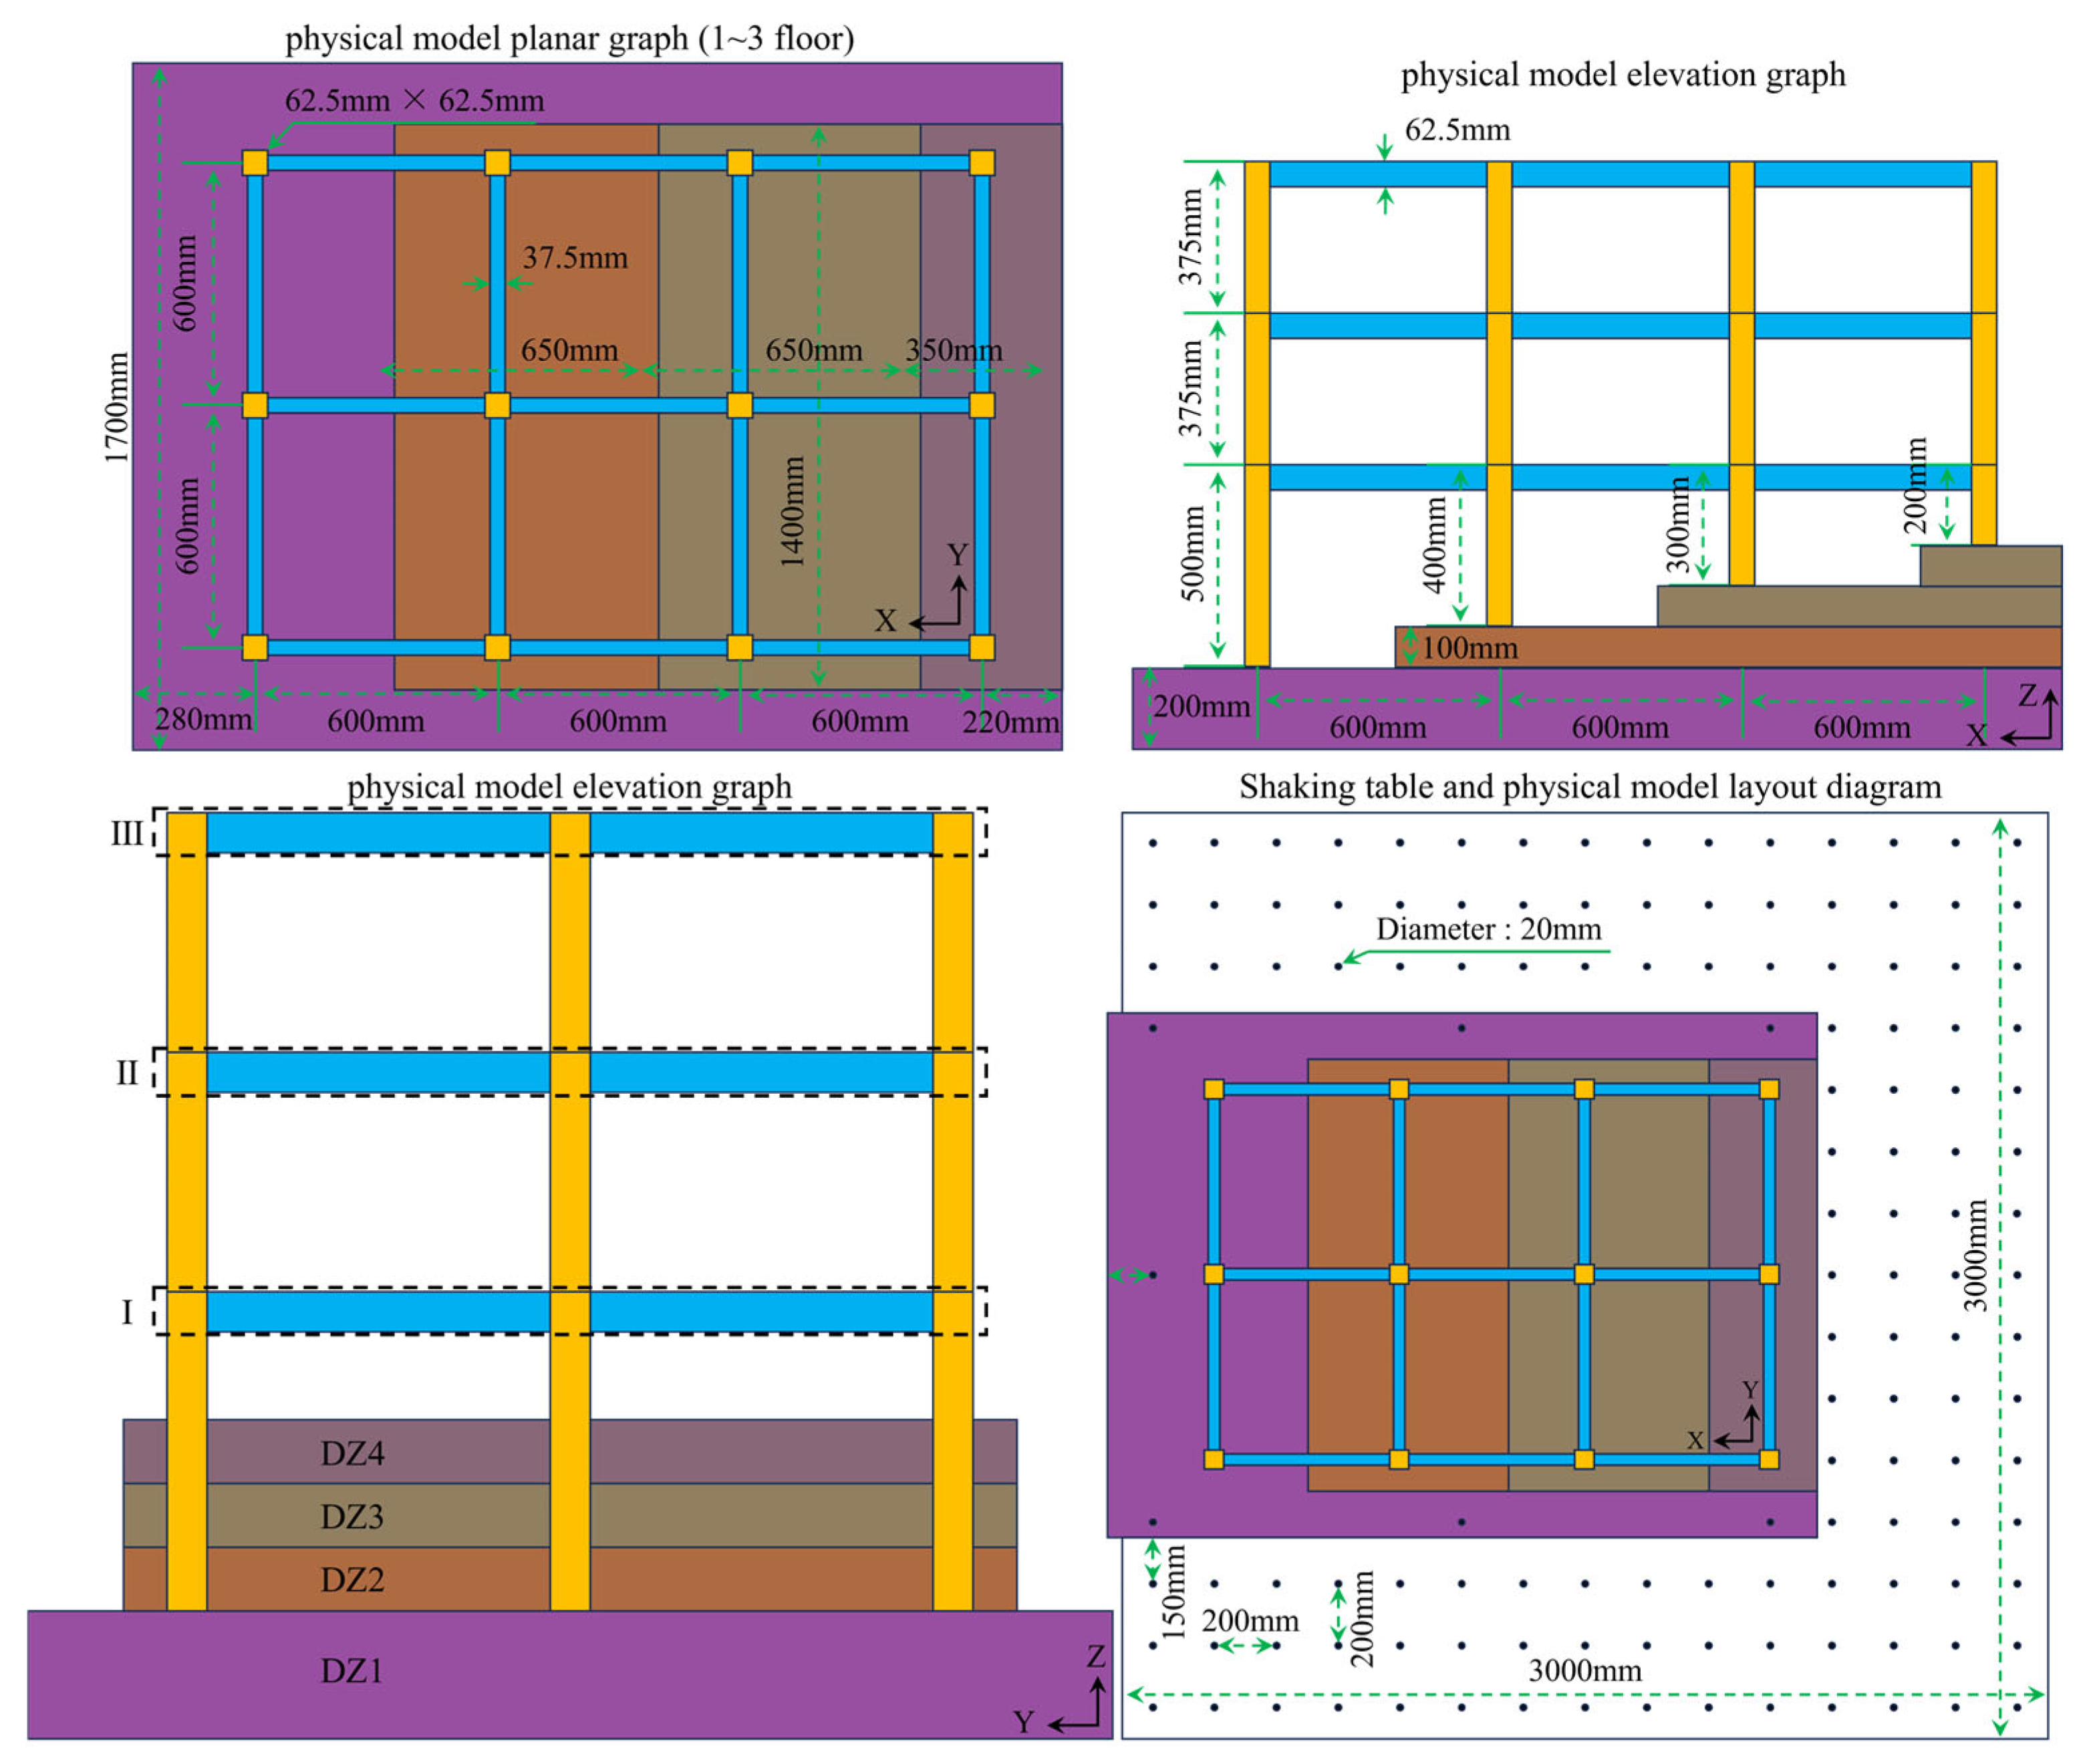
Figure 4.
Size information of shaking table and physical model.
Figure 4.
Size information of shaking table and physical model.
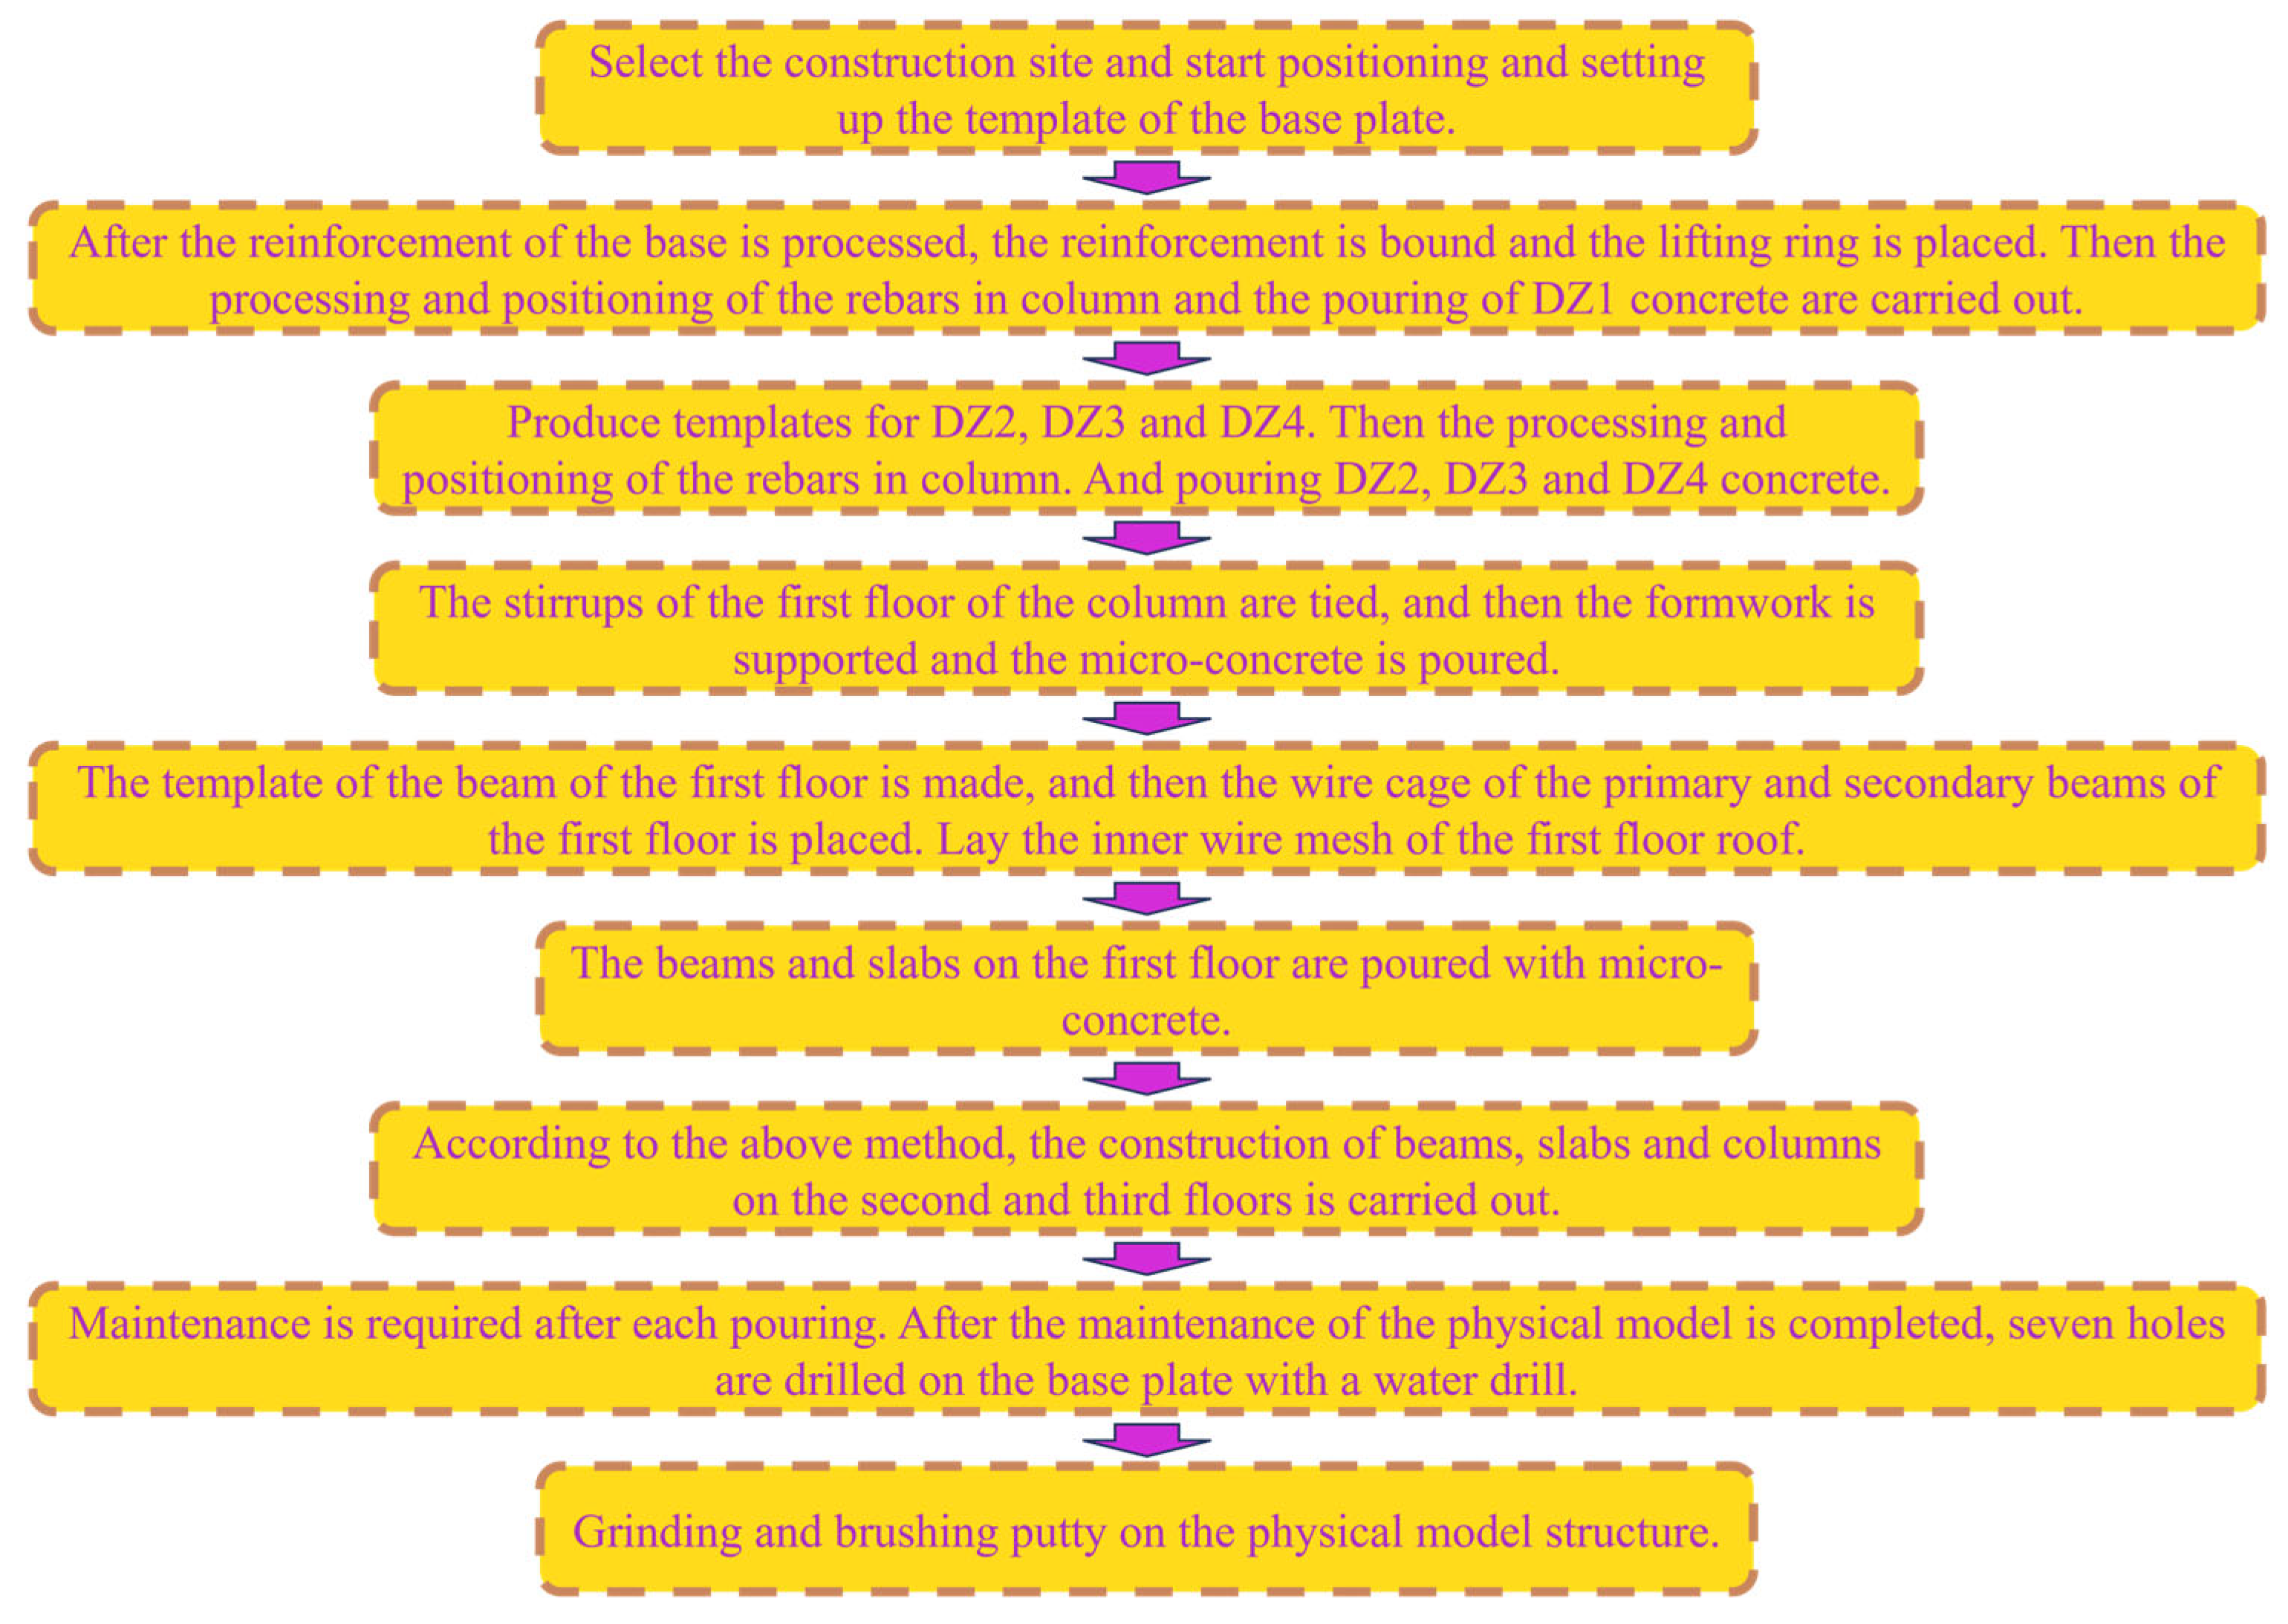
Figure 5.
Physical model-making process.
Figure 5.
Physical model-making process.
Figure 6.
Reinforcement position of carbon-fiber cloth.
Figure 6.
Reinforcement position of carbon-fiber cloth.
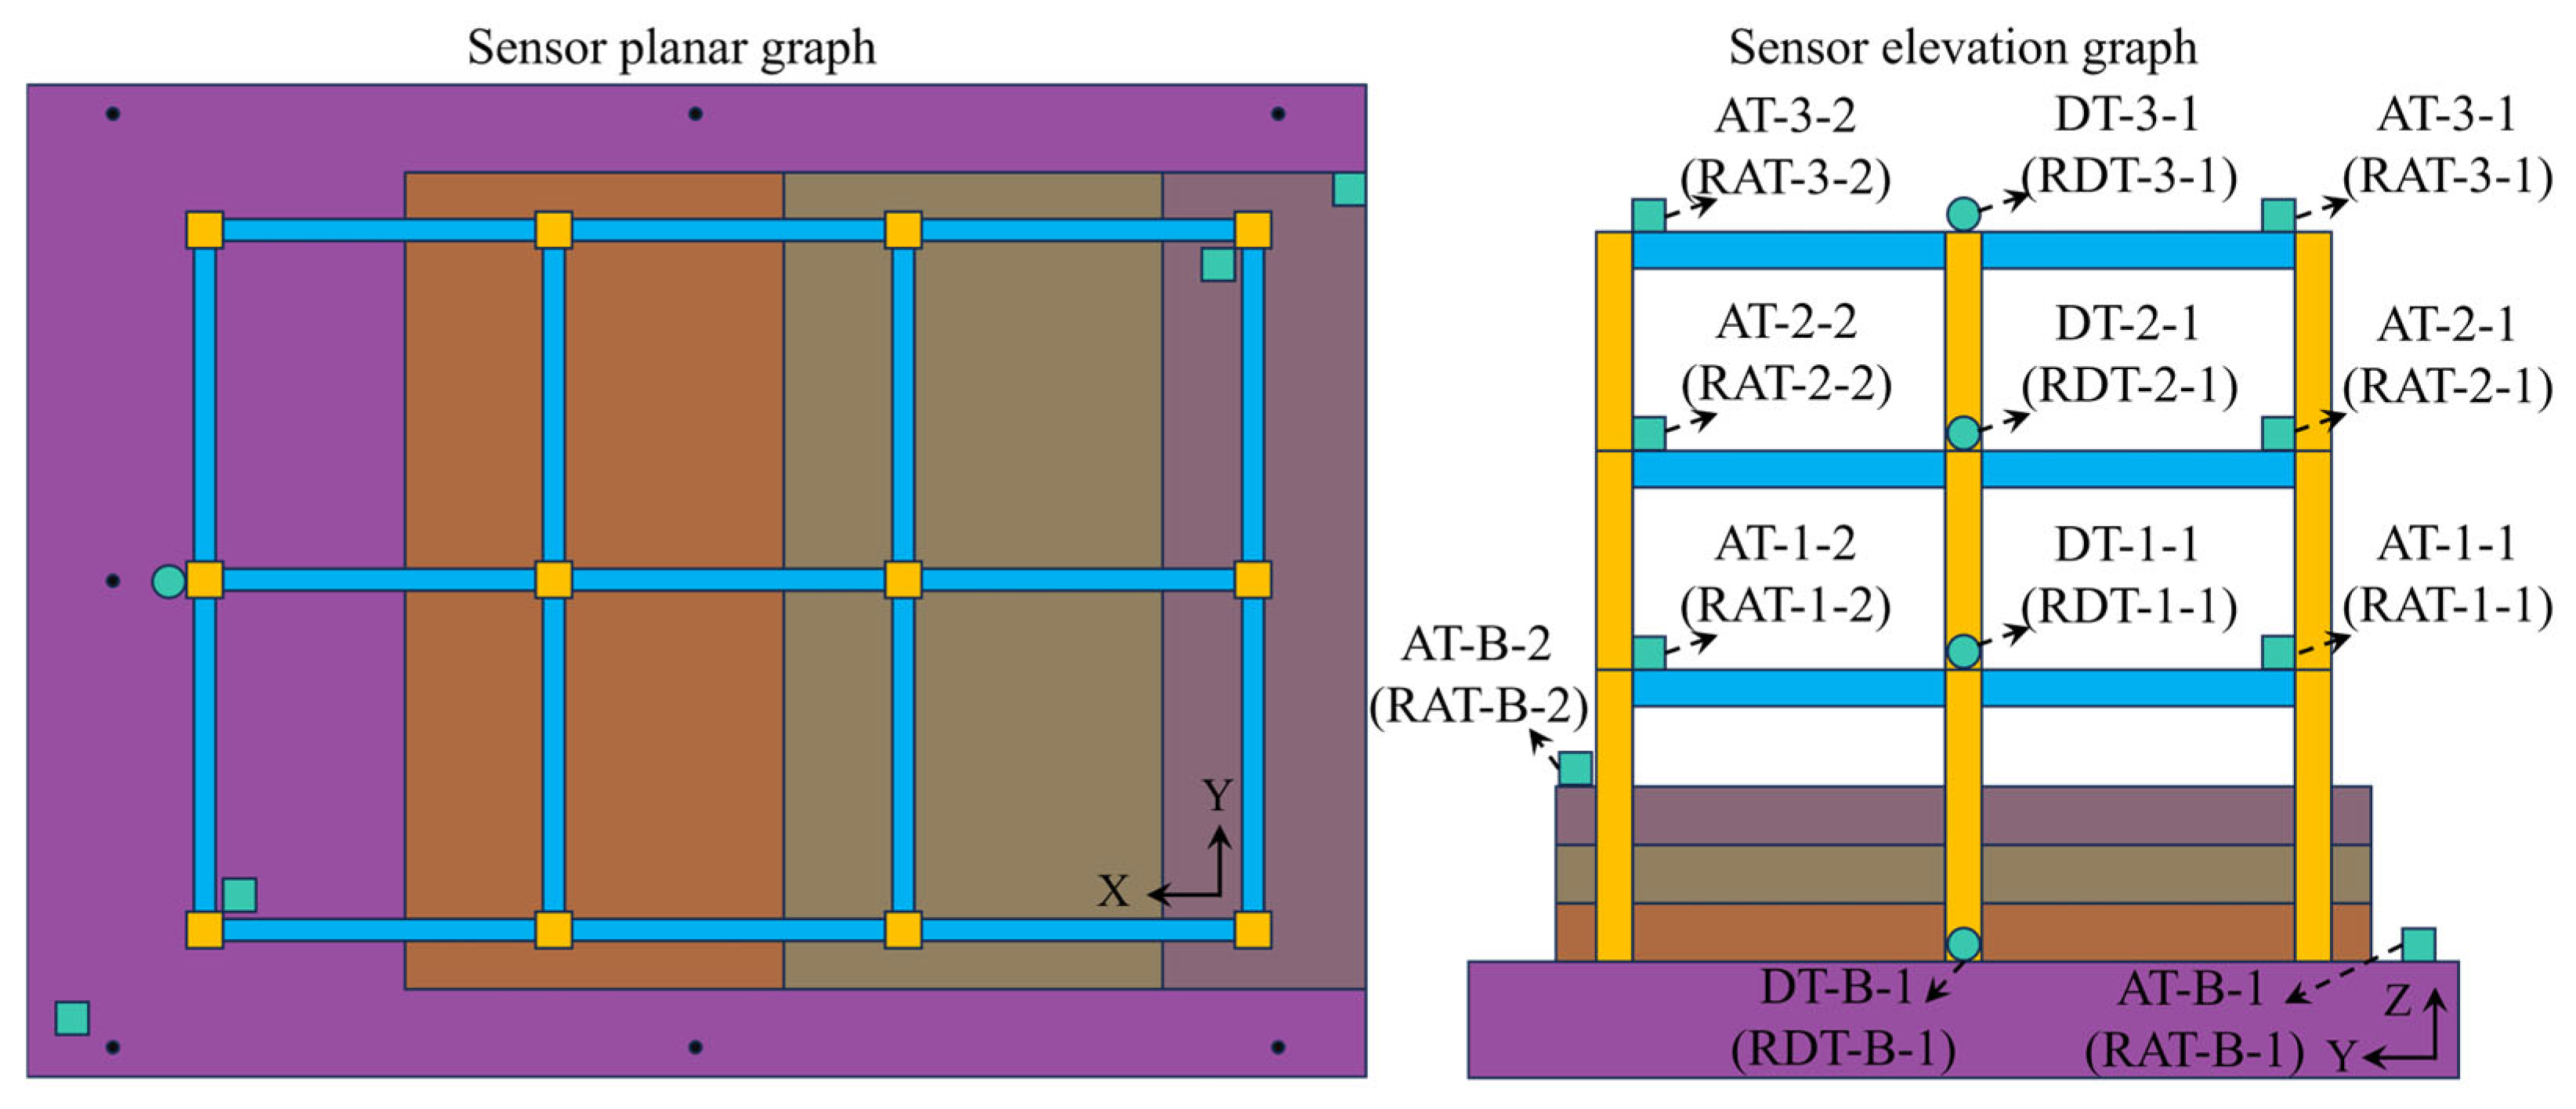
Figure 7.
Sensor distribution diagram.
Figure 7.
Sensor distribution diagram.
Figure 8.
Acceleration time–history curves of ACC, Kobe, Taft, and Wenchuan seismic waves (PGA = 0.07 (g)).
Figure 8.
Acceleration time–history curves of ACC, Kobe, Taft, and Wenchuan seismic waves (PGA = 0.07 (g)).
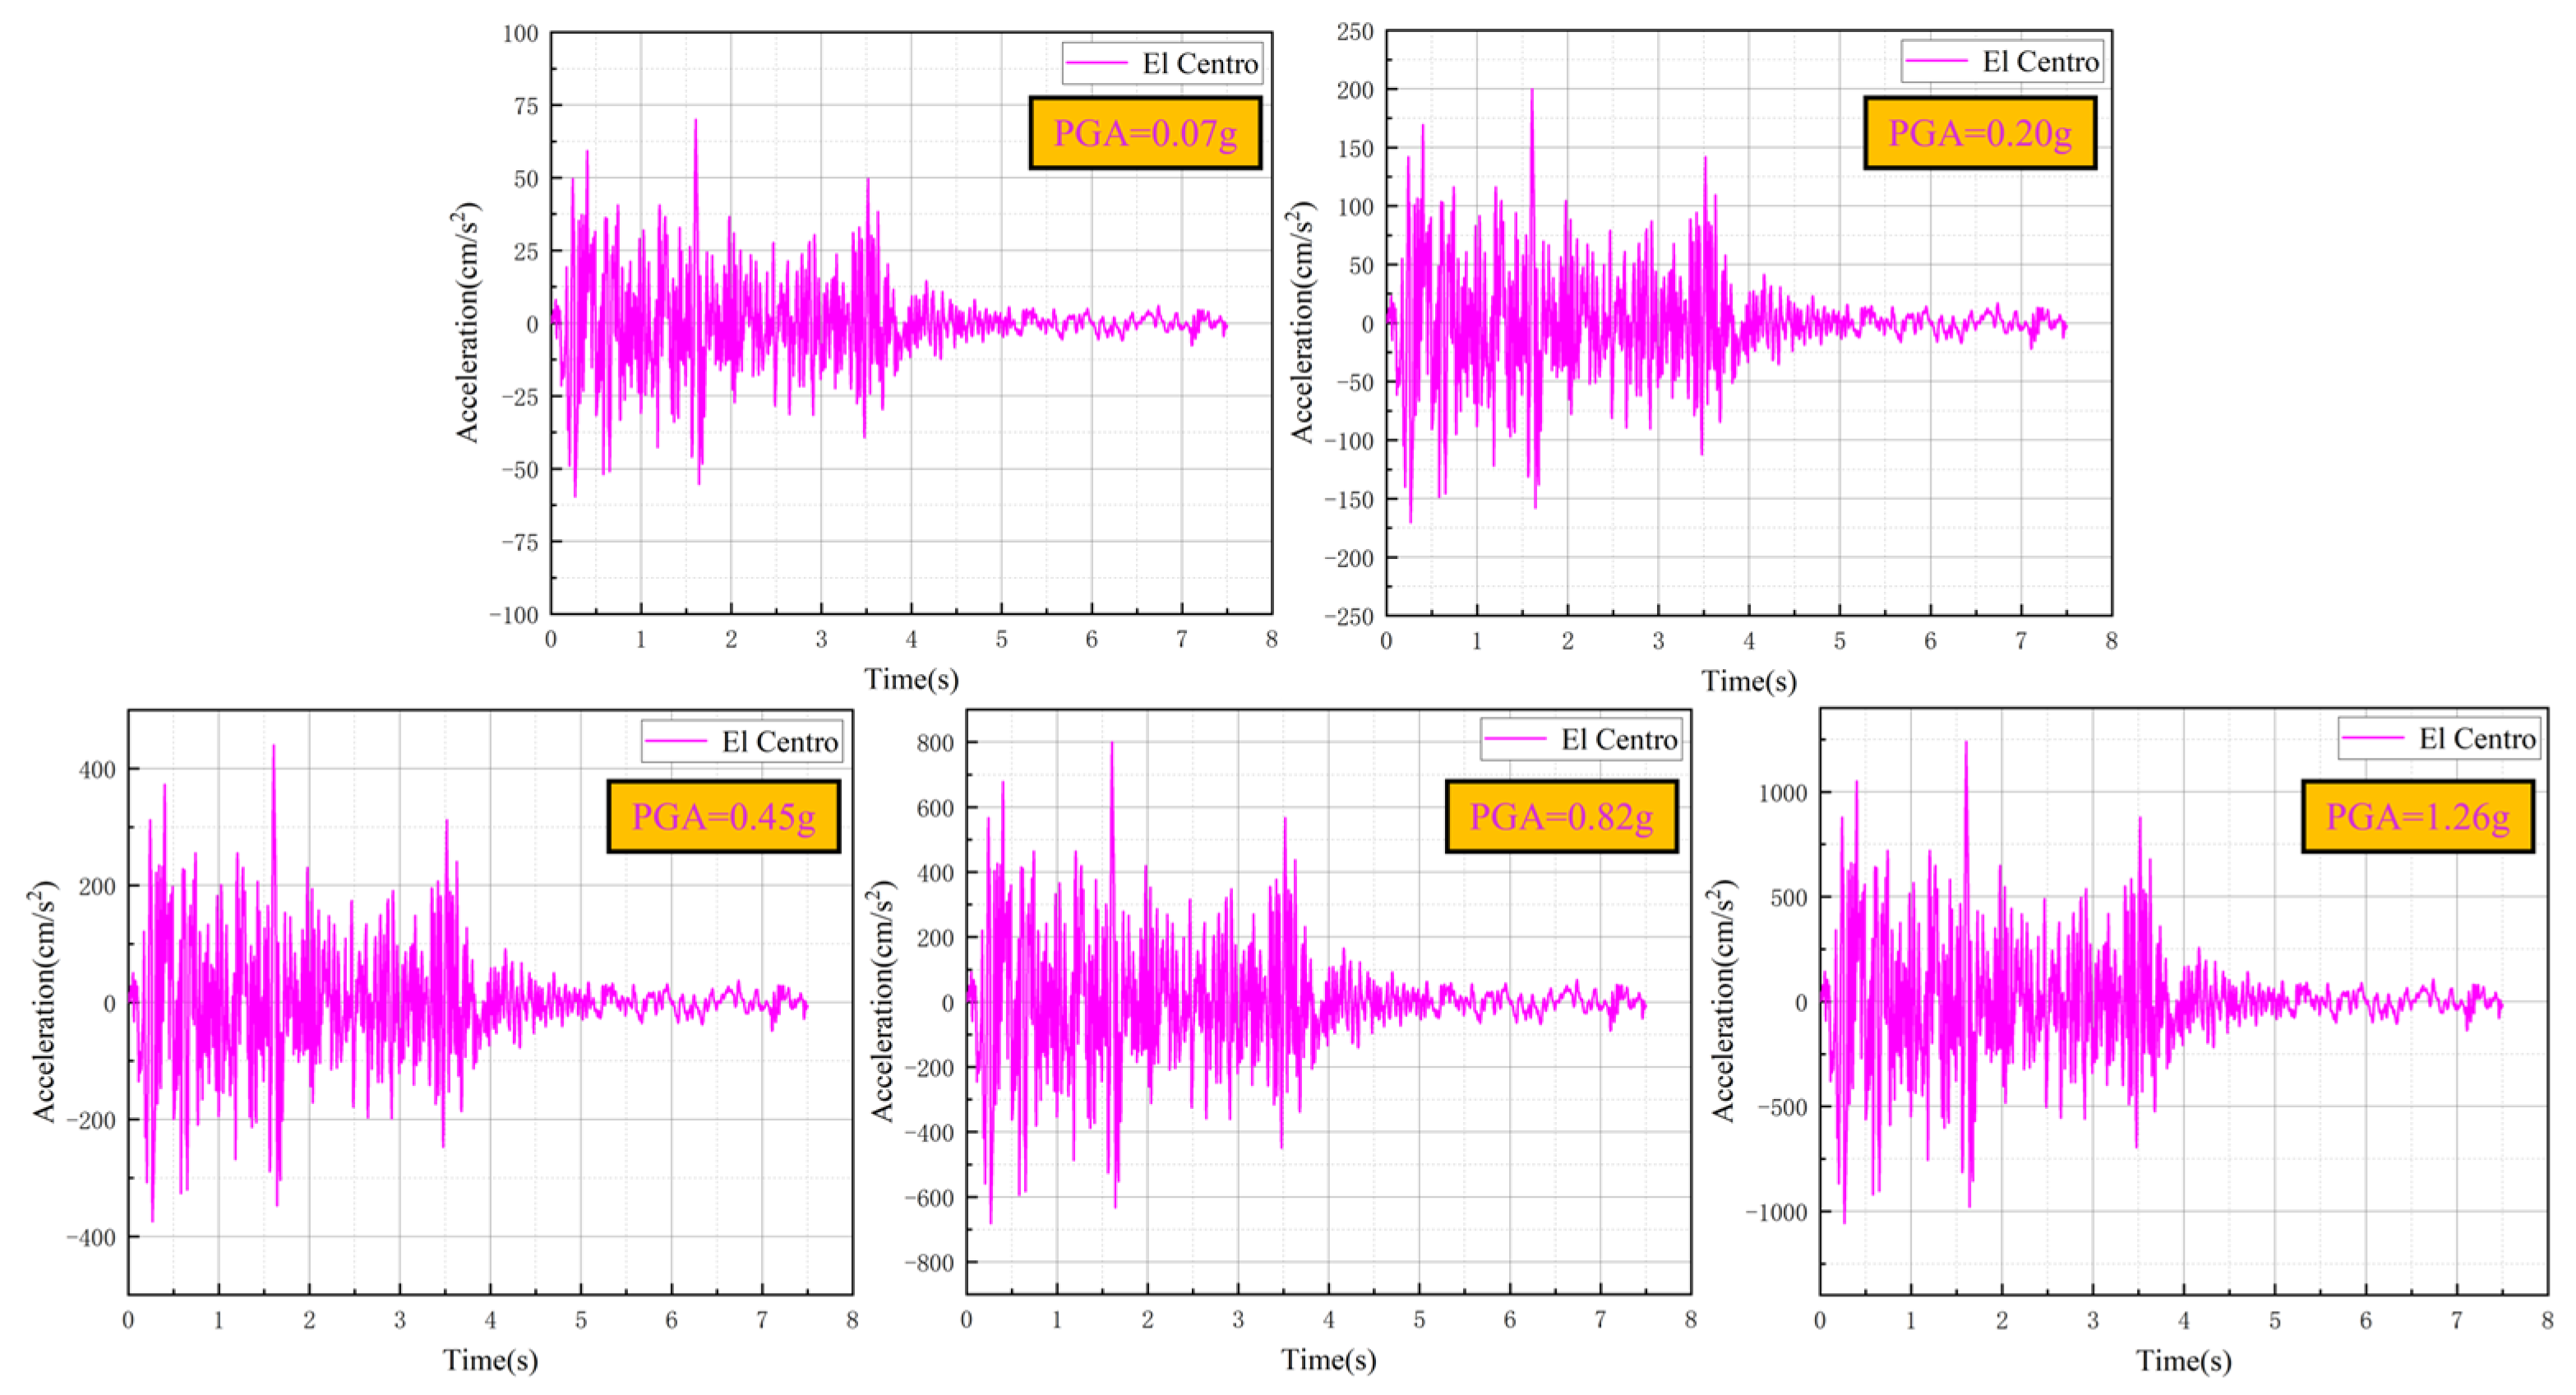
Figure 9.
Acceleration time–history curves of El Centro seismic waves.
Figure 9.
Acceleration time–history curves of El Centro seismic waves.
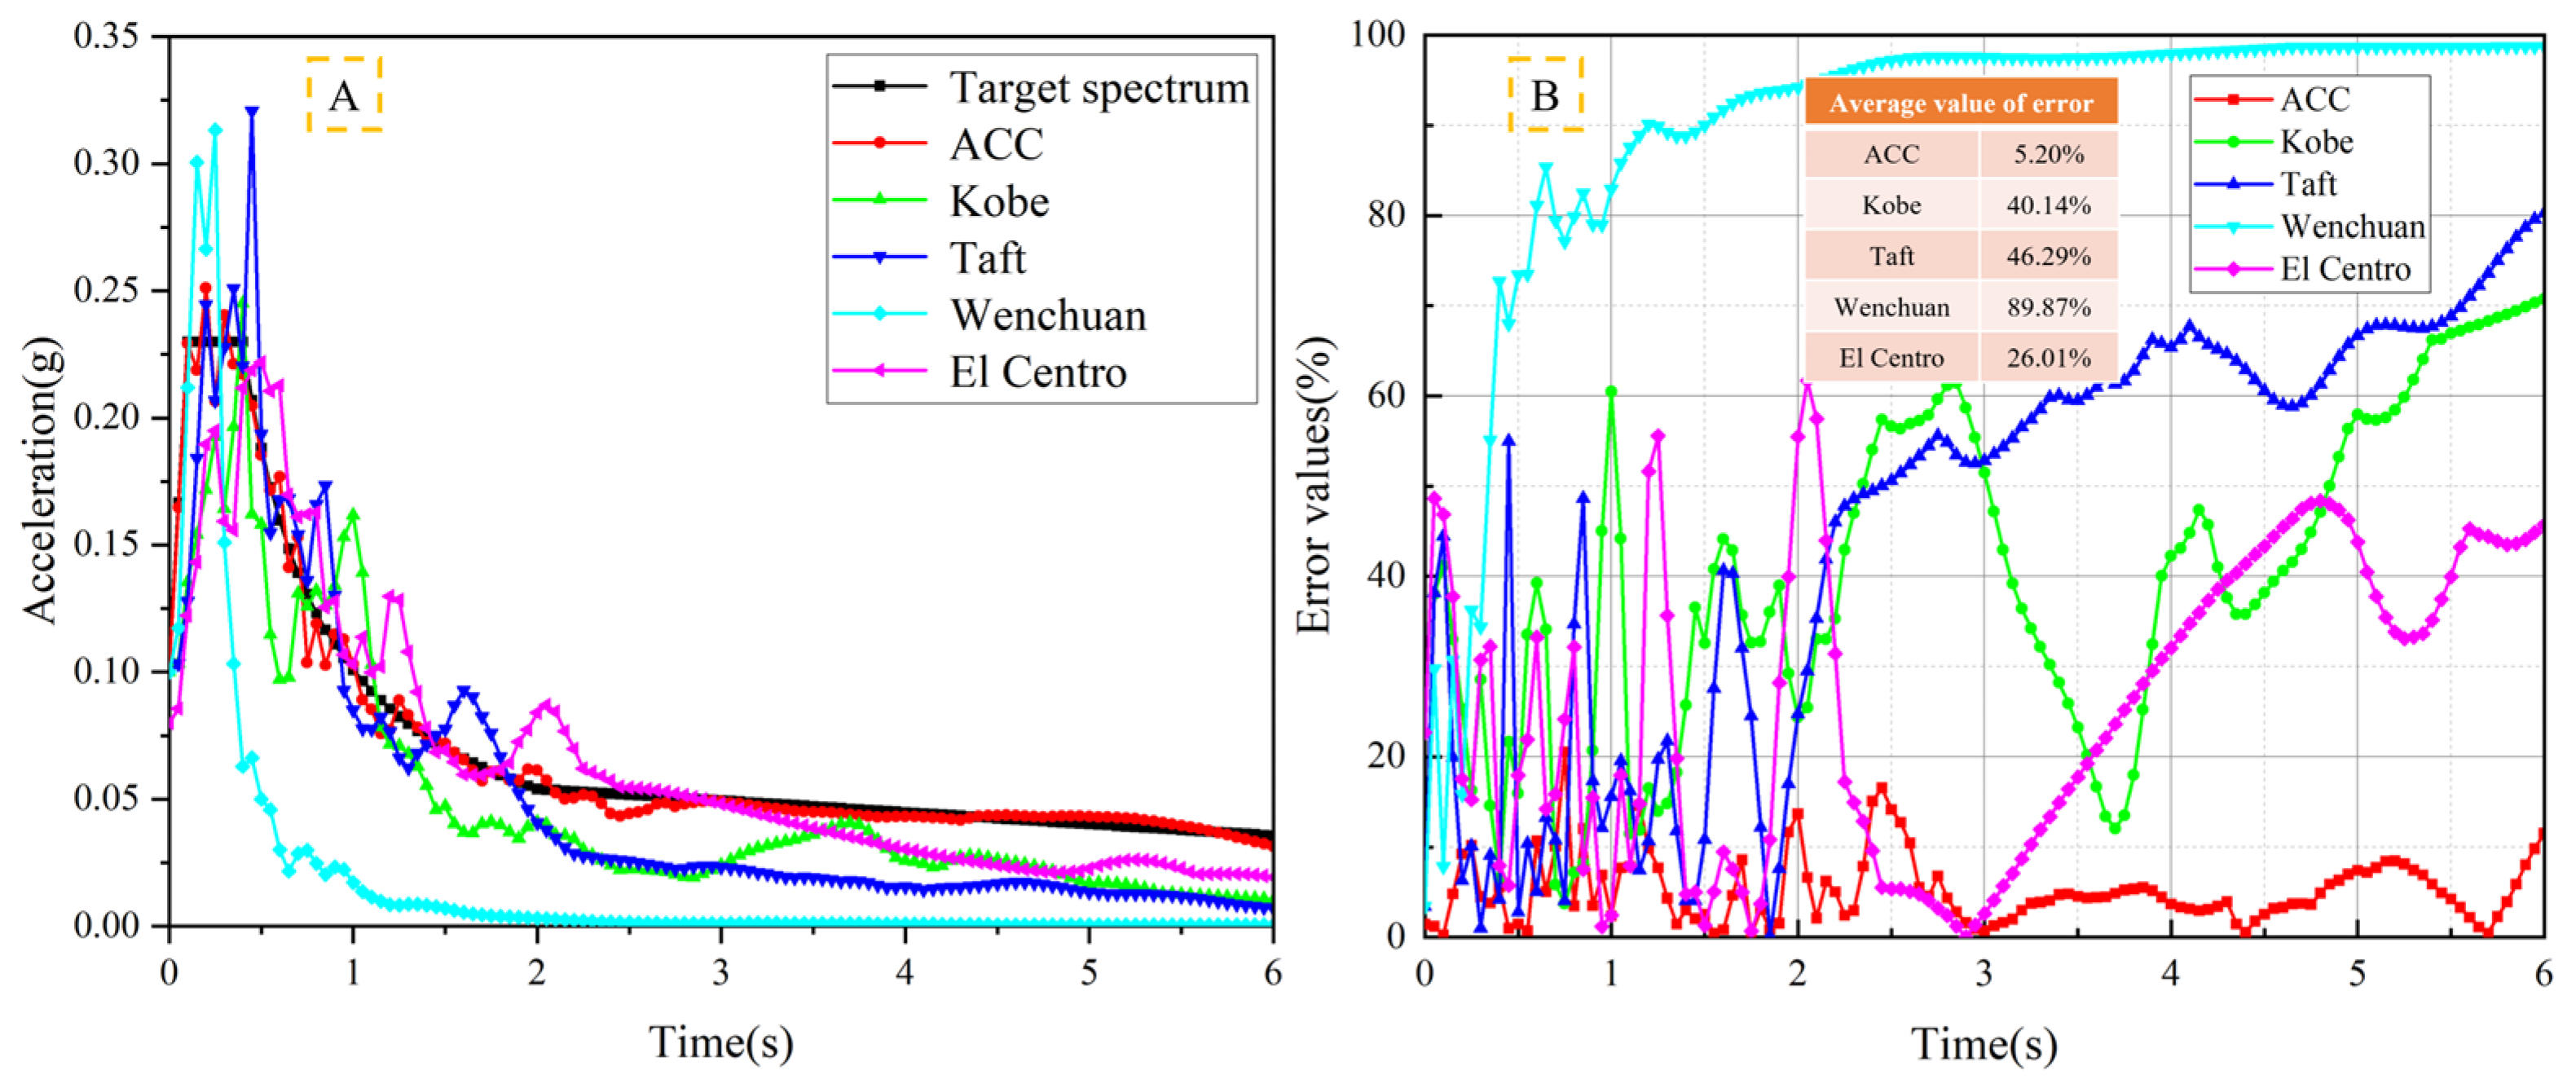
Figure 10.
Response spectrum comparison diagram: (A) seismic wave response spectra and (B) response-spectrum error values.
Figure 10.
Response spectrum comparison diagram: (A) seismic wave response spectra and (B) response-spectrum error values.
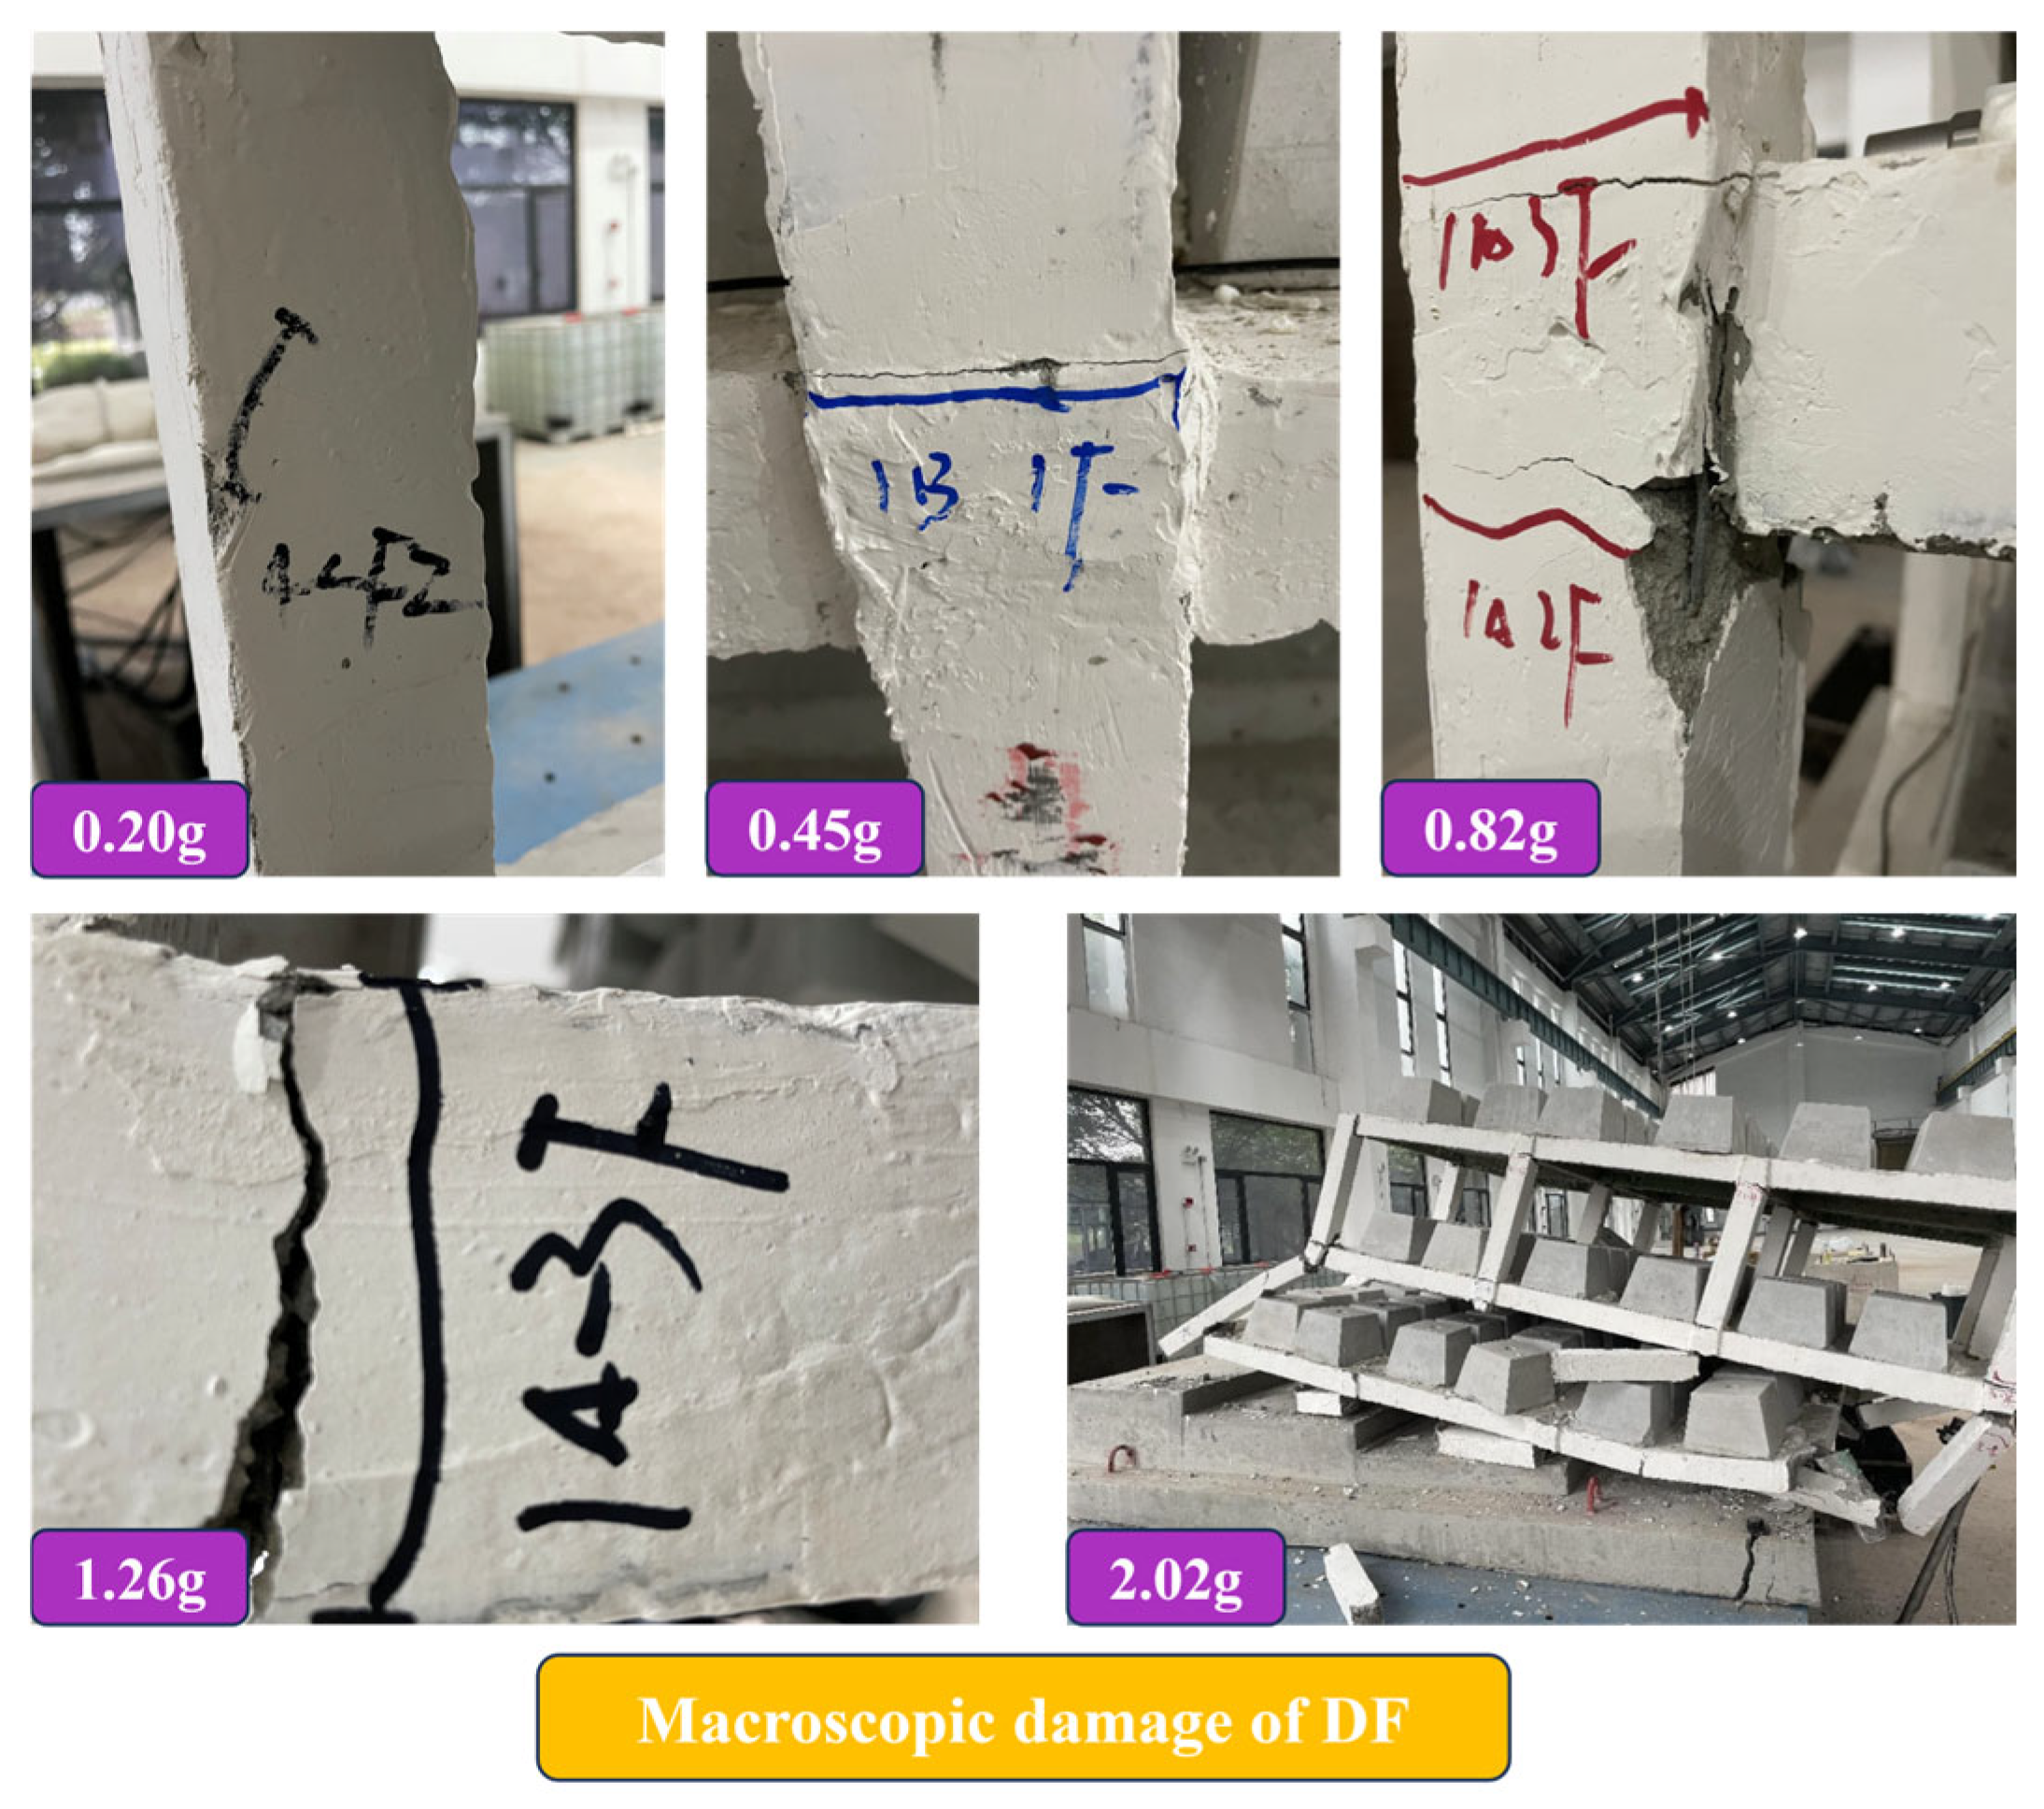
Figure 11.
The macroscopic damage-development process of DF.
Figure 11.
The macroscopic damage-development process of DF.
Figure 12.
The macroscopic damage-development process of CDF.
Figure 12.
The macroscopic damage-development process of CDF.
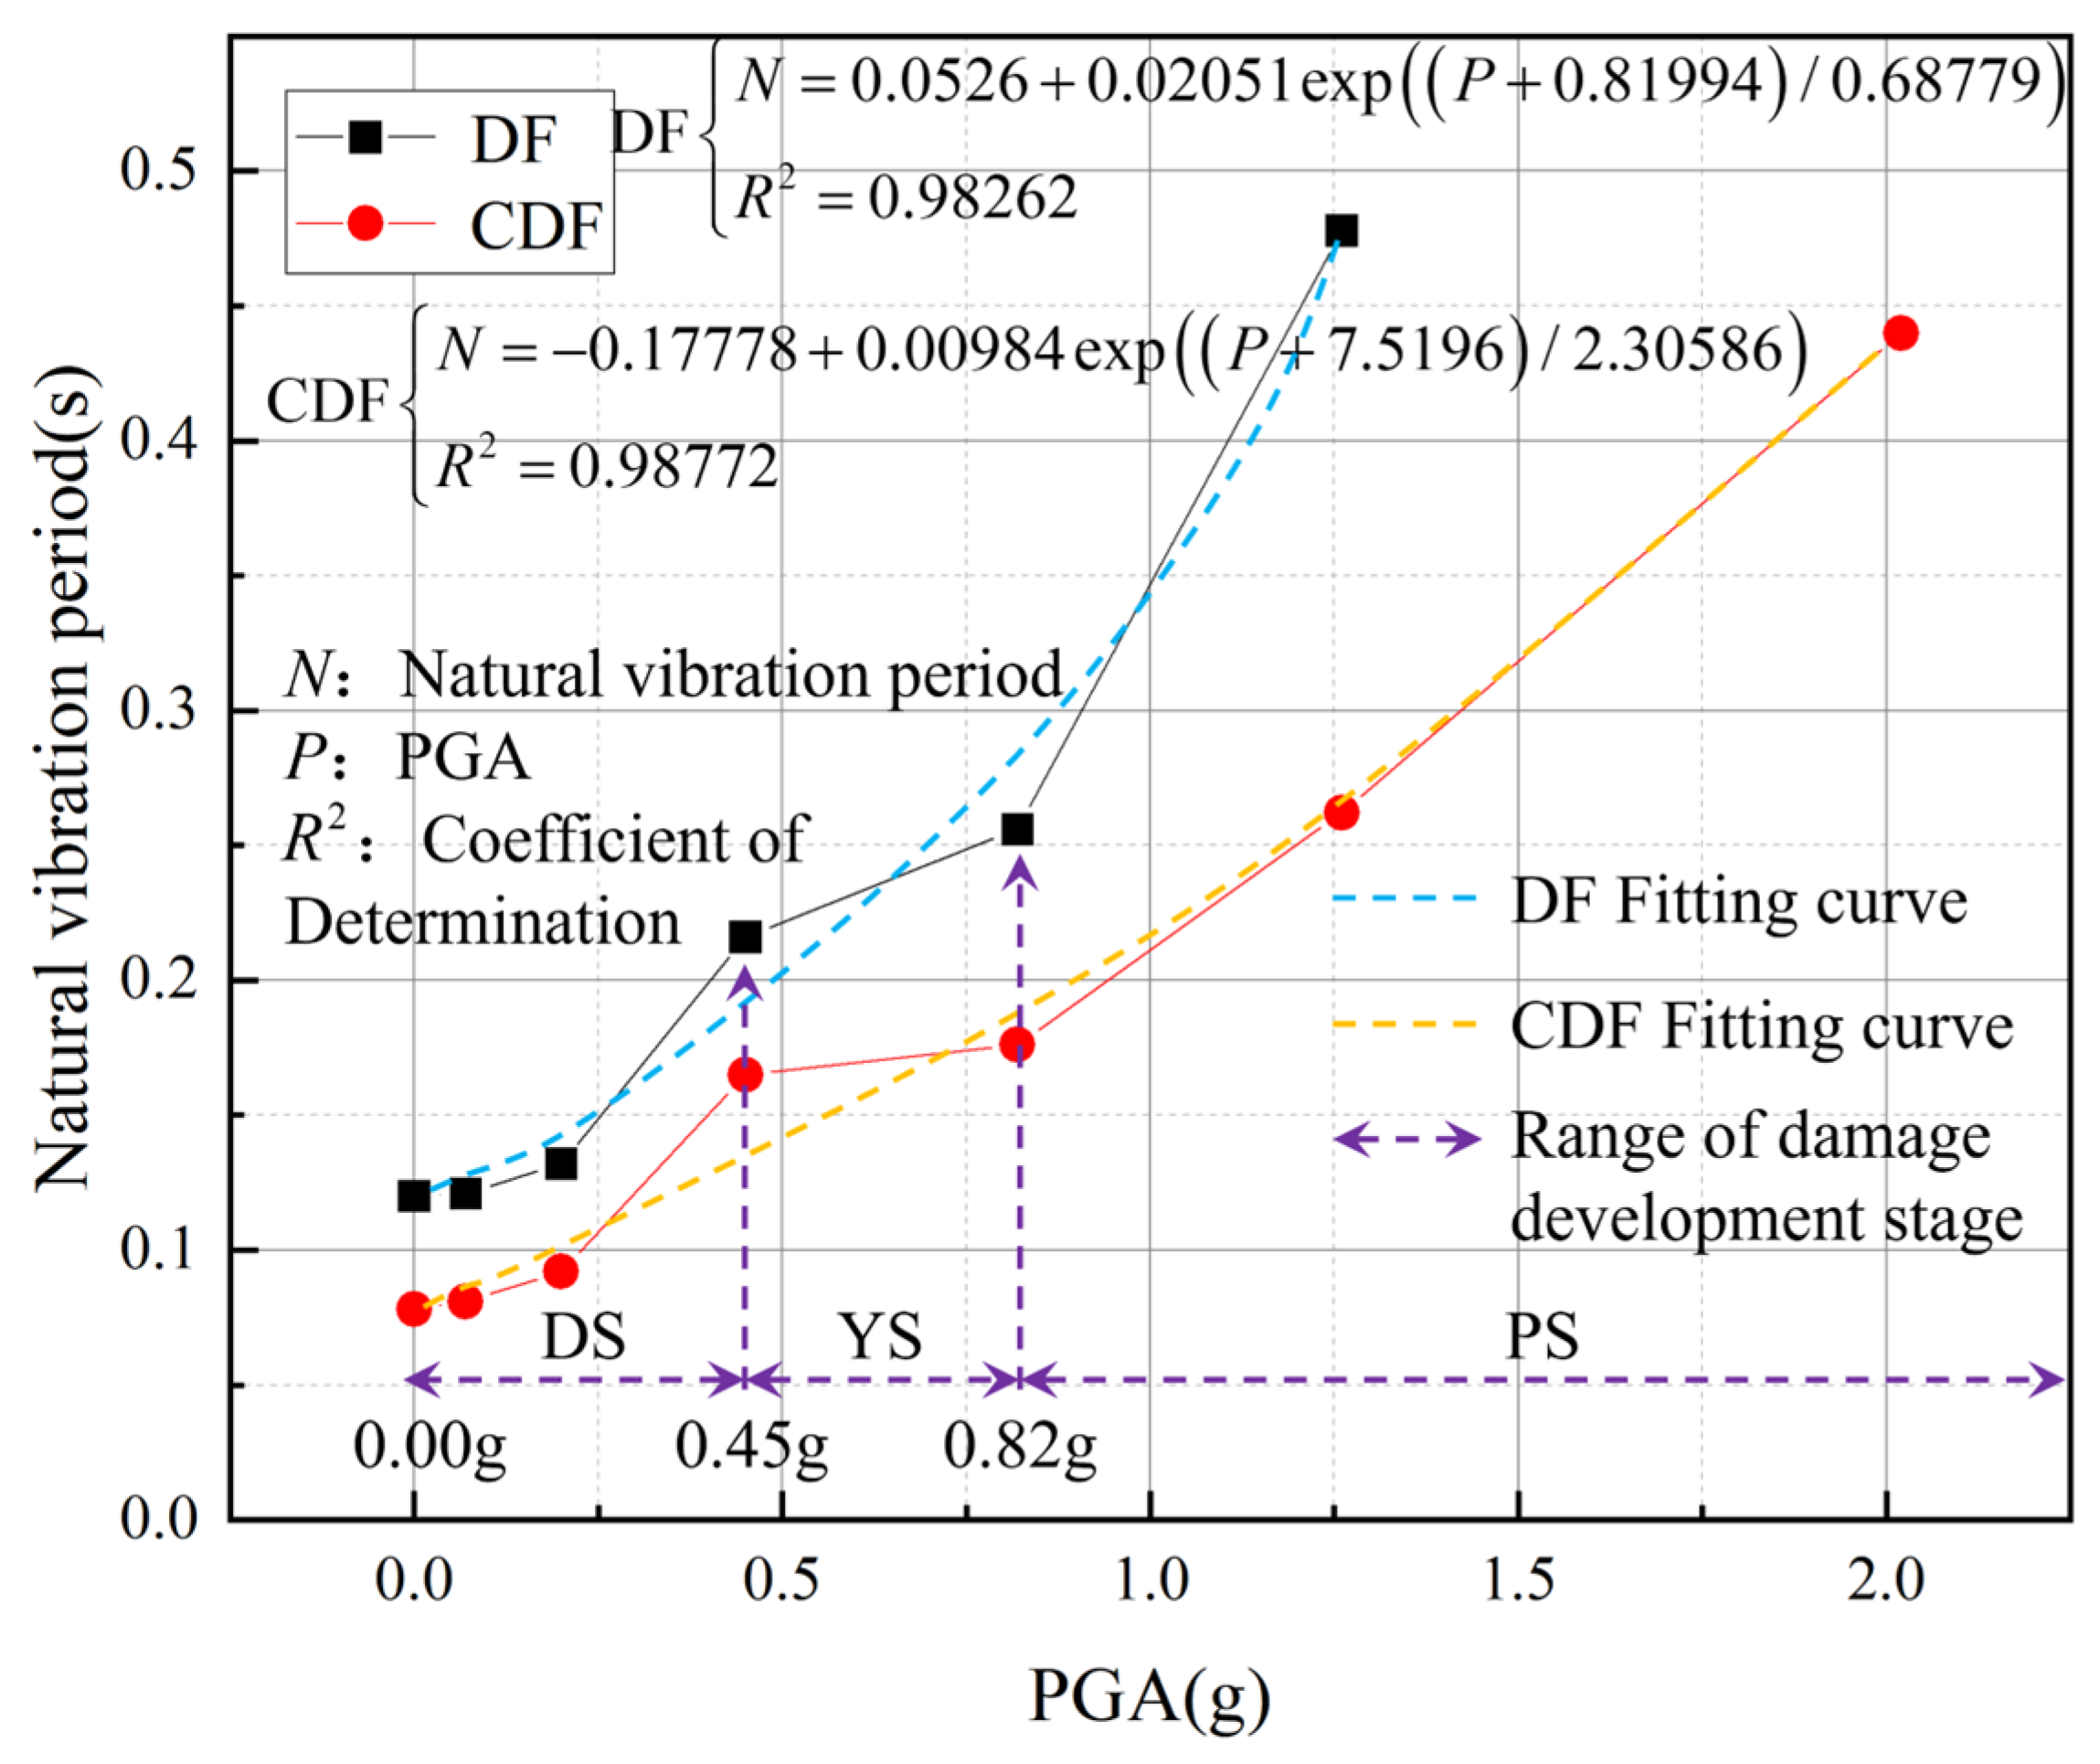
Figure 13.
The development trends of the DF and CDF natural vibration periods.
Figure 13.
The development trends of the DF and CDF natural vibration periods.
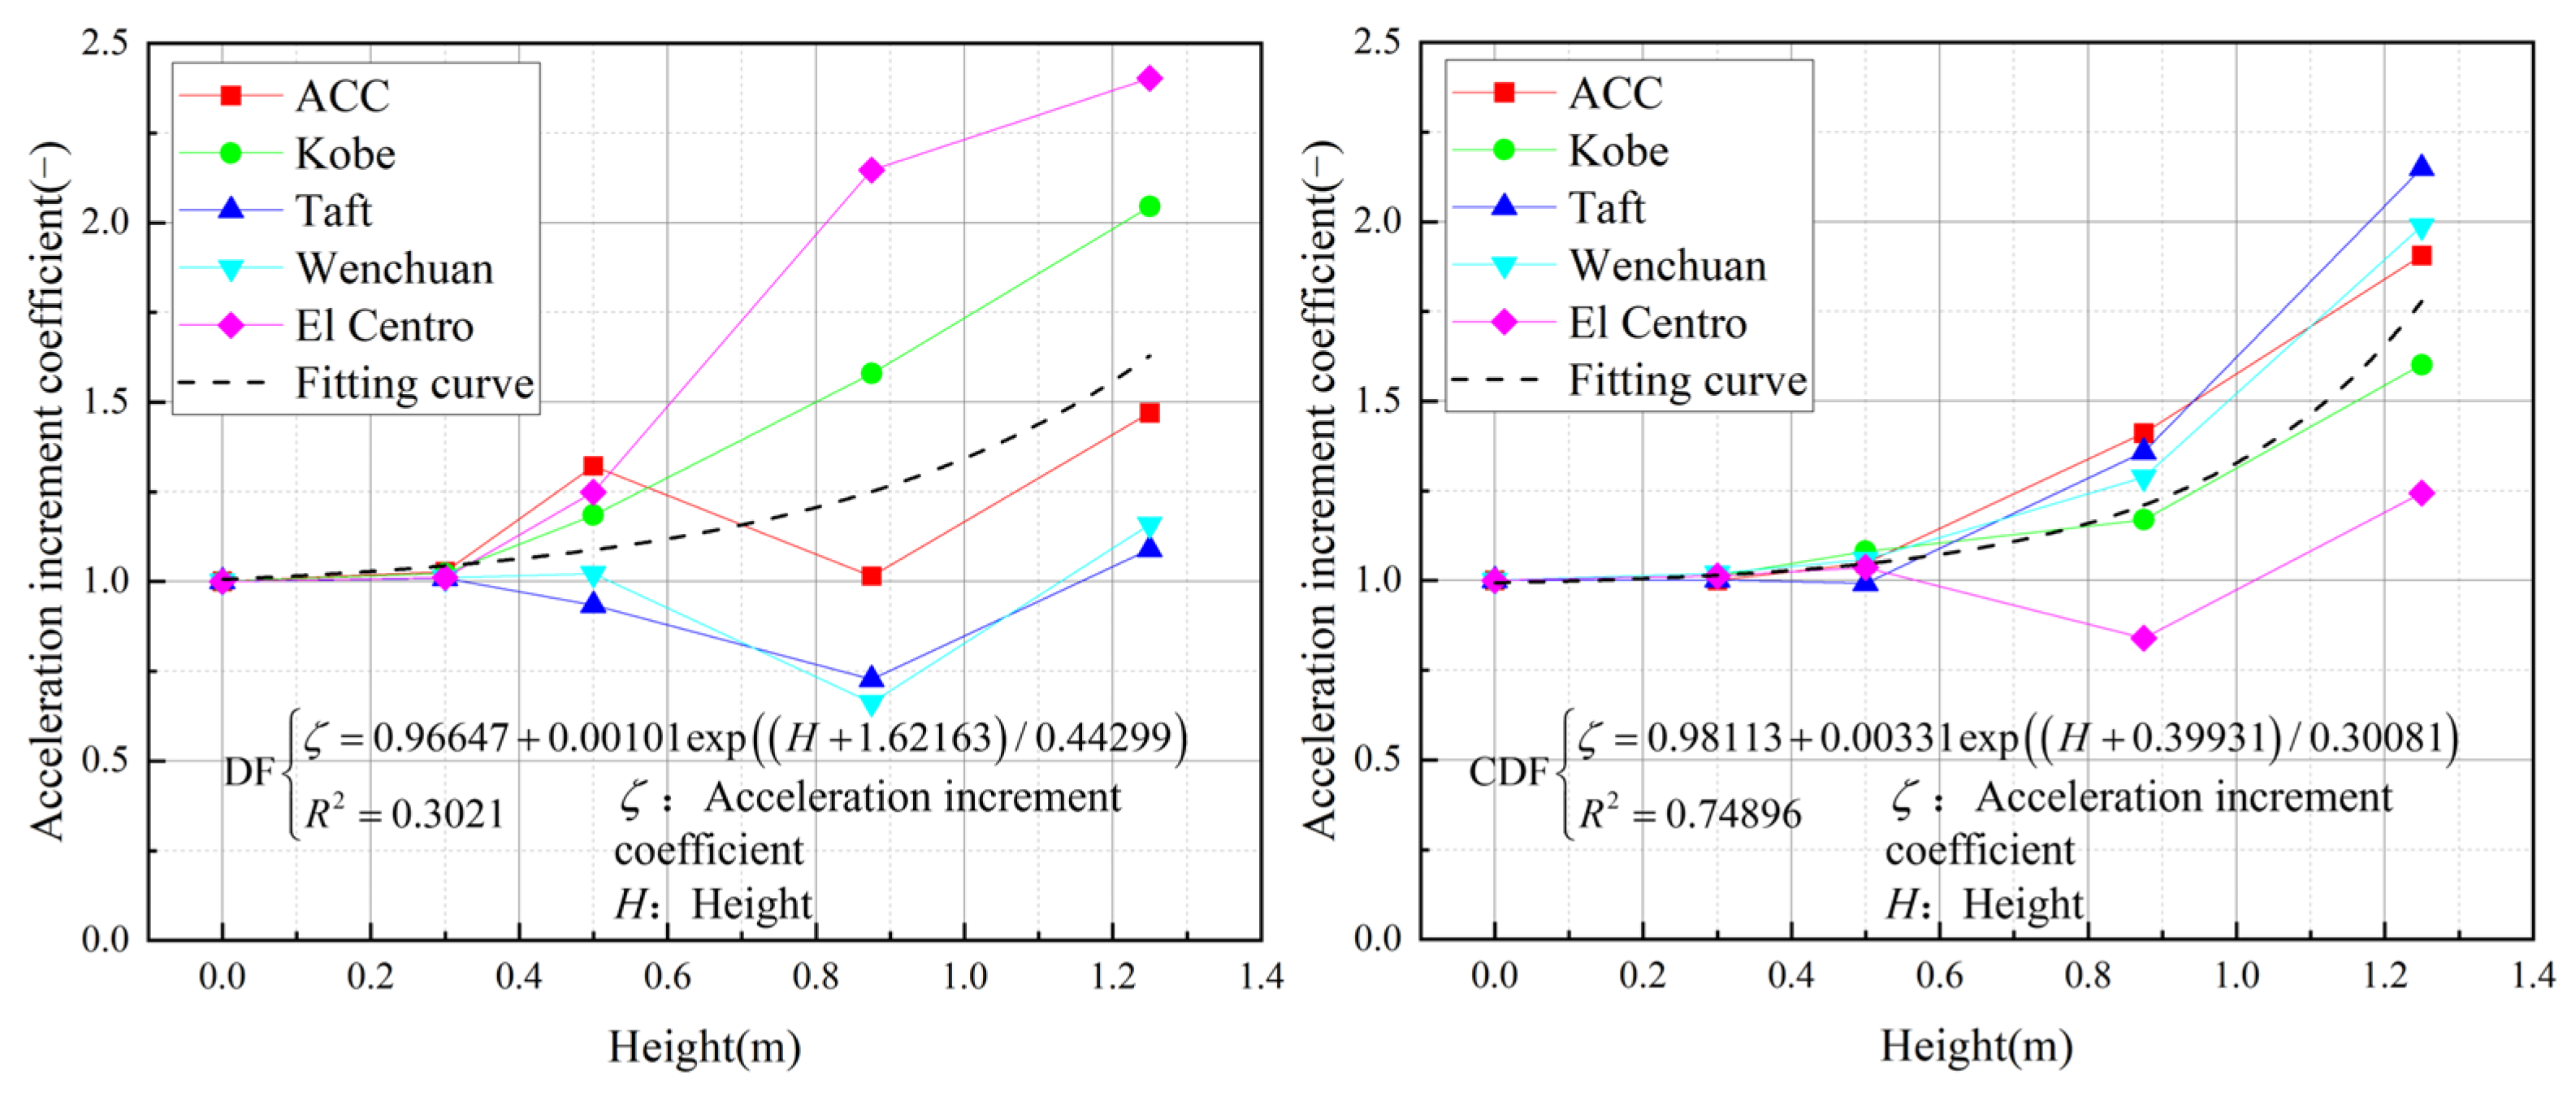
Figure 14.
The variation law of the acceleration-increment coefficients of DF and CDF (PGA = 0.07 (g)).
Figure 14.
The variation law of the acceleration-increment coefficients of DF and CDF (PGA = 0.07 (g)).
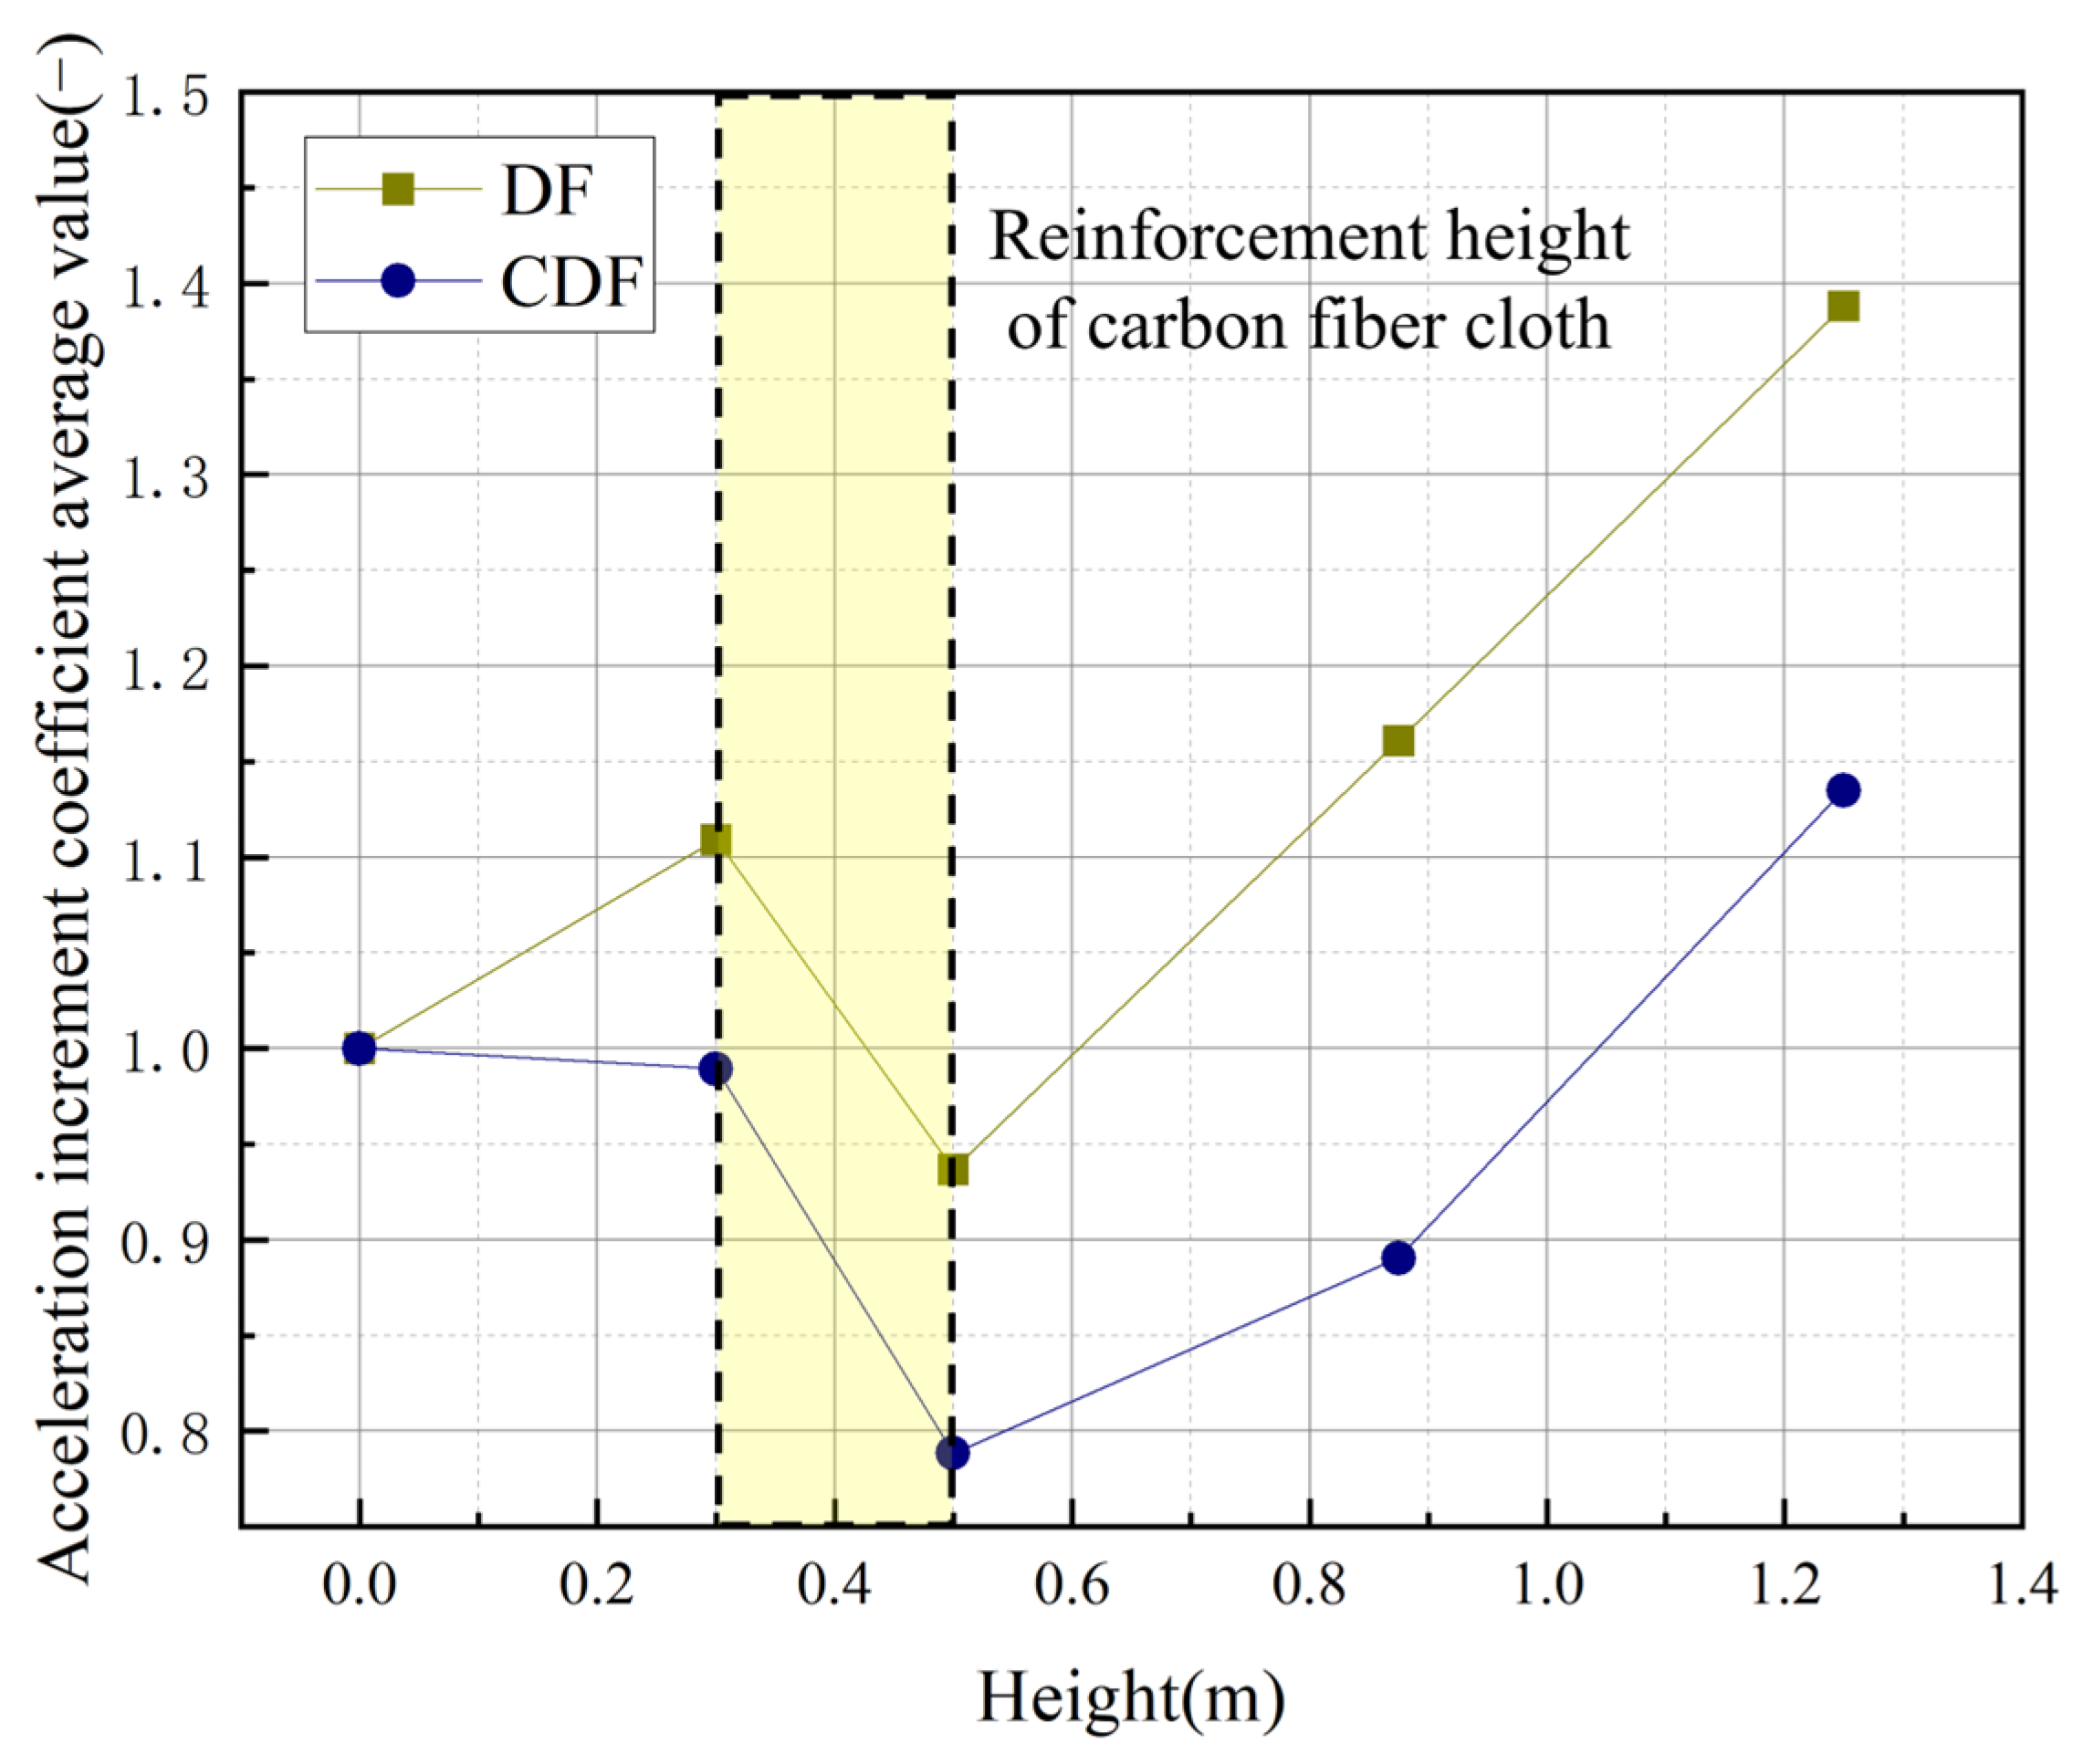
Figure 15.
Under the influence of the El Centro seismic wave, the development law of the average value of the X-direction acceleration-increment coefficients of DF and CDF is obtained.
Figure 15.
Under the influence of the El Centro seismic wave, the development law of the average value of the X-direction acceleration-increment coefficients of DF and CDF is obtained.
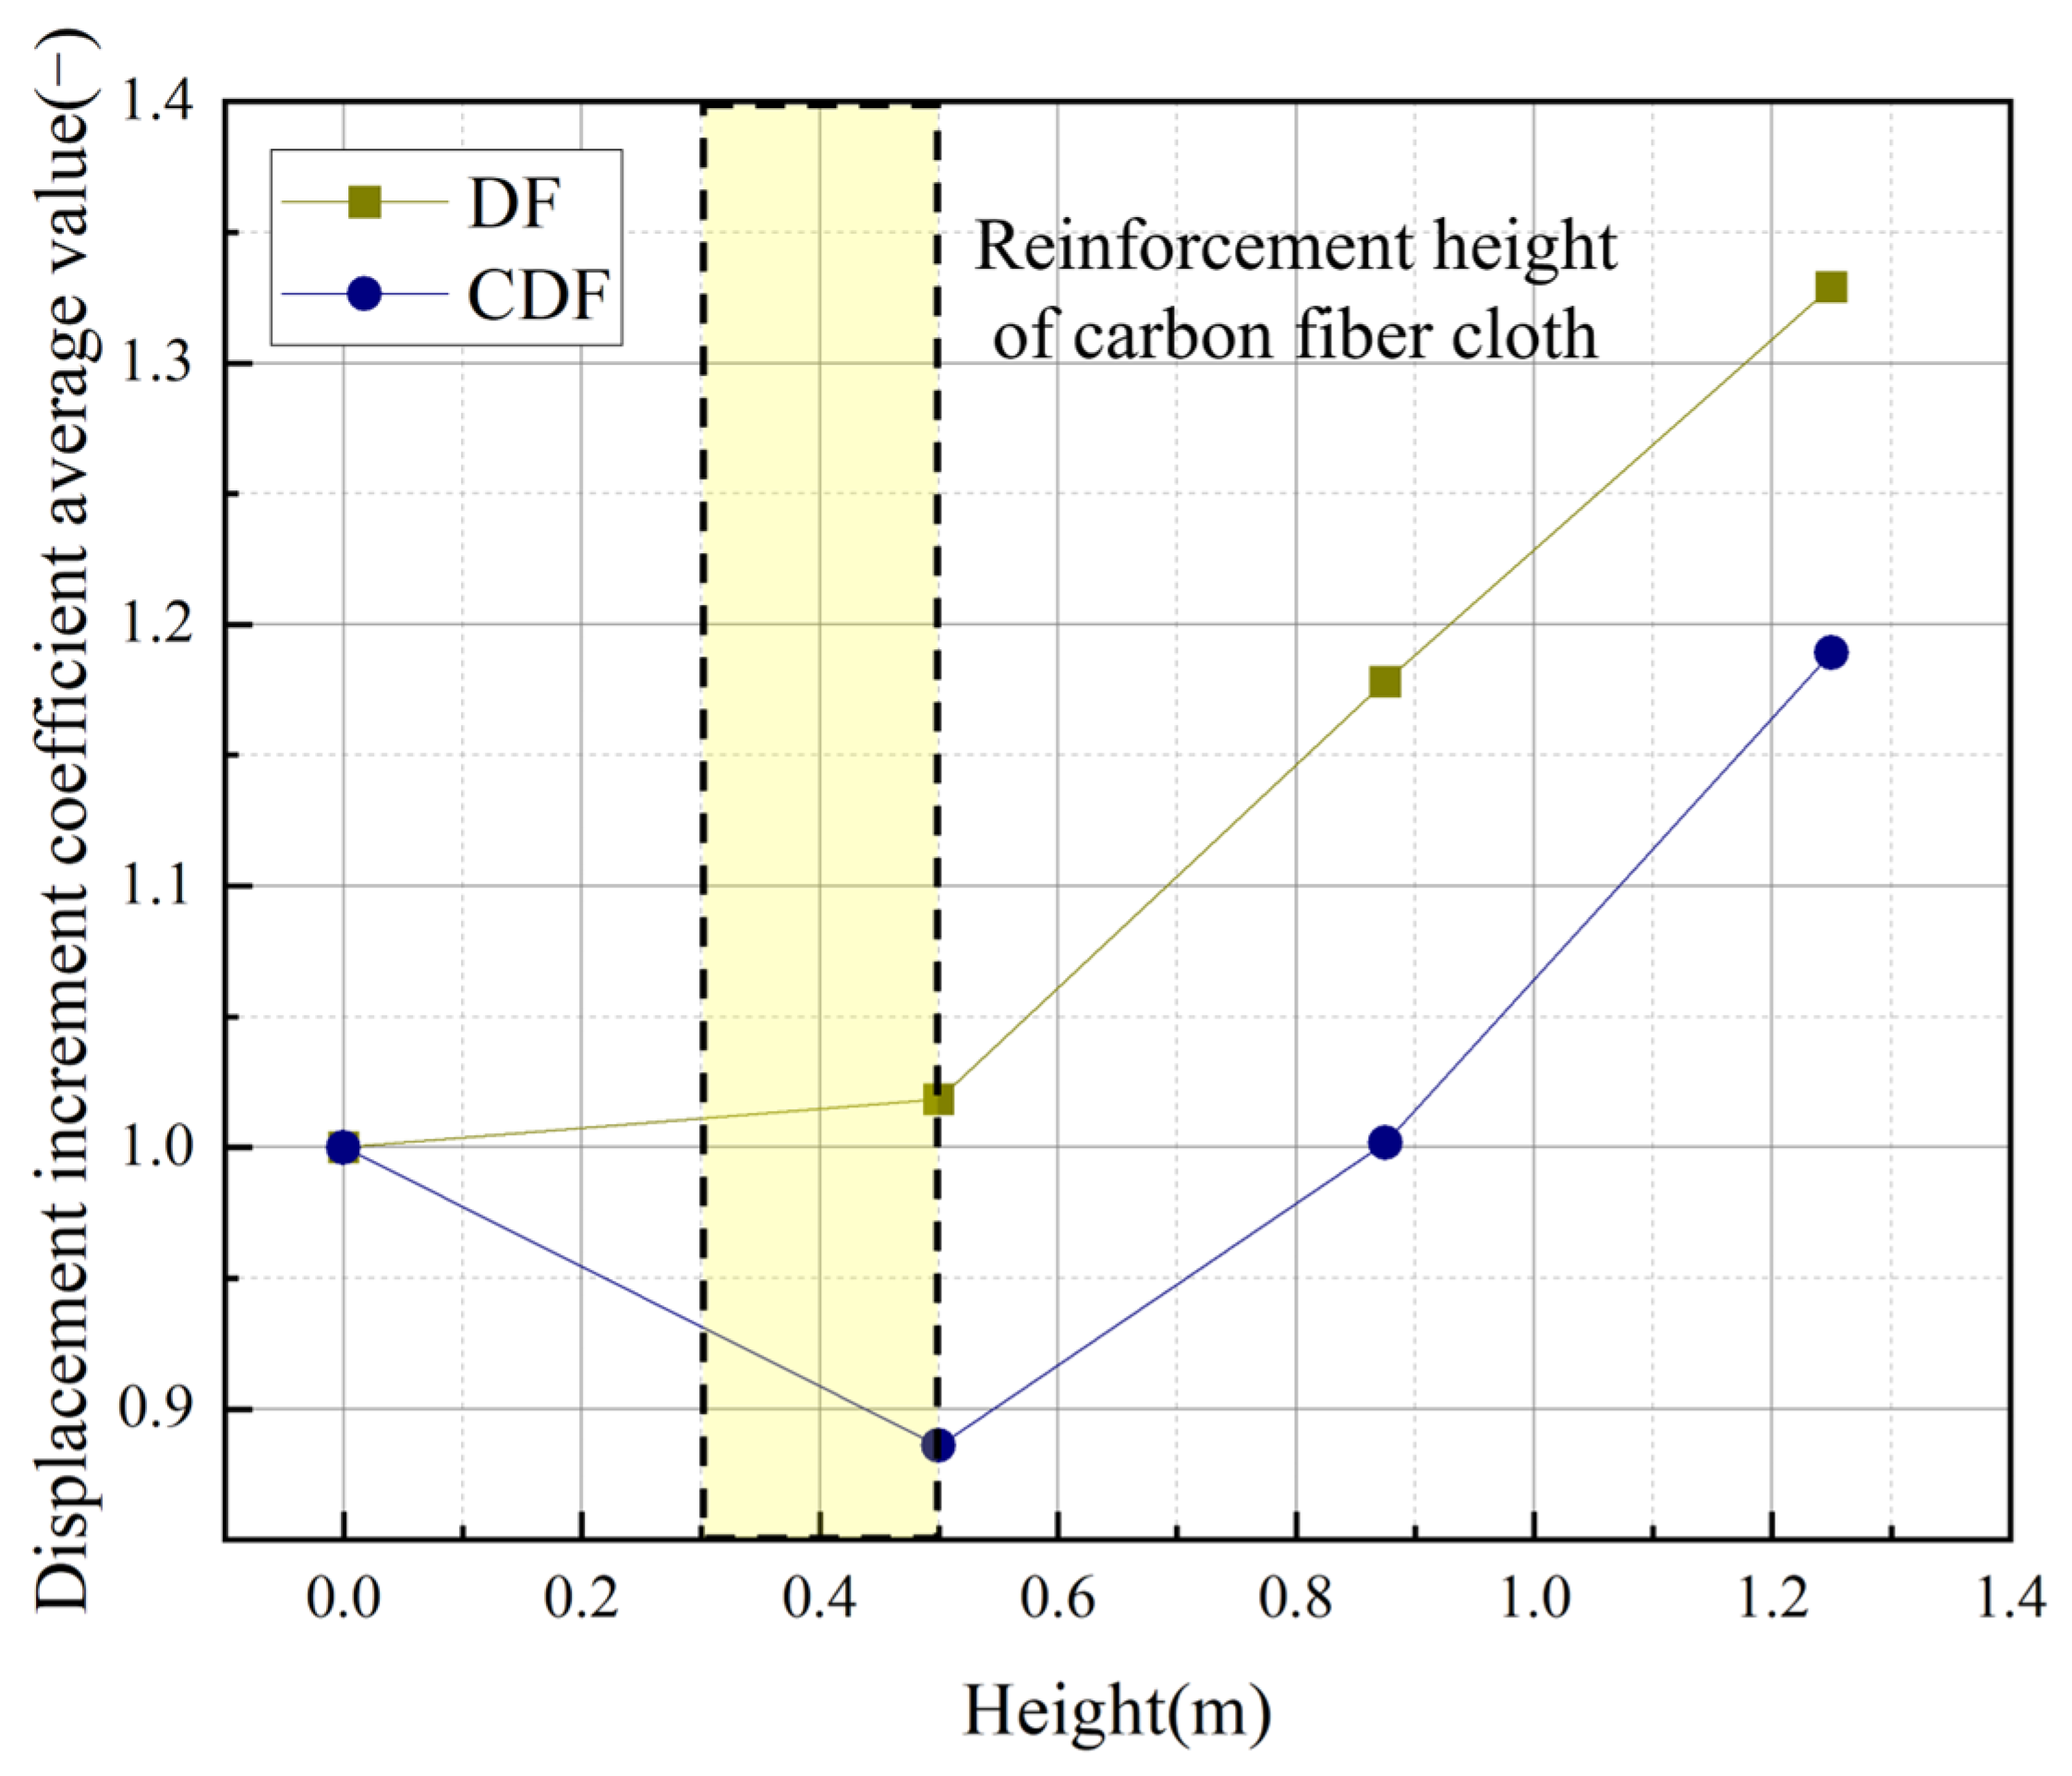
Figure 16.
The variation law of the displacement-increment coefficients of DF and CDF (PGA = 0.07 (g)).
Figure 16.
The variation law of the displacement-increment coefficients of DF and CDF (PGA = 0.07 (g)).
Figure 17.
Under the influence of the El Centro seismic wave, the development law of the average values of the displacement-increment coefficients of DF and CDF is obtained.
Figure 17.
Under the influence of the El Centro seismic wave, the development law of the average values of the displacement-increment coefficients of DF and CDF is obtained.
Table 1.
Structure-similarity constants of the physical model.
Table 1.
Structure-similarity constants of the physical model.
| Physical Property | Physical Parameter | Similarity Constant | Dimension of Quantity | Relation | Value |
|---|
| Geometrical properties | Length | | | | |
| Area | | | | |
| Linear displacement | | | | |
| Angular displacement | | | | |
| Material properties | Strain | | | | |
| Elastic modulus | | | | |
| Stress | | | | |
| Mass density | | | | |
| Mass | | | | |
| Concentrated force | | | | |
| Load properties | Line load | | | | |
| Surface load | | | | |
| Dynamic properties | Moment | | | | |
| Period | | | | |
| Frequency | | | | |
| Speed | | | | |
| Acceleration | | | | |
| Gravity | | | | |
Table 2.
C30 concrete material performance test results.
Table 2.
C30 concrete material performance test results.
| Numbering | Size (mm) | Failure Load (kN) | Compressive Strength (MPa) | Average Compressive Strength (MPa) | Error (Absolute Value) |
|---|
| HL1 | 100 × 100 × 100 | 301.58 | 28.65 | 27.20 | 5.06% |
| HL2 | 264.90 | 25.17 | 8.07% |
| HL3 | 292.32 | 27.77 | 2.05% |
Table 3.
Compressive strength test results of different micro-concretes.
Table 3.
Compressive strength test results of different micro-concretes.
| Numbering | Size (mm) | Failure Load (kN) | Compressive Strength (MPa) | Average Compressive Strength (MPa) | Error (Absolute Value) |
|---|
| WL1 | 70.7 × 70.7 × 70.7 | 20.81 | 8.32 | 7.40 | 11.06% |
| WL2 | 18.23 | 7.29 | 1.51% |
| WL3 | 19.58 | 7.83 | 5.49% |
| WL4 | 18.44 | 7.38 | 0.27% |
| WL5 | 17.09 | 6.84 | 8.19% |
| WL6 | 15.98 | 6.39 | 15.81% |
| WL7 | 20.36 | 8.14 | 9.09% |
| WL8 | 17.44 | 6.98 | 6.02% |
| WL9 | 18.57 | 7.42 | 0.27% |
Table 4.
Elastic modulus test results of different micro-concretes.
Table 4.
Elastic modulus test results of different micro-concretes.
| Numbering | Size (mm) | Elastic Modulus (MPa) | Average Elastic Modulus (GPa) | Error (Absolute Value) |
|---|
| WC1 | 100 × 100 × 300 | 9475.3 | 8.31 | 12.30% |
| WC2 | 7045.9 | 17.94% |
| WC3 | 8535.6 | 2.64% |
| WC4 | 7756.7 | 7.13% |
| WC5 | 8232.2 | 0.95% |
| WC6 | 9843.1 | 15.58% |
| WC7 | 8417.6 | 1.28% |
| WC8 | 7332.7 | 13.33% |
| WC9 | 8174.0 | 1.66% |
Table 5.
Performance test results of galvanized iron wire materials.
Table 5.
Performance test results of galvanized iron wire materials.
| Type | Section Diameter (mm) | Cross-Sectional Area (mm2) | Tensile Strength (MPa) | Elastic Modulus (MPa) |
|---|
| Test Value | Average Value | Error (Absolute Value) | Test Value | Average Value | Error (Absolute Value) |
|---|
| 14# | 2.11 | 3.49 | 248 | 251 | 1.21% | 331 | 362 | 9.37% |
| 264 | 4.92% | 383 | 5.48% |
| 230 | 9.13% | 364 | 0.55% |
| 266 | 5.64% | 371 | 2.43% |
| 248 | 1.21% | 362 | 0.00% |
| 16# | 1.60 | 2.01 | 246 | 236 | 4.07% | 358 | 334 | 0.91% |
| 223 | 5.83% | 314 | 12.79% |
| 247 | 4.45% | 336 | 8.24% |
| 220 | 7.27% | 324 | 9.97% |
| 242 | 2.48% | 338 | 7.73% |
| 18# | 1.20 | 1.14 | 214 | 215 | 0.47% | 323 | 316 | 4.53% |
| 231 | 6.93% | 341 | 17.49% |
| 219 | 1.83% | 301 | 13.19% |
| 204 | 5.39% | 305 | 14.82% |
| 207 | 3.86% | 310 | 12.71% |
Table 6.
Physical parameter table of unidirectional carbon-fiber cloth [
43].
Table 6.
Physical parameter table of unidirectional carbon-fiber cloth [
43].
| Unidirectional Carbon-Fiber Cloth | Physical Parameter |
|---|
| Tensile strength standard value (MPa) | ≥3400 |
| Tensile elastic modulus (MPa) | ≥2.4 × 10⁵ |
| Elongation (%) | ≥1.7 |
| Bending strength (MPa) | ≥700 |
| Interlaminar shear strength (MPa) | ≥45 |
| The positive tensile bond strength between the fiber composite and concrete under the condition of upward bonding (MPa) | ≥2.5 |
| Mass per unit area (gram/m2) | 200 |
| Calculation of the thickness (mm/layer) | 0.111 |
Table 7.
Prototype structure parameters.
Table 7.
Prototype structure parameters.
| Project | Parameter |
|---|
| Size | 14.4 (m) × 9.6 (m) |
| Number of layers | Diaojiaolou layer 1 (layer), standard layer 2 (layer) |
| Layer height | Diaojiaolou layer: 4 (m); standard layer: 3 (m) |
| X-direction span number | 3 |
| Y-direction span number | 2 |
| Span length | 4.8 (m) |
| Column section size | 500 (mm) × 500 (mm) |
| Beam section size | 300 (mm) × 500 (mm) |
| Thickness of floor | 120 (mm) |
| Concrete material | C30 concrete, volumetric weight of 27 (kN/m3) |
| Steel bars | HRB400 longitudinal bar, HRB400 stirrup, HPB300 slab reinforcement, volumetric weight of 27 (kN/m3) |
Table 8.
Structural parameters of physical model.
Table 8.
Structural parameters of physical model.
| Project | Parameter |
|---|
| Size | 1.8 (m) × 1.2 (m) |
| Number of layers | Diaojiaolou layer 1 (layer), standard layer 2 (layer) |
| Layer height | Diaojiaolou layer: 0.5 (m); standard layer: 0.375 (m) |
| X-direction span number | 3 |
| Y-direction span number | 2 |
| Span length | 0.6 (m) |
| Column section size | 62.5 (mm) × 62.5 (mm) |
| Beam section size | 37.5 (mm) × 62.5 (mm) |
| Thickness of floor | 15 (mm) |
| Concrete material | Micro-concrete, volumetric weight of 24 (kN/m3) |
| Steel bar | 14#, 16#, 18# |
Table 9.
Physical model counterweight information.
Table 9.
Physical model counterweight information.
| Model | Layer | Counterweight (kg) | Number of Counterweight Blocks (1 (kg)) | Number of Counterweight Blocks (10 (kg)) |
|---|
| DF | I | 326 | 6 | 32 |
| II | 327 | 7 | 32 |
| III | 151 | 1 | 15 |
| CDF | I | 326 | 6 | 32 |
| II | 327 | 7 | 32 |
| III | 151 | 1 | 15 |
Table 10.
Seismic peak accelerations of prototype structure (cm/s2).
Table 10.
Seismic peak accelerations of prototype structure (cm/s2).
| Seismic Intensity | 7-Degree | 8-Degree | 9-Degree |
|---|
| Frequent earthquakes | 35 | 70 | 140 |
| Design-basis earthquake | 100 | 200 | 400 |
| Maximum considered earthquake | 220 | 400 | 620 |
Table 11.
Adjustment of seismic wave duration.
Table 11.
Adjustment of seismic wave duration.
| Seismic Wave | Absolute Value of PGA (cm/s2) | Time Interval (s) | Duration (s) | Adjusted Duration (s) |
|---|
| ACC | 100.00 | 0.01000 | 30 | 7.5 |
| El Centro | 210.00 | 0.02000 | 30 | 7.5 |
| Kobe | 216.37 | 0.01000 | 20 | 5.0 |
| Taft | 176.80 | 0.01000 | 54 | 13.5 |
| Wenchuan | 1046.59 | 0.00125 | 70 | 17.5 |
Table 12.
Adjustment of seismic wave peak acceleration.
Table 12.
Adjustment of seismic wave peak acceleration.
| Seismic Intensity | Absolute Value of PGA (cm/s2) | Adjustment Coefficient |
|---|
| ACC | El Centro | Kobe | Taft | Wenchuan |
|---|
| 7-degree frequent earthquakes (PGA = 0.07 (g)) | 70 | 0.7000 | 0.3333 | 0.3235 | 0.3959 | 0.0669 |
| 7-degree design-basis earthquake (PGA = 0.20 (g)) | 200 | - | 0.9524 | - | - | - |
| 7-degree maximum considered earthquake (PGA = 0.45 (g)) | 440 | - | 2.0952 | - | - | - |
| 8-degree maximum considered earthquake (PGA = 0.82 (g)) | 800 | - | 3.8095 | - | - | - |
| 9-degree maximum considered earthquake (PGA = 1.26 (g)) | 1240 | - | 5.9048 | - | - | - |
Table 13.
Test condition information.
Table 13.
Test condition information.
| Condition | Seismic Wave | Peak Acceleration (g) | Direction |
|---|
| 1 | W1 | White noise | | |
| 2 | F7KX | ACC | 0.07 | X |
| 3 | F7EX | El Centro |
| 4 | F7TX | Kobe |
| 5 | F7AX | Taft |
| 6 | F7WX | Wenchuan |
| 7 | W2 | White noise | | |
| 8 | B7EX | El Centro | 0.20 | X |
| 9 | W3 | White noise | | |
| 10 | R7EX | El Centro | 0.45 | X |
| 11 | W4 | White noise | | |
| 12 | R8EX | El Centro | 0.82 | X |
| 13 | W5 | White noise | | |
| 14 | R9EX | El Centro | 1.26 | X |
| 15 | W6 | White noise | | |
| Supplementary working conditions | 160%R9EX | El Centro | 2.02 | X |
| W7 | White noise | | |
| 240%R9EX | El Centro | 3.02 | X |
| W8 | White noise | | |
Table 14.
Natural vibration period and natural vibration period growth rate.
Table 14.
Natural vibration period and natural vibration period growth rate.
| Condition | DF | CDF |
|---|
| Natural Frequency | Natural Vibration Period | Growth Rate | Relative Growth Rate | Natural Frequency | Natural Vibration Period | Growth Rate | Relative Growth Rate |
|---|
| W1 | 8.34375 | 0.120 | 0 | 0 | 12.7187 | 0.078 | 0 | 0 |
| W2 | 8.25 | 0.121 | 0.83% | 0.83% | 12.2917 | 0.081 | 3.85% | 3.85% |
| W3 | 7.5625 | 0.132 | 10.00% | 9.09% | 10.8125 | 0.092 | 17.95% | 13.58% |
| W4 | 4.625 | 0.216 | 80.00% | 63.64% | 6.125 | 0.165 | 111.54% | 78.35% |
| W5 | 3.90625 | 0.256 | 113.33% | 18.52% | 5.6875 | 0.176 | 125.64% | 6.67% |
| W6 | 2.09375 | 0.478 | 298.33% | 86.72% | 3.8125 | 0.262 | 235.90% | 48.86% |
| W7 | - | - | - | - | 2.25 | 0.44 | 464.10% | 67.94% |
| W8 | - | - | - | - | - | - | - | - |
Table 15.
The X-direction maximum accelerations (m/s2) and acceleration-increment coefficients of DF were obtained (PGA = 0.07 (g)).
Table 15.
The X-direction maximum accelerations (m/s2) and acceleration-increment coefficients of DF were obtained (PGA = 0.07 (g)).
| Layer | ACC | Kobe | Taft | Wenchuan | El Centro |
|---|
| L | | L | | L | | L | | L | |
|---|
| DZ1 | 0.9579 | 1 | 0.5202 | 1 | 0.4386 | 1 | 3.1556 | 1 | 0.3550 | 1 |
| DZ4 | 0.9845 | 1.0278 | 0.5322 | 1.0230 | 0.4425 | 1.0088 | 3.1893 | 1.0107 | 0.3589 | 1.0109 |
| I | 1.2664 | 1.3220 | 0.6165 | 1.1850 | 0.4097 | 0.9340 | 3.223 | 1.0213 | 0.4435 | 1.2494 |
| II | 0.9725 | 1.0152 | 0.8219 | 1.5798 | 0.3189 | 0.7272 | 2.093 | 0.6632 | 0.7621 | 2.1471 |
| III | 1.4083 | 1.4703 | 1.0638 | 2.0448 | 0.4782 | 1.0903 | 3.6563 | 1.1587 | 0.8529 | 2.4028 |
Table 16.
The X-direction maximum accelerations (m/s2) and acceleration-increment coefficients of CDF were obtained (PGA = 0.07 (g)).
Table 16.
The X-direction maximum accelerations (m/s2) and acceleration-increment coefficients of CDF were obtained (PGA = 0.07 (g)).
| Layer | ACC | Kobe | Taft | Wenchuan | El Centro |
|---|
| L | | L | | L | | L | | L | |
|---|
| DZ1 | 0.9445 | 1 | 0.7417 | 1 | 0.7535 | 1 | 0.5104 | 1 | 0.6382 | 1 |
| DZ4 | 0.9449 | 1.0005 | 0.7513 | 1.0129 | 0.7554 | 1.0025 | 0.5208 | 1.0204 | 0.6465 | 1.0130 |
| I | 0.9901 | 1.0483 | 0.8023 | 1.0816 | 0.7479 | 0.9915 | 0.5404 | 1.0587 | 0.6613 | 1.0362 |
| II | 1.3325 | 1.4109 | 0.8671 | 1.1691 | 1.0235 | 1.3584 | 0.6572 | 1.2875 | 0.5360 | 0.8399 |
| III | 1.7997 | 1.9055 | 1.1879 | 1.6016 | 1.6194 | 2.1493 | 1.0151 | 1.9888 | 0.7935 | 1.2434 |
Table 17.
The X-direction acceleration-increment coefficients of DF (El Centro).
Table 17.
The X-direction acceleration-increment coefficients of DF (El Centro).
| Layer | DZ1 | Error (Absolute Value) | DZ4 | Error (Absolute Value) | I | Error (Absolute Value) | II | Error (Absolute Value) | III | Error (Absolute Value) |
|---|
| 0.07 (g) | 1.0000 | 0.00% | 1.0109 | 9.71% | 1.2494 | 25.02% | 2.1471 | 45.93% | 2.4028 | 42.23% |
| 0.20 (g) | 1.0000 | 0.00% | 1.0325 | 7.42% | 1.2210 | 23.28% | 1.6133 | 28.04% | 1.8791 | 26.12% |
| 0.45 (g) | 1.0000 | 0.00% | 1.0101 | 9.80% | 1.2683 | 26.14% | 1.3991 | 17.02% | 1.7662 | 21.40% |
| 0.82 (g) | 1.0000 | 0.00% | 0.8457 | 31.15% | 1.0558 | 11.27% | 0.9473 | 22.56% | 1.0240 | 35.57% |
| 1.26 (g) | 1.0000 | 0.00% | 2.5270 | 56.11% | 0.5953 | 57.37% | 0.7046 | 64.77% | 0.9645 | 43.93% |
| 2.02 (g) | 1.0000 | 0.00% | 0.2284 | 385.60% | 0.2309 | 305.72% | 0.1544 | 651.94% | 0.2924 | 374.76% |
| Average value | 1.0000 | - | 1.1091 | - | 0.9368 | - | 1.1610 | - | 1.3882 | - |
Table 18.
The X-direction acceleration-increment coefficients of CDF (El Centro).
Table 18.
The X-direction acceleration-increment coefficients of CDF (El Centro).
| Layer | DZ1 | Error (Absolute Value) | DZ4 | Error (Absolute Value) | I | Error (Absolute Value) | II | Error (Absolute Value) | III | Error (Absolute Value) |
|---|
| 0.07 (g) | 1.0000 | 0.00% | 1.0130 | 2.34% | 1.0362 | 23.90% | 0.8399 | 6.04% | 1.2434 | 8.72% |
| 0.20 (g) | 1.0000 | 0.00% | 1.0459 | 5.41% | 1.2191 | 35.32% | 1.7764 | 49.86% | 2.4275 | 53.24% |
| 0.45 (g) | 1.0000 | 0.00% | 0.7833 | 26.30% | 1.0028 | 21.37% | 1.4063 | 36.67% | 1.6382 | 30.72% |
| 0.82 (g) | 1.0000 | 0.00% | 0.8240 | 20.06% | 1.0565 | 25.37% | 0.9233 | 3.54% | 1.1425 | 0.66% |
| 1.26 (g) | 1.0000 | 0.00% | 2.0241 | 51.12% | 0.8399 | 6.12% | 1.0248 | 13.10% | 1.1296 | 0.48% |
| 2.02 (g) | 1.0000 | 0.00% | 0.2577 | 283.90% | 0.0983 | 702.14% | 0.0815 | 992.76% | 0.1161 | 877.61% |
| 3.02 (g) | 1.0000 | 0.00% | 0.9773 | 1.23% | 0.2666 | 195.76% | 0.1819 | 389.61% | 0.2475 | 358.59% |
| Average value | 1.0000 | - | 0.9893 | - | 0.7885 | - | 0.8906 | - | 1.1350 | - |
Table 19.
The maximum displacement values (mm) and displacement-increment coefficients of DF were obtained (PGA = 0.07 (g)).
Table 19.
The maximum displacement values (mm) and displacement-increment coefficients of DF were obtained (PGA = 0.07 (g)).
| Layer | ACC | Kobe | Taft | Wenchuan | El Centro |
|---|
| | | | | | | | | |
|---|
| DZ1 | 1.1749 | 1.0000 | 0.8022 | 1.0000 | 0.1629 | 1.0000 | 1.4084 | 1.0000 | 0.7031 | 1.0000 |
| I | 1.1971 | 1.0189 | 0.9809 | 1.2228 | 0.1852 | 1.1369 | 1.5102 | 1.0723 | 0.8567 | 1.2185 |
| II | 1.4214 | 1.2098 | 1.2553 | 1.5648 | 0.2523 | 1.5488 | 2.1007 | 1.4916 | 1.1887 | 1.6907 |
| III | 1.4889 | 1.2673 | 1.3448 | 1.6764 | 0.2864 | 1.7581 | 2.2306 | 1.5838 | 1.2674 | 1.8026 |
Table 20.
The maximum displacement values (mm) and displacement-increment coefficients of CDF were obtained (PGA = 0.07 (g)).
Table 20.
The maximum displacement values (mm) and displacement-increment coefficients of CDF were obtained (PGA = 0.07 (g)).
| Layer | ACC | Kobe | Taft | Wenchuan | El Centro |
|---|
| | | | | | | | | |
|---|
| DZ1 | 1.2855 | 1.0000 | 1.0512 | 1.0000 | 0.3281 | 1.0000 | 0.7306 | 1.0000 | 0.9165 | 1.0000 |
| I | 1.3724 | 1.0676 | 1.0985 | 1.0450 | 0.3513 | 1.0707 | 0.7564 | 1.0353 | 0.9535 | 1.0404 |
| II | 1.4279 | 1.1108 | 1.1443 | 1.0886 | 0.3732 | 1.1375 | 0.7680 | 1.0512 | 0.9824 | 1.0719 |
| III | 1.4967 | 1.1643 | 1.1792 | 1.1218 | 0.3924 | 1.1960 | 0.7860 | 1.0758 | 1.0050 | 1.0966 |
Table 21.
The displacement-increment coefficients of DF (El Centro).
Table 21.
The displacement-increment coefficients of DF (El Centro).
| Layer | DZ1 | Error (Absolute Value) | I | Error (Absolute Value) | II | Error (Absolute Value) | III | Error (Absolute Value) |
|---|
| 0.07 (g) | 1.0000 | 0.00% | 1.2185 | 16.42% | 1.6907 | 30.32% | 1.8026 | 26.27% |
| 0.20 (g) | 1.0000 | 0.00% | 1.0398 | 2.06% | 1.2177 | 3.26% | 1.2777 | 4.02% |
| 0.45 (g) | 1.0000 | 0.00% | 1.1592 | 12.15% | 1.4346 | 17.89% | 1.5414 | 13.77% |
| 0.82 (g) | 1.0000 | 0.00% | 1.2014 | 15.23% | 1.2837 | 8.23% | 1.5077 | 11.85% |
| 1.26 (g) | 1.0000 | 0.00% | 1.0961 | 7.09% | 1.2493 | 5.71% | 1.3543 | 1.86% |
| 2.02 (g) | 1.0000 | 0.00% | 0.5953 | 71.07% | 0.7046 | 67.19% | 0.9645 | 37.80% |
| Average value | 1.0000 | - | 1.0184 | - | 1.1780 | - | 1.3291 | - |
Table 22.
The displacement-increment coefficients of CDF (El Centro).
Table 22.
The displacement-increment coefficients of CDF (El Centro).
| Layer | DZ1 | Error (Absolute Value) | I | Error (Absolute Value) | II | Error (Absolute Value) | III | Error (Absolute Value) |
|---|
| 0.07 (g) | 1.0000 | 0.00% | 1.0404 | 14.85% | 1.0719 | 6.54% | 1.0966 | 8.44% |
| 0.20 (g) | 1.0000 | 0.00% | 1.0412 | 14.92% | 1.0729 | 6.63% | 1.0964 | 8.45% |
| 0.45 (g) | 1.0000 | 0.00% | 1.1872 | 25.38% | 1.4217 | 29.54% | 1.5023 | 20.85% |
| 0.82 (g) | 1.0000 | 0.00% | 1.2047 | 26.46% | 1.4417 | 30.51% | 1.5526 | 23.41% |
| 1.26 (g) | 1.0000 | 0.00% | 1.2000 | 26.18% | 1.3397 | 25.22% | 1.7053 | 30.27% |
| 2.02 (g) | 1.0000 | 0.00% | 0.3442 | 157.38% | 0.4292 | 133.41% | 0.7231 | 64.44% |
| 3.02 (g) | 1.0000 | 0.00% | 0.3379 | 162.18% | 0.3055 | 227.92% | 0.5551 | 114.21% |
| Average value | 1.0000 | - | 0.8859 | - | 1.0018 | - | 1.1891 | - |


