You are currently viewing a new version of our website. To view the old version click .
Buildings
  • Article
  • Open Access

21 November 2024

Automated Generation of Urban Spatial Structures Based on Stable Diffusion and CoAtNet Models

,
and
School of Architecture and Art, Beijing Jiaotong University, Beijing 100044, China
*
Authors to whom correspondence should be addressed.
This article belongs to the Special Issue Advanced Technologies for Urban and Architectural Design

Abstract

The urban road spatial structure is a crucial and complex component of urban design. Generative design models, such as the Stable Diffusion model, can rapidly and massively produce designs. However, the opacity of their internal architecture and the uncertainty of their outcomes mean that the results generated do not meet specific disciplinary assessment criteria, thus limiting their widespread application in planar design and planning. Additionally, traditional software processes targeting specific indicators are time-consuming and do not allow for rapid evaluation. To address these challenges, we utilized several areas of the road spatial structures in six cities and their corresponding four space-syntax parameters as training samples. We simultaneously trained two models: one is a LoRA Model based on the Stable Diffusion architecture used for generating road networks similar to those of various city road spatial structures; the other is a CoAtNet Model (Convolution + Transformer) used as an evaluation model to predict the space-syntax parameters of road structures and calculate the Mean Absolute Percentage Error (MAPE) relative to real urban samples. Subsequently, by linking these two models end-to-end, we were able to filter out generated samples with the smallest MAPE, thereby enhancing the structural similarity between the generated results and the actual urban road spatial structures. This process of rapid generation and swift evaluation of network configurations marks a critical advancement towards better performance and more customized design solutions.

1. Introduction

Each city has its own uniqueness, one which can bring people the feelings and experiences specific to that city. The urban road structure is the “skeleton” of a city and the manifestation of the city’s uniqueness in space. Meanwhile, road spatial structure can influence pedestrian flow efficiency and interaction and affect the distribution of commerce, and thereby impact the economic development and prosperity of a city. Traditional road spatial design requires comprehensive consideration of factors such as road hierarchy, density, and consistency with surrounding roads, and produces continuous iterations to achieve a relatively satisfactory design outcome.
With the continuous development of artificial intelligence technology and the massive amounts of data brought by information technology, generative design research based on machine learning algorithms is further driving the transformation of the architecture industry. With the development of deep learning algorithms, such as Variational Autoencoders (VAE), Generative Adversarial Networks (GAN), and Diffusion Models (DM), significant advancements and enhancements in image generation technology have been achieved [1].
Generative Adversarial Networks (GAN) consist of a generator G and a discriminator D, where G is responsible for generating noise samples, and D determines the authenticity of the generated samples [2]. This adversarial nature allows the model to maintain a dynamic balance between generation and discrimination, thereby driving the learning and optimization of the entire system. Despite its advantages, GAN still faces challenges, such as mode collapse during training [3], in which the model always generates the same or similar images, leading to a lack of diversity. As of 2024, although some breakthroughs have been made in addressing this issue, the problem of mode collapse has not been completely solved.
With the publication of related papers and code, Diffusion Models have demonstrated more powerful image generation capabilities compared to GAN Models, and the image quality generated by Diffusion Models is significantly superior to that seen with GAN Models [4]. Current training techniques allow Diffusion Models to directly bypass the stage of tuning models in the GAN domain, making them immediately applicable for downstream tasks. The application of these models in the fields of painting and early-stage architectural design inspiration has become quite common. The Diffusion Model aims to transform the prior data distribution into random noise, and then correct the transformation step by step to reconstruct a new Diffusion Model [5,6,7,8,9].
Stable Diffusion is a variant of the Diffusion Model called the Latent Diffusion Model (LDM) [10]. Unlike the Denoising Diffusion Probabilistic Model (DDPM), the Latent Diffusion Model (LDM) does not operate directly on images but operates in the latent space; this is referred to as “perceptual compression” [10,11,12,13,14,15].
Stable Diffusion keeps its code and model weights publicly available. It can run on most computers equipped with mid-range-or-better GPUs. Its advantage is that end users can use its Lora plugin (Low-Rank Adaptation, a lightweight training technique used for fine-tuning Large Language and Stable Diffusion Models without the need for full model training) to perform additional training with only 10–20 samples, fine-tuning the generated output to match more specific use cases without the need for the long training times of large models. This makes it suitable for research and exploration where the sample size is not large, and there is a need to quickly see output results and continuously fine-tune the input samples to optimize the generative model [16,17,18,19].
Recently, generative design based on deep learning methods such as GAN and Diffusion-LoRA has been able to generate design outcomes with relatively high visual quality, especially in the field of renderings. In the field of floor plans, this technology has also gradually begun to be applied. Although it can generate fairly good floor designs, most research stops at this point, rarely using for assessment the multiple evaluation metrics employed in practice by architects or urban planners, and even less frequently using these evaluation metrics to optimize the design generation process.
The evaluation method used in this paper is a general method for evaluating urban road spatial structure—space syntax. It was proposed by British scholar Bill Hillier in the 1970s and is a mathematical method for describing and analyzing spatial relationships [20]. The basic principle is to divide and segment the space into scales, describe the quantitative relationships between spaces using mathematical topological relationships, and thereby explore the connection between human activity behavior and spatial morphology, interpreting the ways and degrees to which urban spatial morphology influences human spatial behavior [21,22].
However, a high degree of topological connectivity in road structures does not directly indicate that the design is a good one. The design uses real urban road samples for training and generation. Although the Diffusion Model can already generate diverse designs, it still lacks consistency (proximity) between the generated designs and the deep structure of the original city’s road network. This consistency can be quantified using the space-syntax parameters of both.
The traditional process of calculating space-syntax parameters from images is very cumbersome. First, the image needs to be processed, followed by vectorization using software (such as ArcGIS 10.8), during which various parameters need to be manually set. Different parameters may affect the vectorization results. At this stage, the vectorization results are still not ideal. Many originally straight roads become curved after vectorization, and this degree of curvature significantly impacts the syntax parameters. Therefore, it is necessary to use software like CAD 2021 for tedious manual adjustments, and then import the results into software like Depthmap Beta 1.0 and use manual settings to finally calculate the space-syntax parameters. This process is very time-consuming; it is estimated that processing a single image may take at least 10 min before the final, more accurate result is obtained.
Is there a way to directly obtain the spatial syntax parameters of road structures from images? We considered the CNN Model (Convolutional Neural Network) in the context of deep learning, which is a model specifically designed to process grid-structured data (particularly images and audio). Its main goal is to automatically extract features from the data and then classify or recognize the data. CNN can take images as input, connect the values to be predicted at the output layer, and learn the mapping relationships between them through backpropagation (a key method for training neural networks, which updates the parameters of the network by adjusting the internal weights based on the output error, allowing the neural network to produce results closer to the desired outcome). In the latest research in the field of computer vision, the combination of CNN and Transformer Models (which initially achieved great success in natural language processing and treat images as a series of “visual elements” in computer vision, analyzing and processing these elements. Compared to traditional computer vision methods, Transformer Models have stronger global information processing capabilities and scalability, and have achieved impressive results in traditional tasks such as image classification.
Therefore, we use the CNN + Transformer architecture (This paper is based on the CoAtNet model) to predict the space-syntax parameters of the generated road structure. We connect the output port of the Diffusion-LoRA Model to the input port of the CNN + Transformer, calculate the proximity of the generated design to the syntax parameters of the original city’s road network, and then filter the generated results to select the design with the highest proximity, thereby optimizing and improving the generation results.
The research goal of this paper is to achieve rapid generation of specific urban spatial structures and rapid evaluation and screening of a large number of generated results through the training of generative models and evaluation models, thereby improving the similarity between the generated results and the composition of real urban road spatial structures and enhancing the quality of the generated schemes.
The main structure of this paper is as follows: Section 2 introduces the existing cutting-edge planar generation algorithm models and research methods, the types of predictive models, and the reasons why the CoAtNet Model was chosen, as well as explains why spatial syntax parameters are used as evaluation indicators for urban structures and which specific parameters have been used in the existing research. Section 3 describes the overall research process of the paper, the cities and selected regions, the calculation methods of the parameters, and the general route of model training and generation. Section 4 focuses on calculating the data distribution and characteristics of various spatial syntax parameters of real cities (training samples) as a reference basis for generating samples. Section 5 covers the training and generation results of the generative model (SD-LoRA). Section 6 focuses on calculating the data distribution and the characteristics of various spatial syntax parameters of the generated samples and the subsequent comparison with the corresponding parameters of real cities. Section 7 describes the architecture and training process of the evaluation model CoAtNet, the selection of the single evaluation metric MAPE, and the prediction performance of the evaluation model on the test set. Section 8, Conclusion and Discussion, evaluates the effectiveness of the improved model’s generation results, showing that this method indeed improves the quality of the final generated results. Section 9 points out some limitations of the research, outlines future prospects, and discusses the generalization capability of the proposed method.

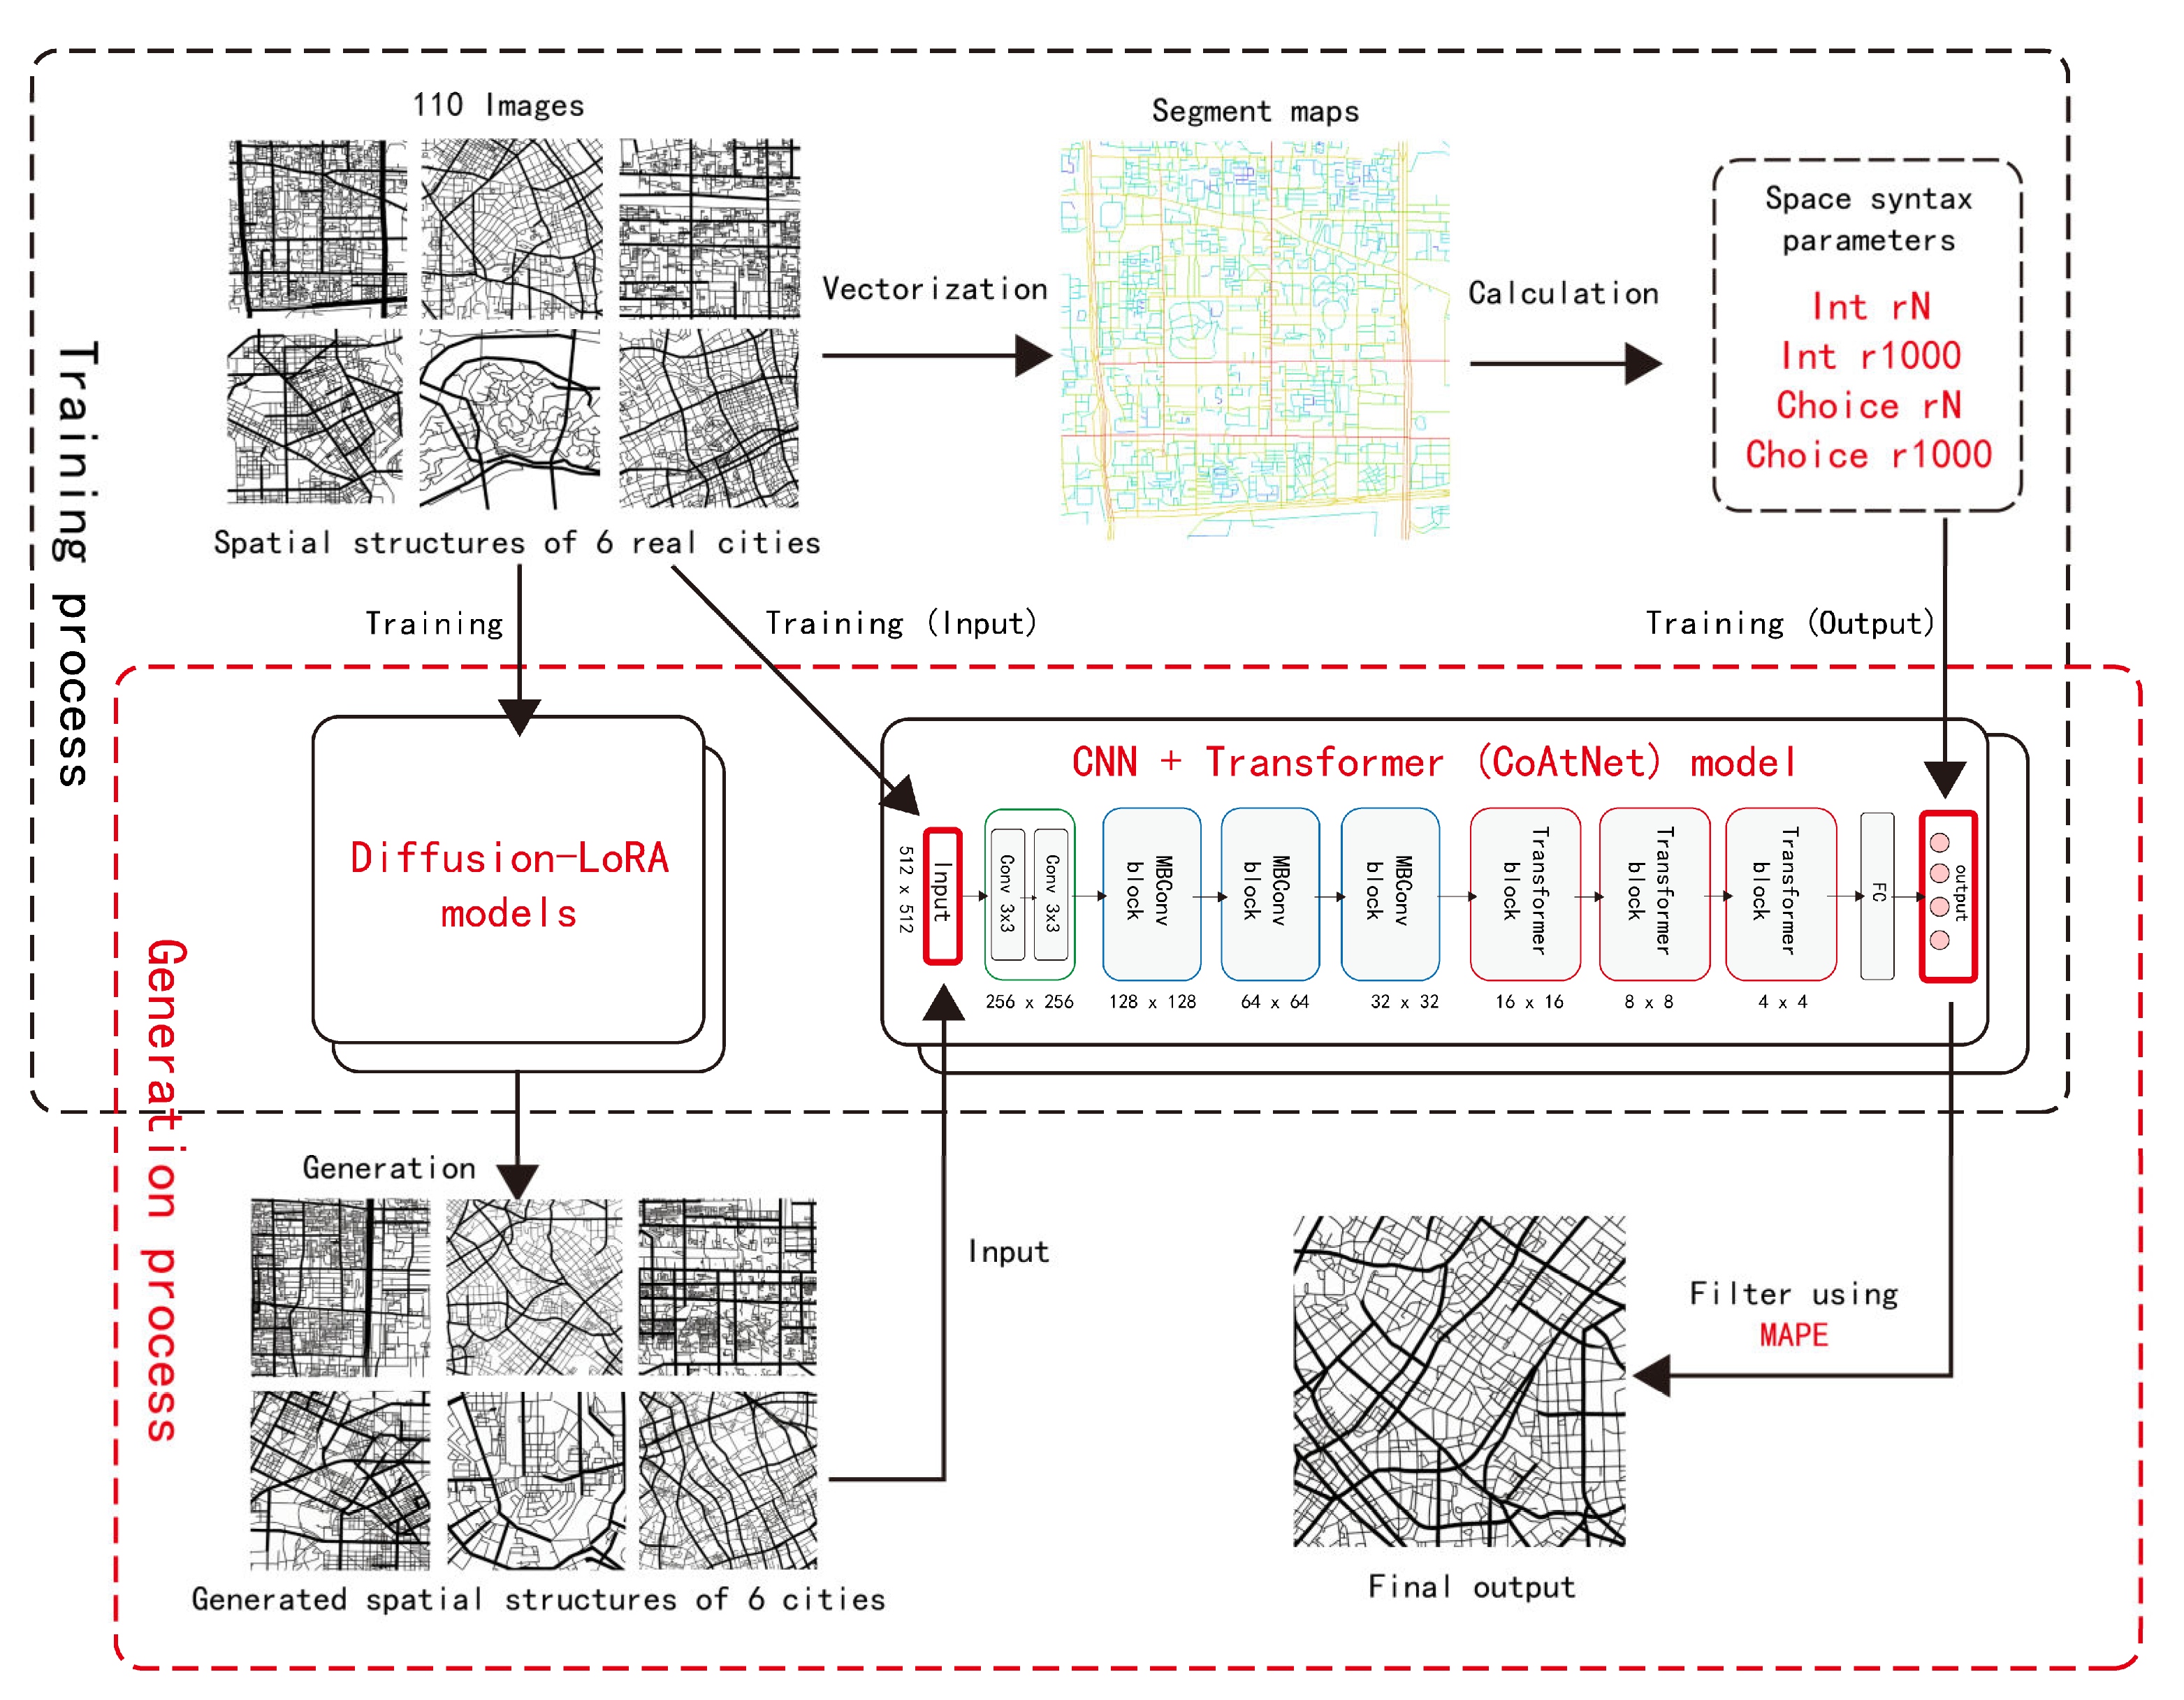
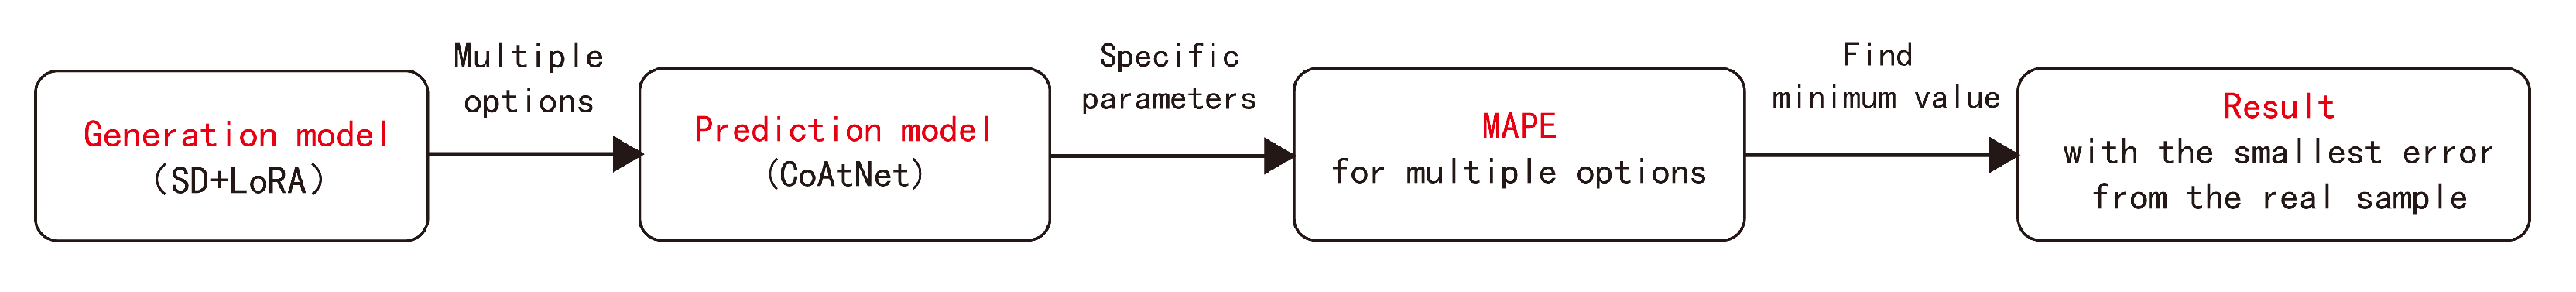
3. Research Framework

This paper selects six typical cities in China: Beijing, Shanghai, Tianjin, Xi’an, Changchun, and Chongqing, as showed in Figure 1. The reasons for selecting these six cities are as follows: (1) The structural differences between these cities are significant, allowing us to examine AI’s ability to learn from diverse urban structures. (2) These cities feature both traditional old neighborhoods and urbanized spatial mechanisms, providing excellent learning resources. (3) We have access to the line segment models of these cities, as well as some existing research data.
Figure 1. Our approach: train two models simultaneously, one for generation and one for prediction, and ultimately optimize the results.
Since the Stable Diffusion Model requires a certain number of training images, and considering that the generated road structure needs to have a sufficiently large scope to ensure that the global accessibility and local accessibility can be distinguished during parameter calculation, the scale of the training set selected in this paper is 4 km × 4 km or 3 km × 3 km, depending on the range of the city-center area. Beijing, Chongqing, and Xi’an use 3 km × 3 km, while Changchun, Shanghai, and Tianjin use 4 km × 4 km. The calculation radius for local Integration and Choice is 1000 m. The range and number of selected areas for each city are shown in Figure 2.
Figure 2. Selected areas of real city samples.
Due to the limited scale of the selected areas and the range of each central urban area, selecting too many areas would result in high repetition in the training samples, while having too few training samples would make it difficult for the AI model to learn the spatial characteristics of each city. Therefore, approximately 10 areas were selected from each city, totaling around 60 rectangular areas, for screenshots. Data augmentation was performed by horizontal flipping, resulting in 110 training images used as training data for the fine-tuning model. The road structure images of each area were vectorized using ArcGIS, and Depthmap was used to calculate four parameters: two-scale Integration and two-scale Choice for the central areas of the six cities. Subsequently, the Diffusion-LoRA Model was trained by encoding each image with prompt words (using the natural language in the pre-trained mode of Stable Diffusion for automatic annotation, which automatically recognizes the content of the image and generates a descriptive sentence, such as “a black and white map of a city with streets and roads in it”). Through parameter adjustment and iteration, a model was obtained for each city. Simultaneously, each image was used as input, with the four corresponding syntax parameters used as labels. A CNN + Transformer (CoAtNet) Model was trained to predict space-syntax parameters, resulting in an evaluation model. The Diffusion-LoRA Model was then connected to the CNN + Transformer (CoAtNet) Model. The generated results of the generative model were input into the evaluation model for scoring. The generated results were sorted and filtered based on their scores, ultimately yielding the relatively optimal generated results. The entire generation and optimization process is visually depicted in Figure 3.
Figure 3. Generation and optimization process.

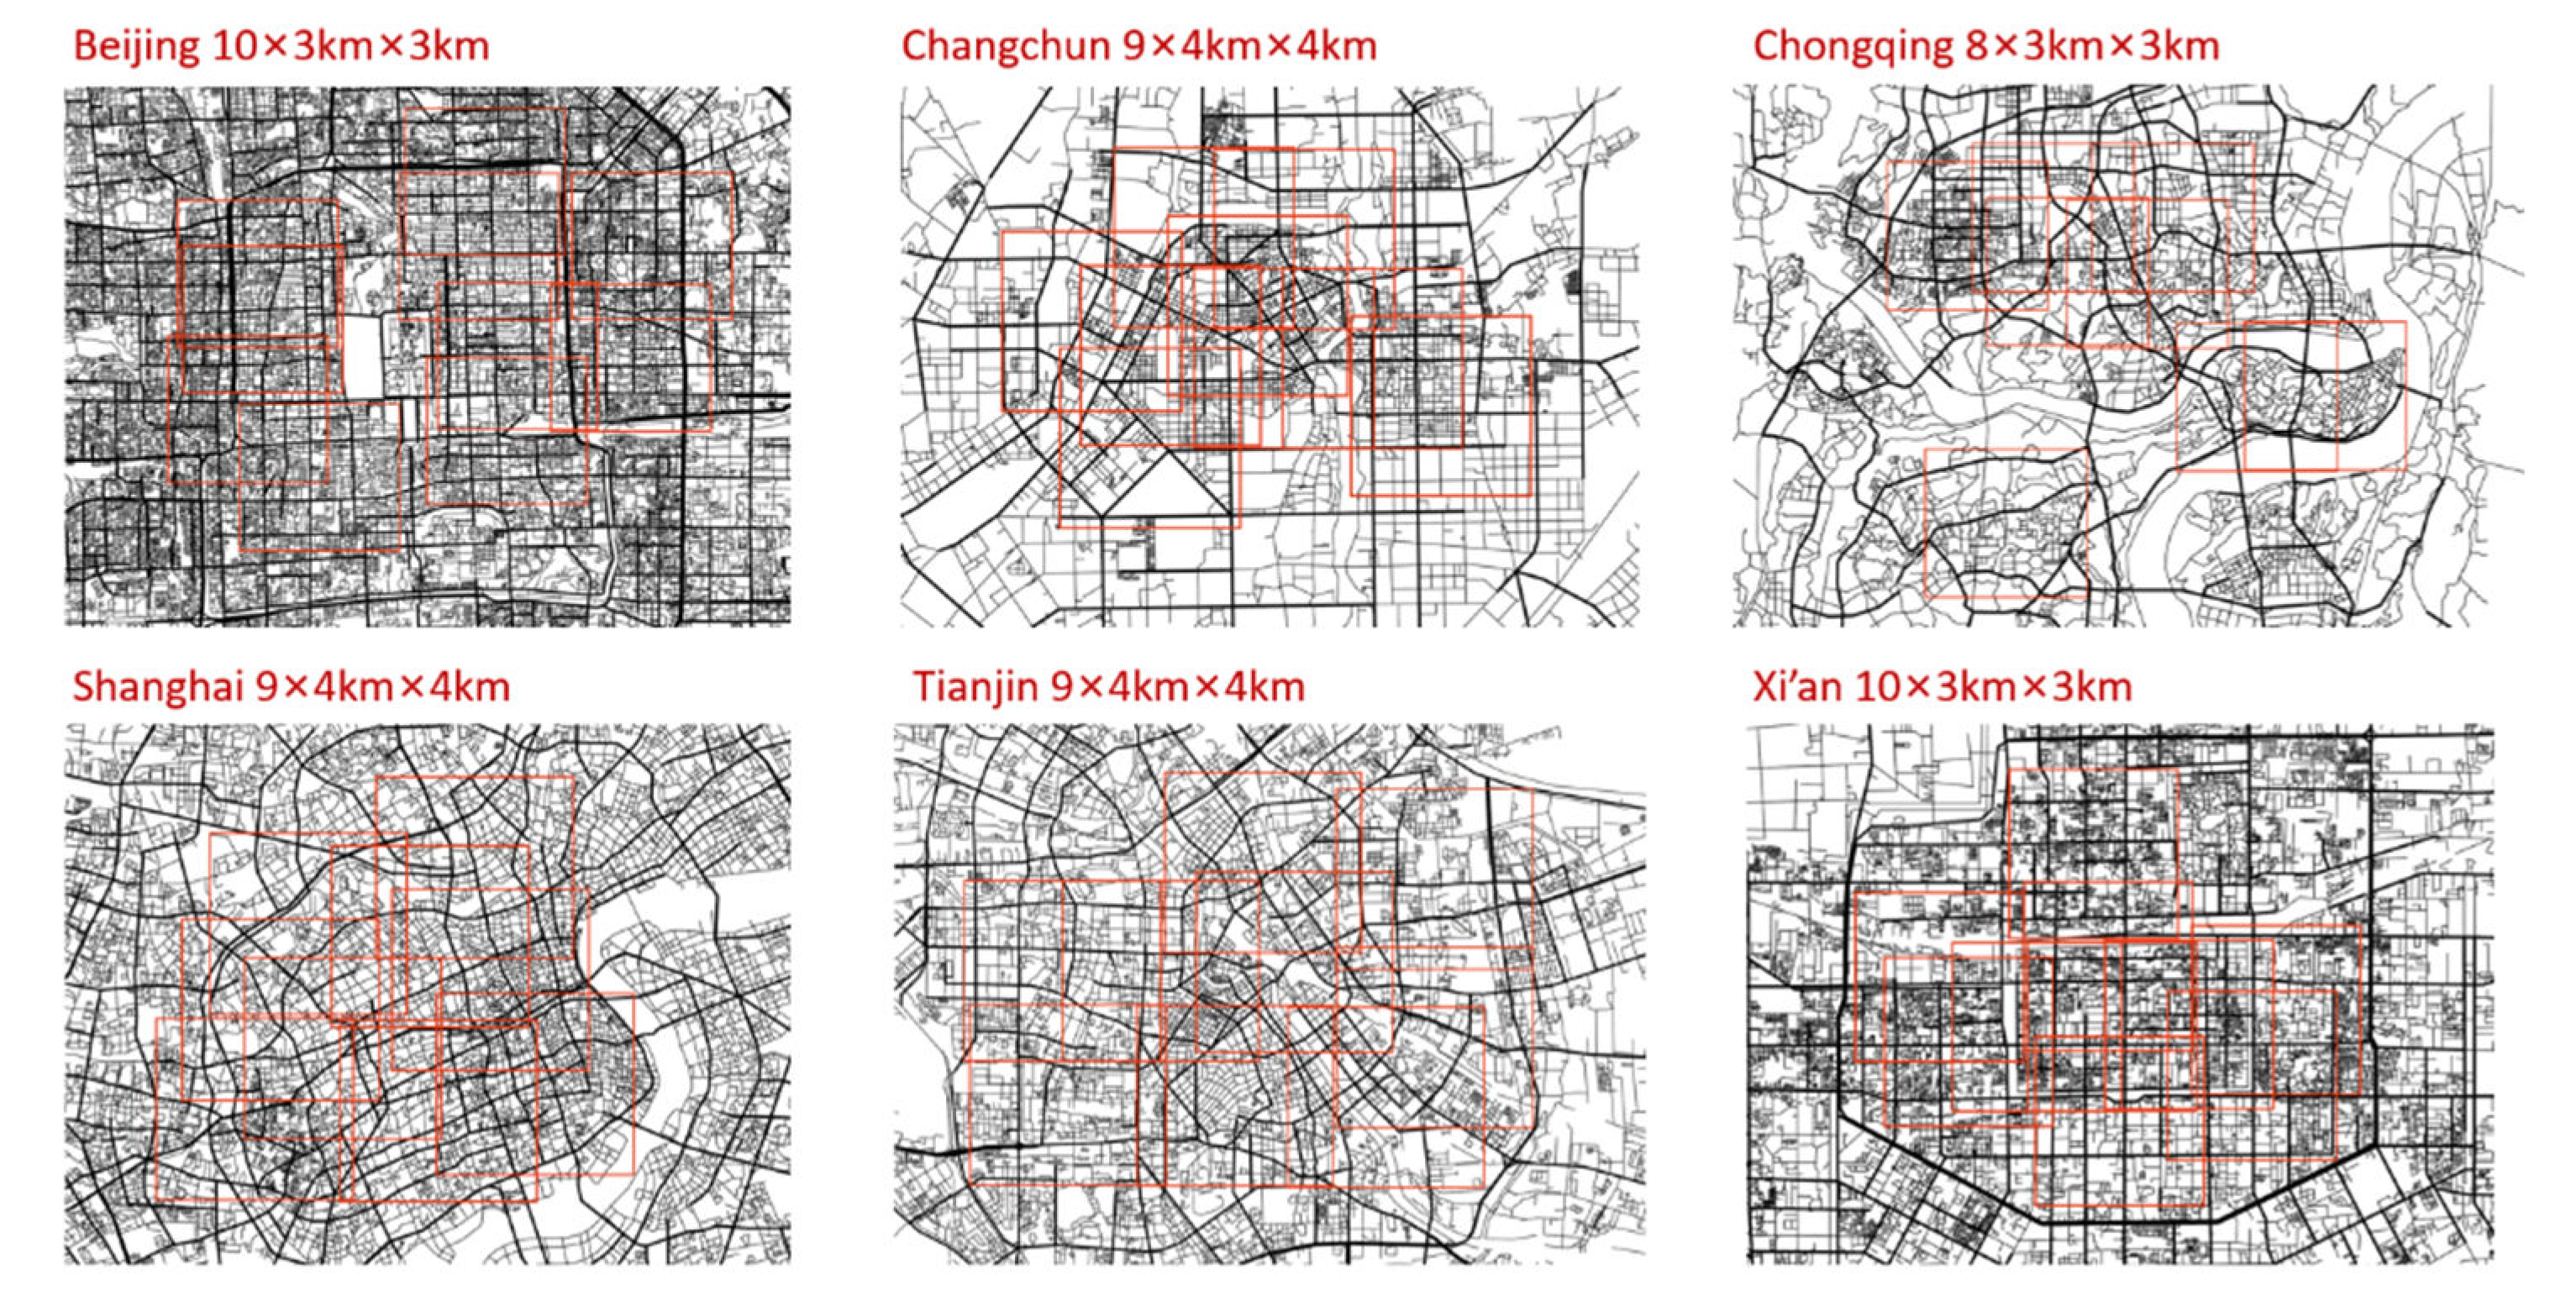
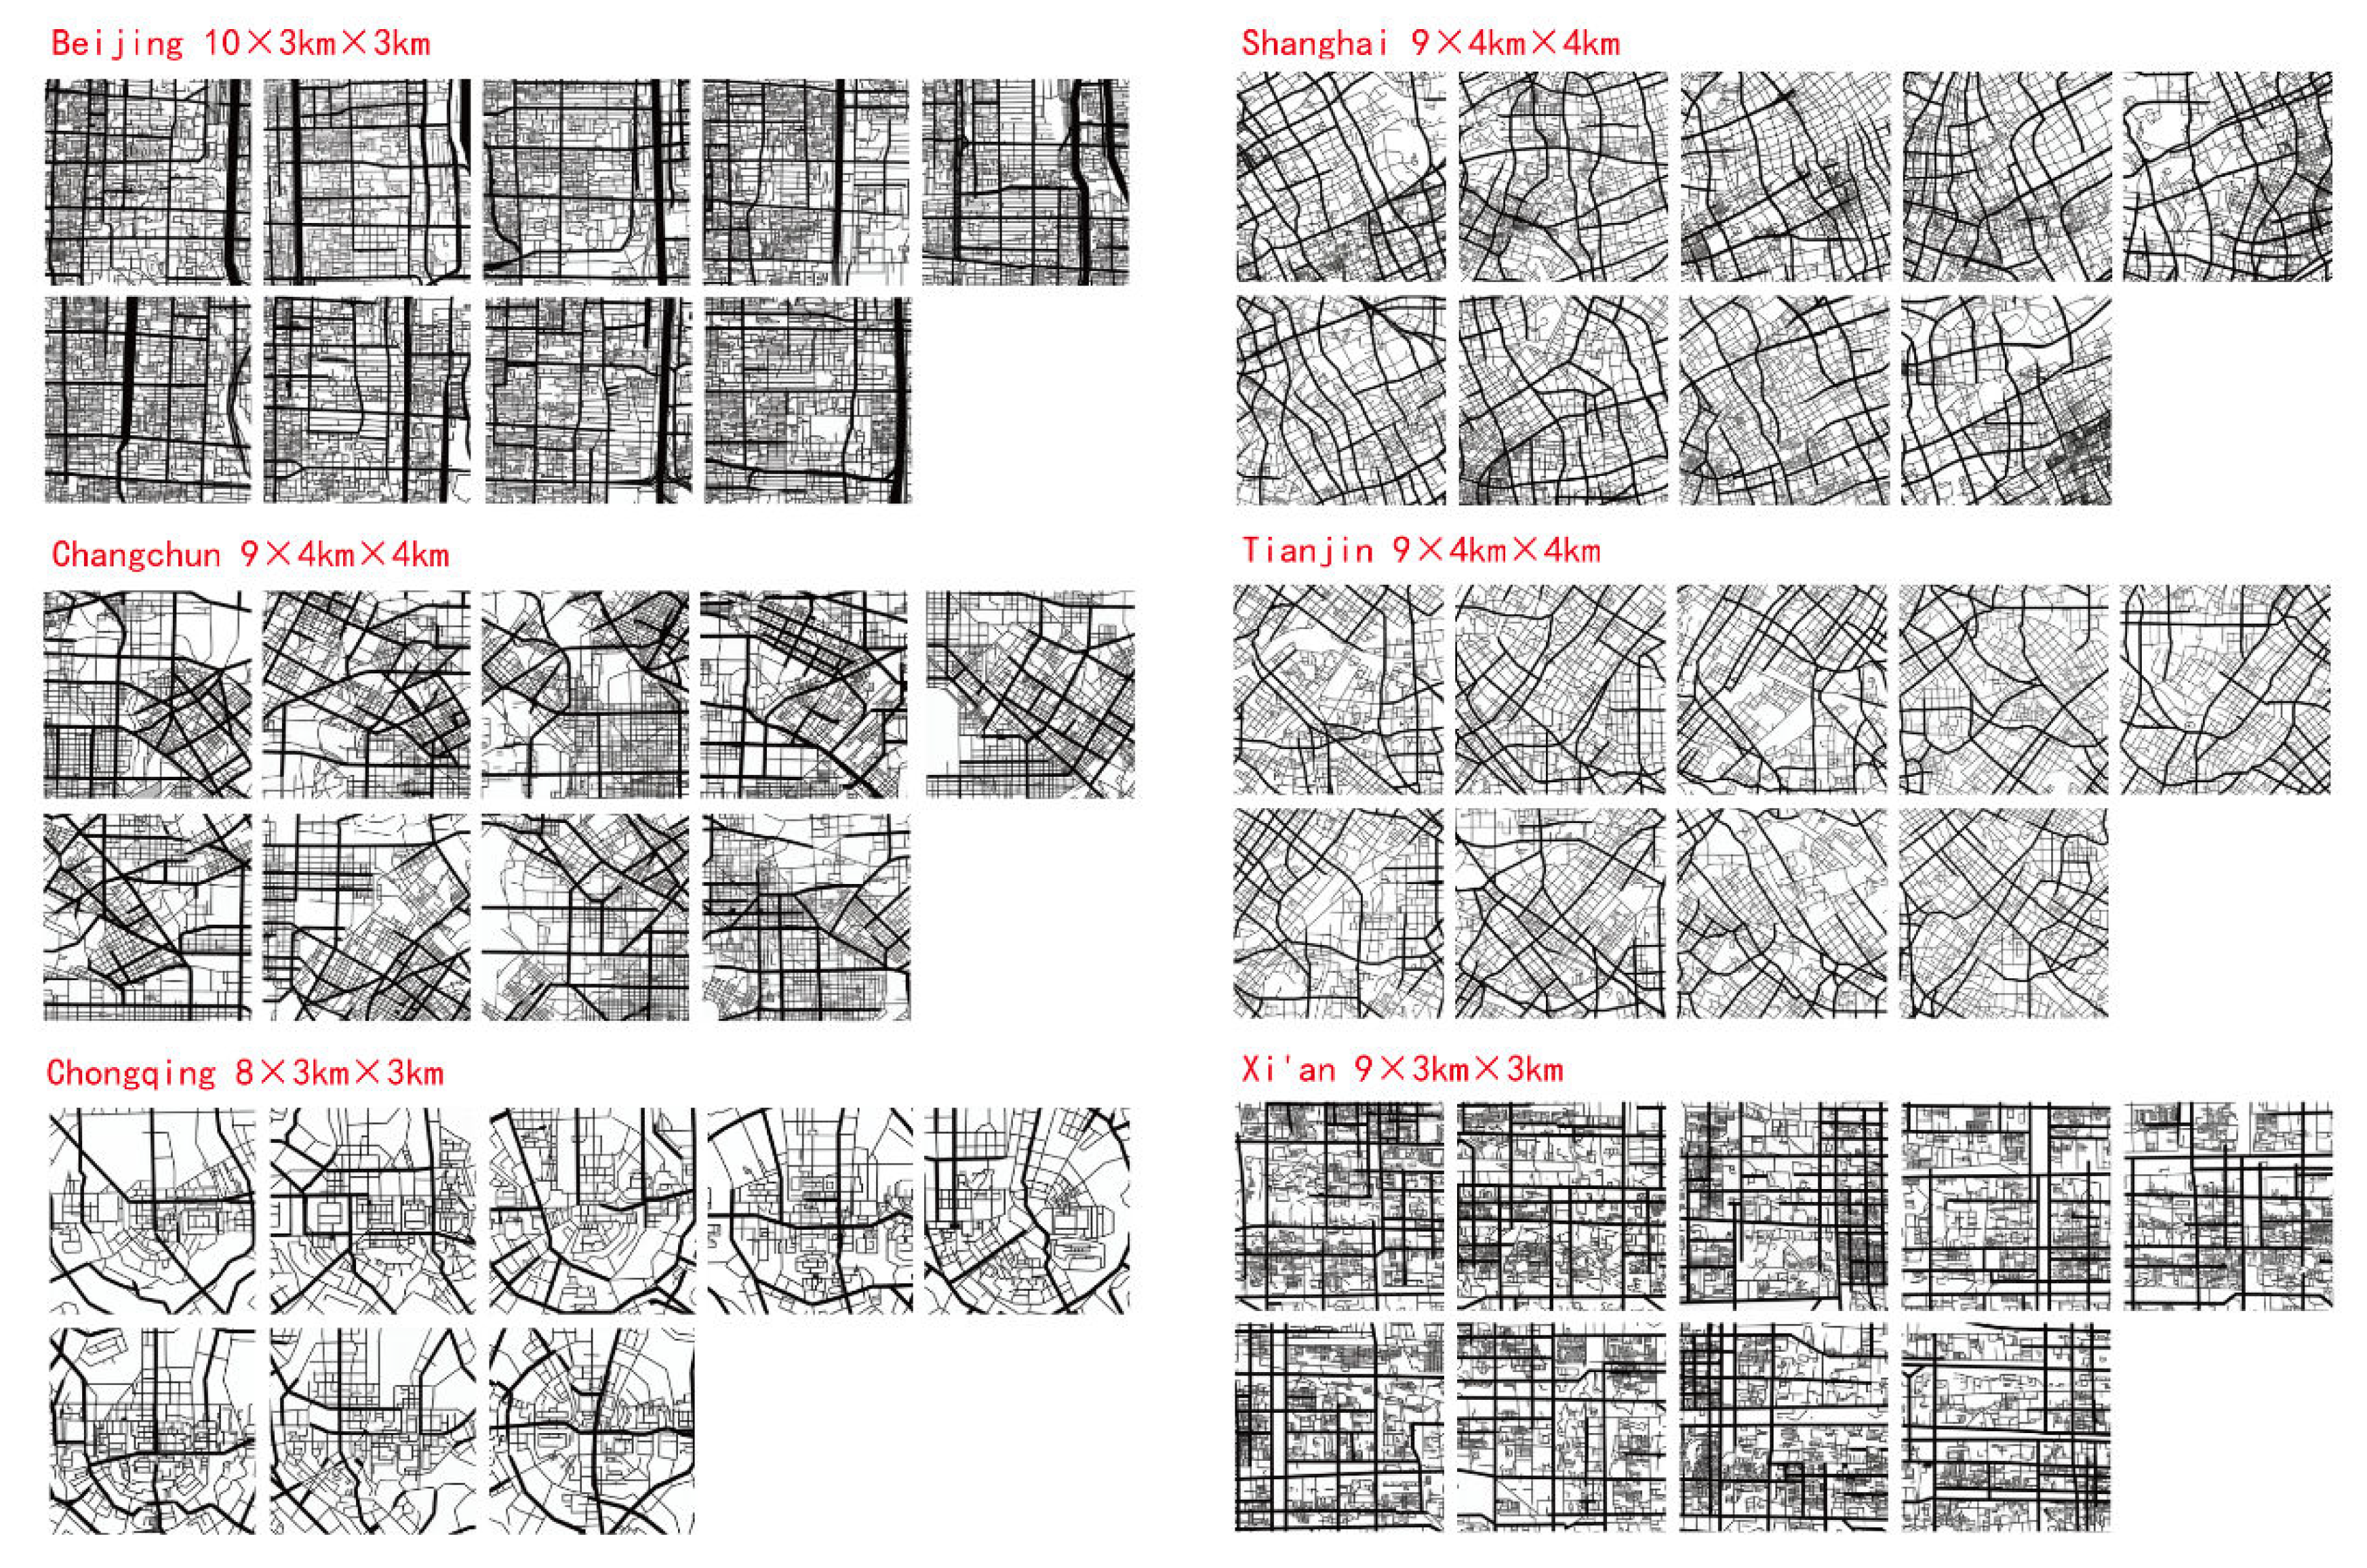
4. Calculation and Patterns of Space-Syntax Parameters in Real City Samples

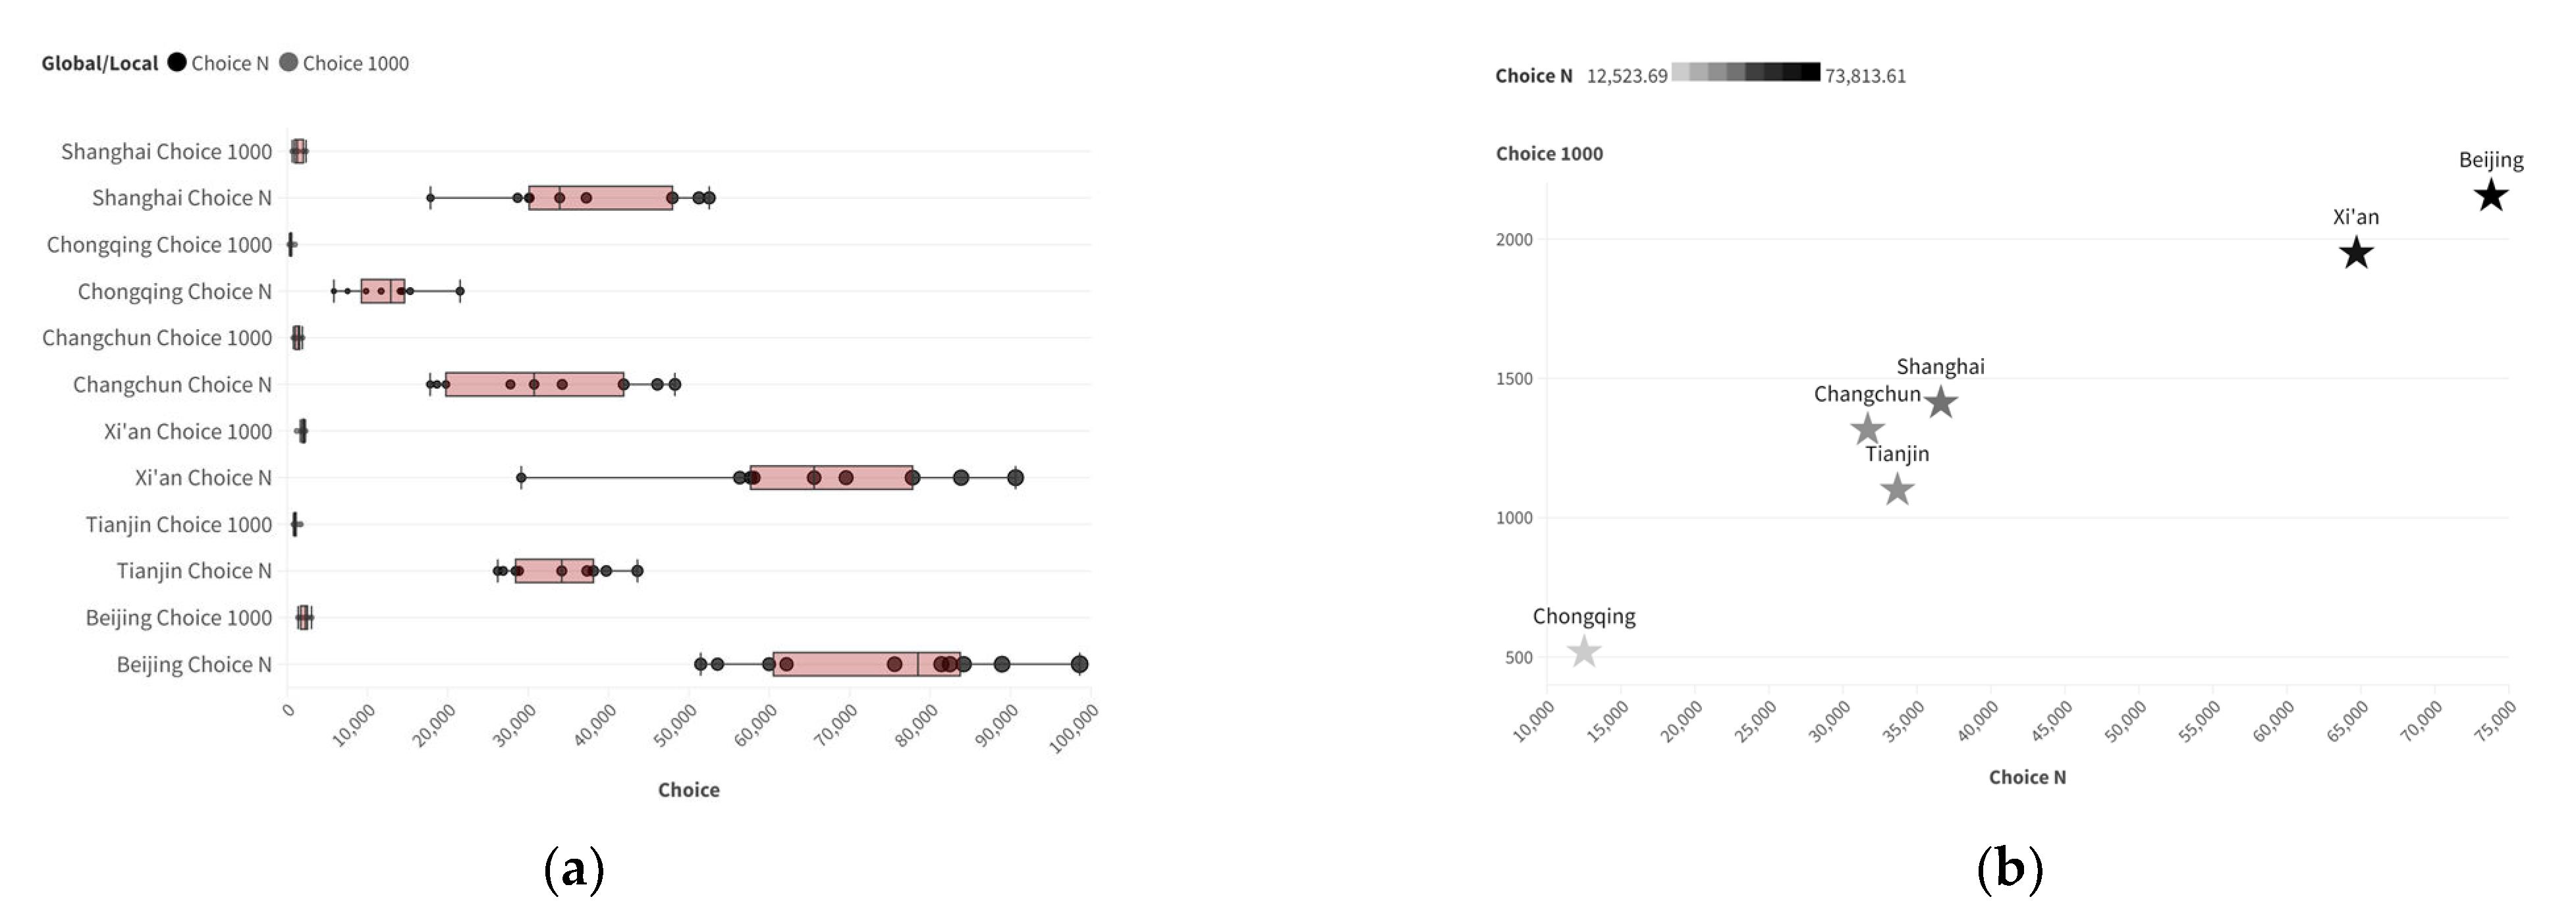
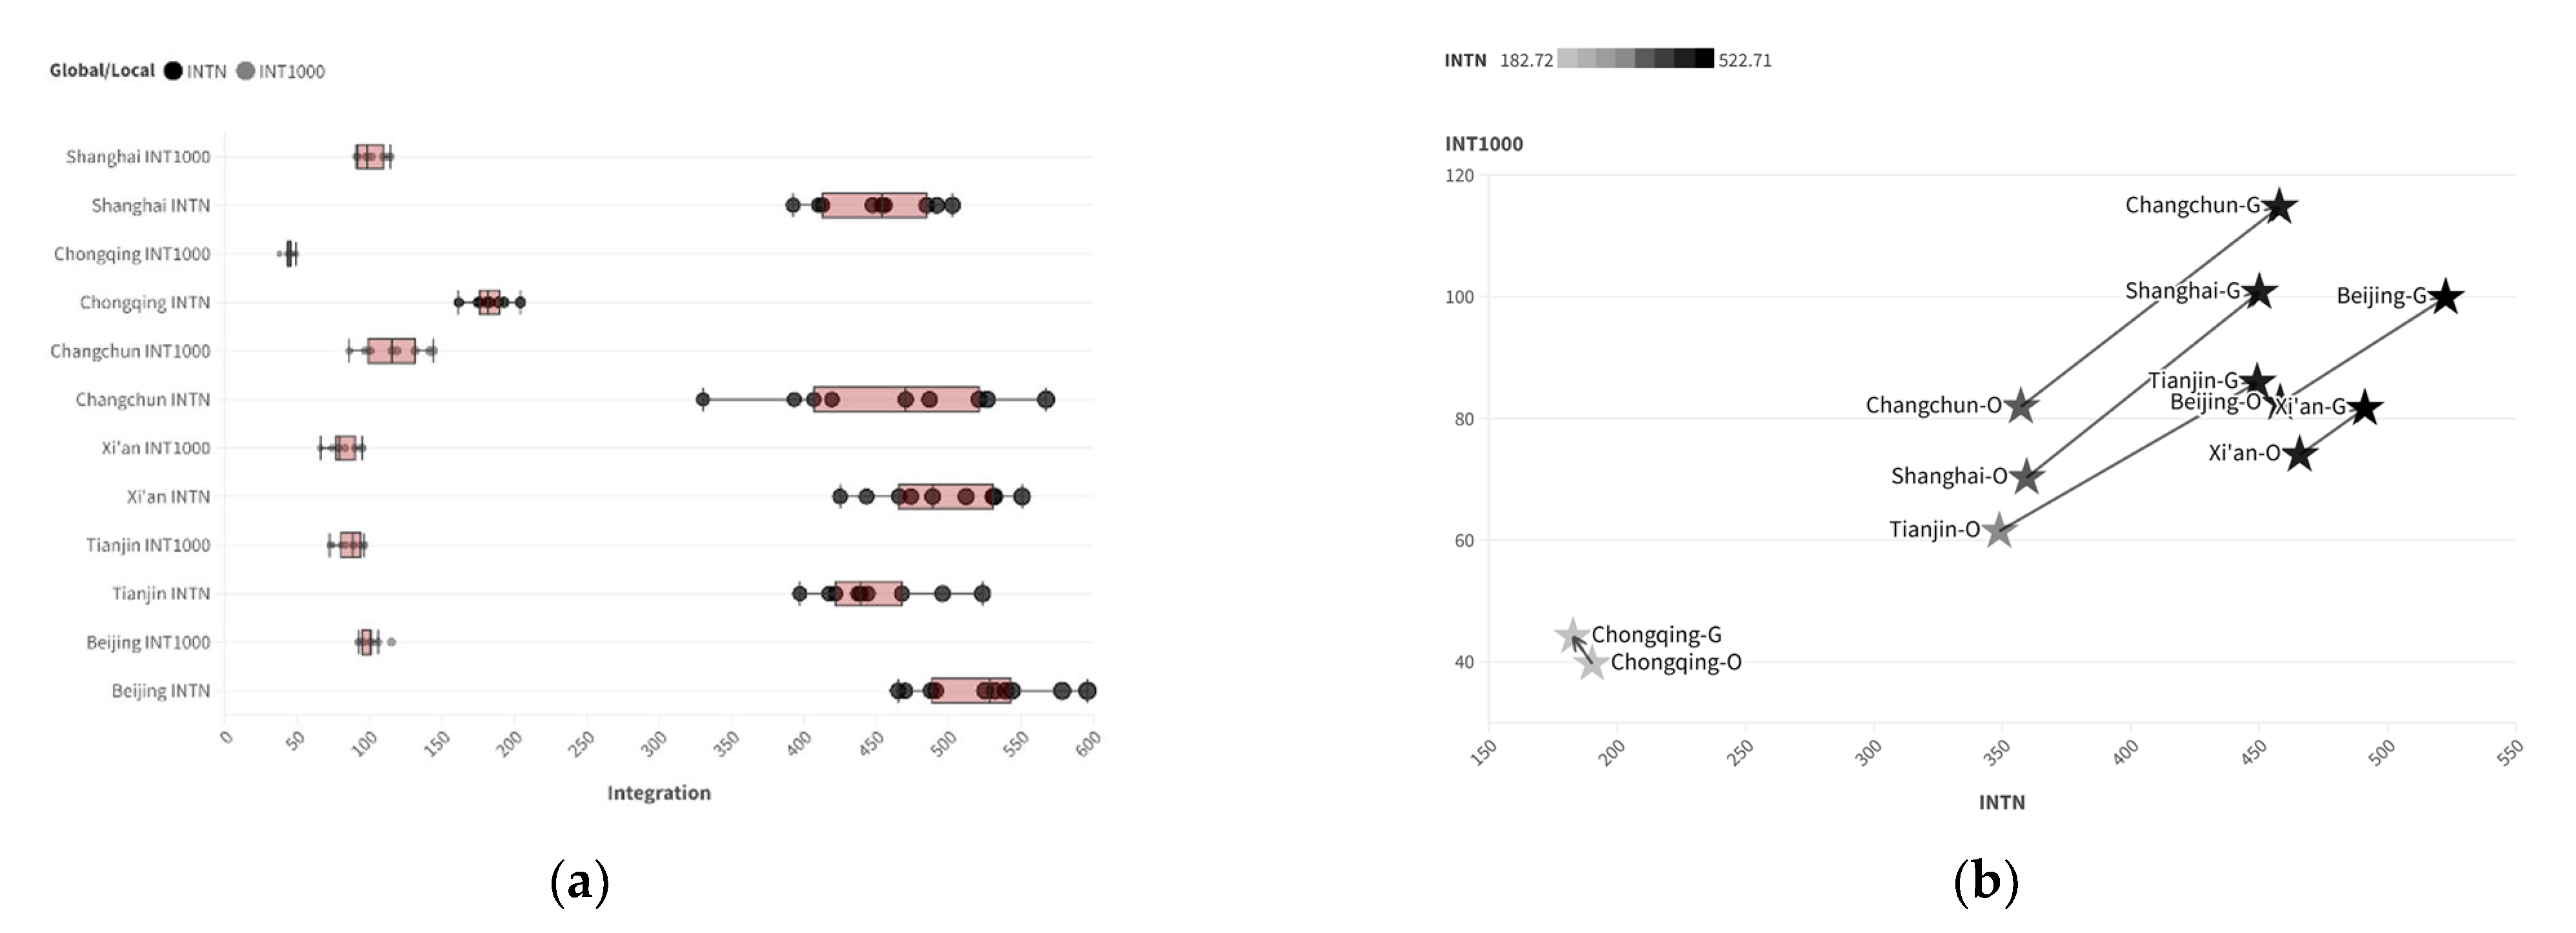
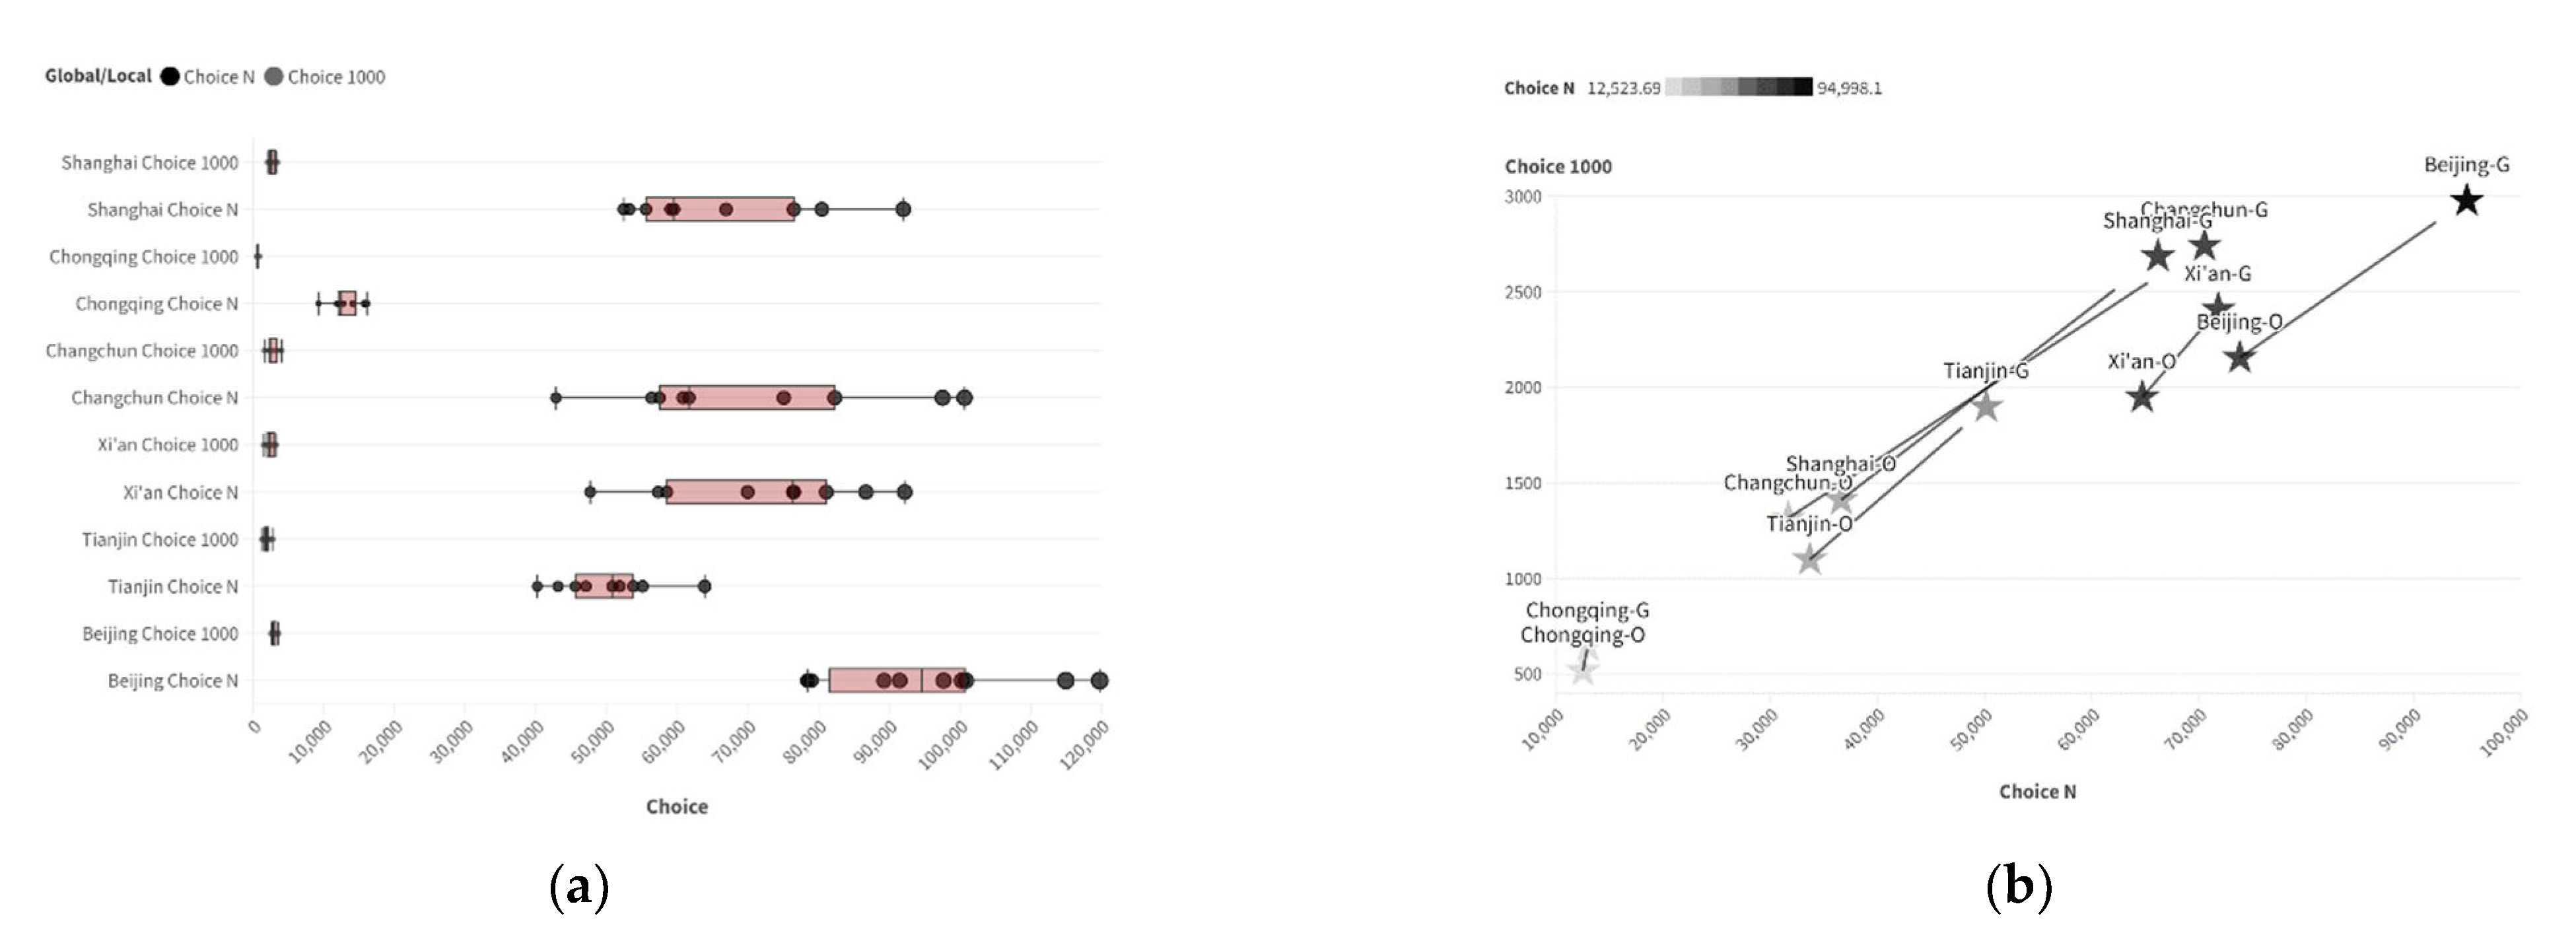
4.1. Calculation Results of Real Samples

Calculate the two-scale Integration and two-scale Choice of the road networks of two cities generated using the Diffusion Model and compare the two types of values in the training set and the generated set. Explore the distribution characteristics of the accessibility parameters of road spatial structures generated by maps of real cities and Stable Diffusion Models in different cities, as well as the degree of change in the accessibility parameters of road spatial structures in each city, both real and generated. This is to quantitatively evaluate the ability of the Stable Diffusion Model to learn and generate urban road spatial structures, in order to demonstrate the necessity of the new method, and to provide a reference system for the quantitative evaluation of the new method.
Calculate the global Integration and 1000 m radius Integration values for each extracted range of the real city, compute the global Choice and 1000 m radius Choice, and take the average values, respectively, to obtain the accessibility data of each training sample at two scales. Among these values, the city with the highest average global Integration is Xi’an, at approximately 465.82, and the lowest is Chongqing, at approximately 190.20. The cities with the highest and lowest local Integration are Beijing and Chongqing, with Beijing at approximately 82.51 and Chongqing at approximately 39.70. The city with the highest global Choice is Beijing, at 73,813.61, and the lowest is Chongqing, at approximately 12,523.69. The cities with the highest and lowest local Choice are also Beijing and Chongqing, at 2155.47 and 517.466, respectively, as shown in Table 1.
Table 1. Average values of space-syntax parameters for 6 real cities.

4.2. Distribution Characteristics of Two-Scale Accessibility Data in Training Samples

The box plot shows that the global Integration values of road spatial structures in various cities are relatively dispersed (with a large distribution range), while the local Integration values are more concentrated (with a smaller distribution range). Using two-scale accessibility as the horizontal and vertical coordinates allows for a more intuitive observation of the road structure characteristics of different cities, as shown in Figure 4.
Figure 4. Distribution characteristics of two-scale Integration parameters in the training samples: (a) box plot; (b) data distribution (horizontal axis: INTN; vertical axis: INT1000).
The distribution of global Choice in various cities is relatively dispersed, and its distribution pattern is significantly different from that of Integration. The dual-scale distribution pattern of Choice is as follows: Beijing and Xi’an have higher values on both scales, Chongqing has lower values on both scales, and the data for the other three cities are relatively close, as shown in Figure 5.
Figure 5. Distribution characteristics of Choice parameters at two scales for training samples: (a) box plot; (b) data distribution (horizontal axis: INTN; vertical axis: INT1000).

5. Model Training, Road Network Generation, and Road Network Vectorization

To enable the model to learn the differences in road structure genes between various cities, the Diffusion Model is fine-tuned using the LoRA method. The modified forward pass for an input x is
h = W 0 x + W x = W 0 x + B A x
In this equation, h represents the output vector, and the outputs of W0 and ∆W = BA are added together after being multiplied by the input x.
Each road network image is pre-processed and labeled, with the image size being standardized to 512 × 512. Subsequently, training parameters are adjusted, and a new composite loss function is used for training, resulting in six fine-tuned models.
Using six models for the batch generation of road networks, after adjusting parameters, the Stable Diffusion Model can generate road network images with certain urban road network morphological characteristics. Within a certain range of generation parameters for the six models, the generated road network structures can subjectively conform to the road network morphologies of various cities. Subsequently, the generated results were presented to two professors and ten students from the architecture department, and they were asked to select the image that most closely resembled the real urban structure of the corresponding city from among each set of four images; the final selection includes the same number of road network images generated by the Stable Diffusion model and road network images based on real road networks of the six cities.
The generated road networks are vectorized using GIS and exported as CAD files. In CAD, local long roads are fine-tuned, and then imported into Depthmap space-syntax software to be converted into segment maps for parameter calculation.
The generated results consisting of urban road structures in various cities are shown in Figure 6.
Figure 6. Training and generation of road networks in the six cities.

6. Calculation and Patterns of Accessibility for Samples Generated by Diffusion Models

6.1. Calculation Results of Generated Samples

Calculate the global Integration, 1000 m radius Integration, global Choice, and 1000 m radius Choice of the six local road structures generated by the Diffusion Model, and take the average value of each sample to obtain the accessibility data for each training sample at two scales. Then calculate the average value for all the samples in each city. The average values of each space-syntax parameter are shown in Table 2.
Table 2. Average values of 6 space syntax parameters generated by diffusion.

6.2. Distribution Characteristics of Two-Scale Accessibility Data in Generated Samples

The data distribution for Integration and Choice in cities generated by the Diffusion Model is similar to that of the real cities. The average global Integration values are more dispersed (larger distribution range), while the average local Integration values are more concentrated (smaller distribution range). This is generally consistent with findings in real cities, and the value distribution is more concentrated (smaller value range). Visualizing the value distribution of two-scale accessibility, the Integration distributions of local road structures in the training set and the generated set show a certain degree of similarity. Comparing the composite Integration of each city one by one, it is found that the differences in two-scale Integration between real road networks and generated road networks are within about 200. However, compared to other cities, the representation of generated road networks is not the closest to the original road networks. This indicates that the morphological generation of the Diffusion Model can meet subjective requirements to a certain extent and also conform to traditional architectural evaluation metrics, but also that there is still a certain gap. This is shown in Figure 7.
Figure 7. Distribution characteristics of two-scale Integration parameters in generated samples: (a) box plot; (b) parameter proximity (O: Original G: Generated; horizontal axis: INTN; vertical axis: INT1000).
The Choice data distribution for each city is also more concentrated compared to the training set. The generated representations of multiple urban road structures can be maintained within a certain range. Using the same method as used for the Integration for calculation and comparison, it was found that the similarity of the Choice distribution between the training set and the generated set of each city was slightly lower than that seen with Integration. The Choice of most cities is significantly higher than found in the real cities. This indicates that the generative model’s learning ability for parameters after deep computation is relatively limited, and trying to improve it would be worthwhile. This is shown in Figure 8.
Figure 8. Distribution characteristics of two-scale Choice parameters in generated samples: (a) box plot; (b) parameter proximity (O: Original G: Generated; horizontal axis: Choice N; vertical axis: Choice 1000).

7. Combining Convolution and Transformer Models to Predict Space-Syntax Indicators
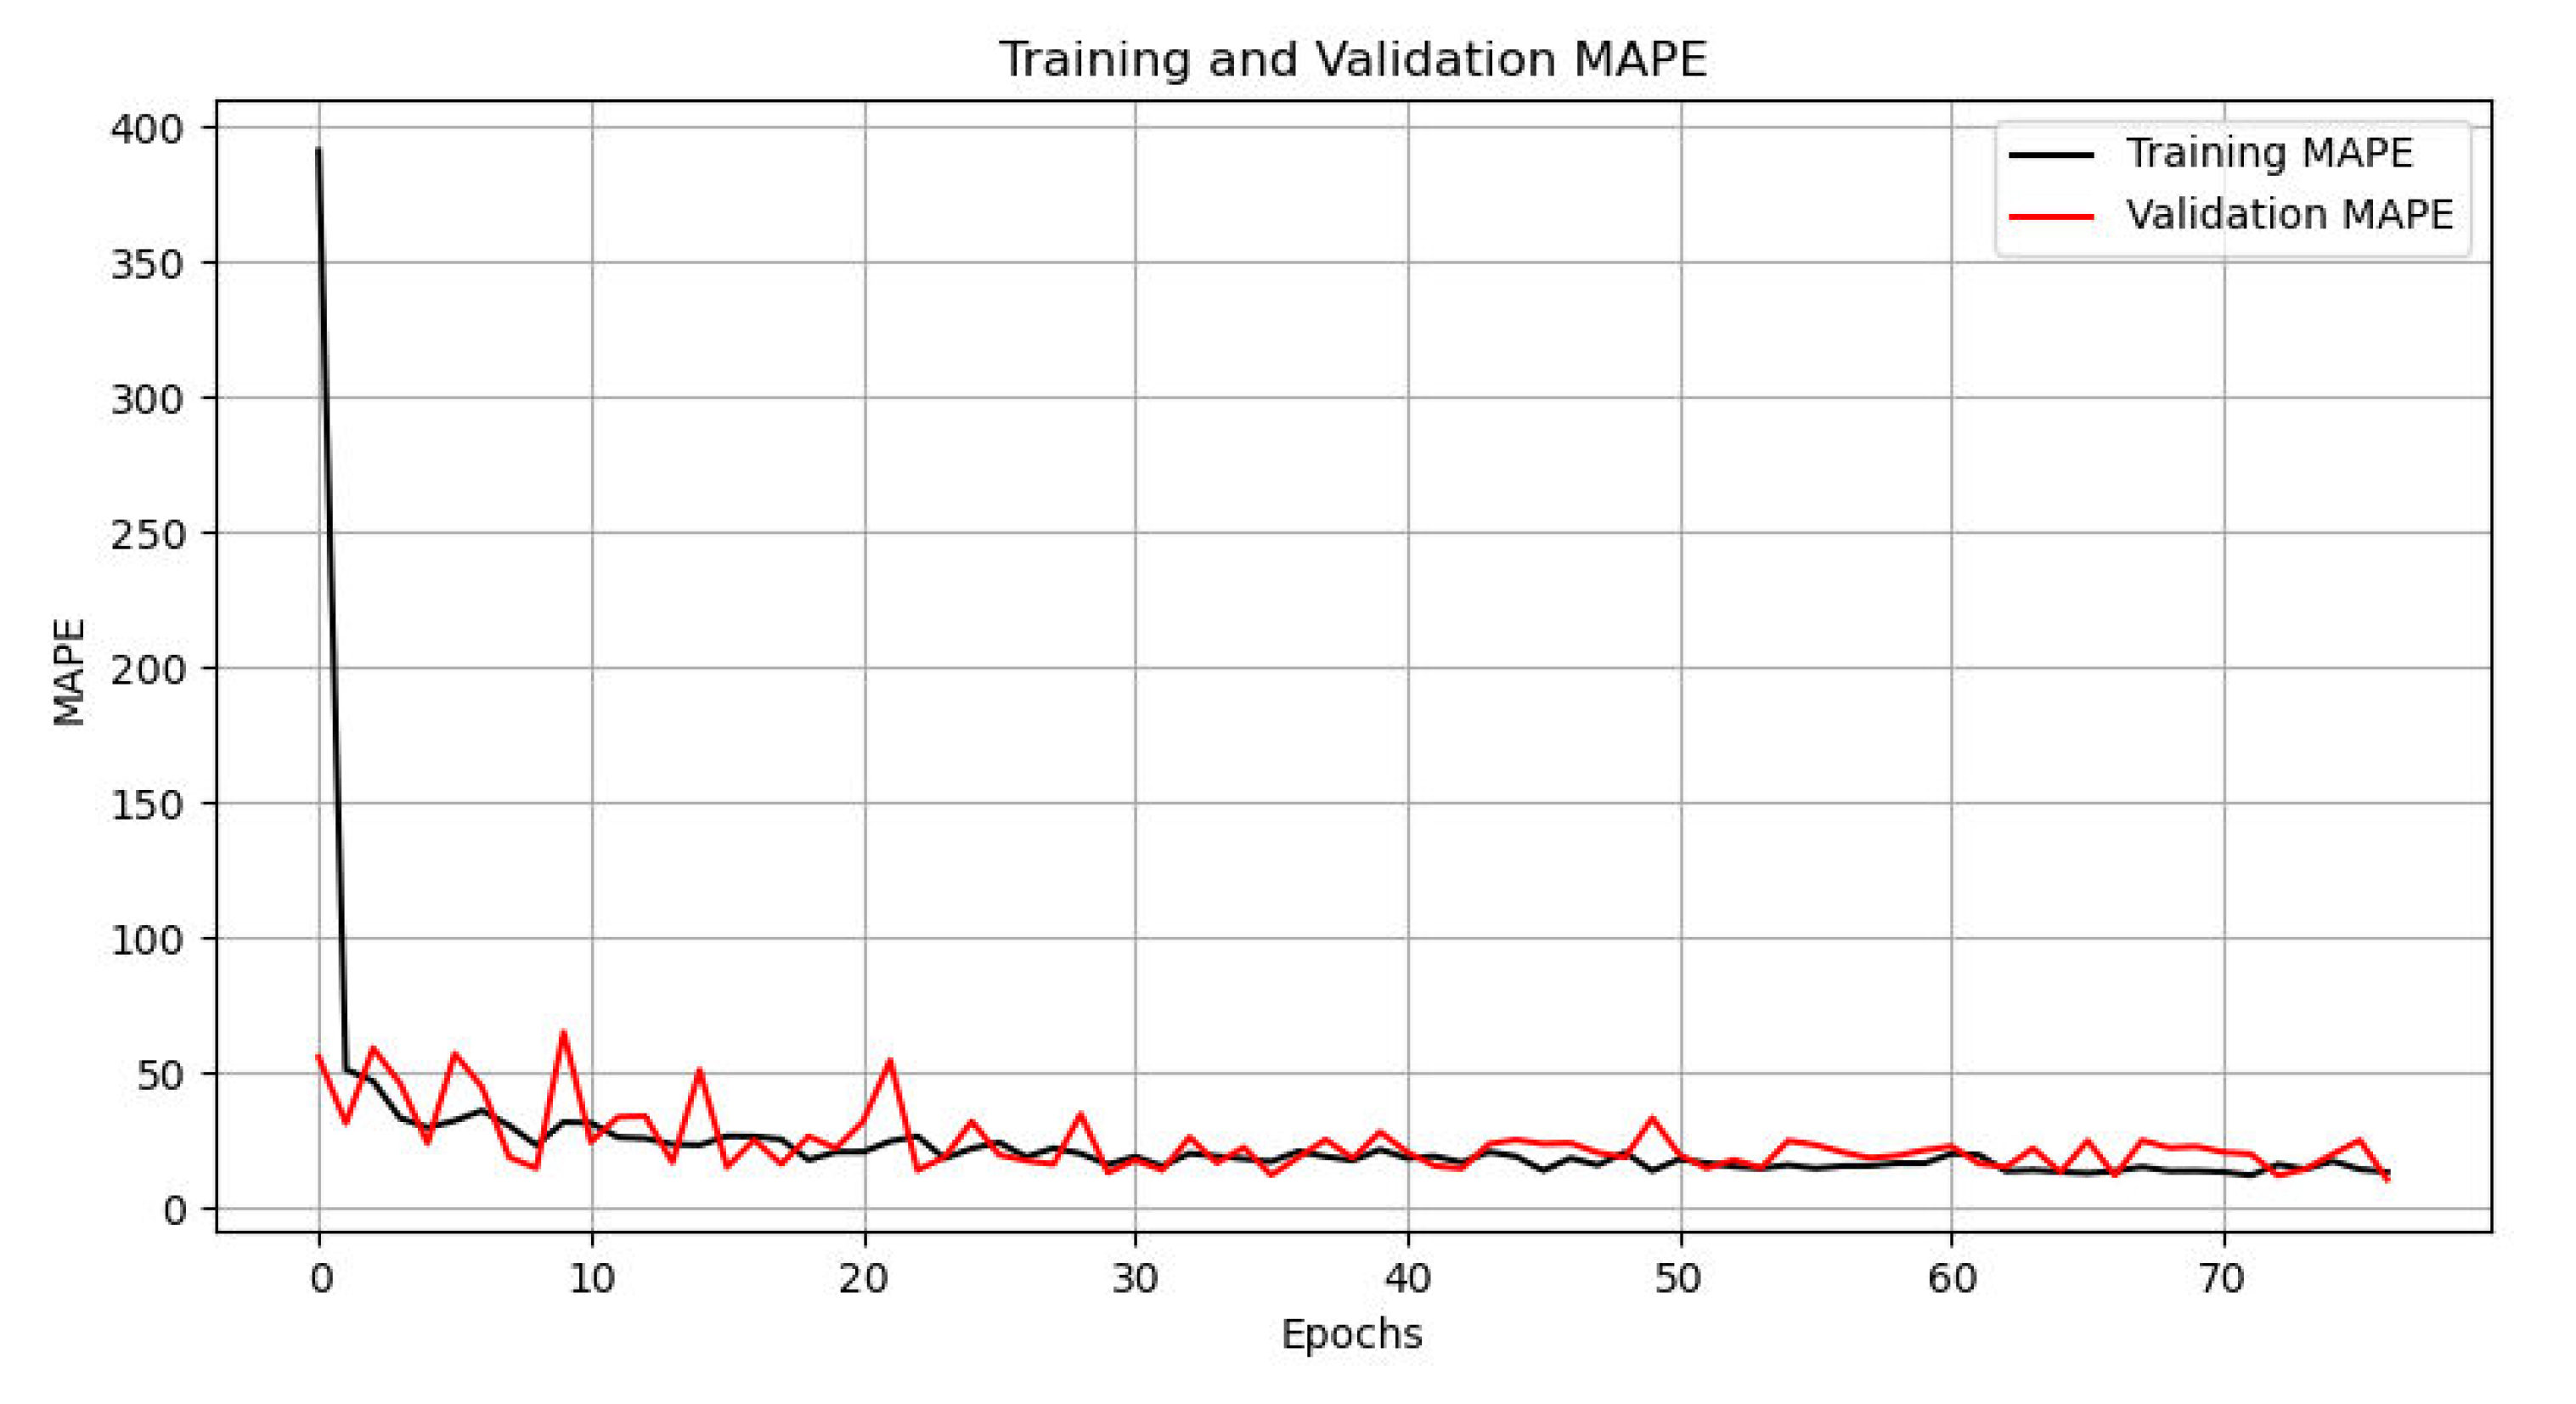
7.1. Training

CoAtNet attempts to merge some ideal characteristics of Convolution into the Transformer backbone to simultaneously obtain the local perception ability of Convolution and the global perception ability of Transformer. Convolution acquires local spatial information through fixed-size kernels [33]:
y i = j L ( i ) w i j x j
where x i , y i R D are the input and output at position i, respectively, and L i denotes a local neighborhood of i.
While the receptive field of self-attention in Transformer is the global space [33]
y i = j g e x p ( x i T x j ) k g e x p ( x i T x k ) A i , j x j
where g indicates the global spatial space.
In the topological representation calculation of road spatial structure, both local and global perception abilities are important. Global representation refers to global Integration and global Choice, while local representation refers to Integration and Choice within a 1000 m radius. Therefore, it is necessary to combine the advantages of convolution and self-attention. We follow this approach in CoAtNet, in which the global convolution kernel and adaptive attention matrix are added together before Softmax normalization, serving as the Transformer block in the model [33]:
y i p r e = j g e x p ( x i T x j + w i j ) k g e x p ( x i T x k + w j k ) x j
On this basis, we adjust the model architecture, the number of blocks, the number of channels, and the loss function to improve the similarity between the real and generated road network parameters; the input image is 512 × 512, larger than the original resolution, requiring additional stages to reduce computational load. After extensive tuning and comparison, we adjusted the original five stages (S0, S1, S2, S3, and S4) to seven stages (S0, S1, S2, S3, S4, S5, and S6), increasing the number of MBConv blocks from two to three, the number of Transformer blocks from two to three, and we introduced dropout into the model. The dropout for parameter transmission is set to 0.2, and the dropout for the self-attention module is set to 0.3 to prevent overfitting. The loss function is changed from cross-entropy loss to MSE loss to suit the regression problem. The learning rate is set to 7 × 10⁻⁴, and the optimizer used is the ADAM optimizer. The main model architecture is shown in Table 3.
Table 3. Model architecture and main parameters: L represents blocks, D represents hidden dimensions (channels), the kernel size of all Convolution blocks is set to 3, and the attention head size of all Transformer blocks is set to 32.
During the evaluation phase, we introduced the Mean Absolute Percentage Error (MAPE) as the evaluation metric. Common evaluation metrics in regression tasks include Mean Squared Error (MSE), Root Mean Squared Error (RMSE), Mean Absolute Error (MAE), Mean Absolute Percentage Error (MAPE), and the Coefficient of Determination (R2). MSE and RMSE are sensitive to outliers, as squaring the errors amplifies the impact of extreme values. MAE, on the other hand, is relatively robust and provides a more intuitive reflection of the actual prediction error. R2 offers a comprehensive measure of the model’s goodness-of-fit. However, only MAPE can express the error as a percentage, making it particularly useful for comparing the performance of prediction models across datasets of different scales or variables of different magnitudes. In this study, the four spatial syntax parameters we used have different ranges, and expressing the errors as percentages allows for a more intuitive representation of the prediction errors. Additionally, MAPE remains applicable even when prediction parameters are changed, making it a versatile metric. Therefore, we chose MAPE as the evaluation metric for prediction error in this study. The formula for MAPE is as follows:
M A P E 1 = 100 % n i = 1 n y i ^ y i y i
where y i is the actual value and y i ^ is the predicted value. The difference between them is divided by the actual value y i . This ratio is taken as an absolute value, and then the absolute values of all elements are summed and divided by the total number n.
The training data for the evaluation model consist of single-channel road spatial structure images and four corresponding space-syntax parameters for each image. After data augmentation, 425 training samples were used for training, and 120 samples were used as the validation set.
After parameter adjustment and iteration, the MAPE on the training set and validation set can reach 13.49% and 10.79%, respectively, after 76 epochs. In other words, after screening, the final output road spatial structure can achieve a mean absolute percentage error of 10.79%, compared to the real city, as illustrated in Figure 9.
Figure 9. MAPE of training set and validation set.

7.2. Testing

Now, use the generative model to regenerate the road spatial structure, predict its space-syntax parameters using Convolution and Transformer Models, and calculate its real space-syntax parameters using exactly the same vectorization process. After comparisons, the predicted MAPE of the four parameters is shown in Table 4. All parameters can achieve a relatively low prediction error, with the average prediction error being 14.39%, which is still a relatively ideal result.
Table 4. Prediction error (MAPE) of the test set.

8. Conclusions and Discussion

Finally, the improved method was used to generate the road spatial structure for each city, as shown in Figure 10. After vectorization, it was compared with the road spatial structure generated using only the Diffusion Model across four evaluation metrics. The results indicate that, compared to using only the Diffusion-LoRA model, the integration of the Convolution + Transformer Model yields parameters that are closer to the original. The composite Integration and composite Choice for three cities show the smallest errors compared to other cities, as illustrated in Figure 11.
Figure 10. Road spatial structure generated for each city using the improved model.
Figure 11. Comparison of newly generated and original city space syntax parameters (O: Original, and G: Generated): (a) integration; (b) choice.
In order to evaluate the improved method using a single evaluation metric, we use the same evaluation metric MAPE as the prediction model, but with different variables:
M A P E 2 = 100 % n i = 1 n g i o i o i
where g i represents the space-syntax parameters of the road spatial structure generated by the model after manual vectorization, and o i represents the average value of the space-syntax parameters of the original road spatial structure of the corresponding city. This is used to evaluate the deviation of the generated design from the representation of the real city.
For each metric, MAPE is calculated. The results show that the difference (MAPE) between the road spatial structure generated by the Convolution + Transformer (CoAtNet) Model and the road network parameters generated by using only the generative model is reduced by 12.7%. Since a lower MAPE value indicates a better result, it can also be said that the new method improves the effect by 12.7% compared to the original method, which is a significant improvement for the generative model. This is shown in Table 5. On the other hand, during the Diffusion Model generation phase, manual selection was employed, which subjectively tends to choose results that better match the characteristics of real cities. This subjective selection is likely to make the MAPE lower than the results generated randomly by the model. Therefore, integrating the evaluation model may improve the effectiveness beyond the observed values. In other words, the evaluation model’s ability to learn and perceive complex and deep numerical representations has already surpassed that of humans. This method of using two deep learning models to collaborate indeed significantly improves the specific evaluation metrics of the generated design outcomes.
Table 5. MAPE for road networks generated using only the Diffusion Model, versus those incorporating the Convolution + Transformer (CoAtNet) Model.
This paper proposes a novel method designed to improve the generative design model’s generation effect, a method which involves the determination of evaluation metrics and the training of another deep learning model (using a CoAtNet Model in this paper) to predict all evaluation metrics. The two models are connected end-to-end, and the generated results of the generative model are evaluated using the predicted metrics. Subsequently, the generated results are filtered to achieve the study’s purpose, optimizing the generation effect.
Specifically, the datasets used are obtained from areas of road networks of approximately 16 square kilometers in the central areas of six cities: Beijing, Tianjin, Xi’an, Changchun, Chongqing, and Shanghai, along with four manually calculated space-syntax parameters (two-scale Integration and two-scale Choice) used as training data. A Diffusion Model is trained as the generative model, and a Convolution + Transformer (CoAtNet) Model is trained as the evaluation model. Initially, the Diffusion Model is used to generate road structures for each city, and their Integration and Choice at two scales are calculated and compared with the corresponding parameters of the real urban road spatial structures. The results show that the fine-tuning model of the Diffusion Model can learn and recognize the differences in the genetic makeup of various cities to a certain extent, but the relative metrics of most generated results vary greatly. The Diffusion Model still lacks in its learning as to the deep rules of the discipline. Subsequently, the Convolution + Transformer (CoAtNet) Model is introduced into the generation process to predict these deep metrics and select the optimal results. A single evaluation metric, MAPE, is used to evaluate the model’s effectiveness. The results indicate that the method of introducing the new model yields better results than using only the generative model and is superior to the results selected by professionals. This achieves the optimization of the generation process, making the results of the generative algorithm better meet the classic evaluation metrics of the discipline.
Compared to previous related research, this study offers the following key innovations: (1) evaluation of existing state-of-the-art generative models (Stable Diffusion Models) using architectural objective quantitative indicators; (2) the proposal of an evaluation method (space syntax) for generative design in the field of urban design, where standards are not yet clear; (3) not only an evaluation, but also the introduction of another deep learning model as an evaluation model to the generation model to improve the quality of results generated; (4) the evaluation model, which combines advanced models in the field of computer vision (CNN and Transformer) to achieve amazing prediction results of architectural evaluation indicators, and which can replace manual calculations to a certain extent, thereby speeding up the evaluation process; and (5) the achievement of optimization of the generative design outcomes at an urban scale, one which can also be applied to the architectural scale in the future.

9. Limitations and Future Work

This study selected six typical cities in China. However, the data for these cities are still not comprehensive and can be supplemented in future research. This paper uses road spatial structure as the only generation target. In the future, this generation method should be extended to building plans, master plans, and urban design plans, with more elements being added to improve the generalizability of the method. This paper only uses four space-syntax parameters. In the future, more evaluation metrics, or other information beyond that which pixels can represent, including subjective ratings, could be considered. This paper uses pixel images to represent design outcomes, which may not sufficiently and concisely convey all of the design information. In the future, vector data might be used to represent design outcomes. Additionally, the training dataset should be expanded in the future to continue improving the accuracy of the prediction model.
In terms of the method’s generalizability, testing has shown that the proposed method is capable of performing generative tasks in the urban domain. Since the SD-LoRA model’s training data can be replaced with other images, and the evaluation model’s prediction targets can be replaced with other evaluation parameters, the method has strong theoretical generalization capabilities. It can potentially be applied to other reasonable generation–evaluation tasks (e.g., building floor plan generation, which is currently in the experimental stage). We will continue to explore this in future research.

Author Contributions

Conceptualization, D.Y. and Q.S.; methodology, D.Y.; software, D.Y.; validation, D.Y., B.W. and Q.S.; formal analysis, D.Y.; investigation, D.Y.; resources, B.W.; data curation, D.Y.; writing—original draft preparation, D.Y.; writing—review and editing, D.Y.; visualization, D.Y.; supervision, B.W.; project administration, Q.S.; funding acquisition, Q.S. All authors have read and agreed to the published version of the manuscript.

Funding

This research was funded by National Key Research and Development Program of China, grant number 2022YFC3801300.

Data Availability Statement

The original contributions presented in the study are included in the article further inquiries can be directed to the corresponding authors.

Conflicts of Interest

The authors declare no conflicts of interest.

References

  1. Li, C.; Zhang, T.; Du, X.; Zhang, Y.; Xie, H. Generative AI for Architectural Design: A Literature Review. arXiv 2024, arXiv:2404.01335. [Google Scholar]
  2. Creswell, A.; White, T.; Dumoulin, V.; Arulkumaran, K.; Sengupta, B.; Bharath, A.A. Generative adversarial networks: An overview. IEEE Signal Process. Mag. 2018, 35, 53–65. [Google Scholar] [CrossRef]
  3. Wang, T.C.; Liu, M.Y.; Zhu, J.Y.; Tao, A.; Kautz, J.; Catanzaro, B. High-resolution image synthesis and semantic manipulation with conditional gans. In Proceedings of the IEEE Conference on Computer Vision and Pattern Recognition, Salt Lake City, UT, USA, 18–22 June 2018; pp. 8798–8807. [Google Scholar]
  4. Dhariwal, P.; Nichol, A. Diffusion models beat gans on image synthesis. Adv. Neural Inf. Process. Syst. 2021, 34, 8780–8794. [Google Scholar]
  5. Chen, J.; Shao, Z.; Hu, B. Generating Interior Design from Text: A New Diffusion Model-Based Method for Efficient Creative Design. Buildings 2023, 13, 1861. [Google Scholar] [CrossRef]
  6. Ho, J.; Jain, A.; Abbeel, P. Denoising diffusion probabilistic models. Adv. Neural Inf. Process. Syst. 2020, 33, 6840–6851. [Google Scholar]
  7. Saharia, C.; Chan, W.; Saxena, S.; Li, L.; Whang, J.; Denton, E.L.; Ghasemipour, K.; Gontijo Lopes, R.; Karagol Ayan, B.; Salimans, T.; et al. Photorealistic text-to-image diffusion models with deep language understanding. In Proceedings of the Advances in Neural Information Processing Systems; Koyejo, S., Mohamed, S., Agarwal, A., Belgrave, D., Cho, K., Oh, A., Eds.; Curran Associates, Inc.: New York, NY, USA, 2022; Volume 35, pp. 36479–36494. [Google Scholar]
  8. Borji, A. Generated faces in the wild: Quantitative comparison of stable diffusion, midjourney and dall-e 2. arXiv 2022, arXiv:2210.00586. [Google Scholar]
  9. Nichol, A.Q.; Dhariwal, P. Improved denoising diffusion probabilistic models. In Proceedings of the International Conference on Machine Learning, New York, NY, USA, 18–24 July 2021; Meila, M., Zhang, T., Eds.; PMLR: New York, NY, USA, 2021; Volume 139, pp. 8162–8171. [Google Scholar]
  10. Rombach, R.; Blattmann, A.; Lorenz, D.; Esser, P.; Ommer, B. High-resolution image synthesis with latent diffusion models. In Proceedings of the IEEE/CVF Conference on Computer Vision and Pattern Recognition, New Orleans, LA, USA, 18–24 June 2022; pp. 10684–10695. [Google Scholar]
  11. Gu, S.; Chen, D.; Bao, J.; Wen, F.; Zhang, B.; Chen, D.; Yuan, L.; Guo, B. Vector quantized diffusion model for text-to-image synthesis. In Proceedings of the IEEE/CVF Conference on Computer Vision and Pattern Recognition, New Orleans, LA, USA, 18–24 June 2022; pp. 10696–10706. [Google Scholar]
  12. Nichol, A.Q.; Dhariwal, P.; Ramesh, A.; Shyam, P.; Mishkin, P.; Mcgrew, B.; Sutskever, I.; Chen, M. GLIDE: Towards Photorealistic Image Generation and Editing with Text-Guided Diffusion Models. In Proceedings of the International Conference on Machine Learning, Baltimore, MA, USA, 17–23 July 2022; pp. 16784–16804. [Google Scholar]
  13. Kawar, B.; Zada, S.; Lang, O.; Tov, O.; Chang, H.; Dekel, T.; Mosseri, I.; Irani, M. Imagic: Text-based real image editing with diffusion models. In Proceedings of the IEEE/CVF Conference on Computer Vision and Pattern Recognition, Vancouver, BC, Canada, 17–24 June 2023; pp. 6007–6017. [Google Scholar]
  14. Avrahami, O.; Lischinski, D.; Fried, O. Blended diffusion for text-driven editing of natural images. In Proceedings of the IEEE/CVF Conference on Computer Vision and Pattern Recognition, New Orleans, LA, USA, 18–24 June 2022; pp. 18208–18218. [Google Scholar]
  15. Yang, L.; Zhang, Z.; Song, Y.; Hong, S.; Xu, R.; Zhao, Y.; Shao, Y.; Zhang, W.; Cui, B.; Yang, M.H. Diffusion models: A comprehensive survey of methods and applications. arXiv 2022, arXiv:2209.00796. [Google Scholar] [CrossRef]
  16. Croitoru, F.A.; Hondru, V.; Ionescu, R.T.; Shah, M. Diffusion models in vision: A survey. IEEE Trans. Pattern Anal. Mach. Intell. 2023, 45, 10850–10869. [Google Scholar] [CrossRef]
  17. Song, J.; Meng, C.; Ermon, S. Denoising Diffusion Implicit Models. In Proceedings of the International Conference on Learning Representations, Virtual Event, 26 April–1 May 2020. [Google Scholar]
  18. Chen, J.; Wang, D.; Shao, Z.; Zhang, X.; Ruan, M.; Li, H.; Li, J. Using artificial intelligence to generate master-quality architectural designs from text descriptions. Buildings 2023, 13, 2285. [Google Scholar] [CrossRef]
  19. Ko, J.; Ennemoser, B.; Yoo, W.; Yan, W.; Clayton, M.J. Architectural spatial layout planning using artificial intelligence. Autom. Constr. 2023, 154, 105019. [Google Scholar] [CrossRef]
  20. Hillier, B. Space Is the Machine; Cambridge University Press: Cambridge, UK, 1996. [Google Scholar]
  21. Hillier, B.; Hanson, J. The Social Logic of Space; Cambridge University Press: Cambridge, UK, 1984. [Google Scholar]
  22. Duan, J.; Yang, T.; Sheng, Q.; Wang, H.; Dai, X. Space Syntax Tutorial; China Architecture & Building Press: Beijing, China, 2019; pp. 60–63. [Google Scholar]
  23. Wu, W.; Fu, X.-M.; Tang, R.; Qi, Y.-H.; Liu, L. Data-driven interior plan generation for residential buildings. AMC Trans. Gragh. 2019, 38, 1–12. [Google Scholar] [CrossRef]
  24. Huang, W.; Zheng, H. Architectural drawings recognition and generation through machine learning. In Proceedings of the 38th Annual Conference of the Association for Computer Aided Design in Architecture, Mexico City, Mexico, 18–20 October 2018; pp. 18–20. [Google Scholar]
  25. Chaillou, S. AI + Architecture|Towards a New Approach; Harvard University: Cambridge, MA, USA, 2022. [Google Scholar]
  26. Zeng, P.; Gao, W.; Yin, J.; Xu, P.; Lu, S. Residential floor plans: Multi-conditional automatic generation using diffusion models. Autom. Constr. 2024, 162, 105374. [Google Scholar] [CrossRef]
  27. Shabani, M.A.; Hosseini, S.; Furukawa, Y. Housediffusion: Vector floorplan generation via a diffusion model with discrete and continuous denoising. In Proceedings of the IEEE/CVF, Vancouver, BC, Canada, 18–22 June 2023; pp. 5466–5475. [Google Scholar]
  28. Wang, L.; Liu, J.; Cheng, G.; Liu, E.; Chen, W. Constructing a personalized AI assistant for shear wall layout using Stable Diffusion. arXiv 2023, arXiv:2305.10830. [Google Scholar]
  29. Park, K.; Ergan, S.; Feng, C. Quality assessment of residential layout designs generated by relational Generative Adversarial Networks (GANs). Autom. Constr. 2024, 158, 105243. [Google Scholar] [CrossRef]
  30. Sandler, M.; Howard, A.; Zhu, M.; Zhmoginov, A.; Chen, L.C. Mobilenetv2: Inverted residuals and linear bottlenecks. In Proceedings of the IEEE Conference on Computer Vision and Pattern Recognition, Salt Lake City, UT, USA, 18–22 June 2018; pp. 4510–4520. [Google Scholar]
  31. Alexey, D. An image is worth 16x16 words: Transformers for image recognition at scale. arXiv 2020, arXiv:2010.11929. [Google Scholar]
  32. Khan, A.; Rauf, Z.; Sohail, A.; Khan, A.R.; Asif, H.; Asif, A.; Farooq, U. A survey of the vision transformers and their CNN-transformer based variants. Artif. Intell. Rev. 2023, 56 (Suppl. S3), 2917–2970. [Google Scholar] [CrossRef]
  33. Dai, Z.; Liu, H.; Le, Q.V.; Tan, M. Coatnet: Marrying convolution and attention for all data sizes. Adv. Neural Inf. Process. Syst. 2021, 34, 3965–3977. [Google Scholar]
  34. Choudhary, P.; Adane, V. Spatial configurations of the urban cores in central India. In Proceedings of the Eighth International Space Syntax Symposium, Santiago de Chile, Chile, 3–6 January 2012; pp. 1–19. [Google Scholar]
  35. Can, I.; Heath, T. In-between spaces and social interaction: A morphological analysis of Izmir using space syntax. J. Hous. Built Environ. 2016, 31, 31–49. [Google Scholar] [CrossRef]
  36. Topçu, M. Morphological structures of historical Turkish cities. ICONARP Int. J. Archit. Plan. 2019, 7, 212–239. [Google Scholar] [CrossRef]
  37. Zhang, X.; Ren, A.; Chen, L.; Zheng, X. Measurement and spatial difference analysis on the accessibility of road networks in major cities of China. Sustainability 2019, 11, 4209. [Google Scholar] [CrossRef]
  38. Liao, P.; Gu, N.; Brisbin, C.; Rofe, M. Discovering the Spatial Properties of Chinese Historic Towns Through Mathematical Means. In Proceedings of the 12th Space Syntax Symposium, Beijing, China, 8–13 July 2019. [Google Scholar]
  39. Rejeb Bouzgarrou, A.; Claramunt, C.; Rejeb, H. Visualizing urban sprawl effects of a Tunisian city: A new urban spatial configuration of Monastir. Ann. GIS 2019, 25, 71–82. [Google Scholar] [CrossRef]
  40. El-Khouly, T.; Eldiasty, A.; Kamel, B. Monitoring the transformation in New Cairos urban vitality and the accompanying social and economic phenomena. Front. Archit. Res. 2023, 12, 867–891. [Google Scholar] [CrossRef]
Disclaimer/Publisher’s Note: The statements, opinions and data contained in all publications are solely those of the individual author(s) and contributor(s) and not of MDPI and/or the editor(s). MDPI and/or the editor(s) disclaim responsibility for any injury to people or property resulting from any ideas, methods, instructions or products referred to in the content.

Article Metrics

Citations

Article Access Statistics

Multiple requests from the same IP address are counted as one view.