Abstract
As a no-disturbance integrated-retrofitting technique, an external rocking frame was widely used on reinforced concrete (RC) structures. Yet, with the increasing demand for seismic strengthening of existing buildings, it has become a concern to evaluate the seismic strengthening schemes based on seismic resilience. Firstly, the dynamic equation of the structural system was derived, and the deformation control mechanism was revealed; thus, the corresponding design method was put forward for the rocking frame reinforcement. Secondly, after soft-first-floor structures were reinforced by rocking frames, the evaluation method of the reinforcement scheme was investigated based on seismic resilience. Finally, the feasibility of the assessment method was verified by a soft-first-floor frame structure, and a comparison was made between the method proposed in this paper and the conventional method. The results find that the soft-first-floor structure reinforced by the rocking frame increased by 10% in the inter-layer displacement and improved by 55.6% and 63.0% in the injury and mortality rates, compared to the buckling-restrained brace scheme. This indicates that the reinforcement scheme of soft layer structures with rocking frames is feasible and effective, and the reinforcement evaluation method proposed in this paper can quantitatively reflect the improvement in seismic performance.
1. Introduction
Changes in the lateral shift stiffness caused by the height of the structural layer are likely to form a “soft layer” in the structure. Especially when meeting the requirements for building spacing, the height of the building’s first floor is usually increased [1,2], which leads to a decrease in the stiffness of the building’s first floor, thus resulting in a soft-first-floor structure. Under seismic actions, the failure of the soft-first-floor structure usually occurs on the first floor of the structure, which can lead to structural collapses, thus resulting in huge economic losses and heavy casualties [3,4,5]. Therefore, to reduce the economic loss and casualties of the soft-first-floor structures damaged by earthquakes, it is important to decide on reasonable reinforcement schemes for soft-first-floor structures.
A number of methods have been proposed to reinforce the soft-first-floor structure, such as steel brace systems, thick hybrid walls, and carbon fiber-reinforced plastic (CFRP) sheets. Even though these methods can effectively improve seismic performance, they are mainly dedicated to specific structural components. The purpose of seismic reinforcement is to improve the overall structural performance instead of the specific component properties. Recent studies have shown that the rocking structure as a new seismic structure system plays an excellent seismic energy dissipation role in many structures [6,7,8,9]. For instance, Kaltakci [10] proposed the additional RC shear walls to retrofit the existing RC structures using the coupling beams, leaving certain space for connection. The results indicated the considerable contribution of the external walls to the overall seismic indices, such as carrying capacity, lateral rigidity, and energy dissipation. Jung [11] proposed the external steel-reinforced concrete frame to retrofit the medium-to-low-rise RC buildings and found that the increasing lateral ultimate strength of the reinforced structure is as well as the reduced response displacements. Although the superiority of the rocking structure has been verified by numerous researchers, the primary focus is on the seismic performance of the reinforced structure [12,13]. Comparatively, research on the design method and assessment of reinforcement schemes for the rocking frame is relatively rare.
The evaluation methods of reinforcement schemes can be broadly classified into two main categories, namely performance-based and resilience-based. For performance-based evaluation of reinforcement schemes, the displacement and damage of the structure are usually used to evaluate the rationality of different reinforcement methods. However, the performance-based evaluation of reinforcement schemes presents two challenges. Firstly, it is difficult to accurately and comprehensively evaluate the effectiveness of reinforcement with a single indicator. Secondly, this method ignores the effects of the economic losses and casualties caused by the damage to the structure. On the other hand, the resilience-based evaluation of reinforcement schemes can be used to overcome the above-mentioned issues. The seismic resilience of systems at different scales has been intensively explored since the concept of seismic resilience was first introduced by Bruneau et al. [14]. In 2012, the Federal Emergency Management Agency issued FEMA-P58 [15], which uses repair cost, repair time, and personnel as evaluation indicators of the seismic resilience of buildings. Based on the specification of [9], Moretti et al. [16] made a seismic resilience comparison between the conventional fixed foundation and the isolated foundation for two types of reinforced concrete structures. Du et al. [17] compared the seismic resilience of RC frame structure, buckling restrained brace-frame structure, and Base-isolated frame structure and indicated that the last is the best. With the increasing studies and application of seismic resilience, China’s evaluation standard [18] for the seismic resilience of buildings was issued in 2020. Compared with FEMA-P58, the code [9] is more suitable for buildings designed according to Chinese codes [18]. Based on the code [18], Shi et al. [19] analyzed the seismic resilience of high-rise steel structures strengthened by different numbers of dampers and proved that the structure strengthened by more dampers has greater seismic resilience and a lower reinforcement benefit ratio.
As previously mentioned, the seismic resilience evaluation method has been successfully applied to the study of some shock absorption and reinforcement methods. However, to the authors’ best knowledge, there are few investigations on seismic resilience for the soft-first-floor structure strengthened by the rocking frame reinforcement method, which is very important for the safety of the soft-first-floor structures.
This paper investigated the rocking frame reinforcement design method for soft-first-floor structures, whereby a method for assessing reinforcement schemes is presented on the basis of seismic resilience. This paper is organized as follows: Section 2 introduces the deformation control mechanism and reinforcement design method of the rocking frame. Section 3 describes an evaluation method for reinforcement schemes based on seismic resilience. In Section 4, a soft-first-floor structure is validated with the evaluation method of reinforcement schemes, and a comparison is made between the method proposed in this paper and the conventional method. Concluding remarks are presented in Section 5.
2. Rocking Frame Reinforcement
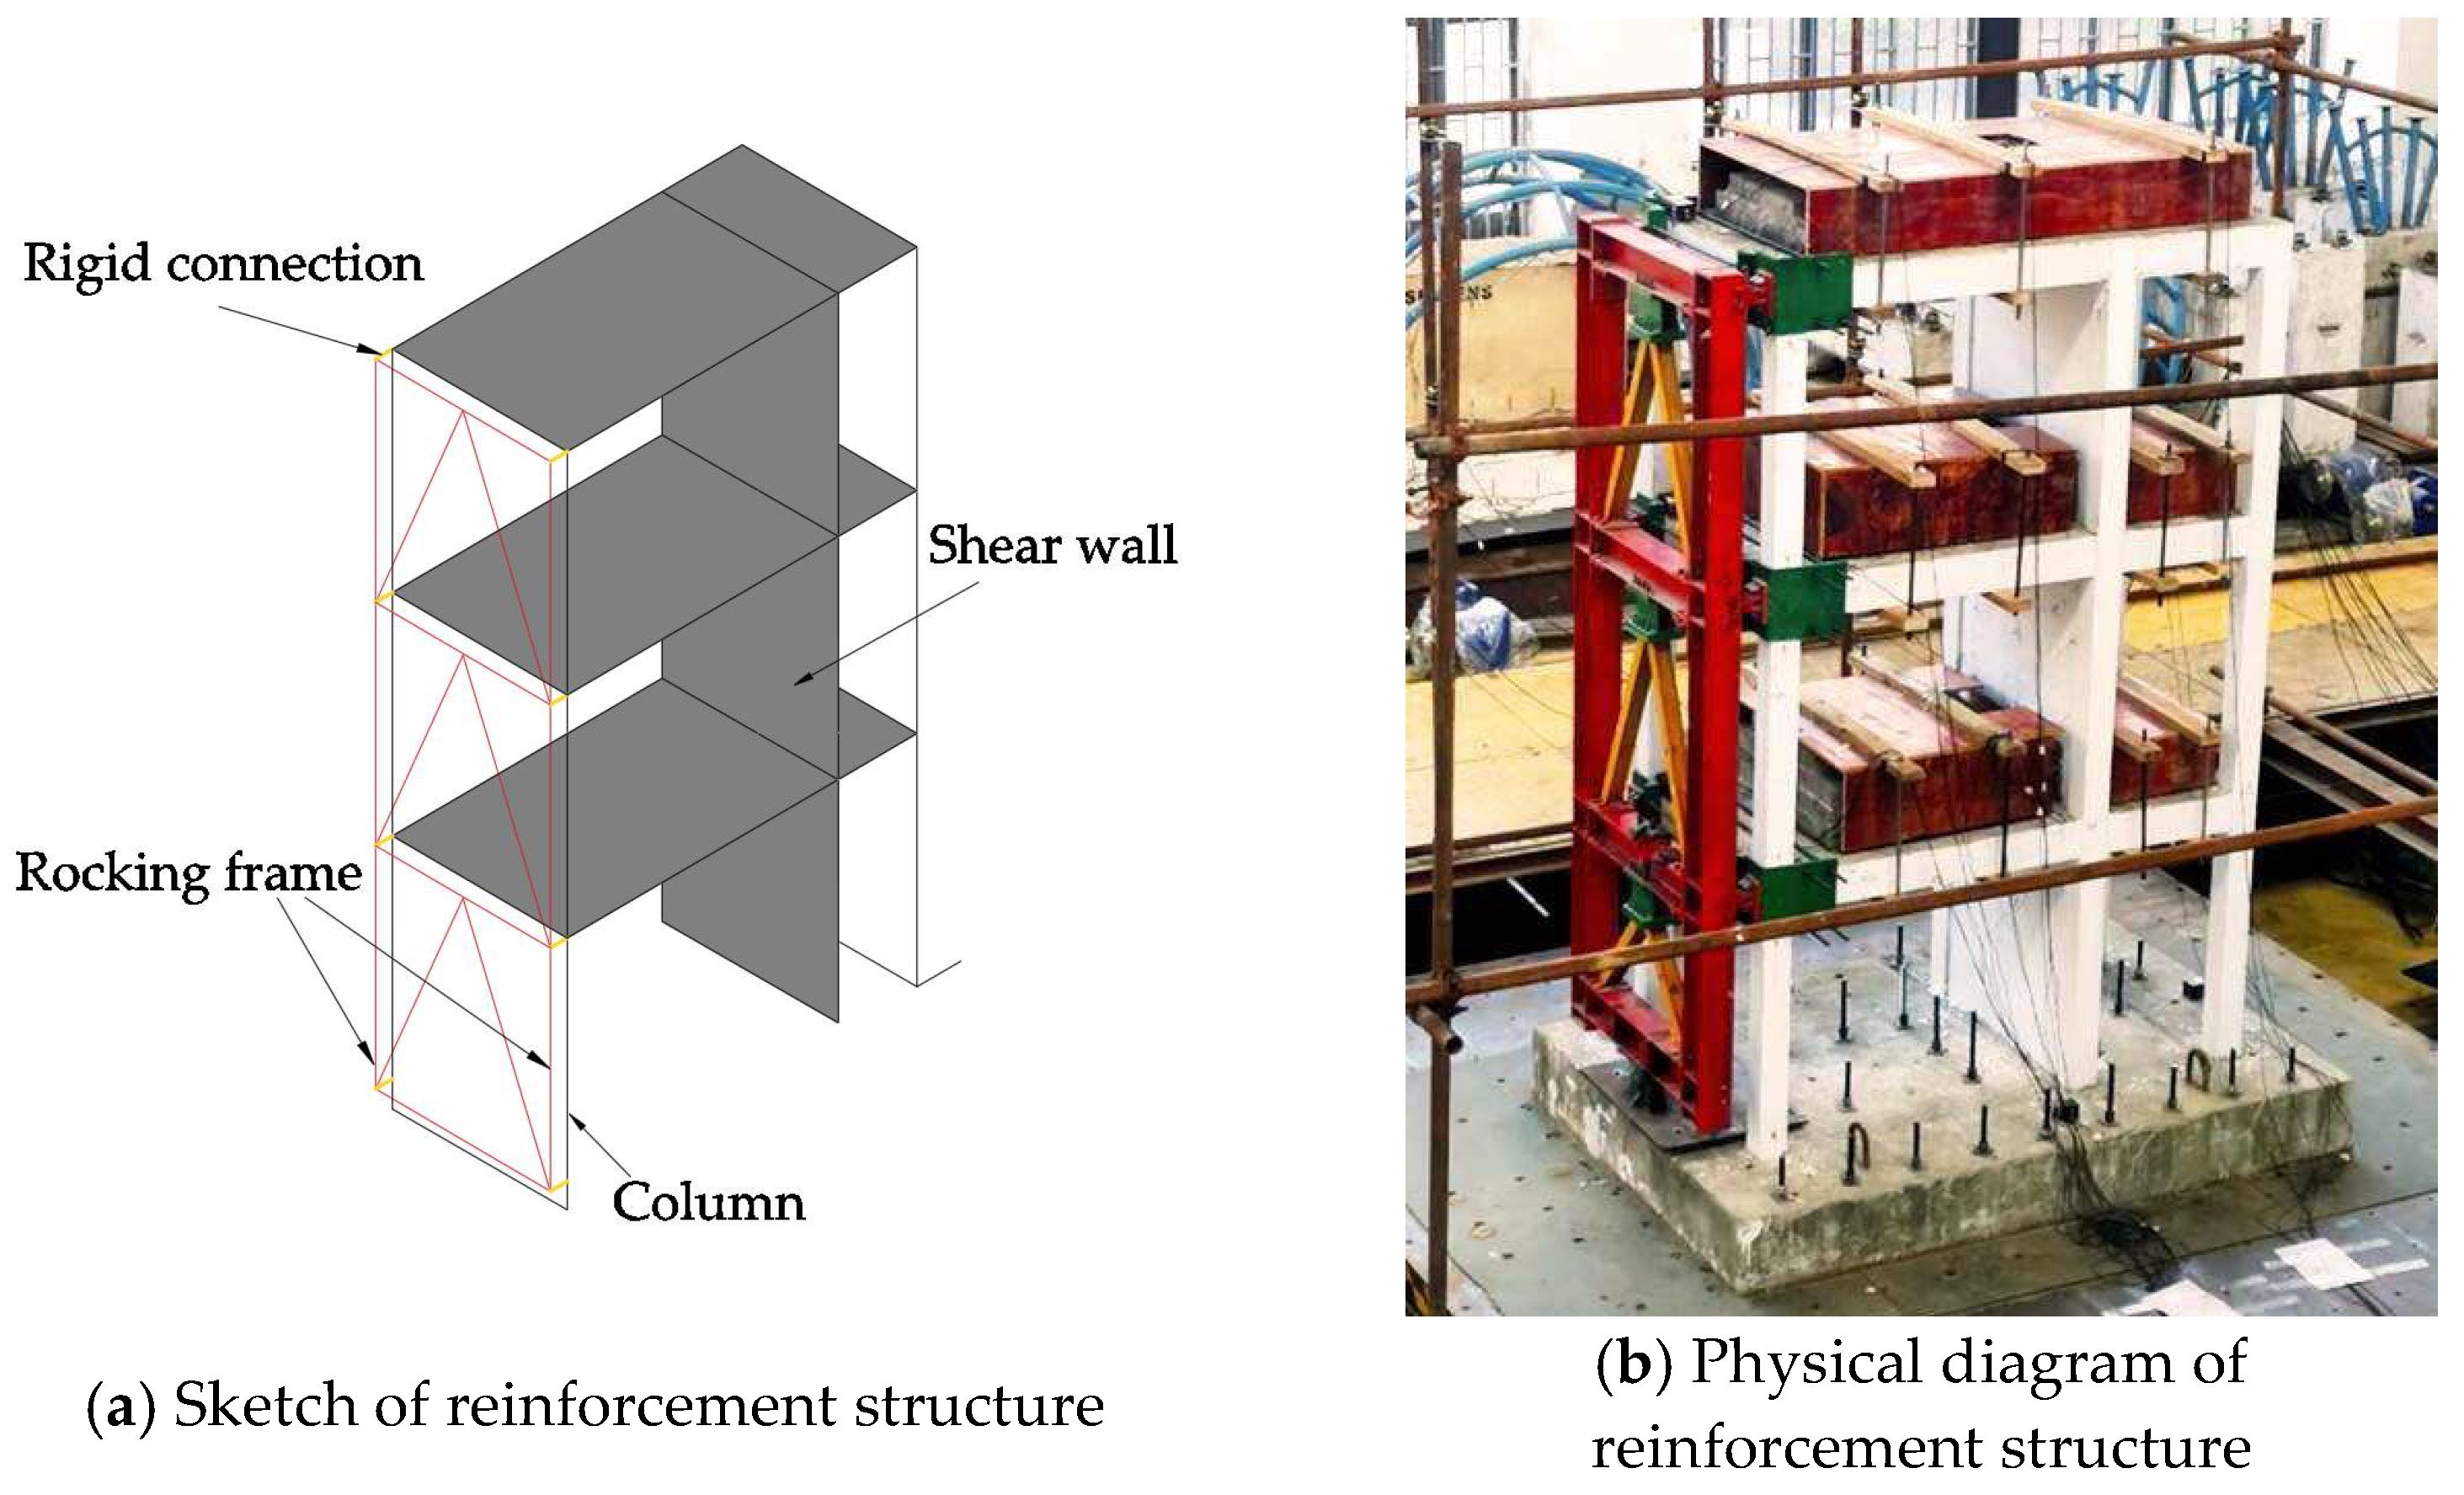
Figure 1 shows the rocking frame reinforcement structure. This structure consists of rigid connections, a rocking frame, and the original structure, respectively. Rigid connections ensure that forces from the original structure can be transmitted to the rocking frame, and the rocking frame can create a reaction force to reduce deformation. Generally speaking, this reinforcement method presents two distinct advantages. First, it does not interfere with the daily lives of the residents. All the construction work is finished externally instead of indoors, so human activities will not be interrupted. Second, it is a precast-assembly technique. All the components are produced ahead of time and assembled on site with very few wet operations, which significantly improves construction quality [20].

Figure 1.
Rocking frame reinforcement method.
2.1. Control Mechanism of Rocking Frame Deformation
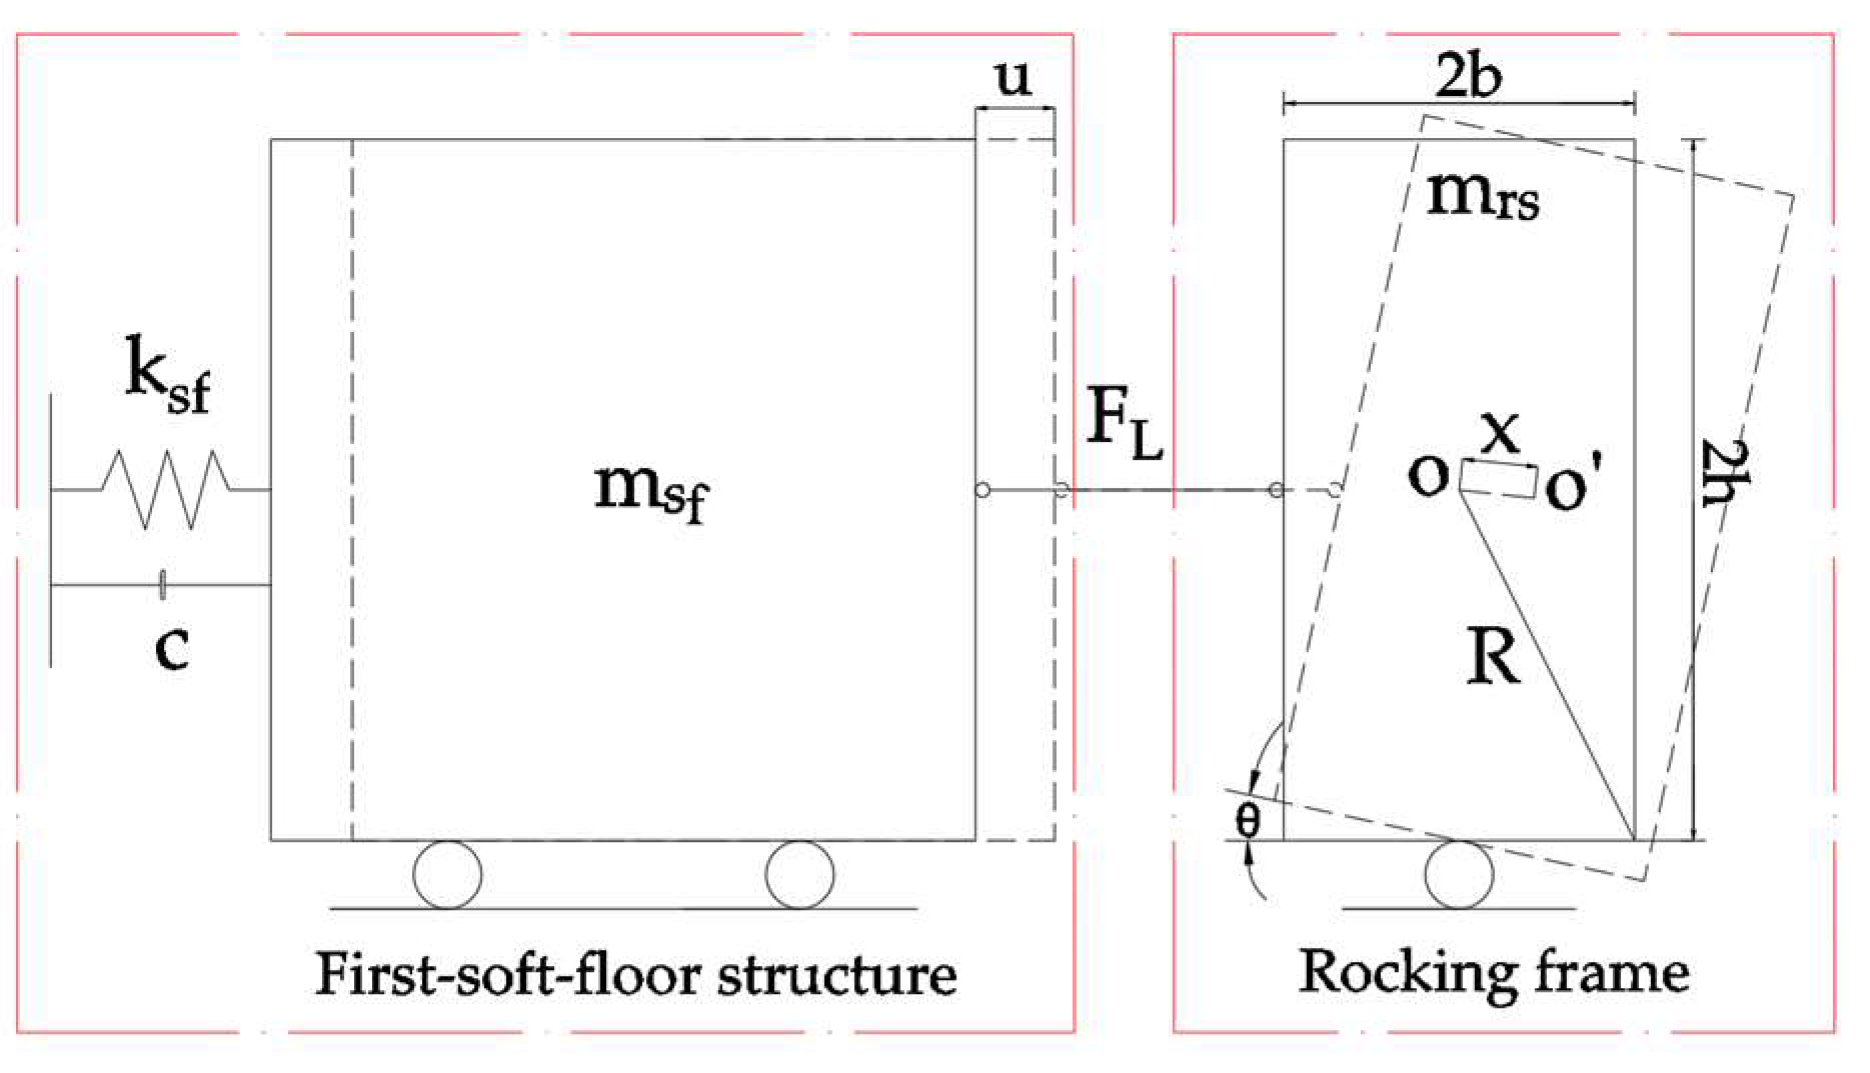
A layer of the structure is taken as an isolator for analysis [21]. The rocking frame provides control of the deformation of the structure by rigid connection when the original structure is subjected to horizontal loads, as shown in Figure 2. The dynamic equation is expressed as:
where msf, and represent the mass, damping coefficient, and system stiffness of the original structure, respectively; u, , represent the displacement, the velocity, and the acceleration of the original structure relative to the ground, respectively; FL represents the reaction force of the rocking frame.
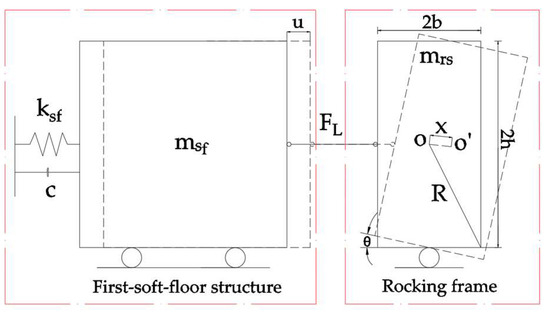
Figure 2.
Brief diagram of rocking frame reinforcement system.
Figure 3 shows the force diagram of the rocking frame. The equilibrium equations are obtained according to D’Alembert’s principle:
where represents the rotational torque; represents the mass of the rocking frame; and g represent the ground acceleration and gravitational acceleration, respectively; x represents the displacement of the center of mass relative to the ground.
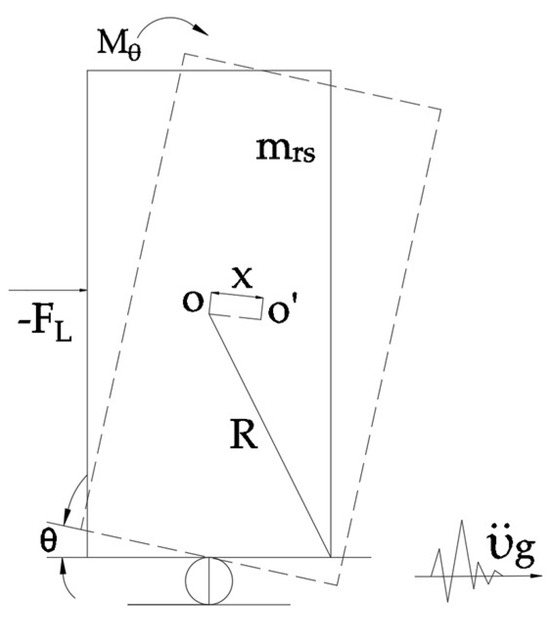
Figure 3.
The force diagram of the rocking frame.
Combining the parallel axis theorem, the geometric relationship between the rotation angle of the rocking frame and the displacement relative to the ground can solve the unknown quantity in Equation (2). FL is expressed as:
where and represent the rotation angle and angular acceleration of the rocking frame, respectively; h represents the height of the rocking frame.
According to Equation (3), when the mass of the rocking frame is fixed, the reaction force of the rocking frame mainly depends on the rotation angle. Thus, the mechanism of deformation control by the rocking frame is the horizontal reaction force generated by the rocking frame that resists the inter-storey shear force from the original structure when the structure experiences inter-storey deformation, which achieves the purpose of controlling damage and deformation.
2.2. Rocking Frame Design Method
The lateral stiffness of the rocking frame is related to its horizontal load and deformation values. Since the deformation of the rocking frame is essentially consistent with the deformation of the original structure, the stiffness requirements for the rocking frame can be obtained by using the acceleration response spectrum of the structure to calculate the horizontal seismic action effect after setting the target value of the deformation for the original structure. The detailed procedures are as follows:
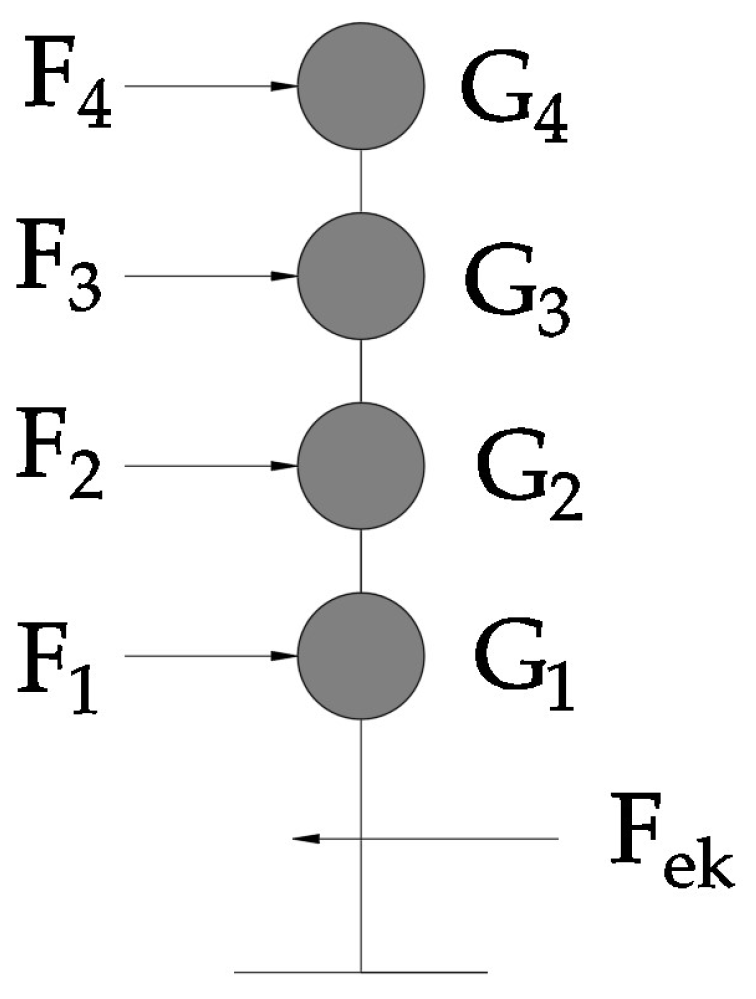
Firstly, the horizontal seismic actions at each floor of the structure are calculated by Equations (4) and (5), as shown in Figure 4.
where represent the total shear at the bottom of the structure, the seismic impact coefficient, and the total gravity load of the original structure, respectively, and represent the weight and height of the lth floor of the structure; subscript l is the lth floor of the structure.
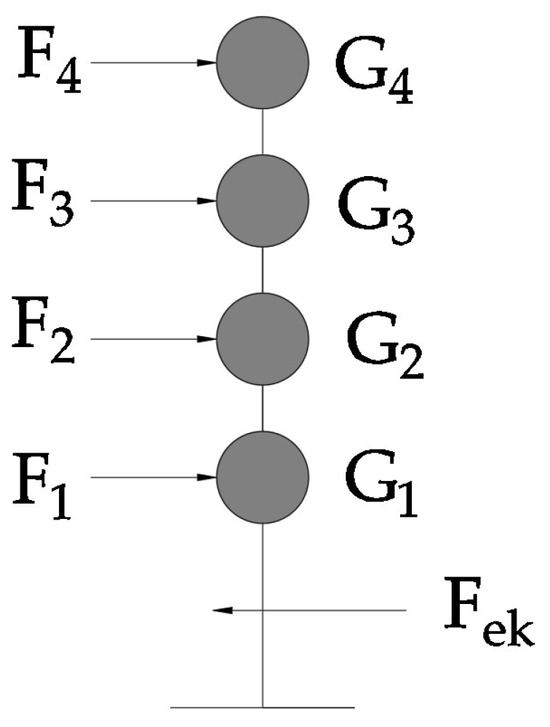
Figure 4.
Structural horizontal seismic force diagram.
The lateral stiffness of the floors and the original structure are calculated by Equations (6) and (7), respectively.
where krs and ksf represent the lateral stiffness of the rocking frame and the original structure, respectively; Ers and Irs represent the elastic modulus of rocking frame steel and the inertia moment of the column in the rocking frame, respectively; Ars represents the section area of the rocking frame diagonal bars; Wrs and Lrs represent the span and length of the rocking frame, respectively. Es and G represent the elastic modulus and shear modulus of the original structure, respectively. As and Is represent the section area of the shear wall and the inertia moment of the column in the origin structure, respectively; ns represents the number of frame columns per floor.
The inter-story displacement of the structure can be expressed as:
where ut denotes the inter-story displacement of the structure.
Secondly, the NDCF is used to evaluate the effect of vertical deformation on the structure, which is denoted as:
where H represents the total height of the structure, represents the maximum drift ratio of the rocking frame. For areas with high seismic fortification intensity, the value of should be close to 1 [22], which generally defaults to a constant. Thus, after determining according to the structural design requirements, the can be calculated.
Finally, the layer lateral stiffness of the rocking frame-reinforced structure is calculated by Equations (4)–(9).
where is the layer lateral stiffness of the rocking frame reinforced structure.
3. Evaluation Methodology of Reinforcement Scheme
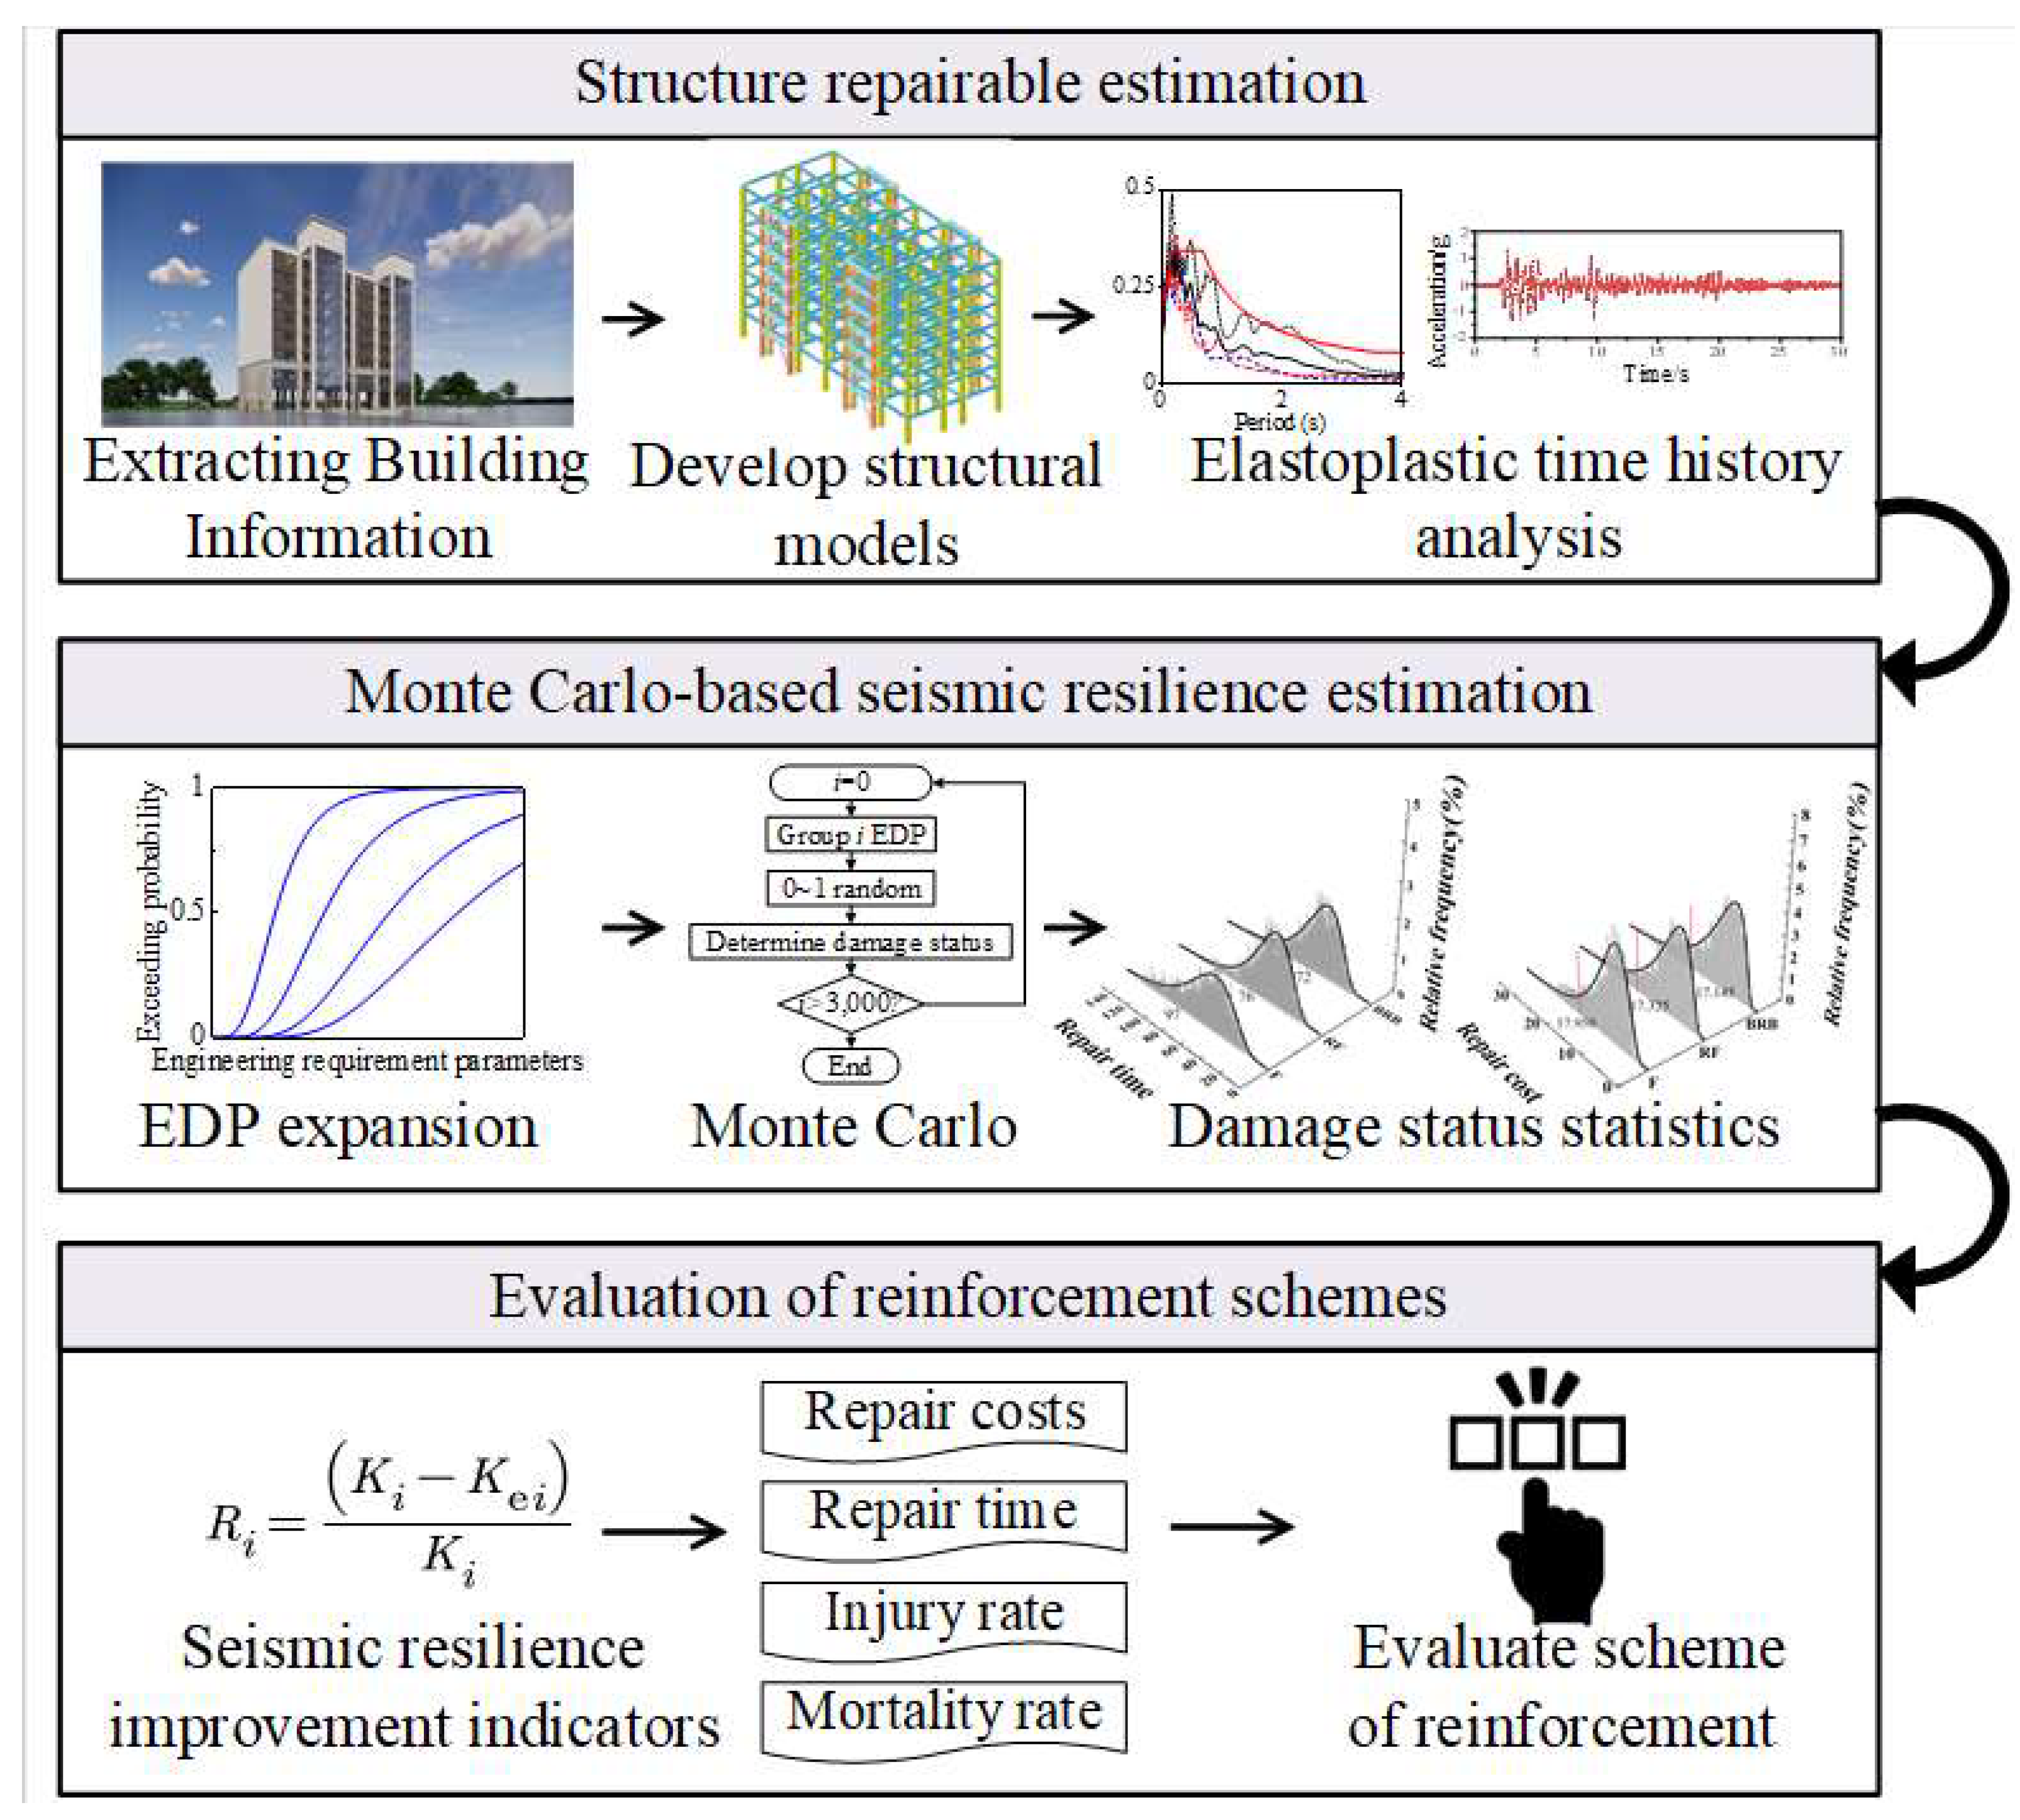
The seismic resilience of a building refers to the ability of the building to recover its initial functions in post-earthquake recovery and reconstruction. There are three indicators for the Chinese design code ‘Evaluation of Seismic Resilience of Buildings’ to evaluate the seismic resilience, namely repair cost, repair time, and casualty rate [23,24]. Based on the code, this paper presents an evaluation methodology for a reinforcement scheme. The framework can be summarized in Figure 5. The evaluation method consists of three parts: judgment of structural repairability, calculation of resilience index, and evaluation of reinforcement scheme. More details are described as follows:
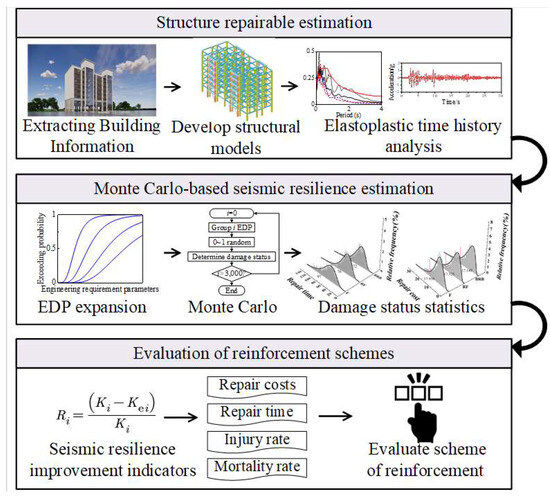
Figure 5.
Flow chart of evaluation method based on seismic resilience.
3.1. Judgment of Structural Repairability
Firstly, the structure is modeled, and more than 11 earthquake ground motions are selected for dynamic nonlinear time history analysis. Secondly, the maximum residual story drift ratio of the structure under the action of each ground motion is counted. Finally, it is determined whether the average value of the maximum residual story drift ratio of the structure suffering the earthquake is within the limit of 1/200. If it is yes, the structure is repairable and can be analyzed for seismic resilience; if it is no, the structure is not repairable.
3.2. Calculation of Resilience Index
Firstly, collate the deformation data of members into an engineering demand parameters (EDP) matrix. Secondly, in order to reduce the uncertainty in the analysis, the deformation of each component is assumed to obey the lognormal distribution, and the EDP matrix is thus expanded using the Monte Carlo method. To ensure the EDP matrix has the same statistical characteristics after the expansion, the relative error of the mean and the relative error of the covariance are calculated by Equations (12) and (13) respectively [25].
where CA represents the relative error of the mean of the EDP matrix before and after the expansion, CC represents the relative error of the covariance of the EDP matrix before and after the expansion, Abi and Aai represent the mean of the EDP matrix before and after the expansion, respectively, and Cbi and Cai represent the covariance of the EDP matrix before and after the expansion of the structure.
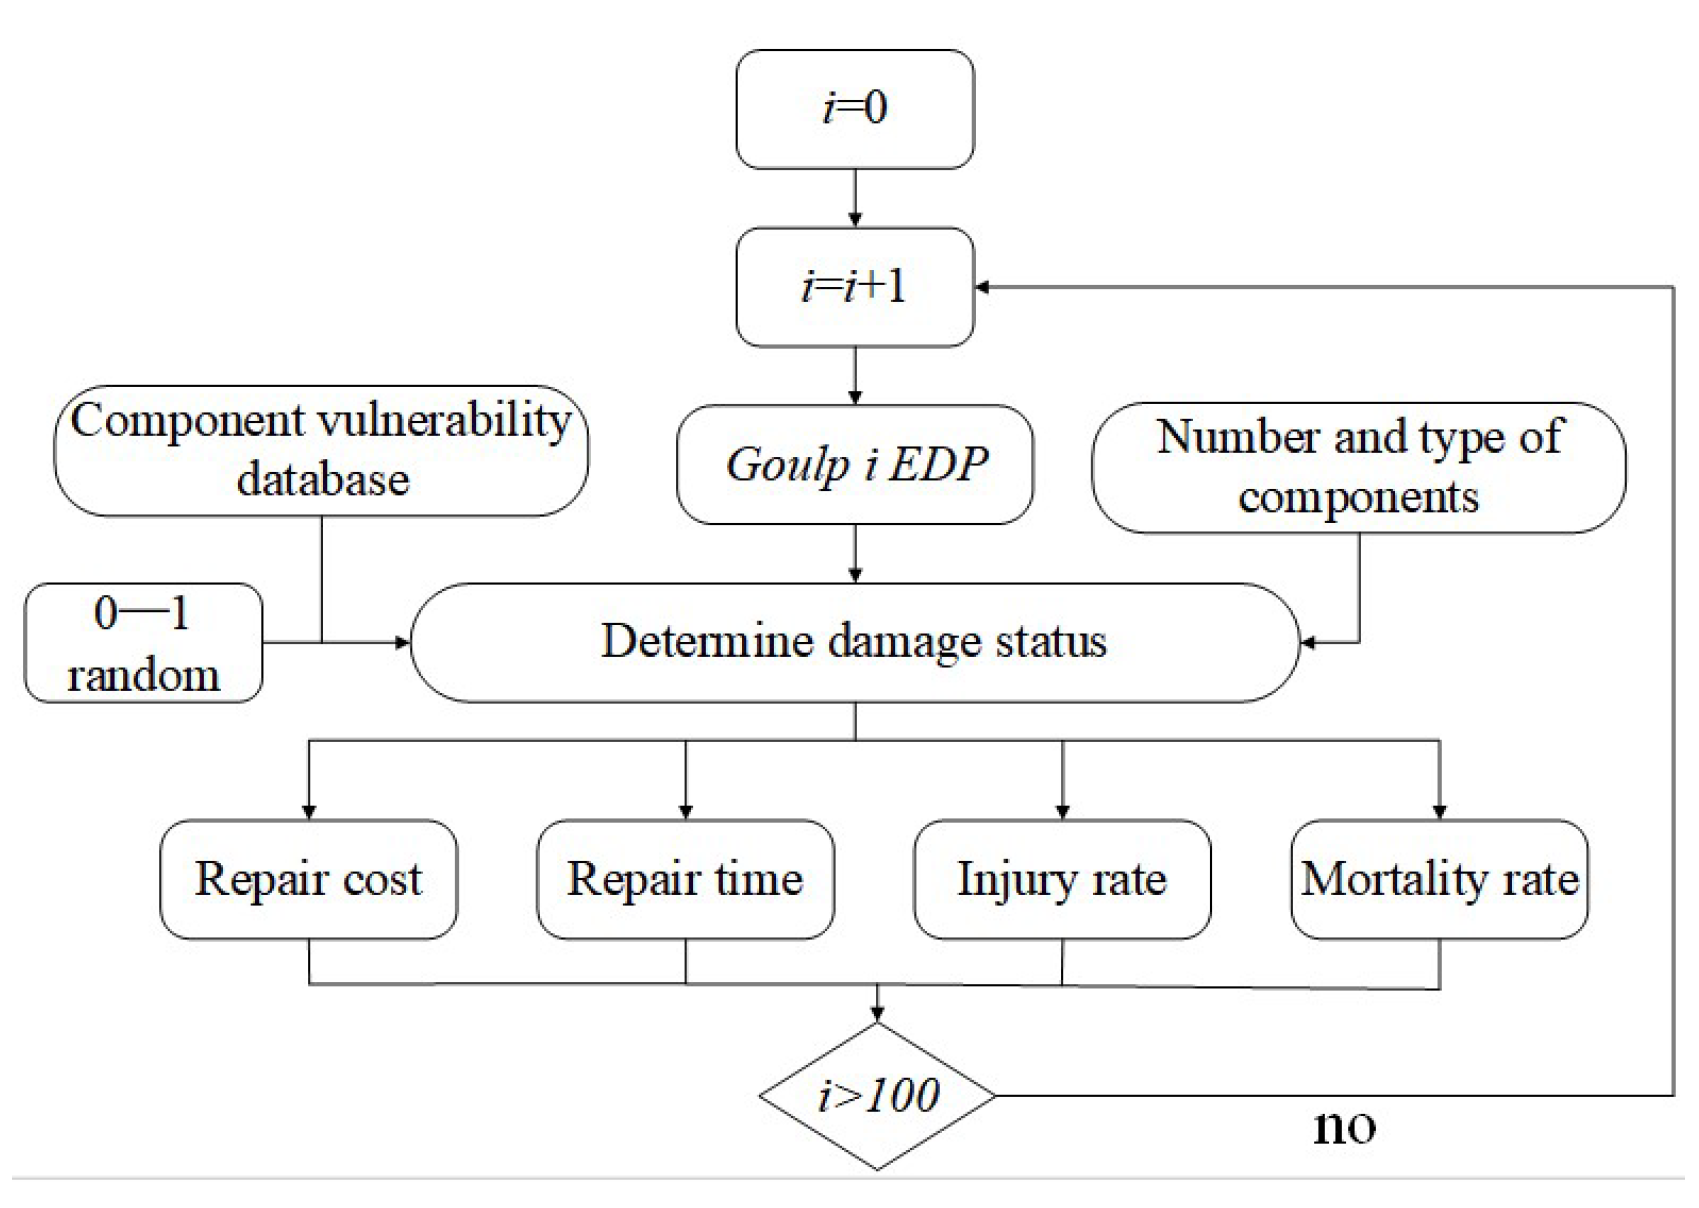
Figure 6 shows the Monte Carlo simulation process. Monte Carlo simulations are carried out with more than 1000 simulations. As soon as the number of simulations is determined, a group of EDPs can be selected in turn. The probability of components with varying degrees of damage is calculated based on the vulnerability curve and EDP. According to the judgment results of component damage degree, the calculation parameters of the resilience index can be obtained from the design code, such as the loss coefficient and repair coefficient. In the end, the seismic resilience index can be calculated.
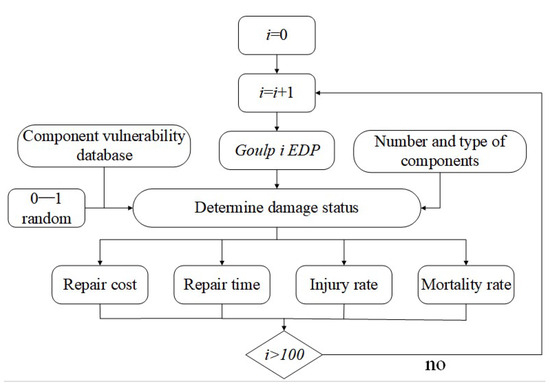
Figure 6.
Monte Carlo simulation process.
With the increase in height of the structure, the repair of the structure becomes more difficult. With consideration of this factor, the structural repair cost and repair time are calculated according to Equations (14) and (15). The repair cost of the structure is the sum of the repair costs of the damaged stories. Assuming that each story is repaired at the same time, the repair time of the structure should be the maximum repair time for each story. The casualty rate of the structure is the sum of the stories. The casualty rate of the story is calculated according to the damage degree of the floor and the indoor personnel density, as shown in Equations (16) and (17).
where n represents the total of structural stories, l represents the sequential number of structural stories, l = 1, 2, …, n, R(l) represents the repair cost of each story, λC(l) represents the influence coefficient of height of each story, which can be obtained from the design code, and KC represents the repair cost of the structure.
where Tl is the repair time of each story, and KT represents the structural repair time.
where, rhr represents the nominal injury rate, and rdr represents the nominal mortality rate, rhr and rdr can be obtained from the code, ζm represents the indoor personnel density, Am represents the area of stories, KIN represents the injury rate of structure, and KM represents the mortality of structure.
3.3. Evaluation of Reinforcement Scheme
As mentioned above, a direct comparison of the seismic resilience indexes cannot reflect the issue of how much the reinforcement scheme can improve. Thus, this paper proposes the seismic resilience enhancement index, as in Equation (18).
where, Ri represents the seismic resilience enhancement index; Ki and Kei are the seismic resilience indexes of unreinforced and reinforced structures, respectively; the subscript i could be C, T, IN, or M, which represents repair cost, repair time, injury rate, or mortality, respectively.
The larger the R value, the greater the improvement in seismic resilience. The reasonable reinforcement method is selected according to the seismic resilience index and the seismic resilience enhancement index. First of all, the seismic resilience index is compared. Since priority is placed on the safety of people’s lives, the casualty rate should be given priority. If the casualty rate is the same or with little difference, the disaster relief fund is sufficient, and the repair time will be compared. If the repair time is the same or there is a subtle difference, then the repair cost will be compared. Through comparison, the reinforcement scheme can be determined. After that, the selected reinforcement scheme is adjusted according to the resilience enhancement index.
4. Engineering Application
4.1. Introduction to Practical Engineering and Reinforcement Schemes
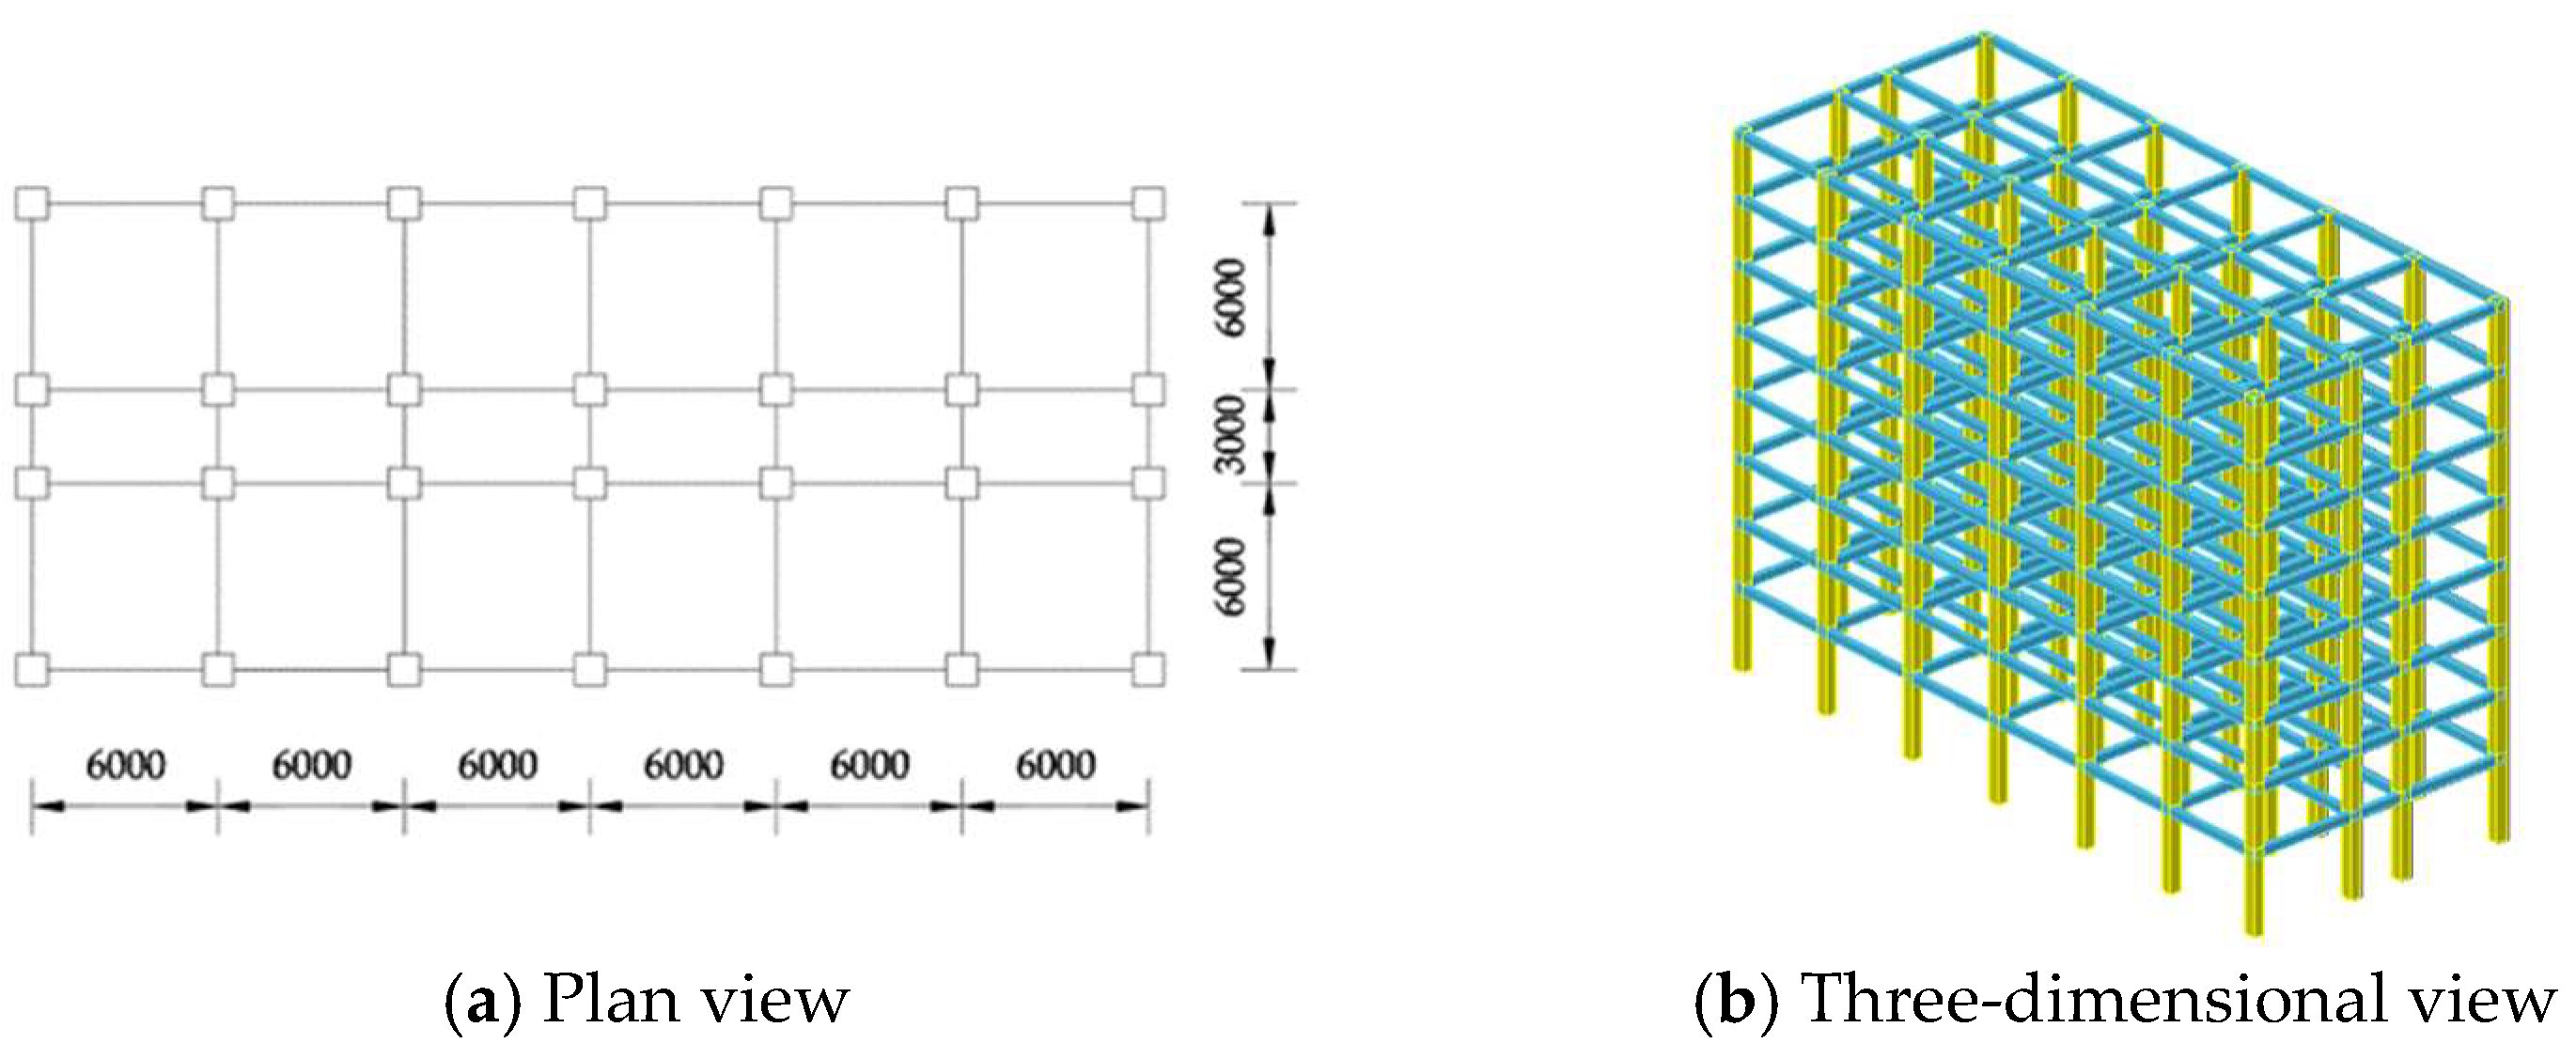
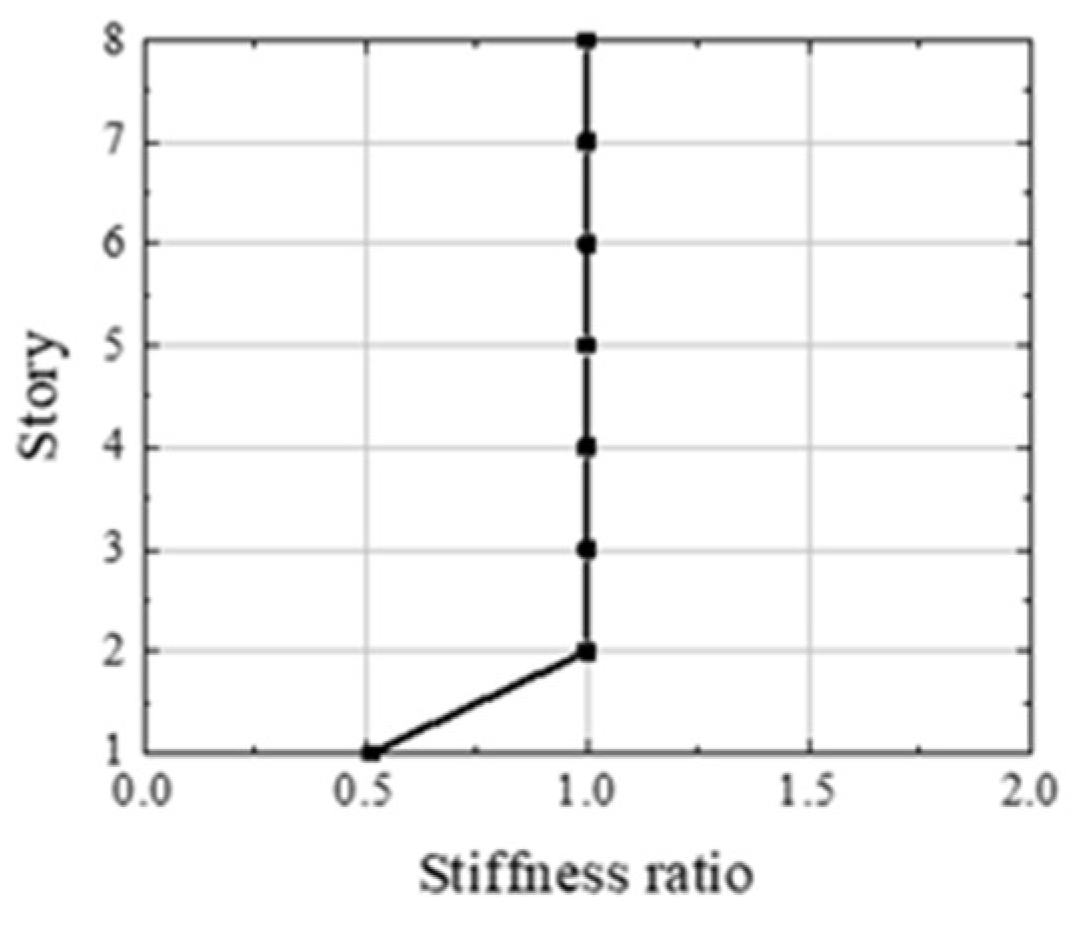
An 8-story RC frame structure was designed by YJK-3.1.0 Software [26] according to the Chinese code [27]. The first floor is 4.5 m high, and the rest of the floors are 3.6 m high. Figure 7 shows the plan view of the soft-first-floor structure [28,29]. The seismic intensity of the building is 7 degrees (0.1 g), the site category is a Class II site, and the design seismic grouping is Group III. Figure 8 shows the stiffness ratio of each floor. To be clear, when the lateral stiffness ratio of the first floor is less than 70% of the adjacent upper floor, the structure is considered a soft-first-floor structure. The lateral stiffness ratio of the first floor to the second is 0.512, which is less than 0.7. For this kind of structure in an earthquake, the first floor often experiences serious local deformation, leading to a concentration of damage. This can easily cause damage to the first floor or even collapse, resulting in a significant loss of life and property.

Figure 7.
Structural arrangement diagram.

Figure 8.
Lateral stiffness ratio of structure.
The lateral stiffness of the rocking frame was calculated by Equations (10) and (11), whereby its dimensions were designed. The schematic diagram of the rocking frame is shown in Figure 1. The material of the rocking frame was Q395 steel, the specification and model of steel for columns and beams were HW400 × 400 × 13 × 21, and the specification and model of steel for braces were 40C. Figure 9 shows the arrangement of the rocking frame.
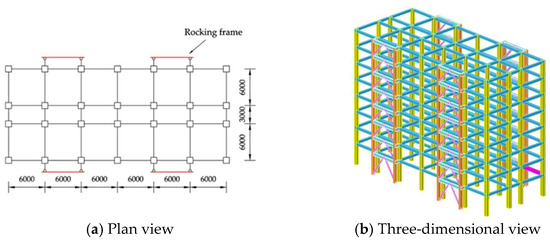
Figure 9.
Reinforced structure arrangement diagram.
4.2. Model Buildup and Verification
The traditional simulation method based on Abaqus mainly uses solid units for simulation. Although the simulation degree of solid units is high, its efficiency is affected by hardware. Comparatively, the model based on OpenSees can improve computation efficiency while ensuring precision. Thus, the simulations and modeling presented in this paper have been carried out using OpenSees.
The finite element models of three structures were developed with OpenSees, including the soft-first-floor frame structure (hereinafter referred to as “F”), the rocking frame reinforced structure (hereinafter referred to as "RF"), and the buckling-restrained brace reinforced structure (hereinafter referred to as “BRB”) [30,31,32]. The rocking frame was connected to the original structure using a rigid link. The rocking frame and the original structure were connected to the ground through hinge joints and rigid connections, respectively [33,34]. The energy-dissipating brace was simulated by using a truss element [35,36]. Concrete was modeled using the Concrete02 material model, and the constitutive parameters were calculated by the modified Kent-Scott-Park model [37]. The calculated concrete principal parameters are shown in Table 1. Steel reinforcement was modeled using the Steel02 material model, and the steel constitutive parameters were obtained based on the Giuffre-Menegotto-Pinto model, as shown in Table 2. The beams and columns of the frame structure adopt the force-based nonlinear beam column element. The steel beams and columns of the rocking frame all adopt a force-based nonlinear beam column element.

Table 1.
Concrete02 material model.
Table 2.
Steel02 material model.
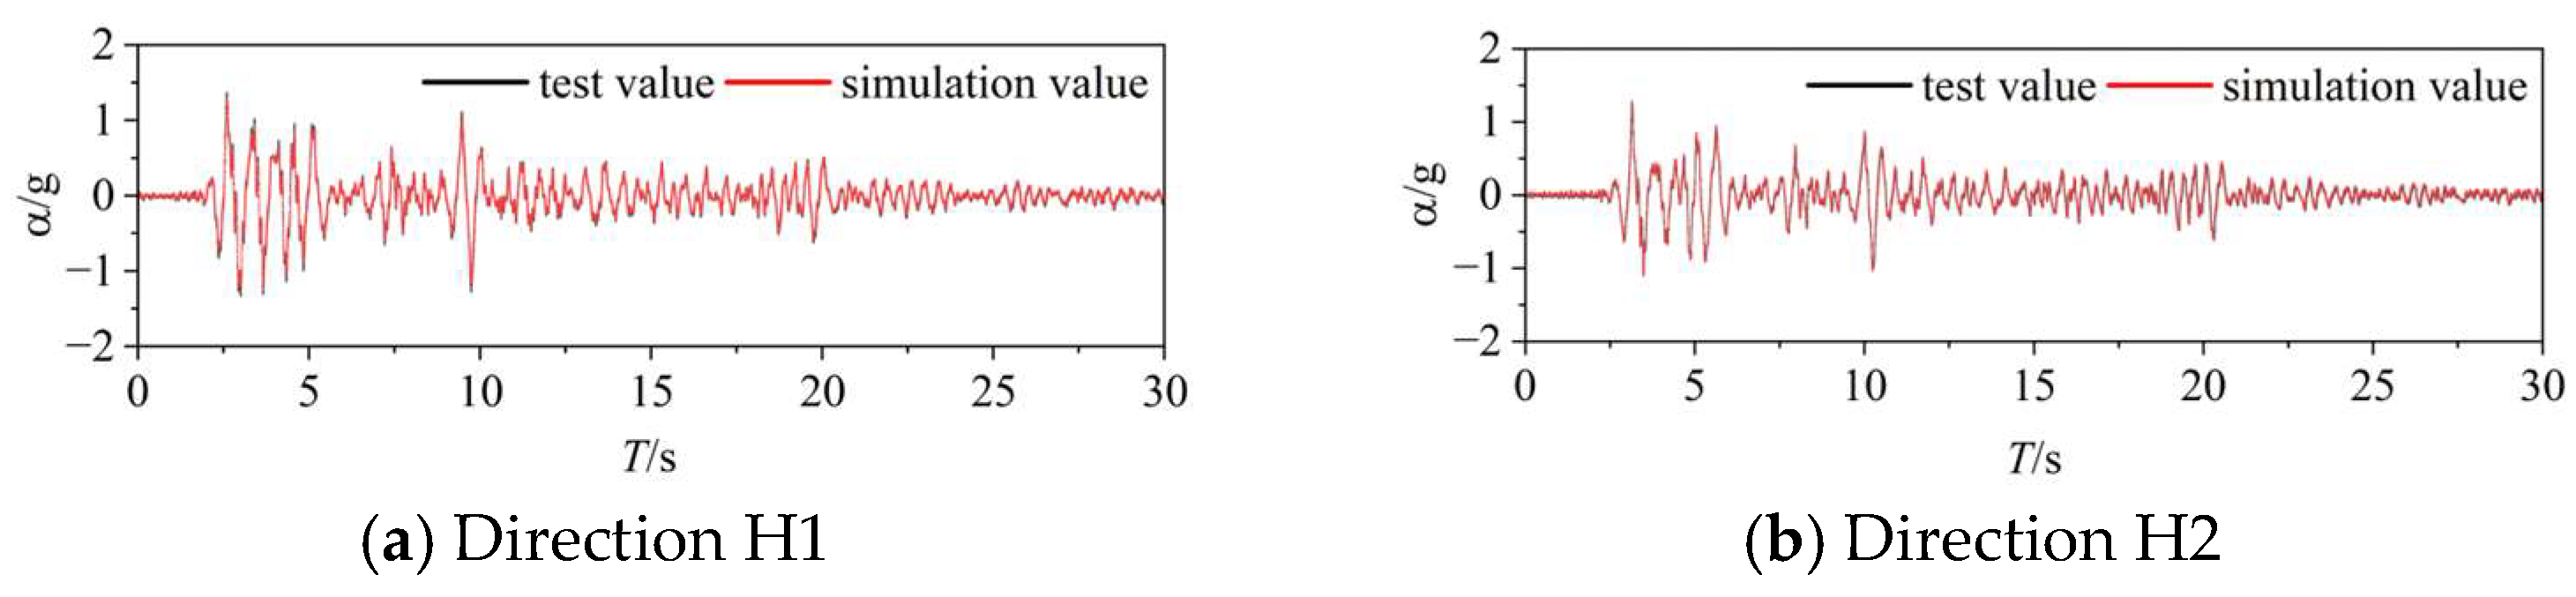
Previous shaking table tests [19] were modeled and analyzed using the above modeling approach. Figure 10 shows the comparison chart for the acceleration response spectrum. It can be seen that the numerical simulation results are roughly in agreement with the experimental results. This implies that the modeling method can be used for subsequent numerical analysis.

Figure 10.
Comparison chart of acceleration response spectrum.
Table 3 shows the first three periods of the structures. It can be seen that the periods of the reinforced structure are shorter than those of the original structure. This implies that finite element models can simulate the improvement of structural stiffness by the reinforcement method.
Table 3.
The first three periods of the structures.
4.3. Selection of Seismic Waves
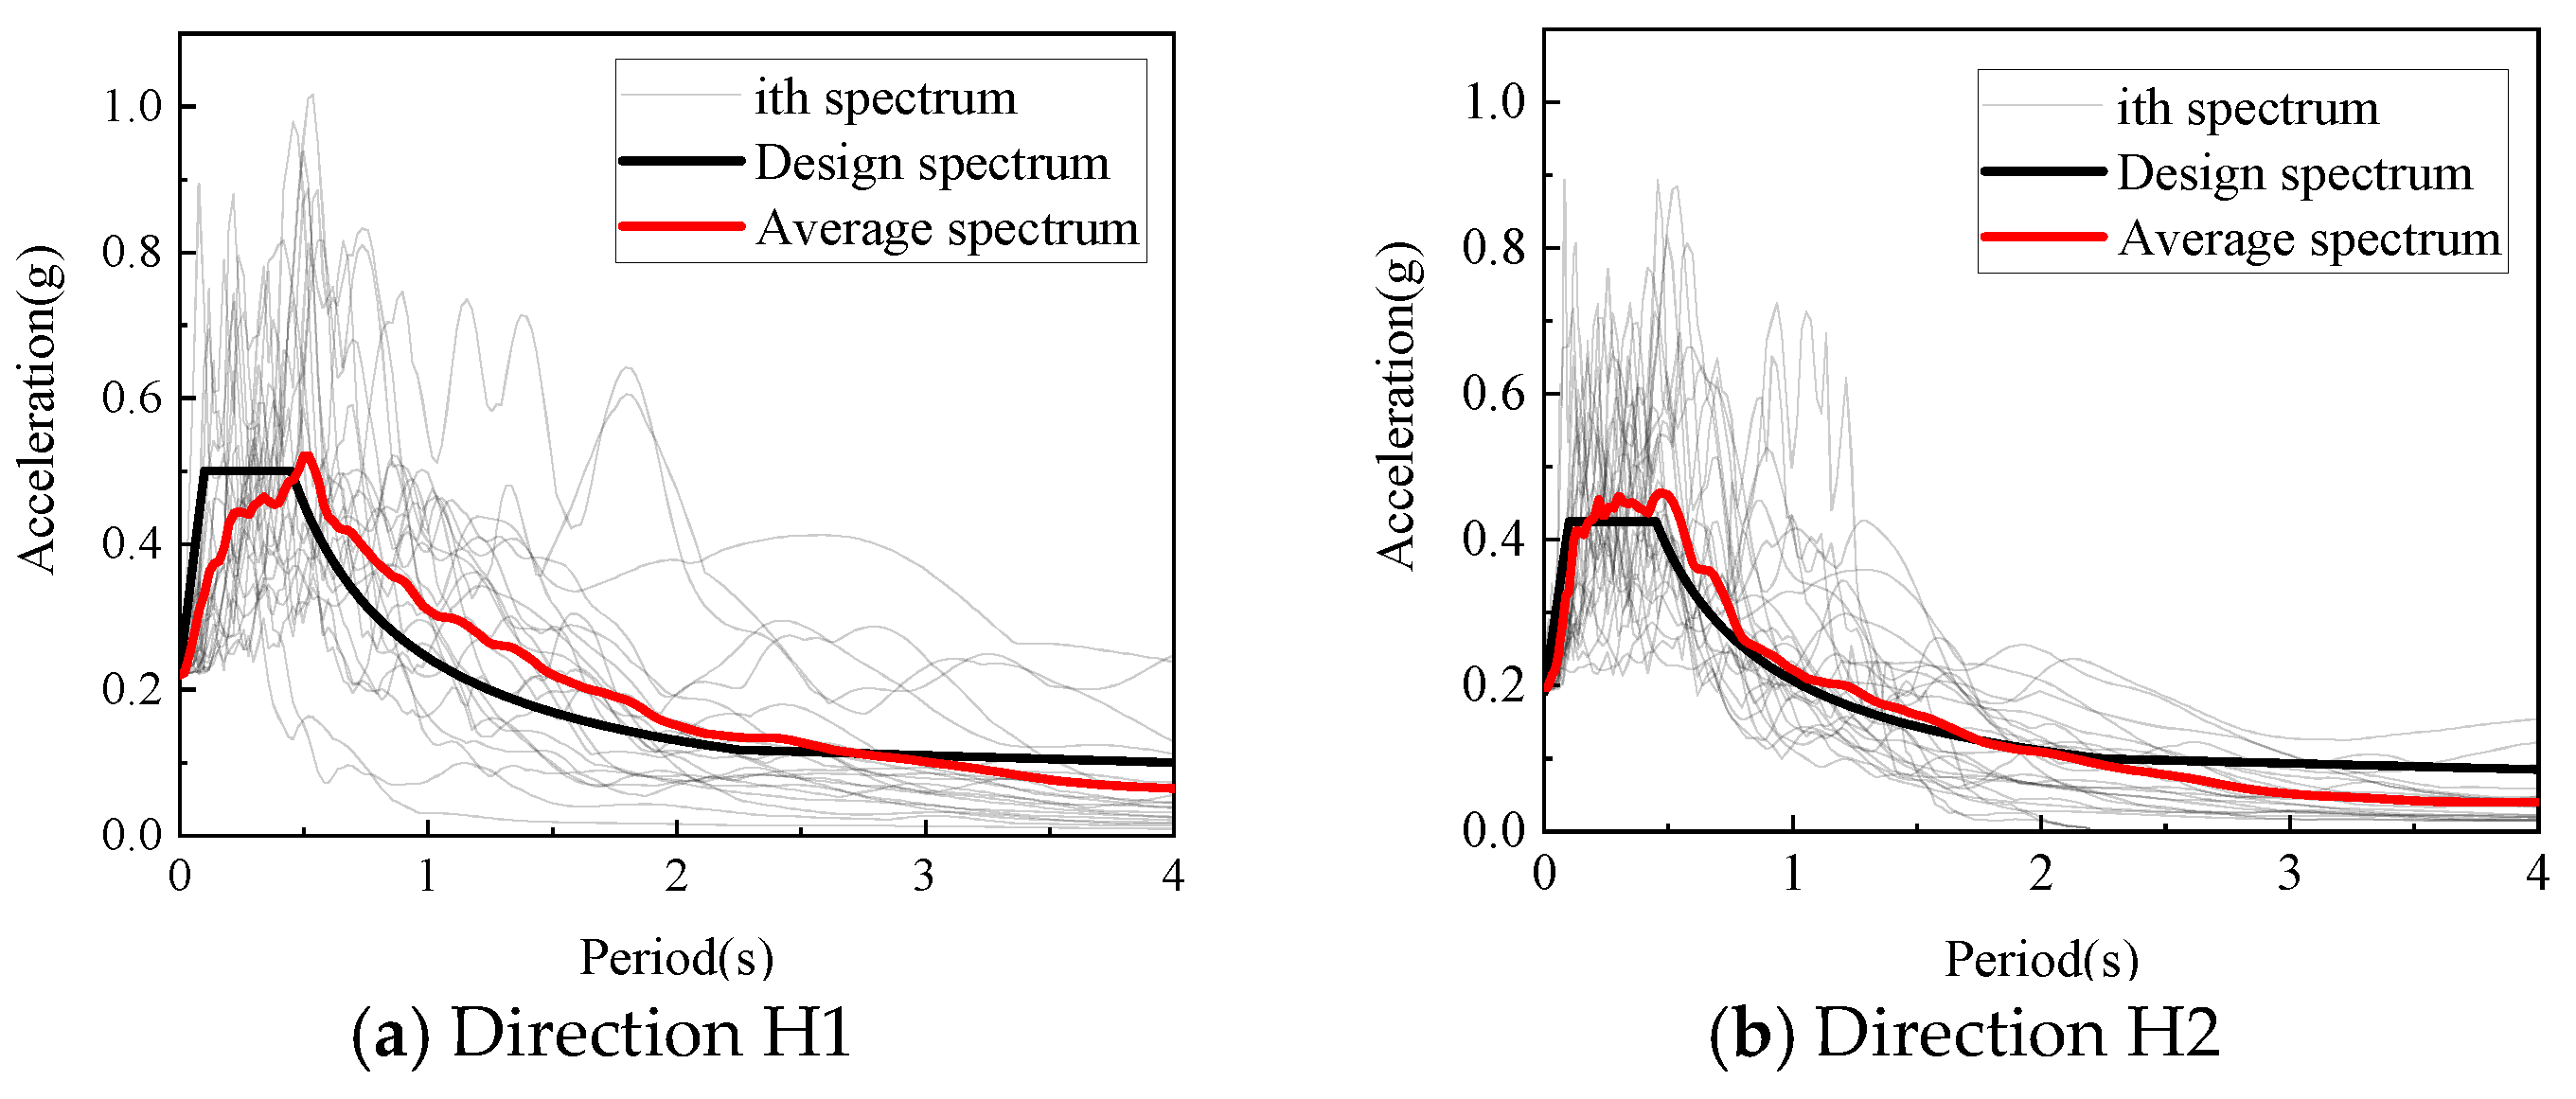
The same earthquake waves were used as the input load for the structures. The seismic grouping of the structure in this paper is group III, which is equivalent to the far-field seismic zone. Thus, the 22 far-field seismic waves recommended in ATC-63 were selected for the nonlinear time history analysis. After seismic waves were input into the structure, the nonlinear time history analysis was conducted under the action of bidirectional ground motion. The acceleration response spectra are shown in Figure 11. According to the Chinese code [27], the peak ground acceleration of seismic waves was adjusted to the rarely occurring earthquake intensity (0.22 g) and the very rarely occurring earthquake intensity (0.31 g). The ratio of peak ground acceleration between directions H1 and H2 is 1:0.85.
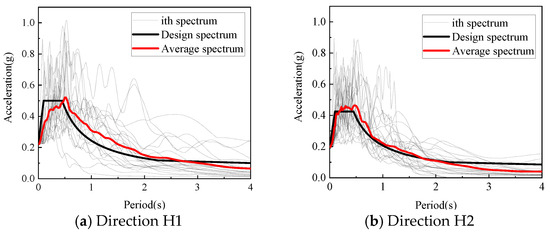
Figure 11.
Acceleration response spectra. Note: H1 is the direction along the long side of the structure. H2 is the direction along the short side of the structure.
4.4. Evaluation of Reinforcement Scheme
4.4.1. Structural Repairability
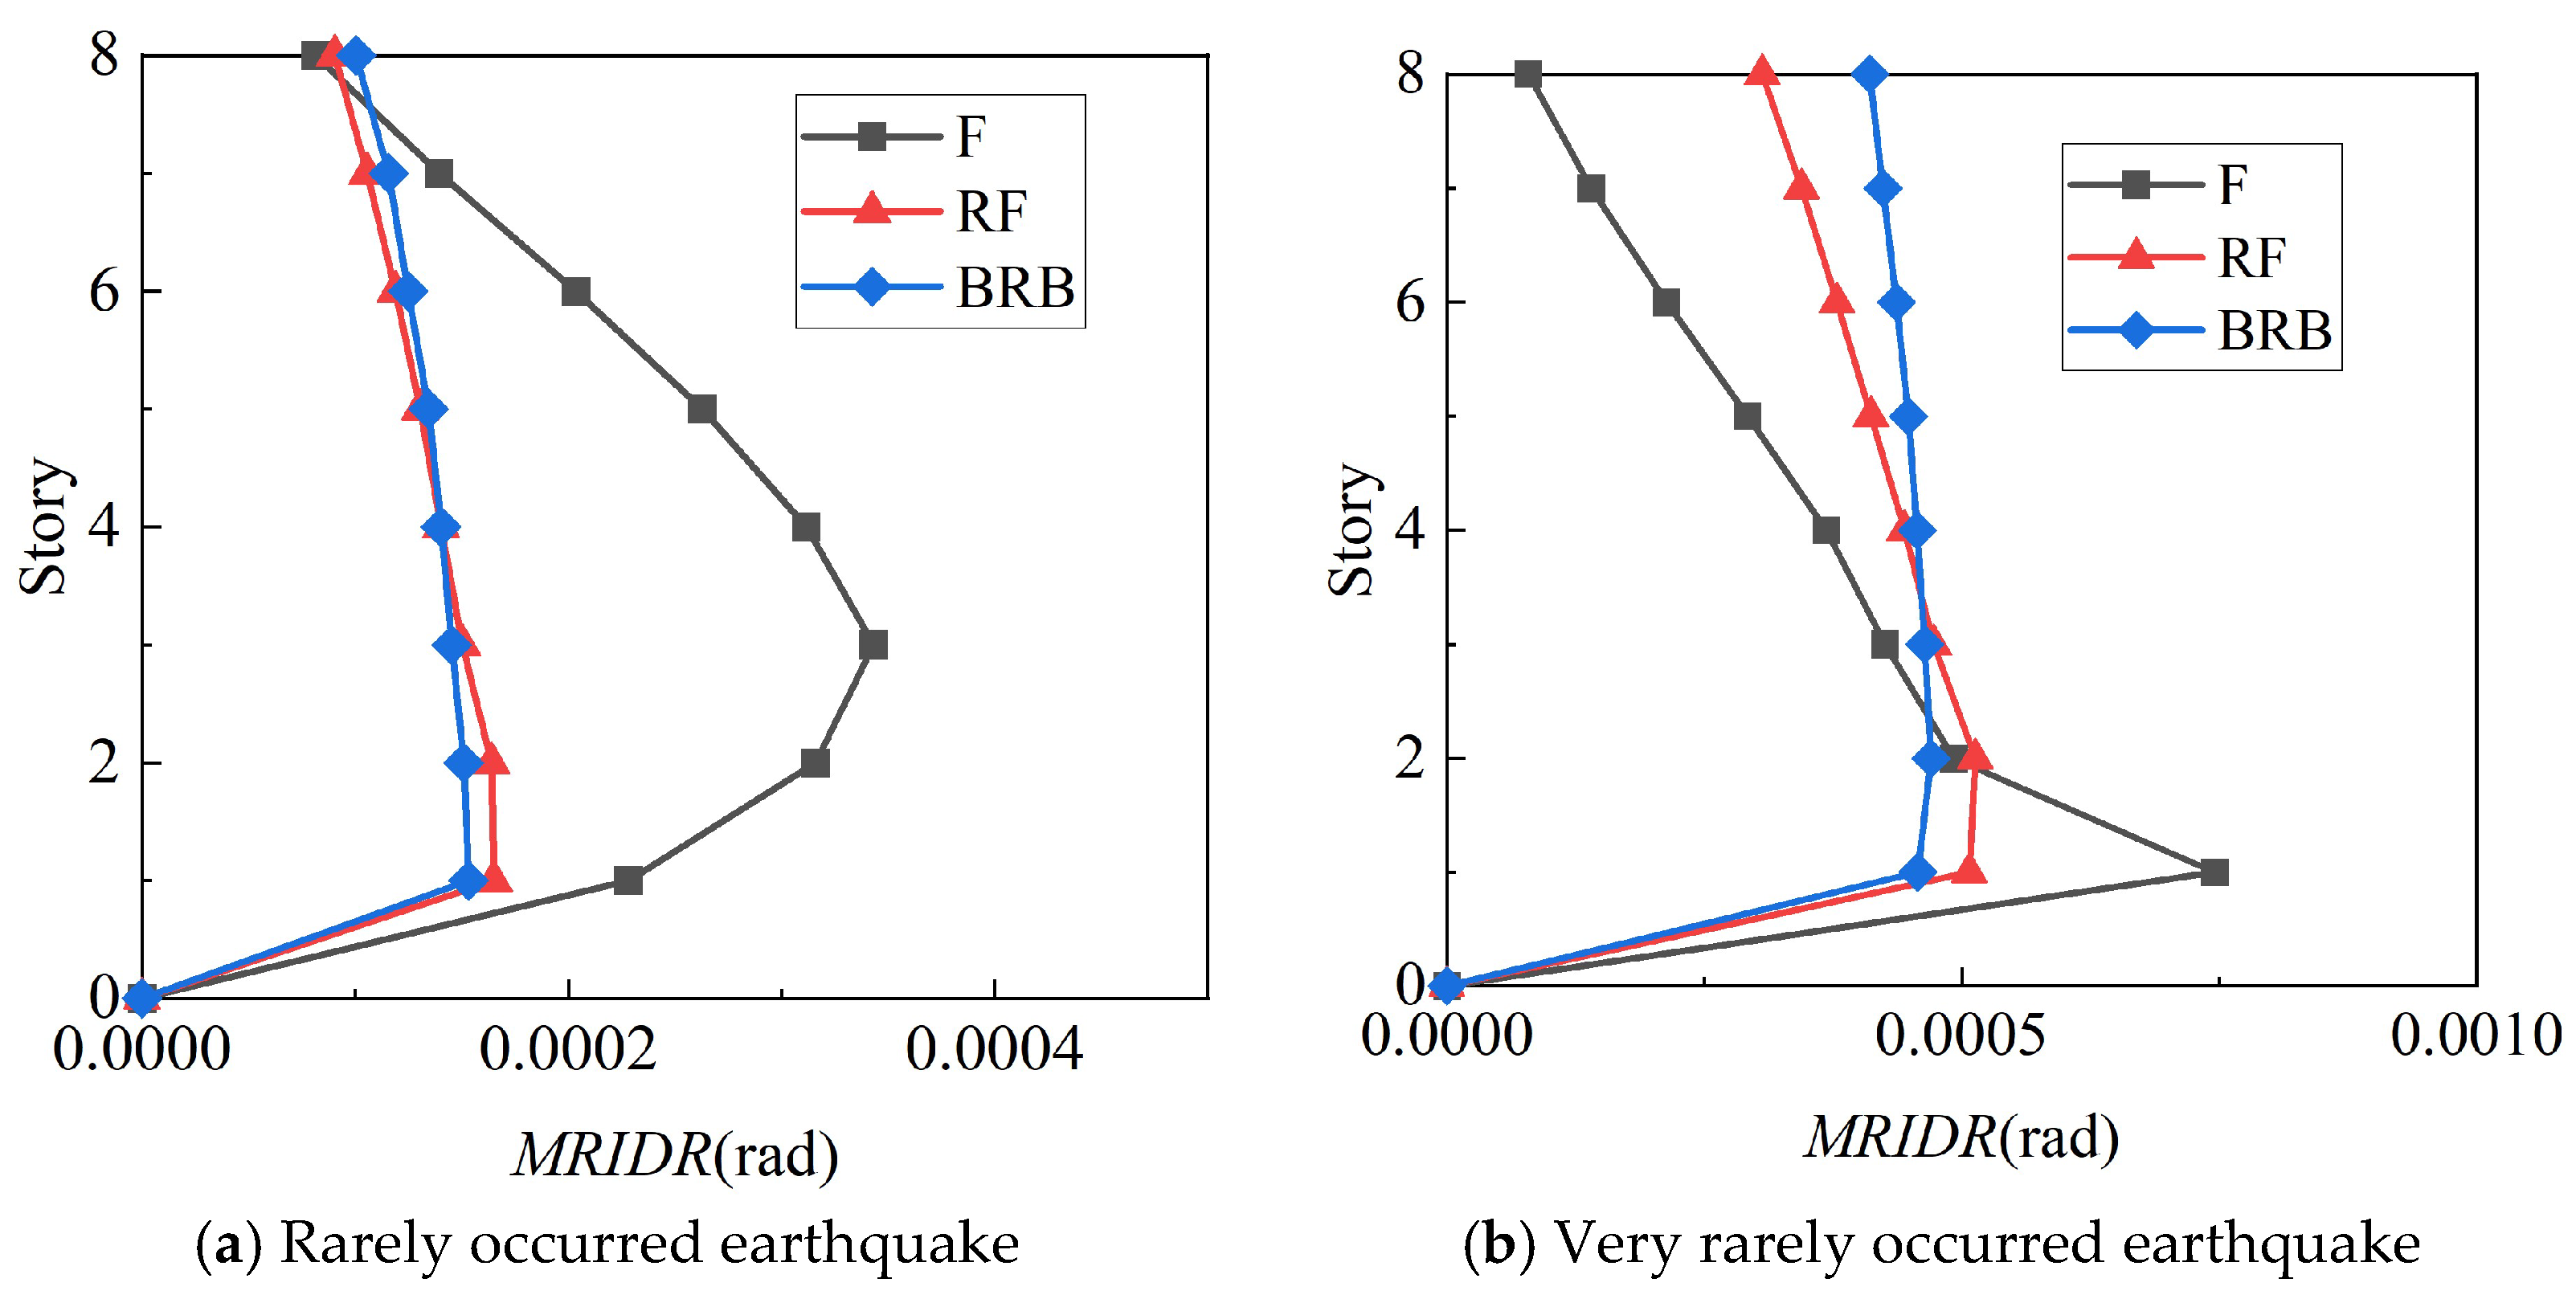
Using the model built in this paper, the residual inter-story drift ratios were analyzed under the selected ground motion records for each structure. The mean values of the residual inter-story drift ratio (MRIDR) were also calculated for each structure, as shown in Figure 12. Whether excited by a rarely occurring earthquake or a very rarely occurring earthquake, the MRIDR values of the original structures and the reinforced structures are significantly lower than the limit of 1/200. So, the structures can be repaired. The resilience analysis can be continued.
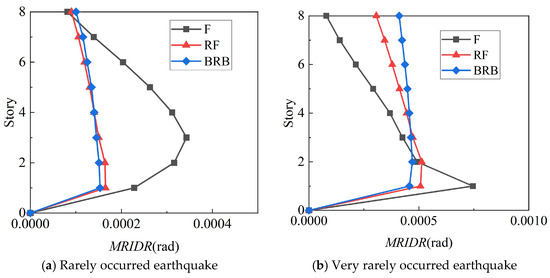
Figure 12.
The mean curves of residual inter-story drift ratio.
4.4.2. Resilience Index
In this paper, the damage values of the member were taken as the engineering demand parameters (EDPs), and a 22-time elastoplastic time-history analysis was undergone for each structure, and the analysis results were composed into an expanded EDP matrix. The number of Monte Carlo simulations was taken as 3000 times. According to Equations (12) and (13), the relative errors between the characteristics of the EDP matrix and those of the expanded EDP matrix are shown in Table 4. From the table, all the relative errors of different members are close to 1. This indicates that the statistical characteristics of the EDP matrix before and after the expansion are basically consistent.
Table 4.
Test parameters.
- (1)
- Repair costs
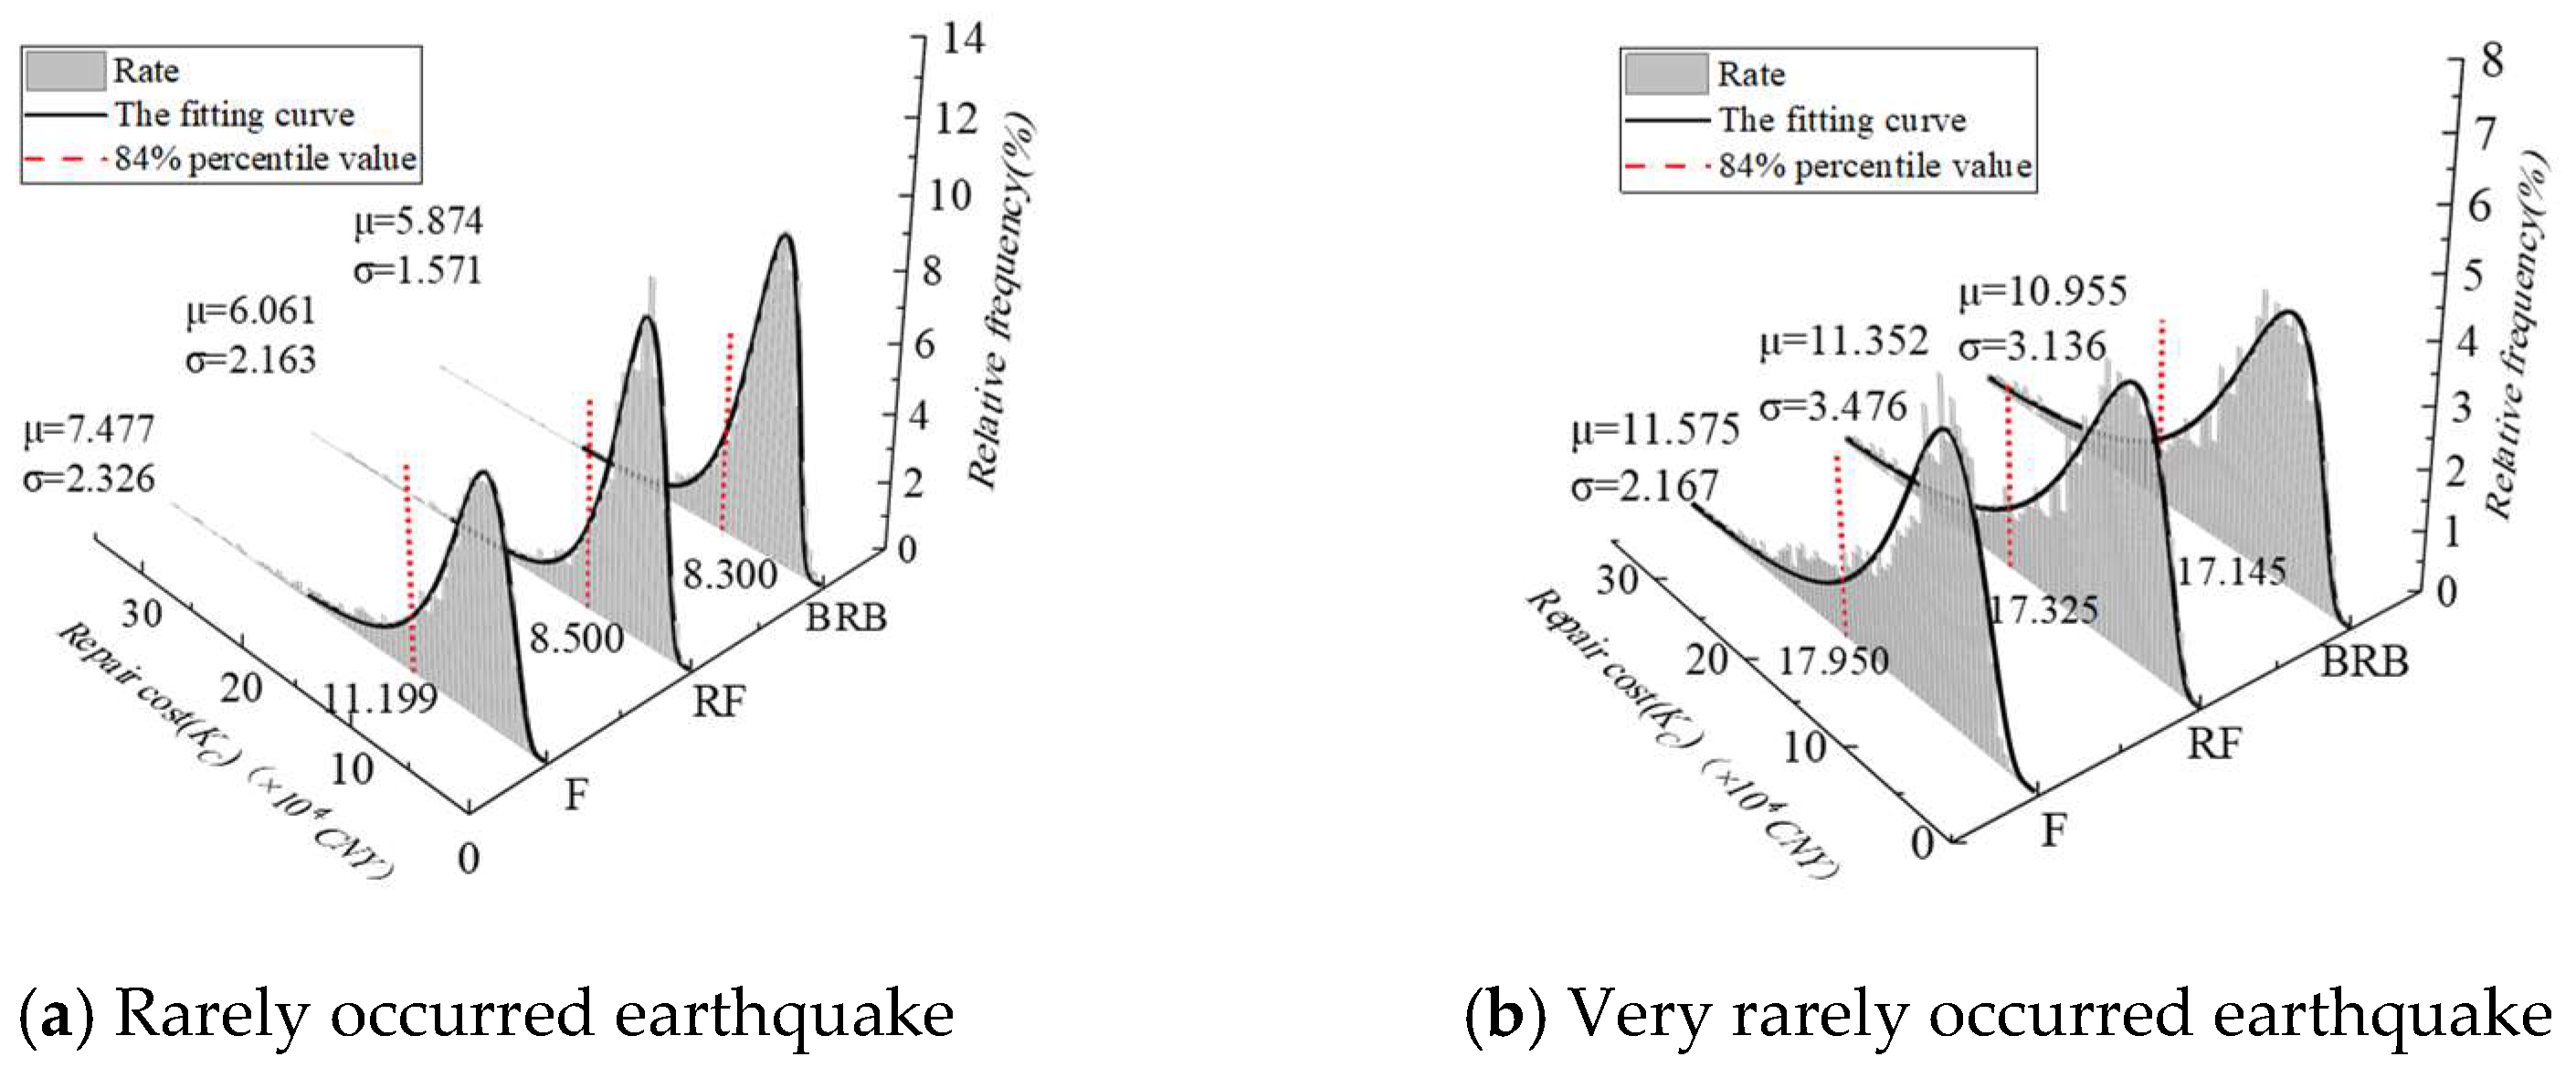
The repair cost of the structural members is shown in Table 5. Through Monte Carlo simulation, the obtained data on the repair cost of 3000 structural elements generally conformed to a lognormal distribution. As shown in Figure 13, the structural repair cost data are fitted. We can find three values from this figure, namely the mean and normal standard deviation, and the 84% percentile values of the repair cost. For rarely occurring earthquake intensities, the repair cost of the structure strengthened by the rocking frame is reduced by 24.1%, and the repair cost of the structure strengthened by the buckling-restrained brace is reduced by 25.9%. For very rarely occurring earthquake intensity, the repair cost of the structure strengthened by the rocking frame is reduced by 3.5%, and the repair cost of the structure strengthened by the buckling-restrained brace is reduced by 4.48%. It can be seen that both buckling-restrained brace and rocking frame schemes can reduce the repair cost of the structure at different earthquake intensities, and the reinforcement effect of the BRB is slightly better.
Table 5.
Repair costs for members.
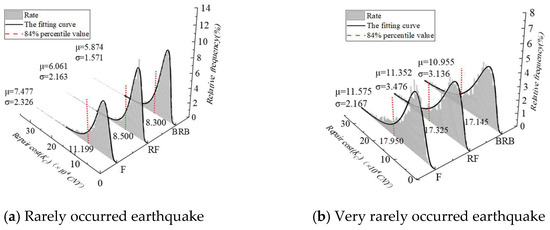
Figure 13.
Repair cost.
- (2)
- Repair time
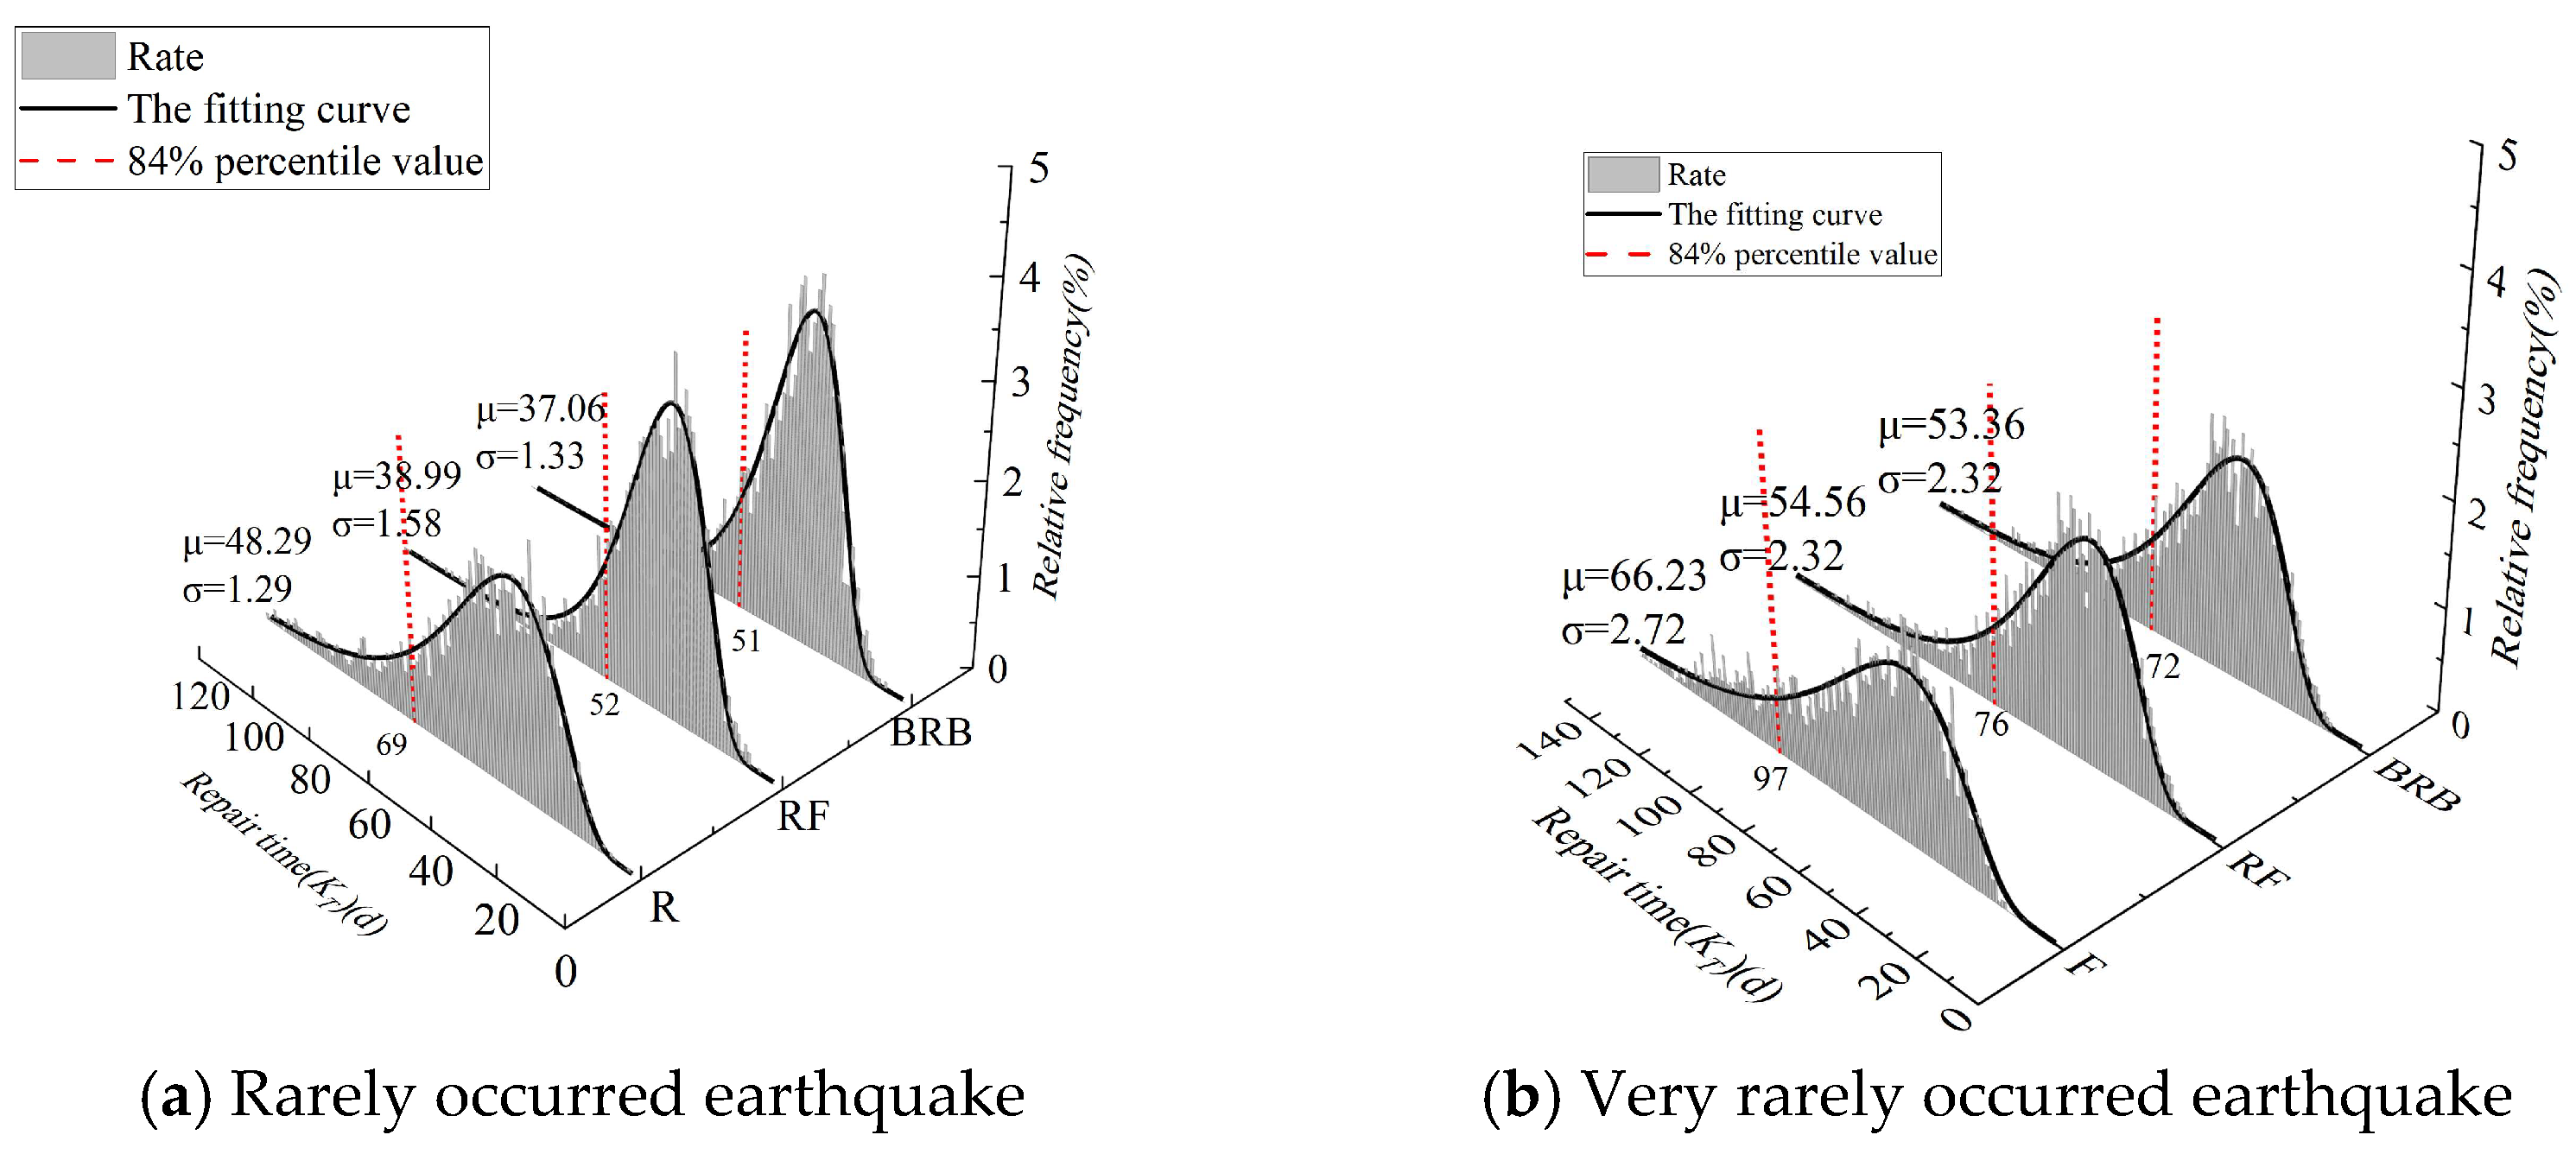
The structural repair time data from 3000 Monte Carlo simulations were fitted to a log-normal function, and the 84% percentile values of the data are taken as the presented results, as shown in Figure 14. For rarely occurring earthquake intensities, the repair time of the RF is reduced by 24.6%, and the repair time of the BRB is reduced by 26.1%. For very rarely occurring earthquake intensities, the repair time of the RF is reduced by 21.6% and the repair time of the BRB is reduced by 25.7%. It can be seen that both strengthening schemes can effectively reduce the repair time of the structure at different earthquake intensities, and the BRB is better. With the increase in earthquake intensity, seismic resilience has slightly decreased for both reinforcement schemes.
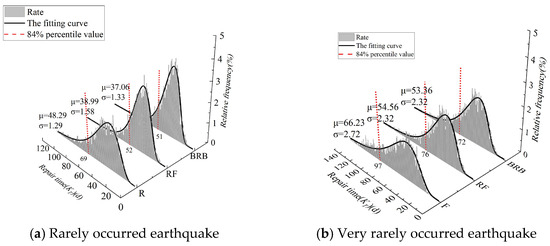
Figure 14.
Repair time.
- (3)
- Injury rate and mortality rate
Assuming that this soft-first-floor structure is used as an office building, the indoor population density is 0.5. According to Equations (16) and (17), after 3000 times of Monte Carlo simulation, the structural injury ratio and casualty rate data are obtained, as shown in Table 6. For rarely occurring earthquake intensity, the injury rates are reduced by 63% and 7.4%, and mortality rates are reduced by 64.7% and 1.7% of the structure strengthened by both strengthening schemes. For very rarely occurring earthquake intensity, the injury rates are reduced by 22.8% and 8.6%, and mortality rates are reduced by 24.3% and 2.1% of the structure strengthened by both strengthening schemes. It can be seen that a rocking frame scheme can more effectively reduce the casualty rate caused by seismic waves of different intensities. On the basis of the casualty ratio, with the increase in earthquake intensity, the seismic resilience of the structure decreases for both reinforcement schemes.
Table 6.
Injury rate and mortality rate.
4.4.3. Evaluation Result
According to the above resilience index data, shown in Table 7, the seismic resilience improvement index data of the structure are calculated and shown in Table 8. It can be seen that the resilience enhancement indexes are similar for both reinforcement methods in the repair cost and repair time, respectively, but the injury rate and mortality rate resilience improvement indexes of the RF are greater than those of the BRB, and the higher the ground motion intensity is, the less the difference in seismic resilience improvement between the RF and BRB is.
Table 7.
Resilience parameters.
Table 8.
Resilience improvement parameters.
In conclusion, the rocking frame reinforcement scheme is more preferable.
4.5. Comparison and Discussion
To verify the feasibility and effectiveness of the proposed method, a comparison and discussion were made against the conventional method.
4.5.1. Conventional Method
- (1)
- Mean of maximum inter-story drift ratio
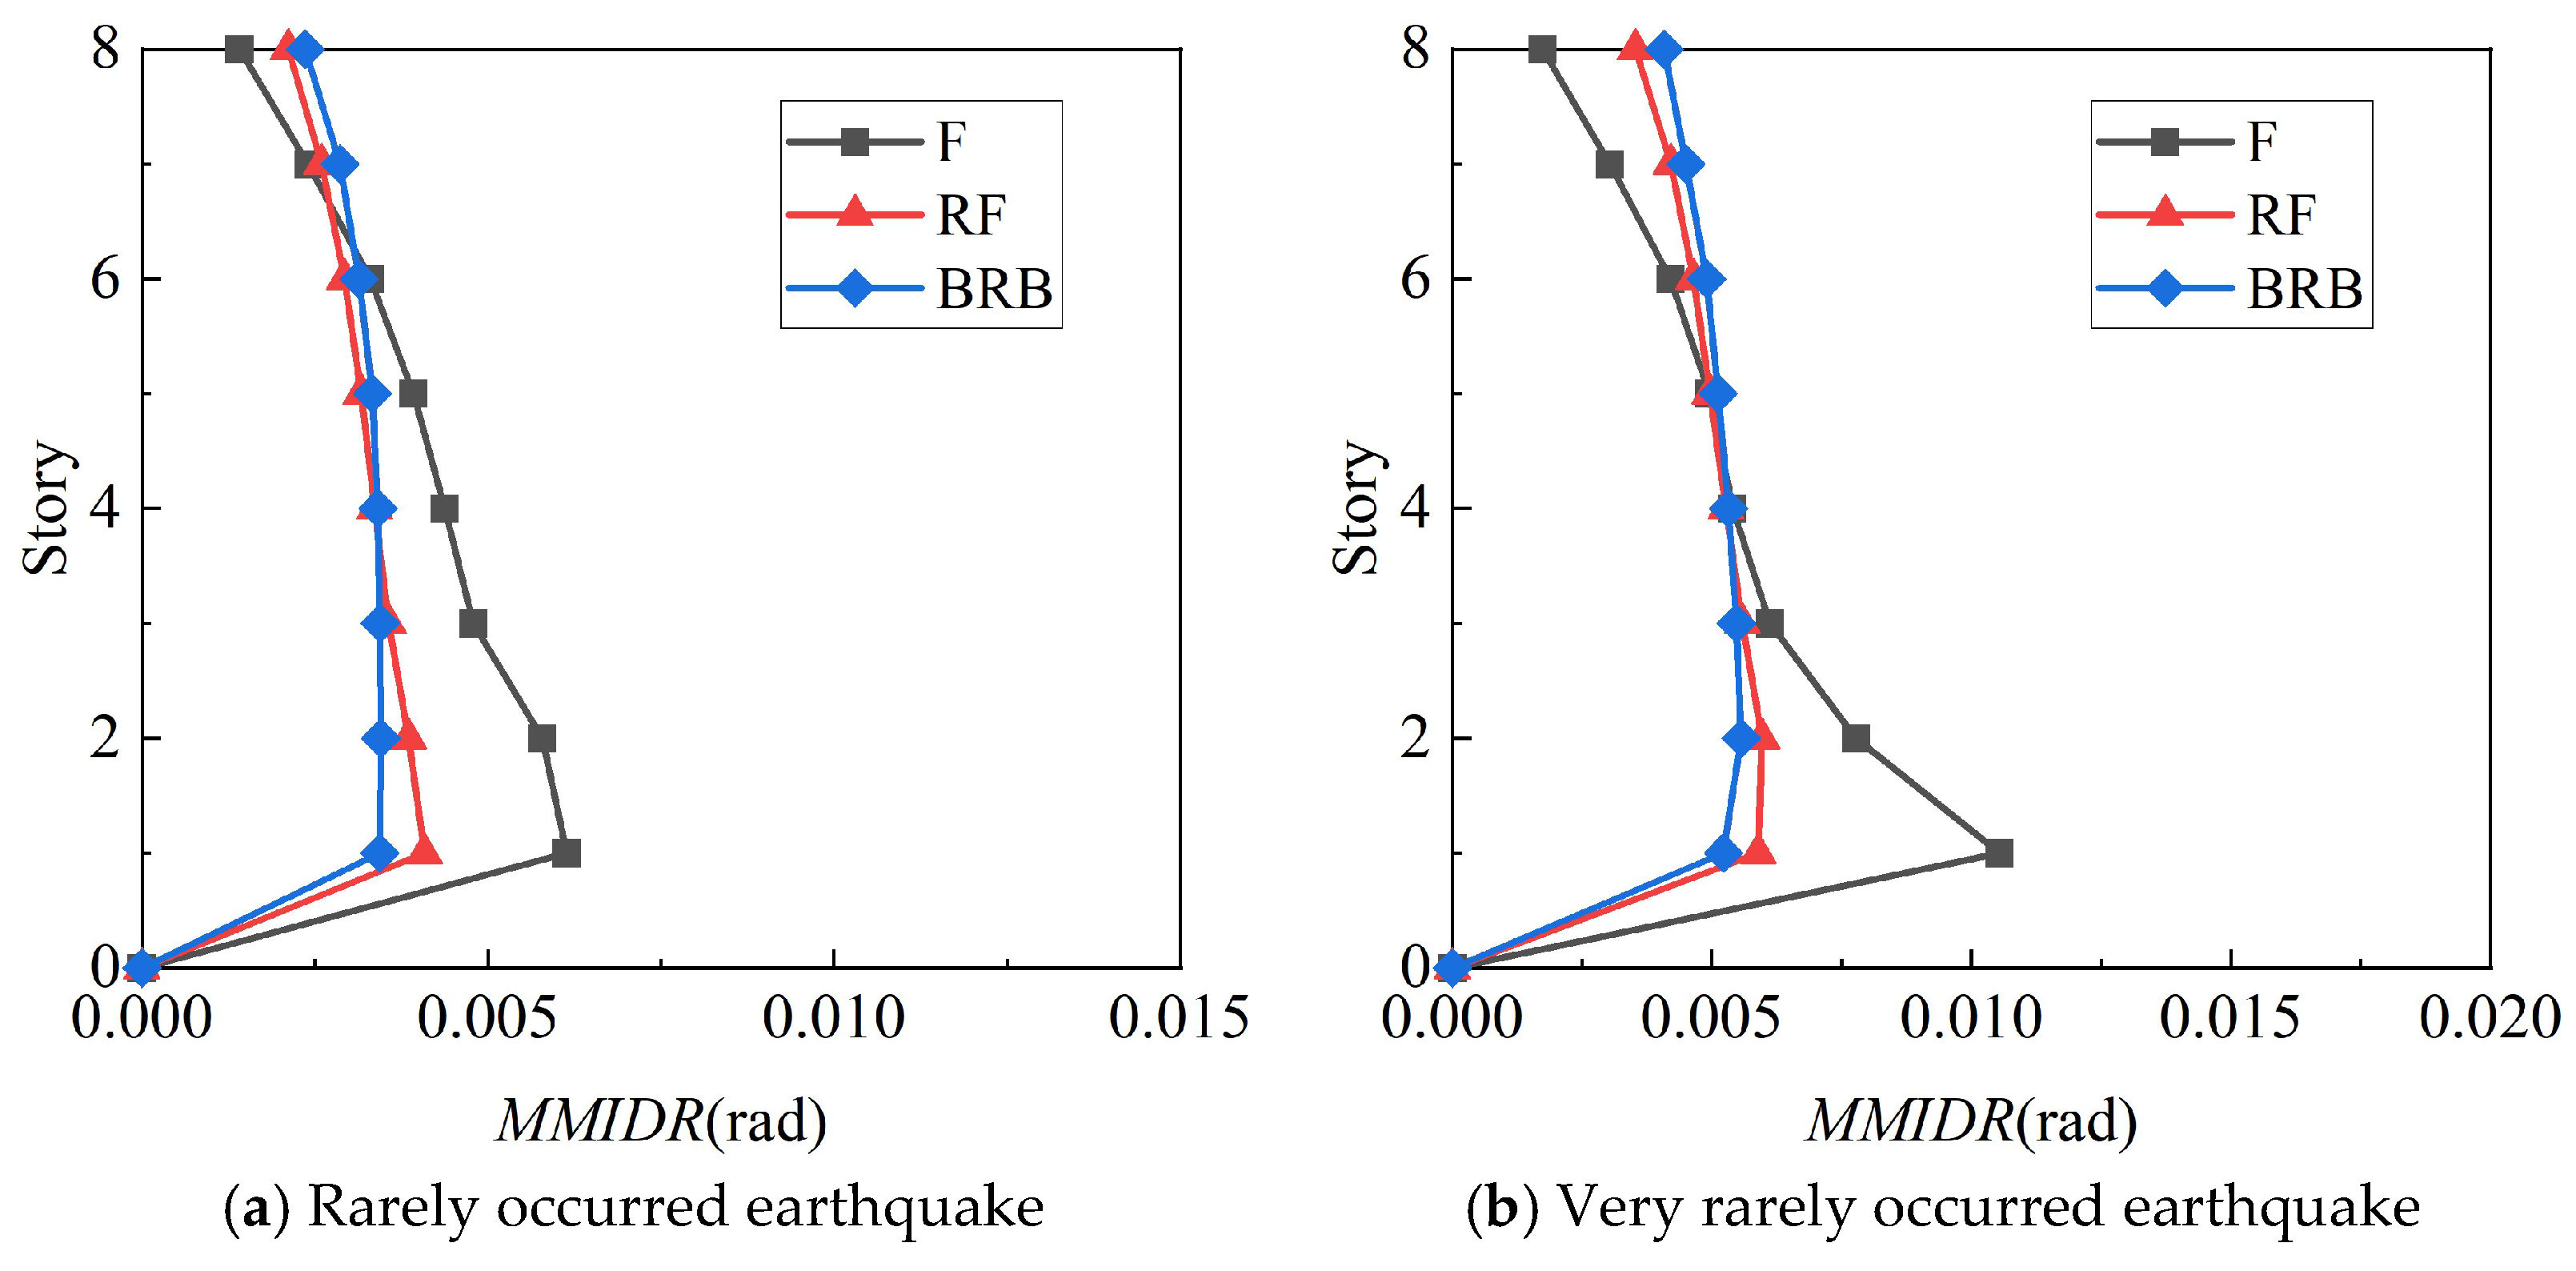
Generally, conventional assessment methods for reinforcement schemes are based on the principles of structural damage level. More specifically, first analyze structural responses for the structures without and with reinforcement, respectively; second, assess damage states and quantify damage levels on the basis of Chinese Codes [27], wherein the mean of the maximum inter-story drift ratio (MMIDR) was employed, calculated, and shown in Figure 15.
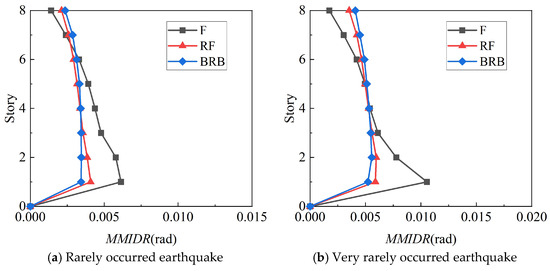
Figure 15.
The mean of maximum inter-story drift ratio.
For the frame structure without reinforcement (“F”), the maximum inter-story drift ratio is in the first story, and the maximum inter-story drift ratio gradually decreases with the height of each story due to the weak stiffness of the first story. With the increase of PGA, i.e., from Rare ground motion intensity (Figure 15a) to Very rare ground motion intensity (Figure 15b) [27], the mean of the maximum inter-story drift ratio (MMIDR) at the top of the structure increases by 0.0003, while the MMIDR at the first story increases by 0.0044. This indicates that the greater the PGA is, the more concentrated the drift ratio at the soft first-story of the structure is.
Compared with frame structures without reinforcement (“F”), the reinforced structures “RF” and “BRB” reduce the maximum inter-story drift ratios under different ground motion intensities. When the Rare ground motion intensity is high, the maximum drift ratio is reduced by 34% and 44% for RF and BRB, respectively; when the Very rare ground motion intensity is high, it is 44% and 51%, respectively. This indicates that the BRB has stronger seismic capacity.
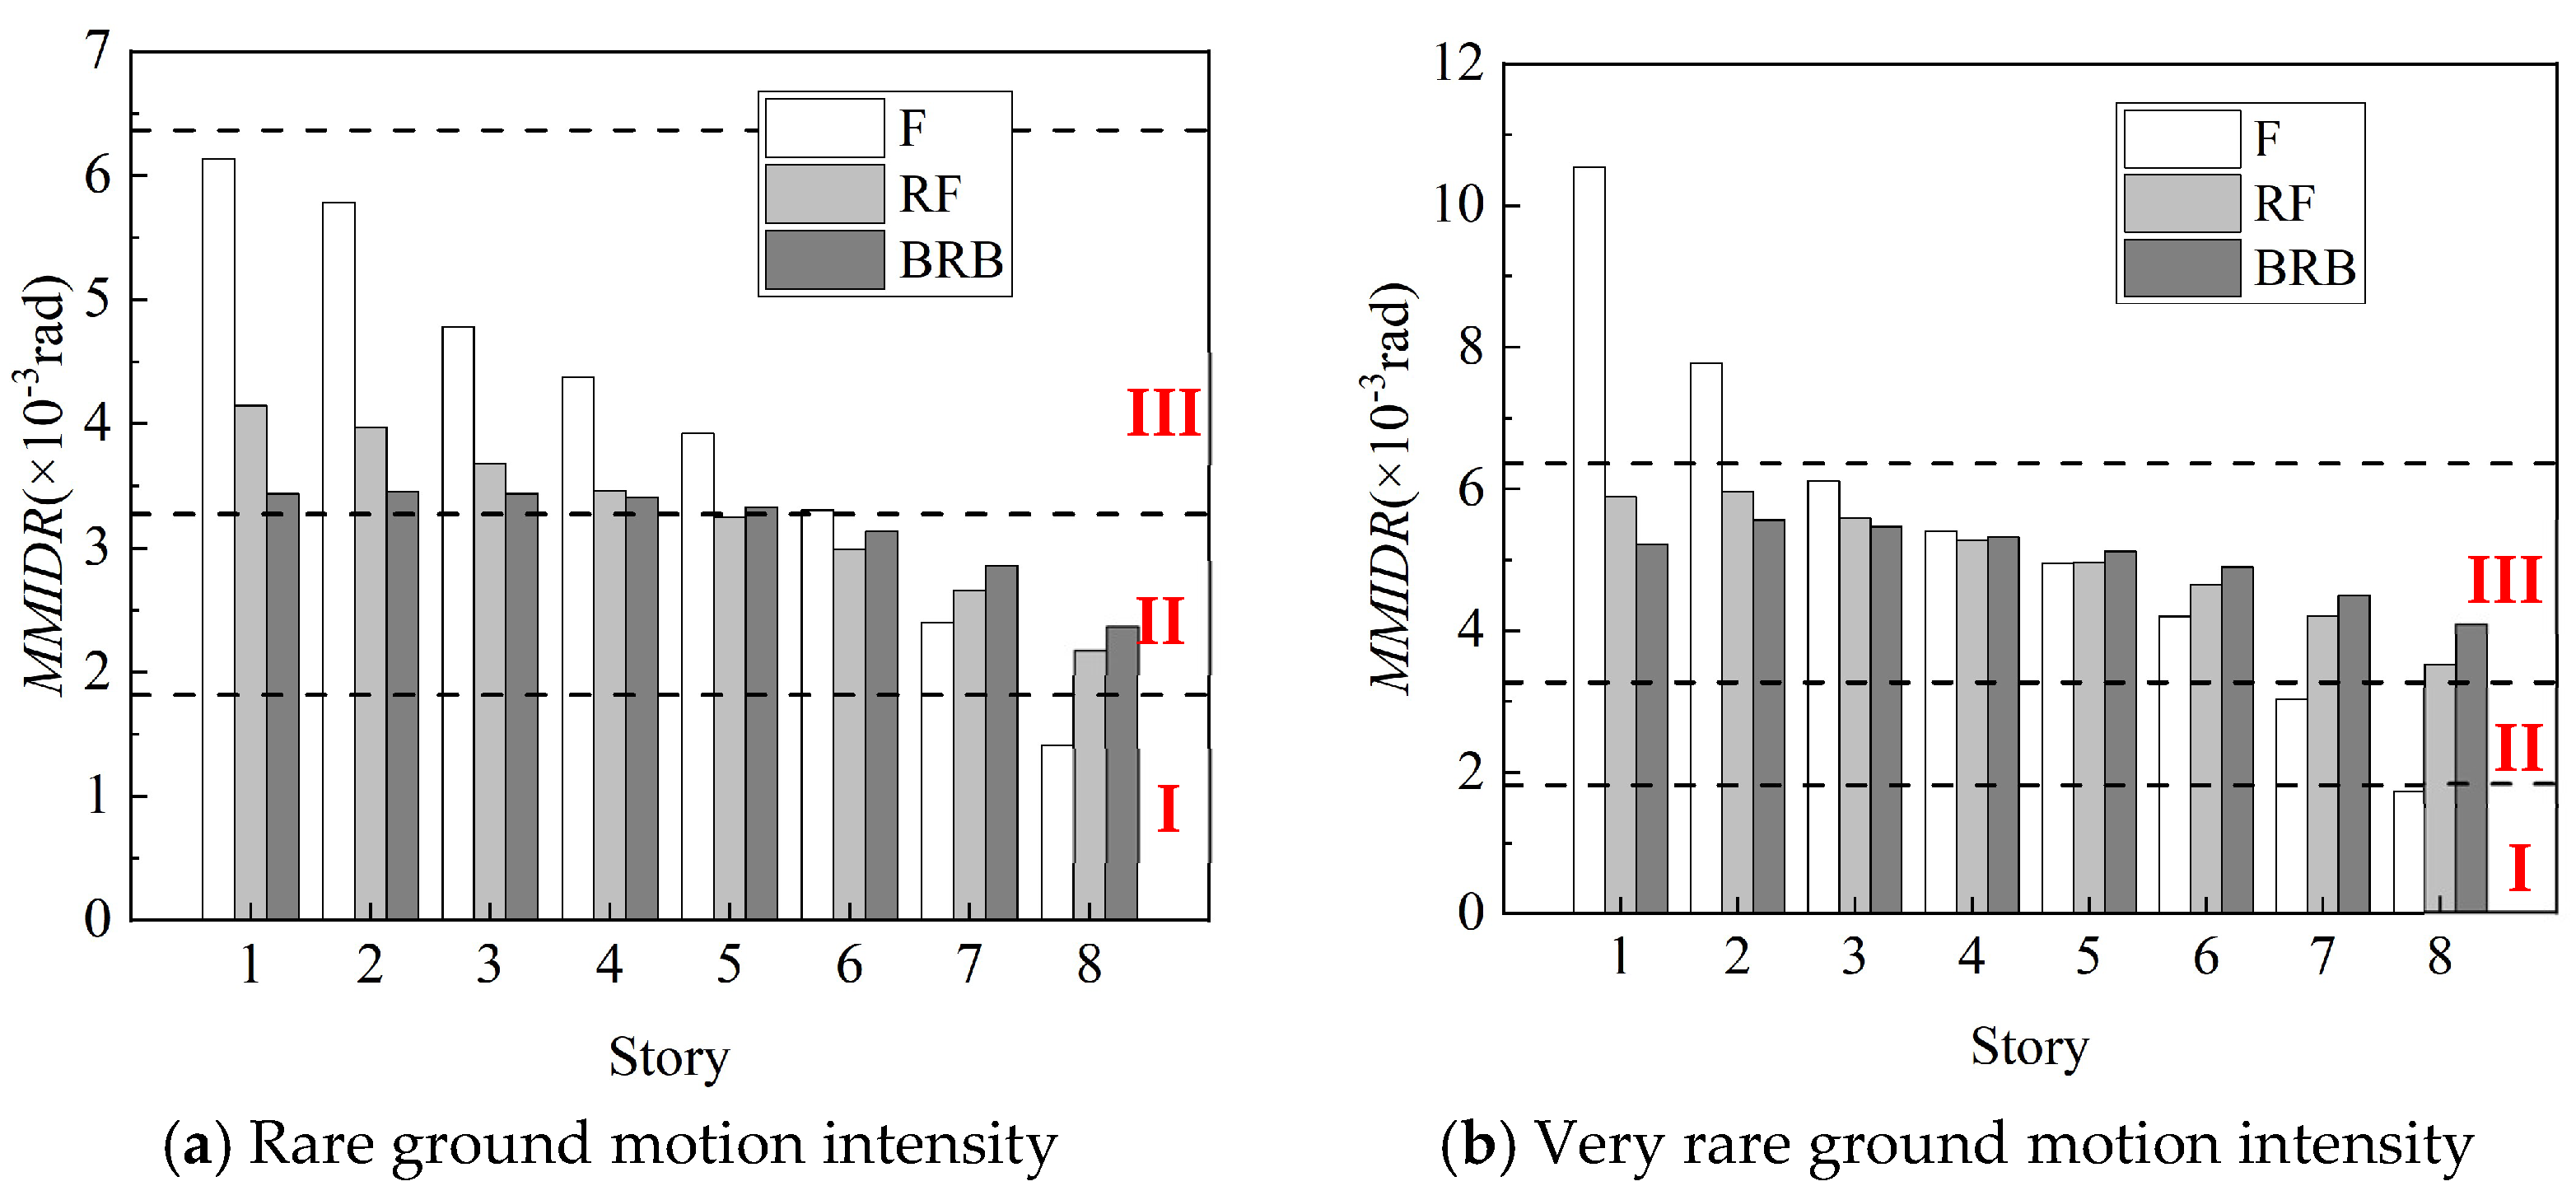
(2) Damage level and results
According to the Design Codes [27], the elastic inter-story drift ratio (θe) of the frame structure is 1/550, and the elastic-plastic inter-story drift ratio (θp) is 1/50. Five damage levels are defined, and Table 9 lists the principles of structural damage classification.
Table 9.
Classification of earthquake damage levels of the structure.
It can be seen in Figure 16 that both reinforcement schemes remarkably reduce the damage level of the structure. The damage degree of individual floors of the strengthened structures has been upgraded, while that of most floors has been reduced. When the rare ground motion intensity is compared with the frame structure, the damage levels of the 5th and 6th floors are reduced from ‘moderate damage’ to ‘minor damage’ for the RF, while they are reduced from ‘moderate damage’ to ‘minor damage’ from the first to 6th floors for the BRB. When the Very rare ground motion intensity is high, the damage levels of the 1st and 2nd floors are reduced from ‘severe damage’ to ‘moderate damage’ for both RF and BRB. In summary, the rocking frame is more effective in reducing the damage degree and is safer and more reliable than the rocking frame.
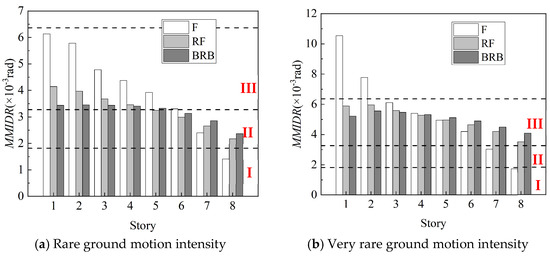
Figure 16.
Damage degree of each story of the structures.
4.5.2. Comparison
Herein, a comparison was made between the conventional scheme and the scheme proposed in this paper.
Both the conventional scheme and the scheme proposed in this paper are effective and consistent in improving seismic performance, and the reinforcement scheme with a rocking frame works better. However, there are some differences, as follows:
- (1)
- Among them, the conventional evaluation method cannot give a quantitative index for the overall damage of the rocking frame-reinforced structure, and the result is obtained according to the damage to the structure. Correspondingly, the evaluation method based on seismic resilience in this paper can quantify the economic losses and casualties of the whole structure caused by structural damage. The results are more intuitive.
- (2)
- The repair cost and casualty rate of the structure are the sum of those for each story, and the repair time is the maximum of those for each story. Consequently, the seismic resilience indices can reflect the seismic performance of the whole structure and each story, which is more comprehensive.
In summary, the evaluation method of the reinforcement scheme based on seismic resilience is more intuitive and comprehensive.
5. Conclusions
This study investigated the rocking frame reinforcement design method for soft-first-floor structures, whereby a method for assessing reinforcement schemes is presented on the basis of seismic resilience. The method was applied to three case studies of soft-first-floor structures. The effects of three reinforcement cases were quantitatively studied in four respects: repair time, repair cost, injury rate, and mortality rate. According to the analysis, the following conclusions can be drawn:
- This paper presents the reinforcement design method that is applicable to soft-first-floor structures. Studies have shown that the rocking frame utilizes its own deformation to offset the inter-layer shear stress of the structure, reducing the damage to the structure under earthquake action.
- An evaluation methodology is proposed in this paper based on resilience, which is feasible for evaluating the seismic performance of reinforcement schemes. The engineering application indicates that the repair time and cost of the rocking frame scheme are close to those of the buckling-restrained brace scheme. In terms of injury and mortality rates, however, the rocking frame scheme improved by 55.6% and 63.0% compared to the buckling-restrained brace scheme.
- An improvement index of seismic resilience is presented in this study, which can visually assess the reinforcement effectiveness of different reinforcement schemes. The results show that the rocking frame has a better reinforcement effect than that of the buckling-restrained brace.
Although the reinforcement design method and assessment methodology presented in this paper are effective for soft-first-floor structures, more experiments and numerical simulation are needed for improvement and promotion, as well as engineering application in the future.
Author Contributions
Conceptualization, Q.C. and S.J.; Methodology, Q.C.; validation, Q.C., C.L. and E.L.; formal analysis, Q.C.; investigation, Q.C., H.S. and C.L.; resources, S.J., E.L., C.F.; data curation, C.L., C.F.; writing—original draft preparation, Q.C.; writing—review and editing, Q.C., H.S., and S.J.; supervision, S.J. and E.L.; project administration, S.J., E.L. and C.F.; funding acquisition, S.J. All authors have read and agreed to the published version of the manuscript.
Funding
This research was funded by the Scientific Research Fund of the Institute of Engineering Mechanics, China Earthquake Administration (Grant No. 2020EEEVL0402), and National Fourteenth Five-Year Key Research Projects of China (Grant No. 2023YFF0906102).
Data Availability Statement
All data, models or codes that support the findings of this study are available from the corresponding author upon reasonable request.
Acknowledgments
The authors would like to express their gratitude to the editors and reviewers for their constructive comments, which greatly improved the quality of this paper.
Conflicts of Interest
Author Chenyang Li was employed by the company Fujian Wuzhou Construction Group Co., Ltd. Author En Lin was employed by the company Fujian Rongsheng Construction and Development Co., Ltd. Author Chong Fu was employed by the company Fujian Academy of Building Research Co., Ltd. The remaining authors declare that the research was conducted in the absence of any commercial or financial relationships that could be construed as a potential conflict of interest.
Nomenclature
| BRB | Buckling-restrained brace reinforced structure |
| RF | Rocking frame reinforced structure |
| F | Soft-first-floor frame structure |
| SRI | Seismic resilience index |
| SRII | Seismic resilience improvement index |
| As | Section area of the shear wall |
| Ars | Section area of the rocking frame diagonal bars |
| Am | Area of stories |
| Abi | Mean of EDP matrix before the expansion |
| Aai | Mean of EDP matrix after the expansion |
| CA | Relative error of the mean of EDP matrix before and after the expansion |
| CC | Relative error of covariance of EDP matrix before and after the expansion |
| Cbi | Covariance of EDP matrix before the expansion |
| Cai | Covariance of EDP matrix after the expansion |
| Es | Elastic modulus of the original structure |
| Ers | Elastic modulus of rocking frame steel |
| Total shear at bottom of structure | |
| Fl | Horizontal seismic actions of the lth floor of the structure |
| FL | Reaction force of the rocking frame |
| G | Shear modulus of the original structure |
| Weight of the lth floor of the structure | |
| Total gravity load of the original structure | |
| H | Total height of the structure |
| Is | Inertia moment of the column in origin structure |
| Irs | Inertia moment of the column in rocking frame |
| Layer lateral stiffness of the rocking frame | |
| KC | Repair cost of the unreinforced structure |
| KT | Repair time of the unreinforced structure |
| KIN | Injury rate of unreinforced structure |
| KM | Mortality of unreinforced structure |
| KeC | Repair cost of the reinforced structure |
| KeT | Repair time of the reinforced structure |
| KeIN | Injury rate of reinforced structure |
| KeM | Mortality of reinforced structure |
| Lrs | Length of the rocking frame |
| Rotational torque | |
| NDCF | Target value of the deformation |
| RC | Seismic resilience enhancement index of repair cost |
| RT | Seismic resilience enhancement index of repair time |
| RIN | Seismic resilience enhancement index of injury rate |
| RM | Seismic resilience enhancement index of mortality |
| Tl | Repair time of each story |
| Wrs | Span of the rocking frame |
| Damping coefficient of the original structure | |
| g | Gravitational acceleration |
| h | Height of rocking frame |
| Height of the lth floor of the structure | |
| System stiffness of the original structure | |
| krs | Lateral stiffness of the rocking frame |
| ksf | Lateral stiffness of the original structure |
| l | Sequential number of structural stories |
| msf | Mass of the original structure |
| mrs | Mass of the rocking frame |
| n | Total of structural stories |
| ns | Number of frame columns per floor |
| rhr | Nominal injury rate |
| rdr | Nominal mortality rate |
| ut | Inter-story displacement of the structure |
| u | Displacement of the original structure |
| Velocity of the original structure | |
| Acceleration of the original structure | |
| Ground acceleration | |
| x | Displacement of the center of mass |
| Rotation angle of the rocking frame | |
| Angular acceleration of the rocking frame | |
| The maximum drift ratio of the rocking frame | |
| Seismic impact coefficient | |
| λC(l) | Influence coefficient of height of each story |
| ζm | Indoor personnel density |
References
- Zhou, J.; Luo, G.; Fang, X. Fragility analysis of vertical irregular reinforced concrete frame structures subjected to pulse like ground motion. J. Build. Struct. 2011, 32, 134–142. [Google Scholar] [CrossRef]
- Beigi, H.A.; Christopoulos, C.; Sullivan, T.; Calvi, G.M. Gapped-Inclined Braces for Seismic Retrofit of Soft-Story. Build. J. Struct. Eng. 2014, 140, 04014080. [Google Scholar] [CrossRef]
- Zhou, B. Damage and lessons from the Hanshin earthquake in Japan. Earthq. Resist. Eng. 1996, 1, 39–42. [Google Scholar] [CrossRef]
- Xie, L. Lessons learnt from the great Sichuan Wenchuan Earthquake. Strateg. Study CAE 2009, 11, 28–35, 88. (In Chinese) [Google Scholar]
- Beigi, H.A.; Christopoulos, C.; Sullivan, T.; Calvi, G.M. Seismic response of a case study soft story frame retrofitted using a GIB system. Earthq. Eng. Struct. Dyn. 2015, 44, 997–1014. [Google Scholar] [CrossRef]
- Zhang, W.; Li, G.; Sun, F. Seismic Behavior of Rocking-Truss-Frame with Dampers. J. Tongji Univ. 2019, 47, 1235–1243. (In Chinese) [Google Scholar]
- Dar, A.; Konstantinidis, D.; EI-Dakhakhni, W. Seismic response of rocking frames with top support eccentricity. Earthq. Eng. Struct. Dyn. 2018, 47, 2496–2518. [Google Scholar] [CrossRef]
- Maroofi, E.; Mansoori, M.; Moghadam, A.; Aziminejad, A. Introducing a new seismic resisting system with dual linked column frame and rocking motion. Structures 2023, 47, 2148–2161. [Google Scholar] [CrossRef]
- Massumi, A.; Piri, M.; Nematnezhad, M. Enhancing the Seismic Performance of Moment Frames Using a Dumbbell-Shaped Rocking Shear Wall with Energy-Dissipating Devices. Pract. Period. Struct. Des. Constr. 2023, 28, 23–37. [Google Scholar] [CrossRef]
- Kaltakci, M.Y.; Ozturk, M. An experimental study on the strengthening of non-ductile reinforced concrete frames via external shear wall. Eur. J. Environ. Civ. Eng. 2012, 16, 59–76. [Google Scholar] [CrossRef]
- Jung, J.S.; Lee, K.S. Pseudodynamic testing of buildings retrofitted with external steel reinforced concrete frames to increase lateral strength for earthquake damage prevention. Shock Vib. 2020, 2020, 3027094. [Google Scholar] [CrossRef]
- Hu, S.L.; Wang, W.; Alam, M.S. Performance-based seismic design method for retrofitting steel moment-resisting frames with self-centering energy-absorbing dual rocking core system. J. Constr. Steel Res. 2021, 188, 106986. [Google Scholar] [CrossRef]
- Hu, S.L.; Wang, W.; Qu, B.; Alam, M.S. Development and validation test of a novel Self-centering Energy-absorbing Dual Rocking Core (SEDRC) system for seismic resilience. Eng. Struct. 2020, 211, 110424. [Google Scholar] [CrossRef]
- Bruneau, M.; Chang, S.E.; Eguchi, R.T.; Lee, G.C.; O’Rourke, T.D.; Reinhorn, A.M.; Shinozuka, M.; Tierney, K.; Wallace, W.A.; Von Winterfeldt, D. A Framework to Quantitatively Assess and Enhance the Seismic Resilience of Communities. Earthq. Spectra 2003, 19, 733–752. [Google Scholar] [CrossRef]
- Federal Emergency Management Agency; Hamburger, R.; Bachman, R.; Heintz, J.; Hooper, J.; Whittaker, A. Seismic Performance Assessment of Buildings Volume 1-Methodolody; Technical Report FEMA P-58 for Federal Emergency Management Agency: Washington, DC, USA, 2012. [Google Scholar]
- Moretti, S.; Trozzo, A.; Terzic, V.; Cimellaro, G.P.; Mahin, S. Utilizing Base-isolation Systems to Increase Earthquake Resiliency of Healthcare and School Buildings. Procedia Econ. Financ. 2014, 18, 969–976. [Google Scholar] [CrossRef]
- Du, K.; Yan, D.; Gao, J.; Sun, J. Seismic Performance Assessment of RC frame structures with Energy dissipation and Isolated devices Based on FEMA P-58. Eng. Mech. 2020, 37, 134–147. [Google Scholar] [CrossRef]
- GB/T 38591-2020; Standard for Seismic Resilience Assessment of Buildings. Standards Press of China: Beijing, China, 2020.
- Shi, S.; Du, D.; Wang, S.; Li, W. Assessment of reinforcement scheme for a high-rise steel structure based on seismic resilience and reinforcement benefit ratio. China Civ. Eng. J. 2020, 53, 71–82. [Google Scholar] [CrossRef]
- Zhang, Z.; Jiang, S.; Dai, L. Study on deformation control mechanism of RC frame-prefabricated shear wall structure strengthened with external rocking frame. J. Harbin Inst. Technol. 2021, 53, 120–128. [Google Scholar]
- Makris, N.; Aghagholizadeh, M. The dynamics of an elastic and structure coupled with a rocking wall. Earthq. Eng. Struct. Dyn. 2017, 46, 948. [Google Scholar] [CrossRef]
- Jiang, Q.; Wang, H.; Feng, Y. Seismic design and performance of hinged truss frame structures. Eng. Mech. 2019, 36, 105–113. [Google Scholar]
- Xiao, Y.; Zhou, Y.; Wu, H.; Pan, P.; Wang, T. Comparative study on GB/T 38591–2020 “Standard for seismic resilience assessment of buildings” and relevant international standards. J. Build. Struct. 2021, 42, 194–202. [Google Scholar] [CrossRef]
- Saeed, A.; Najm, H.M.; Hassan, A.; Qaidi, S.; Sabri, M.M.S.; Mashaan, N.S.A. Comprehensive Study on the Effect of Regular and Staggered Openings on the Seismic Performance of Shear Walls. Buildings 2022, 12, 1293. [Google Scholar] [CrossRef]
- Jiang, S.; Dai, L.; Zhang, Z. Structural seismic performance of self-centering energy dissipative rocking frame for strengthening soft-first-story RC frames. J. Fuzhou Univ. 2021, 49, 225–232. [Google Scholar]
- Liu, Z.; Cao, Y.; Chen, D.; Zhou, Z. Analysis model selection and parameter setting of a high-rise building based on YJK software. Build. Struct. 2014, 44, 83–86, 97. [Google Scholar]
- GB 50011-2010; Code for Seismic Design of Buildings. China Architecture and Building Press: Beijing, China, 2016.
- Salmon, J.; Beigi, H.A.; Christopoulos, C. Full-scale tests of gapped-inclined bracing system: Seismic retrofit for soft-story buildings. J. Struct. Eng. 2019, 145, 4019095. [Google Scholar] [CrossRef]
- Javidan, M.M.; Kim, J. Seismic Retrofit of Soft-First-Story Structures Using Rotational Friction Dampers. J. Struct. Eng. 2019, 145, 4019162. [Google Scholar] [CrossRef]
- Xie, Q.; Zhao, L. Research on buckling-restrained brace and its applications to structural seismic retrofitting. Earthq. Eng. Eng. Dyn. 2006, 26, 100–103. [Google Scholar] [CrossRef]
- Kim, J.; Choi, H.; Chung, L. Energy-based seismic design of structures with buckling-restrained braces. Steel Compos. Struct 2004, 4, 437–452. [Google Scholar] [CrossRef]
- Mohammadi, M.; Kafi, M.A.; Kheyroddin, A.; Ronagh, H. Performance of innovative composite buckling restrained fuse for concentrically braced frames under cyclic loading. Steel Compos. Struct. 2020, 36, 163–177. [Google Scholar] [CrossRef]
- Yin, B.; Cheng, S.; Ji, F.; Du, Y.; Lei, C.; Hong, X.; China Academy of Building Research; Chongqing University. Experimental study on seismic performance of frame structure strengthened with weak attached steel braces. Earthq. Resist. Eng. Retrofit. 2019, 41, 110. [Google Scholar] [CrossRef]
- Michael, A.; Seungho, C.; Jinkoo, K. Seismic retrofit of framed structures using a steel frame assembly. Steel Compos. Struct. 2023, 46, 857–865. [Google Scholar] [CrossRef]
- Shi, W.; Zhu, P.; Chen, W.; Ma, J. Implementation methods and numerical simulation of double-stage yield buckling restrained brace. Earthq. Eng. Eng. Dyn. 2023, 43, 140–150. [Google Scholar] [CrossRef]
- Du, Y.; Wu, D. Performance analysis of light energy dissipative rocking frame designed on the basis of stiffness demand. China Civ. Eng. J. 2014, 47, 24–35. [Google Scholar] [CrossRef]
- Yu, B.; Qin, C.; Tao, B.; Li, B. Probabilistic calibration of stress-strain models for confined normal-strength concrete. J. Struct. Eng. 2021, 147, 04021117. [Google Scholar] [CrossRef]


Disclaimer/Publisher’s Note: The statements, opinions and data contained in all publications are solely those of the individual author(s) and contributor(s) and not of MDPI and/or the editor(s). MDPI and/or the editor(s) disclaim responsibility for any injury to people or property resulting from any ideas, methods, instructions or products referred to in the content. |
© 2024 by the authors. Licensee MDPI, Basel, Switzerland. This article is an open access article distributed under the terms and conditions of the Creative Commons Attribution (CC BY) license (https://creativecommons.org/licenses/by/4.0/).