Abstract
Noise is the number two environmental health risk in Europe. With the majority of the world’s inhabitants residing in ever-growing cities, urban noise impacts an increasing number of people. Urban airports significantly contribute to urban noise, and their spatial effects far exceed their boundaries. While indoor acoustic mitigation in architecture is growingly addressed using parametric tools, there is limited research on mitigating noise with digital means through landscape and urban design. Moreover, there is a lack of methods for ameliorating urban noise through ground-forming. To address this, this paper contributes a novel method for integrating acoustic analysis in parametric landscape-forming. The method includes collecting on-line and on-site noise data, developing alternative landscape formations for mitigating noise, and evaluating design alternatives within a single digital design environment. This method was applied using research by design and examined on a case-study site adjacent to the Munich Airport. Three landform landscape designs for a park are developed, and their acoustic performance is compared. The results indicate the possibility of integrating acoustic considerations in landscape architecture, and the method provides a step-by-step guide for doing so. This capacity also promotes the long-term goal of increasing the environmental performance of urban grounds.
1. Introduction
This study presents a method for embedding acoustic performance in landscape architecture. Unlike acoustics in architectural contexts, this approach has been limitedly explored in practice and no methods for developing acoustic grounds currently exist. This paper provides (i) a novel workflow for approaching the design of acoustic grounds by linking noise data, design, and simulation; (ii) a noise sampling method and a computational setup for developing design and performing acoustic simulation for outdoor noise mitigation. The findings demonstrate the capacity to apply the workflow to a specific site and comparatively assess the acoustic performance of several landscape design alternatives.
1.1. Background: Airport Noise, Mitigation, and Performative Acoustic Grounds
Noise pollution is the number two environmental health risk in Europe [1]. As the global population has become predominantly urban, a growing number of people are exposed to and affected by urban noise. The health risks associated with noise range from acoustic discomfort, sleep disturbance, and cognitive impairment to ischemic heart disease [2]. It is estimated that in Western Europe alone, at least 1.6 million healthy years of life are lost because of environmental noise (ibid). Added to these are social and economic costs, evaluated at a loss of 0.4% in the total gross domestic product (GDP) in Western Europe [3]. While regulative efforts are pursued to reduce noise emissions from road, rail, and air traffic, they mainly target noise sources [4]. However, there is a growing need to protect the environments surrounding noise sources and mitigate the noise effects.
Airports and urban transport infrastructure are significant contributors to urban noise. They are referred to as ‘noise landscapes,’ the noise-influenced, spatial entities that airports create through the combination of their operation alongside the diverse measurements and statistics tracking it [5]. The impact that noise landscapes hold on their surroundings has been shown to exceed the boundaries of airports and often spur urbanization in and of itself [6]. Moreover, the impact of airport noise has adverse effects on the quality of the built environment and the quality of life of residents exposed to chronic noise pollution [7].
Airports are typically surrounded by vast, buffering open areas. These vast grounds can be formed to support noise reduction and mitigate environmental challenges, amongst them noise pollution. Ground-forming can substitute the standard approach to noise mitigation, which usually relies on off-the-shelf, industrial solutions, generic in appearance, and not customized to the site. Despite the potential for noise abatement through landscape and urban design, efforts to mitigate sound through landscape or urban design remain marginal [8]. Moreover, the propagation of noise caused by transport infrastructure has been shown to increase by poor urban design, resulting in heightened noise pollution levels in residential areas [9]. Airports, which are required to address noise abatement, could be encouraged to invest in developing surrounding acoustic grounds. The advantage of embedding acoustic performance in formed grounds is the ability to perform site-customized noise mitigation and gain enhanced public use.
1.2. Motivation: Expanding Methodologies in Landscape Architecture
Emerging practices in landscape architecture extend the use of computational tools beyond representation, simulation, and modeling [10]. This extension offers the possibility to design ground formations according to the desired performance and thereby respond to environmental challenges [11]. However, doing so requires novel methods. Currently, there is a lack in methodologies for performing research through designing (RTD) in landscape architecture [12]. This paper aims to expand these methodologies and address the heightened need for design experimentation methods for environmental performance purposes [13].
1.3. Challenges: Methods for Addressing Acoustics beyond Walls
In the recent decade, architectural research has increasingly addressed acoustics using parametric tools, allowing the design of tailored, data-driven, and performance-based acoustic solutions [14]. However, this approach has been mainly applied to indoor noise. There is a lack of methods for incorporating acoustic design considerations for outdoor spaces. This gap stems from the complexity of noise dispersion and the interdisciplinary knowledge required for addressing it. Therefore, there is a need for methods for integrating environmental performance such as acoustic analysis in landscape design. This can be done using research by design methods—using a design process to produce architectural knowledge [15].
1.4. Objective: A Method for Embedding Acoustic Performance in the Design of Ground Forms
This paper addresses the lack of methods for designing landscapes for acoustic performance. In this context, it aims to support mitigating urban noise through landscape design using ground-forming. To this end, the presented method links noise data, parametric design, and acoustic simulations. The method provides a step-by-step guide for obtaining and analyzing the data, translating it into a design process, defining the digital environment required to pair design and acoustic simulation, and assessing them. The integration of acoustic analysis takes place within a single design environment. The integration is significant as it enables designers to evaluate the performance of acoustic evaluation throughout the design process, not merely at the end of it. This capacity promotes the design of performative grounds in response to noise as well as additional environmental challenges. Since this method inherently links research and design, the paper applies the method to three designs for a case-study site adjacent to the Munich Airport. The results demonstrate the possibility of embedding acoustic analysis in a design process and comparing the acoustic performance of different designs using the proposed method.
1.5. Paper Structure
The paper begins with a state-of-the-art relating to urban noise, mitigation approaches, and knowledge gaps. The workflow is then presented, followed by the steps of the proposed method—online and on-site noise analysis, the design process, and strategies, followed by simulation and evaluation. The method is applied to a case-study site adjacent to the Munich airport. The noise data collection and simulation results are presented, and the performance of the different designs is analyzed and compared. The paper concludes by summarizing the contribution, the limitations of current research, and the steps for future work.
1.6. State-of-the-Art
1.6.1. Urban Noise
Urban noise pollution is defined as sound at excessive levels detrimental to public health [16]. In Germany, the following standards assure compliance with legal noise limitations: the 2020-introduced RL S19 (Guidelines for Noise Control on Roads—2019 Edition), applicable to a height of up to 4 m [17]. In parallel, the AzB model provides a tool for protection [18]. These standards regulate the noise emitters and are based on the European Environmental Noise Directive (END), which aligns methods for measuring major environmental noise sources. The END sets the standards for monitoring noise with the aid of numeric calculation of the spreading of noise over a landscape in the height of 4 m—with a grid resolution of 10 m by 10 m and an indication of levels in 5 dB steps [19].
The protection of noise receivers is conducted through standards limiting permitted noise levels and by setting standards for their mitigation. For example, the DIN 4109-2, which defines noise levels for indoor and outdoor noise; the noise guidelines set by the Federal Aviation Administration (FAR) [20]; the standard for rating sound insulation of buildings and of building elements, ISO 717 [21]; and the procedure for determining the airborne sound insulation between indoor rooms ISO 16283-1:2016 [22]. These procedures are mainly geared for indoor noise in the range from 10 to 250 m3 in the frequency range from 50 to 5000 Hz. However, none of the existing models or standards currently provides guidelines for mitigating the felt noise in open urban spaces. Such guidelines are absent also in the domain of environmental acoustics, centered on the study of sound propagation and its effects on the environment [23].
1.6.2. Noise Mitigation through Ground-Forming
Mitigation of airport noise is addressed through three levels. The primary level targets the noise source and is applied during the production of aircraft; the secondary level targets aircraft arrival and departure procedures; and the tertiary level includes measures by the local airport of aviation authority [24]. In the context of tertiary level mitigation, several projects demonstrate the possibility of addressing noise or vibrations through ground-forming. In this context of abating noise around airports, the Buitenschot Land Art Park in the Netherlands ameliorates Schiphol Airport’s effects on an adjacent neighborhood [25]. Through the construction of ground ridges and furrows, the park’s design distorts and disperses low-frequency noise waves—a feature shown to reduce airport ground noise by 10 dB [26]. In addition, a Netherlands-based thesis project explores airport noise reduction through built volumes and gravel strips [27]. Both projects employ conventional design means, in which the acoustic performance can only be assessed at the end of a design or construction process, not during it.
In contrast, using digital tools to form a parametric landscape design can allow alteration in the design and assessment of the outcome in a single design environment. This approach was applied to mitigate ground vibrations around a MAX Lab IV in Sweden [28]. However, it demonstrates the potential for alternative approaches to the standard practice of constructing absorbing barriers around infrastructure. Nonetheless, a method and simulation tools for absorbing vibration using mass volumes of earth are currently unavailable, and there is limited work on parametric ground-forming [29]. The latter requires integrating data, simulation, and 3D modeling, and no existing workflows currently support it. There is, therefore, a need for methods supporting the design of data-driven ground-forming, which can mitigate noise.
1.6.3. Noise Simulation Methods and Tools
Existing acoustic simulation tools are geared for analysis and are not integrated with the design environment. This is also the case with simulation tools dedicated to environmental acoustics [30]. Hence, these tools do not readily support design iteration. A recently developed open-source tool, Pachyderm, allows the integration of acoustic simulation and visualization of sound propagation in a 3D design environment. The underlying procedure which Pachyderm provides is ray tracing and image source plug-in for Rhinoceros–Grasshopper [31]. In addition, dedicated frameworks assist in integrating acoustic simulation into architectural design workflows [32]. However, there is still a lack of methods and workflows for integrating such acoustic simulation in the design of vaster, open spaces. This limits the application of these tools in landscape architecture and urban design. In addition, existing tools require customizing the link between the acoustic simulation and the design process, thereby hindering a more widespread adoption of such tools. This research gap limits the capacity to address noise at larger scales.
1.6.4. Knowledge Gaps
Several gaps emerge from the literature review and hinder the ability to integrate acoustic considerations in landscape architecture design processes.
- A lack of research-by-design methods for performative landscapes, namely for noise mitigation in open urban spaces.
- A lack of methods supporting the design of data-driven ground-forming using noise data.
- A lack of workflows that support the integration of acoustic simulation in the design process as an alternative to employing separate tools for design and simulations.
2. Materials and Methods
The paper presents a method to address the current knowledge gaps and support the design of acoustic grounds. This section describes the research context, introduces the case-study site, and details the three steps of the method—noise analysis, design, and simulation.
2.1. Context
The presented research was conducted as part of a postdoctoral research project in combination with two research-driven seminars titled ‘Precision Landscapes’ performed at the Professorship of Urban Design, the Technical University of Munich. The presented method and tools were developed by the research team and examined in the seminars—research through design. The examination involved the development of three alternative designs for mitigating noise through the modulation and forming of grounds.
2.2. Case-Study Site
In consultation with the Munich Airport officials, the research focused on the southwestern area bordering the airport, the municipality of Hallbergmoos. The site is located approximately 25 km from the Munich city center and measures 540 by 1885 m. The airport has two runways, and due to the proximity of the site to the southern runway lane, its inhabitants are highly exposed to airport noise (Figure 1). Currently, there exist no acoustic mitigation measures in this area. A ground-based intervention at this site could therefore alleviate the noise pollution.
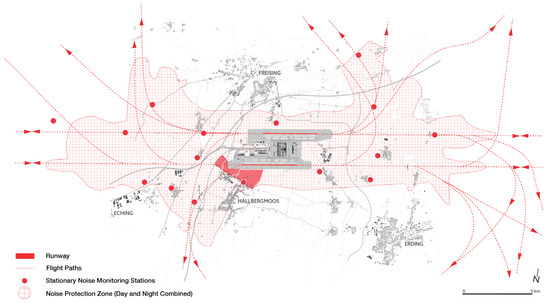
Figure 1.
The location of the selected case study, situated in Hallbergmoos, southwest of the Munich International Airport. The map shows the site in relation to the flight trajectories and the stationary noise monitoring stations.
2.3. A Method for Incorporating Acoustic Performance in Design
The presented research addresses the knowledge gaps and provides a workflow that maintains the relation between noise, design, and acoustic performance along the process (Figure 2). The workflow provides the steps for parametric ground-forming toward noise mitigation. The outcome of this process can be viewed as a vast, horizontal, ground version equivalent of an acoustic tile. The study connects several existing methods (for noise sampling, research by design, and acoustic simulation) and complements them with the technical setup to offer the workflow for designing acoustic grounds. The step-by-step guide for this process addresses the following questions:
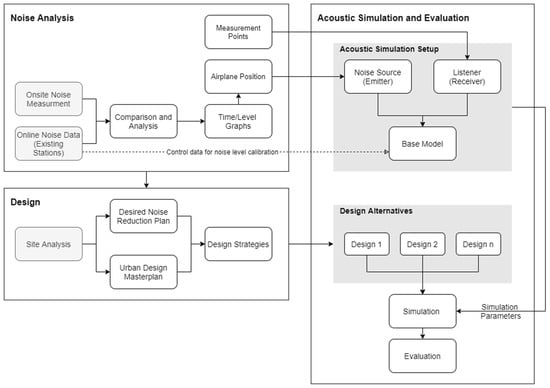
Figure 2.
Workflow of the method for noise mitigation using parametric ground-forming (TUM, 2022).
- What data is needed for acoustic ground-forming, and how the respective data can be obtained.
- How to translate noise data into the desired landscape design principles, which can guide the parametric design.
- How to develop and evaluate the design of landscape formations in terms of their acoustic performance.
2.4. Noise Analysis
Airport noise consists of ground-level noise and noise produced by aircraft taking off and landing. The latter contributes higher noise pollution levels to the surroundings and hence receives more policy attention. This section describes the method employed here for capturing the noise using on-line noise data gathering in tandem with on-site noise measurement. The results of the two are then compared to understand the felt noise on-site.
2.4.1. On-Line Data Gathering
Airport noise is a complex phenomenon emitted from various types of aircraft during takeoff, landing, taxing, and idling stages. Seeking to design a response to the effect of all the sources listed above, the research aimed to understand the noise levels as a listener in the studied area perceives them. The first step in the noise analysis was gathering data through the official air quality monitoring stations positioned on-site and available for public access [33,34]. The measurements are available in real-time through time-limited historical records. The noise levels are typically presented as an average number or as contours on maps.
2.4.2. On-Site Noise Measurement
- Devices and application
Online data gathering was complemented with on-site data measurement to support the development of a design strategy for the site. Research increasingly relies on cell phones for collecting environmental noise data [34,35,36,37]. In line with this approach, on-site noise sampling was performed concurrently using five different devices and then averaged (Table 1). As the devices differed, the sampling used a single dedicated noise sampling application, Decibel X—Pro Sound Meter, which can measure the sound pressure level (SPL) surrounding the device.

Table 1.
List of devices used for on-site noise sampling.
- Sampling method
The noise was sampled in various locations on-site during two consecutive days. The recording documented noise levels while airplanes took off or landed. Each measurement was recorded for 90 consecutive seconds and sampled at 5 points on-site. Each presented measurement represents an average of the noise levels as captured simultaneously on the recording devices. In line with the standard method of measuring noise, the data were averaged using logarithmic rather than linear averaging [38,39].
2.5. Design
To support the comparability of design alternatives, the process tested different design strategies on the same site. First, two foundational plans were created—a desired noise reduction plan and a master plan. Based on these, three design strategies were developed using research by design. This section details these steps and provides the background and description of the three strategies.
2.5.1. Desired Noise Reduction Plan
Based on the noise sampling, a map depicting the desired noise reduction was drawn to guide the form-finding efforts (Figure 3). This map guided the design of the program and aligned the expected noise levels with the planned use of the site.
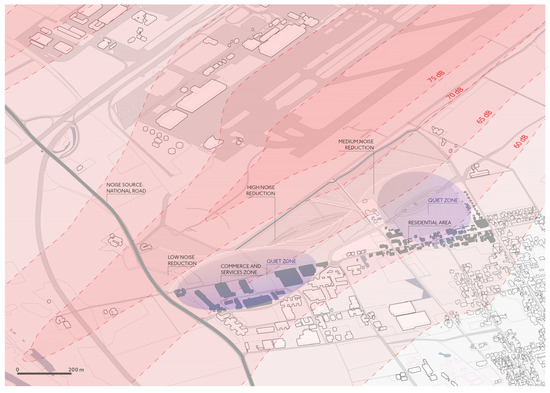
Figure 3.
The desired noise reduction plan linking the desired sound mitigation result and the program in the different parts of the park. Map by the ‘Precision Landscapes’ seminar students: Josipa Regović, Florent Bajrami, Mariya Pichurina, Dawson Stout, Regina Hofbauer (TUM, 2022).
2.5.2. A Master-Plan
Following the desired noise reduction map, the guiding master-plan map defined the park’s basic layout, movement paths, and zones of innervation for land-forming. Based on the desired noise distribution after mitigation, the master plan proposed a programmatic distribution of functions that correlates with the expected exposure to noise. For example, an area near the airport fence was designated for plane sightings, enabling airport views from the top of the mounds, and reducing noise behind its slopes. The master plan also considered the noise effects and other urban design considerations such as use, movement, surrounding built fabric, surveys with residents, etc. (Figure 4).
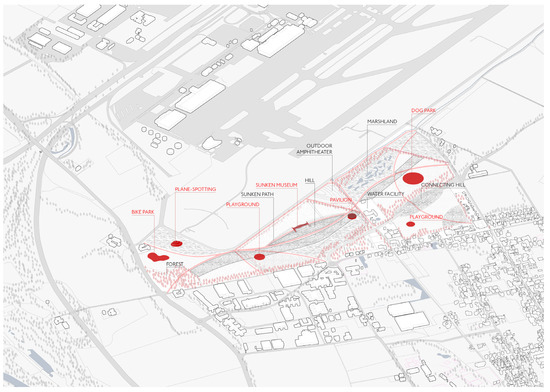
Figure 4.
Master plan for the park design with the layout, paths, and defined intervention zones. The program was developed by the students of the ‘Precision Landscapes’ seminar: Josipa Regović, Florent Bajrami, Mariya Pichurina, Dawson Stout, Regina Hofbauer (TUM, 2022).
2.5.3. Design Strategies
Three designs were devised based on the master plan and the desired noise reduction map. The designs followed the master plan in the connectivity, use, and program. Each of the three alternatives featured a different concept—marshlands, undulating formations, and large mounds.
- Design 1: Marshlands
Background: This strategy examined the notion of restoring the marshlands that historically existed in the area the site is located in [40] and integrating them within the guiding master plan devised for it. This strategy holds a double benefit—the ability to accommodate floods [41] and to mitigate noise. The design aimed to support the deflection of sound by alternating between soil mounds and lower areas separating them (Figure 5).
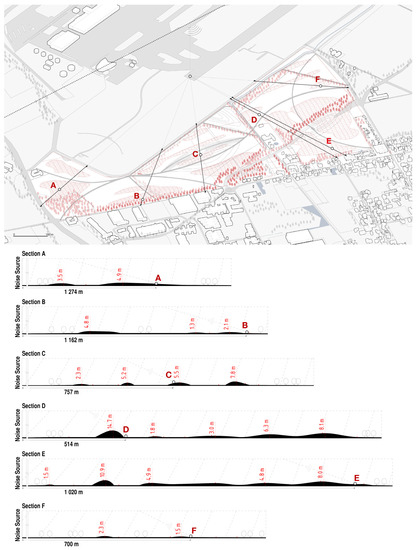
Figure 5.
Design 1—marshlands. An axonometric view and sections across the site through the A–F listener points; the sections indicate the height of the landforms and the distance between the listener and the noise source at every point. A project by the students of the ‘Precision Landscapes’ seminar: Jesús Erick Arenas Varela, Walter Garcia, Timm Lammert (TUM, 2022).
Description: The design included strips and agglomerations of varying-sized mounds, in a height range of 1.5–18.2 m. The areas between the mounds remained relatively flat and accommodated the movement paths as determined by the master plan. Owing to current simulation limitations, the simulation considered the shape but not the difference in the surface material, which could potentially enhance performance.
- Design 2: Undulating Grounds
Background: This strategy examined the potential for mitigating sound using undulating forms. The form was chosen considering the effectiveness of this forming strategy in mitigating vibrations.
Description: The design includes several agglomerations of connected round-shaped mounds in selected areas on the site. These undulations emerge from the walking paths and feature moderate inclinations, allowing multipurpose use in parallel to noise mitigation. The mounds range in height from 1.8 m in the more minor undulations to 20.5 m in the vast ones (Figure 6 and Figure 7).
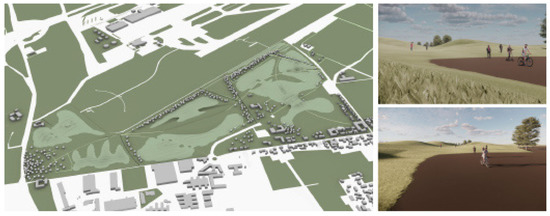
Figure 6.
Designing undulating forms as a noise mitigation strategy. A project by the students of the ‘Precision Landscapes’ seminar: Sharon Friedberg, Liubov Kniazeva, and Ekaterina Pestriakova (TUM, 2022).
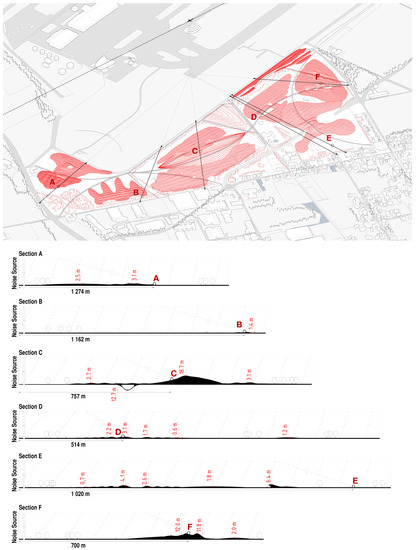
Figure 7.
Design 2—undulating forms. An axonometric view and sections across the site through the A–F listener points. The sections indicate the height of the landforms and the distance between the listener and the noise source at every point. A project by the students of the ‘Precision Landscapes’ seminar: Sharon Friedberg, Liubov Kniazeva, and Ekaterina Pestriakova (TUM, 2022).
- Design 3: Large Mounds
Background: The third design tested the mitigation of noise through large mounds. The mounds cover almost the entirety of the site aside from the designated walking paths. In contrast to design 2, this design did not feature undulations.
Description: The mounds emerge from the paths and allow multipurpose use parallel to functioning as noise barriers. They range in height between 1 and 15 m (Figure 8 and Figure 9).
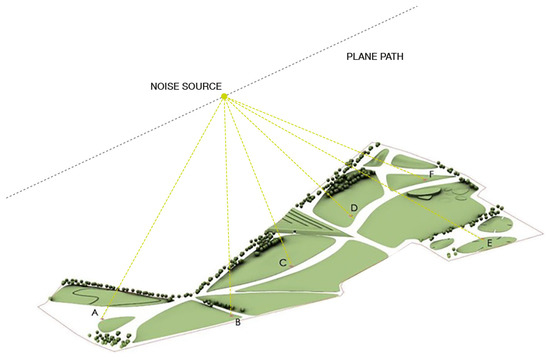
Figure 8.
Large mounds as a strategy for noise mitigation. A project by the students of the ‘Precision Landscapes’ seminar: Shuhong Lyu, George Obeng Amoako, Hoayang Wang, and Walter-Jerome Walton (TUM, 2022).
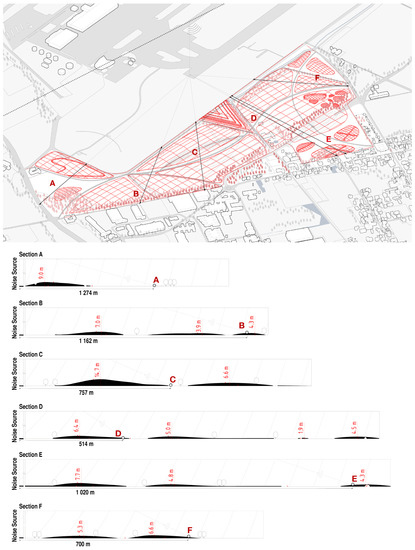
Figure 9.
Design 3—large mounds. An axonometric view and sections across the site through the A–F listener points. The sections indicate the height of the landforms and the distance between the listener and the noise source at every point. A project by the students of the ‘Precision Landscapes’ seminar: Shuhong Lyu, George Obeng Amoako, Hoayang Wang, and Walter-Jerome Walton (TUM, 2022).
2.6. Acoustic Simulation
2.6.1. Setup
Following the design of the three alternatives, the groups conducted a simulation and validation of the acoustic performance. Owing to the lengthy computational time, the validation process was performed through limited local simulations.
The simulation setup employed (1) Rhinoceros 3D (Rhino)—a commercial computer-aided design application; (2) Grasshopper—a visual programming language that runs within the Rhino application; and (3) Pachyderm RC 26—a dedicated plug-in that provides a collection of acoustic simulation algorithms used to predict noise and visualize sound propagation. Pachyderm lets designers directly interact with geometry to perform acoustic analyses on customizing simulations using the Grasshopper interface in a Rhino environment. This allows visualizing sound propagation on the proposed design algorithms [19]. The tool was used to compare the performance of the three designs for Hallbergmoos Park within a single simulation setup inside the Rhino–Grasshopper environment. The simulations were performed using a Lenovo ThinkPad P1 Gen 3, with an eight-core i7-10875H Intel processor. The computer graphics card employed was a 4 GB NVIDIA Quadro T1000.
2.6.2. Base Model: A Digital Twin
Before the performance of the different designs could be simulated, there was a need to create a model with the physical and noise conditions on-site pre-operam. This model could then be modified, allowing for performance comparison of the three post-operam conditions. The analysis is therefore followed by a baseline simulation model—a model featuring the base-condition on-site. In the field of construction, such models are often referred to as ‘digital twins’—a digital environment that simulates the existing condition in the physical environment [42]. Here, the digital twin model aimed to construct the noise levels on-site prior to any modification of the ground. For the construction of the digital site environment, the topography and the built fabric were created using Blender with imported layers derived from GIS and further improved in Rhino. The base model was set in a bounding box to support the following evaluations of the acoustic performance of the design. Afterward, a noise source was introduced into the model to replicate the noise levels captured in the noise sampling. For control purposes, the noise level was calibrated with the noise captured by the on-site monitoring stations. This ensured that the baseline noise level is close to the reality pre-operam.
2.6.3. Sound Calculation
Sound comes and moves from every surface at every angle; however, it hits from a certain angle. Since the takeoff and landing paths are known, the direction of the source can be traced. As such, for the purpose of calculation, it can be treated as a single source located at the height of 350 m along the most proximate flight path. To assess the most likely scenario, the noise simulated an airplane taking off from the southern runway. The noise level was set to exceed 75 dB. This noise level lies in the highest classification range in the official mapping of the recorded noise by the monitoring stations. It also correlates to record levels recorded during the on-site noise sampling.
2.6.4. Simulation Testing Areas
The complexity of acoustic simulations increases significantly with the size of the tested area and, along with them, the computing time. Therefore, there was computational difficulty simulating the performance of the entire site. To address this issue and allow comparability of the different proposals, the site was divided into a 100 m/100 m grid, within which the design was tested in segments of 20/20 m (Figure 10). After simulations, the noise was measured at six fixed positions in the park, enabling us to compare the performance of the different designs. Each of the six listener positions (A–F) represents different conditions on the site and was performed for each of the three design alternatives. As full-site simulation capacity was limited, this method allowed us to understand noise dispersion patterns and compare the different design strategies considering them. The simulations neglected the effect of sound being absorbed by the ground surface and focused on noise propagation.
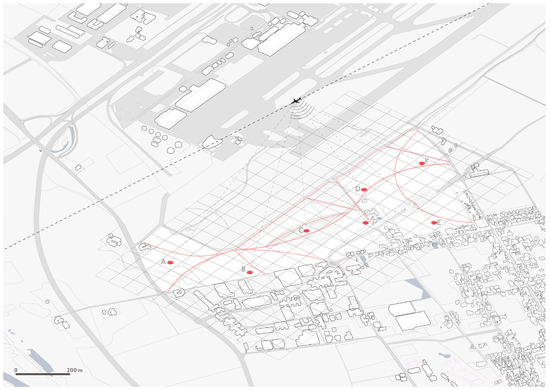
Figure 10.
The site model was overlaid with a supporting grid for defining simulation areas. The listener was positioned at six points along the grid (marked A–F). Map by the students of the ‘Precision Landscapes’ seminar (TUM, 2022).
2.6.5. Acoustic Evaluation of the Design
The acoustic evaluations were conducted on the six selected areas in each design proposal (Figure 11). This was performed by positioning six listeners on-site at a height of 1.65 m. The process is divided into three main stages: (1) the elements generator, which produces the noise-mitigating elements and places them in the park model; (2) the noise simulation calculation and noise propagation visualization; and (3) the analysis of the noise level before and after the addition of the mitigating noise elements.
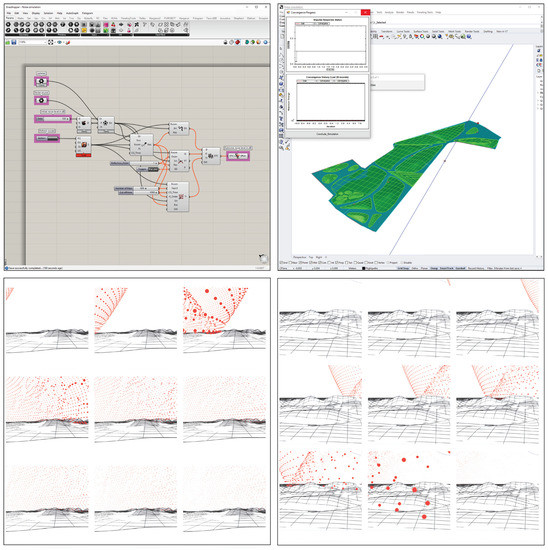
Figure 11.
The noise propagation simulation: (top left) screenshot of the Pachyderm acoustic simulation code in Grasshopper; (top right) screenshot of the site model in Rhino 3D software and Pachyderm simulation results screen; (bottom) sequential visualization of the simulation from two viewpoints in Rhino 3D displaying the noise dispersion through time.
3. Results
This section compares the results of the three stages—noise sampling, design, and simulation of the acoustic performance
3.1. Noise
On-line data gathering—The monitoring stations at the Munich Airport recorded a noise level of 62 dB on average during the measurement time. This number makes it difficult to assess the on-site noise. Moreover, while the monitoring stations capture the noise in all the areas surrounding the airport, only one of them is positioned on the perimeter of the selected site.
On-site noise measurement—The noise levels sampled on-site were averaged logarithmically and ranged between 47.33 dB (point 5) and 78.41 dB (point 2) for landing, and the takeoff levels sampled on-site ranged between 52.03 dB (point 5) and 87.12 dB (point 4) (Figure 12). These results could be affected by the cloudy and rainy conditions on-site during the two consecutive days on which the measurements were conducted.
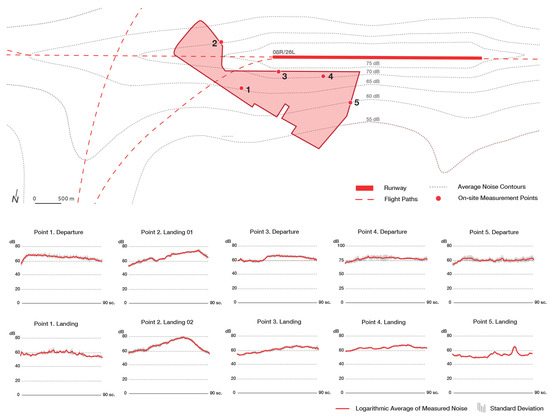
Figure 12.
The on-site noise sampling was conducted on Friday, 6 May, at 19:00 and on Saturday, 7 May, at 10:00 for 90 consecutive seconds. (Top) The site in relation to the south runway at Munich Airport, main flight trajectories, average noise contours, and locations of the recording. (Bottom) Graphs summarizing the logarithmic average noise levels, marked with their standard deviations along the measurement time as captured on five different devices during takeoff and landing in the five on-site measurement points.
3.2. Comparison of On-Line and On-Site Noise Measurements
According to the official on-line contours, the peak levels of measured noise are marked as limited to the runway areas. However, during peak-noise times, the on-site noise sampling documented levels in the range of 75 dB and above, also in the area of Hallbergmoos, beyond the airport fence. Although this documentation method is based on mobile devices with relatively limited accuracy compared to the monitoring stations, the on-site sampling allowed sensing of how noise feels on-site. It provided a finer resolution of the noise data and a better understanding of the felt noise effects on the different parts of the site. The measurements also indicate that felt noise levels differ throughout the site.
In comparison, the on-site measurements often displayed slightly higher levels than the average levels captured by the monitoring stations. The difference may be rooted in the height of the monitoring stations, which are located 4 m above the ground and, therefore, only partly capture the noise as a listener would experience it at the height of 1.75 m in the Hallbergmoos area. This disparity between the on-line and on-site measurements highlights the need for complementing official on-line data on noise with on-site noise sampling in the design of acoustic grounds.
3.3. Design Simulations
3.3.1. Design 1: Marshlands
The simulation results of design 1 (Figure 5) indicate a slight reduction in the felt noise levels in some of the simulated areas (A, E, F), a significant reduction in two areas (B, D), and a slight increase in noise levels in one of the areas (C) (Table 2). The average noise reduction measured was −1.00 dB. The simulated noise reduction in areas B and D indicates the effectivity of the forms in mitigating noise. In both cases, the listener in the simulation is positioned behind a mound, which disperses the noise from the direction of the airport. The increase in sound levels in area C is ascribed to the positioning of the listener, which was set uniformly for the three designs. Here, the position of the listener was on the most elevated part of the mound and not in the more noise-protected area along its slopes, hence the increase in the noise levels.
Table 2.
The acoustic performance of design 1, marshlands, and the pre-operam and post-operam difference in dB reflecting the noise reduction levels.
3.3.2. Design 2: Undulating Forms
The simulation results of design 2 (Table 3) show a slight reduction in the noise levels in one of the simulated areas (E), a significant reduction in three areas (A, B, F), a significant increase in the noise levels in one area (C), and a negligible noise-level difference in one area (D). The average noise reduction measured was -1.01 dB. The disparity in noise reduction effectiveness is assumed to be related to the positioning of the listener (noise receiver in the simulations) in relation to the noise source and the locations of the mounds in the design. While area E demonstrates a slight reduction due to a significant distance from the mounds, in areas A, B, and F, the listener is positioned amidst or on the slopes of mounds, as seen in the section (Figure 7). The lower mound area, B, showed a similar effectivity to the higher mound areas (A, F), suggesting that pattern, rather than height, may be the determining factor. The increase in noise levels at point C is ascribed to the positioning of the listener on the slopes facing the noise source. The zero-reduction level at point D may stem from the listener position at the top of the mound facing the noise. This point was expected to show increased noise levels like point C. However, the negligible difference might be the result of originally elevated noise levels that were mitigated by the undulating mounds situated between the source and the listener.
Table 3.
The acoustic performance of design 2, undulating forms, and the pre-operam and post-operam difference in dB reflecting the noise reduction level.
3.3.3. Design 3: Large Mounds
The simulation results of design 3 (Table 4), featuring large mounds (Figure 9), indicate a slight reduction in the felt noise levels in four of the six sampled areas (C, D, E, F) and a more significant increase in noise levels in two areas (A, B). The minimal reduction in noise levels at points C, D, E, and F is ascribed to the strategy, yet may indicate that the shape regularity and the scale of the mound may be less effective than frequent undulations (as in design 2) or alternating heights (as in design 1). The average performance in design 3 was negative, featuring a slight average increase, instead of a reduction, in the noise (0.2 dB). The increased noise level at point A is ascribed to the exposed position of the listener on the small, elevated mound. At point B, the increased noise level is ascribed to the fact that most of the terrain is elevated, and the elevation has only minor slopes protecting the listener from the noise.
Table 4.
The acoustic performance of design 3, large mounds, and the pre-operam and post-operam comparison reflecting the noise reduction levels in dB.
3.3.4. Comparison of Acoustic Performance
The table and graph below summarize a comparative acoustic performance of the three designs as simulated in the six grid areas (Table 5; Figure 13). The existing noise levels presented in the table reflect the noise produced in the digital twin based on the noise analysis. The values shown were measured at each of the simulated model’s six sampling points (A–F).
Table 5.
A comparative summary of the acoustic performance of the three designs as simulated in the six grid areas and sampled at the evaluation points. The values reflect the delta in relation to the existing noise levels and represent the noise reduction level. All noise levels are measured in dB.
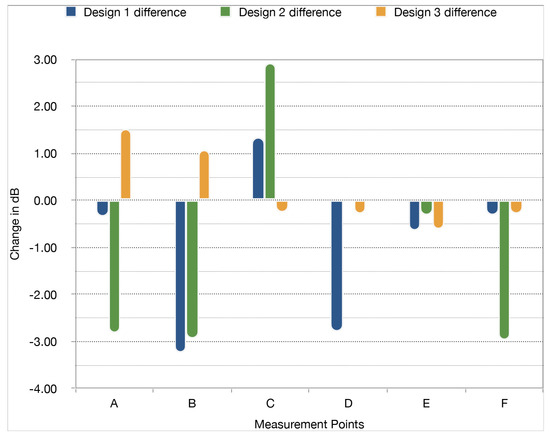
Figure 13.
A graph comparing the performance of the different designs across the six simulation areas in terms of noise reduction. The levels are measured in relation to the existing noise levels measured on-site, as shown in Table 5.
4. Discussion
In line with the research in the field, the results of the first and second designs indicate a possibility of reducing noise levels through ground-forming. Although the average reduction in noise levels measured in the presented simulations may seem minor, this level is not negligible in sound perception terms. Moreover, this level of reduction was measured in relation to a single noise source and would be more significant for multiple flights taking off and landing simultaneously. Researchers estimate that felt noise levels experienced when the aircraft number is doubled is equivalent to 4.5 dB noise level increase [43,44]. Additionally, the overall noise-mitigation impact of the entire park design may bring a more substantial reduction than reflected in selected local simulations. The gap between local and global noise reduction may explain the reduced noise levels reported around Schiphol Airport as measured in the surrounding area. The impact of the forming strategy on noise mitigation effectiveness requires further research. However, the results indicate potential in the first (marshlands) approach and the second (undulating forms) approach. The limited noise reduction measured in the simulation of design 3 (large mounds) may reflect the importance of shape differentiation in mitigating noise effects. Alternating between undulations at various heights and flatter areas between them will be the focus of further research.
4.1. Summary of Methodology and Contribution
The presented method provided a step-by-step guide for designing acoustic grounds—from the initial data gathering, its translation into design intentions, and design alternatives. While nascent work in the field, such as the Buitenschot Land Art Park adjacent to the Schiphol Airport, indicates potential, and work looking at acoustic mitigation around airport expands [44], there was a need to address the lack of methods for designing acoustic grounds. Moreover, existing designs for acoustic grounds do not rely on parametric forming, which can leverage precision for enhanced acoustic performance. This is the case even when parametric-forming of grounds is employed, as demonstrated in the grounds surrounding the MAX Lab IV in Sweden, where no design or vibration-simulation method is available.
This paper contributes a method for linking noise analysis, design, and simulation for integrating acoustic considerations in landscape design. The novel method (1) supports the translation of noise data into different designs for noise mitigation; (2) provides the digital design environment and setup for parametrically generating landscape designs; (3) allows to perform acoustic evaluation by comparing the felt noise on-site before and after the ground modification; and (4) allows to compare contextual situations within the digital design environment and understanding the felt noise as a trend. Despite the current limitations, the simulation results indicate the potential for applying this method for embedding acoustic performance in landscape architecture and mitigating noise pollution through ground-forming. This contribution is significant considering the need for dedicated methods for addressing environmental challenges.
4.2. Limitations
Certain limitations were posed by the limited capacity to simulate the noise in the vast landscape. The time-consuming simulations allowed local assessments of the noise-reduction levels. This limitation also affected the number of iterations that were performed in the design process and enabled testing the noise levels only locally. The local evaluations hindered a more comprehensive comparison of the three strategies, as the uniform positioning of the listeners meant the sound was recorded in a different spatial position (i.e., height and relation to the noise-reducing landforms) in each proposal. In addition, although weather conditions affect the transport of noise by air and impact both the noise sampling and the simulations, this remained beyond the scope of this work.
4.3. Future Work
Future work will further develop several avenues relating to the three pillars of the research: noise data, design, and simulation:
- Noise analysis—Future work will aim to increase the accuracy of on-site noise sampling, such as by using an external microphone and performing calibration between it and the sampling devices. Future noise data gathering will also address the effect of weather on aircraft noise propagation [45]. In addition, it will further develop the forms of representation of the noise, which will integrate its behavior through time, and thus provide more accurate capturing of it compared to existing 2D contour maps. In addition, it will aim to integrate with GIS-based, open-source tools, which integrate noise from several sources in an urban context [46].
- Design strategies—future research will deepen the link between form and performance in the acoustic design of grounds and rely on more frequent iterations to evaluate the design strategy. In addition, it will test the role of shape regularity vs. shape irregularity in landscape-forming and its effectiveness as a design strategy for noise mitigation. It will also aim to integrate material properties in the design and simulation and assess their respective contribution to acoustic performance. Incorporating the material properties in the simulations will allow the evaluation of more accurate strategies, such as the marshlands, which rely on the alternation between low soil mounds and water surfaces rather than on the construction of high soil mounds.
- Acoustic simulation—future work will promote the integration of acoustic simulation tools in a design environment. In addition, the presented setup will be used in tandem with other experimental algorithms to optimize acoustic performance using tools such as the Grasshopper Galapagos genetic algorithm plug-in. In parallel, the research will develop methods for supporting simulations on a larger landscape scale. Such simulations could allow testing performance locally, globally, and in the surrounding areas. Future research will also aim to use statistical analysis tools, such as chi-square, to compare the performance of different designs. In addition, in future simulations, weather can be incorporated as a ‘worst-case’ simulation scenario in which the wind blowing from source to receiver (downwind) is likely to result in higher noise levels at the receiver point compared to conditions without wind.
5. Conclusions
While landscape architects and urban designers may not be able to influence aircraft noise, they can manipulate the airport surroundings to mitigate it. This paper aimed to advance noise abatement through ground-forming supported by information technology. In contrast to conventional acoustic walls, the modulation of grounds offers the possibility of reducing noise while providing recreational public spaces. This coupling is not sufficiently sought after, despite the growing concern over increasing noise pollution levels and the importance of addressing them.
Finally, although this method was demonstrated in an airport area, it applies to other urban and transportation infrastructure types, such as highways. The method can also support other researchers in designing acoustic grounds or in addressing other environmental challenges, such as vibrations. Linking noise analysis, computational design, and simulations within the design environment can also help promote the longer-term goal of increasing environmental performance and advancing the design of performative grounds in landscape architecture and urban design.
Author Contributions
Conceptualization, K.L.B.-S., T.S. and B.B.; methodology, K.L.B.-S., T.S. and J.K.; software, T.S.; validation, Jochen Krimm.; formal analysis, T.S.; investigation, K.L.B.-S., T.S., and E.S.F.; resources, B.B.; data curation, K.L.B.-S. and E.S.F.; writing—original draft preparation, K.L.B.-S.; writing—review and editing, K.L.B.-S.; visualization, E.S.F.; supervision, K.L.B.-S. and B.B.; project administration, K.L.B.-S. and E.S.F.; funding acquisition, B.B. and K.L.B.-S. All authors have read and agreed to the published version of the manuscript.
Funding
This project has received funding from the European Union’s Horizon 2020 research and innovation programme under the Marie Skłodowska-Curie grant agreement No. 899987, as well as support through the ‘Project Weeks/Projektwochen’ the TUM Center for Study and Teaching, Technical University of Munich.
Data Availability Statement
The data presented in this study are available on request from the corresponding author.
Acknowledgments
The authors would like to thank the students of the two ‘Precision Landscapes’ seminars taught by the authors in the Summer and Winter semesters of 2022 and acknowledge the contribution of Ekaterina Pestriakova, Sharon Friedberg, and Liubov Kniazeva to the presented results. The authors would also like to thank Felix Will, Head of Noise and Noise Protection at Munich Airport, for his assistance and support regarding the environmental noise data.
Conflicts of Interest
The authors declare no conflict of interest.
References
- World Health Organization. Burden of Disease from Environmental Noise: Quantification of Healthy Life Years Lost in Europe; World Health Organization Regional Office for Europe: Copenhagen, Denmark, 2011. [Google Scholar]
- World Health Organization. Environmental Noise Guidelines for the European Region; World Health Organization Regional Office for Europe: Copenhagen, Denmark, 2018. [Google Scholar]
- Nugent, C.; Blanes, N.; Fons, J.; Sainz, M.; Ramos, M.; Domingues, F.; van Beek, A.; Houthuijs, D. Noise in Europe 2014; Publications Office of the European Union: Luxembourg, 2014. [Google Scholar]
- Peris, E. Environmental Noise in Europe—2020; Publications Office of the European Union: Luxembourg, 2020. [Google Scholar]
- Boucsein, B.; Christiaanse, K.; Kasioumi, E.; Salewski, C. The Noise Landscape: A Spatial Exploration of Airports and Cities; nai010 Publishers: Rotterdam, The Netherlands, 2017. [Google Scholar]
- Kasioumi, E. Emerging Planning Approaches in Airport Areas: The Case of Paris-Charles de Gaulle (CDG). Reg. Stud. Reg. Sci. 2015, 2, 408–414. [Google Scholar] [CrossRef]
- Ang, L.Y.L.; Cui, F. Remote Work: Aircraft Noise Implications, Prediction, and Management in the Built Environment. Appl. Acoust. 2022, 198, 108978. [Google Scholar] [CrossRef] [PubMed]
- Niesten, J.; Tenpierik, M.J.; Krimm, J. Sound Predictions in an Urban Context. Build. Acoust. 2022, 29, 27–52. [Google Scholar] [CrossRef]
- Morillas, J.M.B.; Gozalo, G.R.; González, D.M.; Moraga, P.A.; Vílchez-Gómez, R. Noise Pollution and Urban Planning. Curr. Pollut. Rep. 2018, 4, 208–219. [Google Scholar] [CrossRef]
- Cantrell, B.E.; Mekies, A. Codify: Parametric and Computational Design in Landscape Architecture; Routledge: New York, NY, USA; Taylor & Francis Group: London, UK, 2018. [Google Scholar]
- Bar-Sinai, K.L.; Alon-Mozes, T.; Sprecher, A. Editing Landscapes: Experimental Frameworks for Territorial-Based Robotic Fabrication. Front. Archit. Res. 2022. [CrossRef]
- Lenzholzer, S.; Duchhart, I.; Koh, J. ‘Research through Designing’ in Landscape Architecture. Landsc. Urban Plan 2013, 113, 120–127. [Google Scholar] [CrossRef]
- Moosavi, S. Design Experimentation for Nature-based Solutions: Towards a Definition and Taxonomy. Environ. Sci. Policy 2022, 138, 149–161. [Google Scholar] [CrossRef]
- Vomhof, M.; Vasey, L.; Brauer, S.; Eggenschwiler, K.; Strauss, J.; Gramazio, F.; Kohler, M. Robotic Fabrication of Acoustic Brick Walls. In Proceedings of the 34th Annual Conference of the Association for Computer-Aided Design in Architecture (ACADIA 2014), Los Angeles, CA, USA, 23–25 October 2014; pp. 555–564. [Google Scholar]
- Hauberg, J.; Tamke, M.; Thomsen, M.R. Research by Design-a Research and Teaching Concept. In Proceedings of the Conference Theory by Design: Architectural Research Made Explicit in the Design Teaching Studio, Antwerpen, Belgium, 29–31 October 2012; pp. 335–342. [Google Scholar]
- United Nations. Glossary of Environment Statistics, Studies in Methods; Series F; United Nations: New York, NY, USA, 1997. [Google Scholar]
- Bartolomaeus, W. Richtlinien Für Den Lärmschutz an Straßen-RLS19. Lärmbekämpfung 2019, 14. [Google Scholar] [CrossRef]
- Isermann, U.; Vogelsang, B. AzB and ECAC Doc.29—Two Best-Practice European Aircraft Noise Prediction Models. Noise Control. Eng. J. 2010, 58, 455. [Google Scholar] [CrossRef]
- European Commission. Directive 2002/49/EC of the European Parliament and the Council of 25 June 2002 Relating to the Assessment and Management of Environmental Noise. Off. J. Eur. Communities 2002, 189, 2002. [Google Scholar]
- Federal Aviation Administration. The FAR Part 150 Airport Noise Compatibility Planning Programm. Available online: www.faa.gov/about/office_org/headquarters_offices/apl/noise_emissions/planning_toolkit/media/II.B.pdf (accessed on 15 November 2022).
- EN ISO 717-1:2020; Acoustics—Rating of Sound Insulation in Buildings and of Building Elements—Part 1: Airborne Sound Insulation (ISO 717-1:2020). ISO: Geneva, Switzerland, 2021. Available online: https://www.beuth.de/de/norm/din-en-iso-717-1/329418506 (accessed on 20 December 2022).
- EN ISO 16283-3:2016; Acoustics—Field Measurement of Sound Insulation in Buildings and of Building Elements—Part 3: Façade Sound Insulation (ISO 16283-3:2016). ISO: Geneva, Switzerland, 2016. Available online: https://www.beuth.de/de/norm/din-en-iso-16283-3/240093697 (accessed on 20 December 2022).
- Maekawa, Z.; Rindel, J.; Lord, P. Environmental and Architectural Acoustics; CRC Press: Boca Raton, FL, USA, 2010. [Google Scholar]
- Netjasov, F. Contemporary Measures for Noise Reduction in Airport Surroundings. Appl. Acoust. 2012, 73, 1076–1085. [Google Scholar] [CrossRef]
- Sorvig, K.; Thompson, J.W. Quietly Defend Silence. In Sustainable Landscape Construction: A Guide to Green Building Outdoors; Sorvig, K., Thompson, J.W., Eds.; Island Press/Center for Resource Economics: Washington, DC, USA, 2018; pp. 363–372. [Google Scholar]
- Schiphol Airport Website. Landscape Design Plan to Combat Noise Nuisance. Available online: https://www.schiphol.nl/en/schiphol-as-a-neighbour/page/landscape-design-plan-to-combat-noise-nuisance/ (accessed on 14 November 2022).
- Lugten, M. Tranquillity by Design—Architectural and Landscape Interventions to Improve the Soundscape Quality in Urban Areas Exposed to Aircraft Noise. Doctoral Dissertation, University of Cambridge, Cambridge, UK, 2019. [Google Scholar]
- Walliss, J.; Rahmann, H. Landscape Architecture and Digital Technologies: Re-Conceptualising Design and Making; Routledge: Abingdon, UK, 2016. [Google Scholar]
- Bar-Sinai, K.L.; Shaked, T.; Sprecher, A. Informing Grounds: Robotic Sand-Forming Simulating Remote Autonomous Lunar Groundscaping. In ACADIA 2019: Ubiquity and Autonomy, Proceedings of the 39th Annual Conference of the Association for Computer Aided Design in Architecture (ACADIA); The University of Texas: Austin, TX, USA, 2019; pp. 258–265. ISBN 978-0-578-59179-7. Available online: http://papers.cumincad.org/data/works/att/acadia19_258.pdf (accessed on 14 November 2022).
- Sakuma, T.; Sakamoto, S.; Otsuru, T. Computational Simulation in Architectural and Environmental Acoustics; Springer: Berlin/Heidelberg, Germany, 2014. [Google Scholar]
- van der Harten, A. Pachyderm Acoustical Simulation: Towards Open-Source Sound Analysis. Archit. Des. 2013, 83, 138–139. [Google Scholar] [CrossRef]
- Peters, B. Integrating Acoustic Simulation in Architectural Design Workflows: The FabPod Meeting Room Prototype. Simulation 2015, 91, 787–808. [Google Scholar] [CrossRef]
- Flughafen München GmbH. Air Quality Measurements. Available online: https://www.munich-airport.com/air-quality-measurements-4910011 (accessed on 14 November 2022).
- Kanjo, E. NoiseSPY: A Real-Time Mobile Phone Platform for Urban Noise Monitoring and Mapping. Mob. Netw. Appl. 2010, 15, 562–574. [Google Scholar] [CrossRef]
- Murphy, E.; King, E.A. Smartphone-Based Noise Mapping: Integrating Sound Level Meter App Data into the Strategic Noise Mapping Process. Sci. Total Environ. 2016, 562, 852–859. [Google Scholar] [CrossRef] [PubMed]
- Murphy, E.; King, E.A. Testing the Accuracy of Smartphones and Sound Level Meter Applications for Measuring Environmental Noise. Appl. Acoust. 2016, 106, 16–22. [Google Scholar] [CrossRef]
- McLennon, T.; Patel, S.; Behar, A.; Abdoli-Eramaki, M. Evaluation of Smartphone Sound Level Meter Applications as a Reliable Tool for Noise Monitoring. J. Occup. Environ. Hyg. 2019, 16, 620–627. [Google Scholar] [CrossRef] [PubMed]
- Alberola, J. Predicting Variability in Environmental Noise Measurements; University of Southampton: Southampton, UK, 2005. [Google Scholar]
- Cox, H. Linear versus Logarithmic Averaging. J. Acoust. Soc. Am. 1966, 39, 688–690. [Google Scholar] [CrossRef]
- Die Geschichte Hallbergmoos. Available online: https://www.hallbergmoos.de/buerger/leben-in-hallbergmoos/hallbergmoos/geschichte (accessed on 15 November 2022).
- Moomaw, W.R.; Chmura, G.L.; Davies, G.T.; Finlayson, C.M.; Middleton, B.A.; Natali, S.M.; Perry, J.E.; Roulet, N.; Sutton-Grier, A.E. Wetlands In a Changing Climate: Science, Policy and Management. Wetlands 2018, 38, 183–205. [Google Scholar] [CrossRef]
- Boschert, S.; Rosen, R. Digital Twin—the Simulation Aspect. In Mechatronic Futures; Springer: Berlin/Heidelberg, Germany, 2016; pp. 59–74. [Google Scholar]
- Bennett, R.L.; Bolt Beranek, K.S. Handbook of Aircraft Noise Metrics; NASA Scientific and Technical Information Branch; National Technical Information Service, U.S, Department of Commerce: Springfield, VA, USA, 1981.
- Lugten, M.; Karacaoglu, M.; White, K.; Kang, J.; Steemers, K. Improving the Soundscape Quality of Urban Areas Exposed to Aircraft Noise by Adding Moving Water and Vegetation. J. Acoust. Soc. Am. 2018, 144, 2906. [Google Scholar] [CrossRef] [PubMed]
- Zaporozhets, O.; Tokarev, V.; Attenborough, K. Aircraft Noise: Assessment, Prediction and Control; CRC Press: Boca Raton, FL, USA, 2011. [Google Scholar]
- Aumond, P.; Fortin, N.; Can, A. Overview of the Noise Modelling Open-Source Software Version 3 and Its Applications. In Proceedings of the Inter-Noise and Noise-Congress and Conference Proceedings, Seoul, Korea, 23–26 August 2020; Volume 261, pp. 2005–2011. [Google Scholar]


Disclaimer/Publisher’s Note: The statements, opinions and data contained in all publications are solely those of the individual author(s) and contributor(s) and not of MDPI and/or the editor(s). MDPI and/or the editor(s) disclaim responsibility for any injury to people or property resulting from any ideas, methods, instructions or products referred to in the content. |
© 2023 by the authors. Licensee MDPI, Basel, Switzerland. This article is an open access article distributed under the terms and conditions of the Creative Commons Attribution (CC BY) license (https://creativecommons.org/licenses/by/4.0/).