Early-Stage Temperature Gradients in Glazed Spandrels Due to Aesthetical Features to Support Design for Thermal Shock


Abstract
1. Introduction
2. Materials and Methods
2.1. Materials
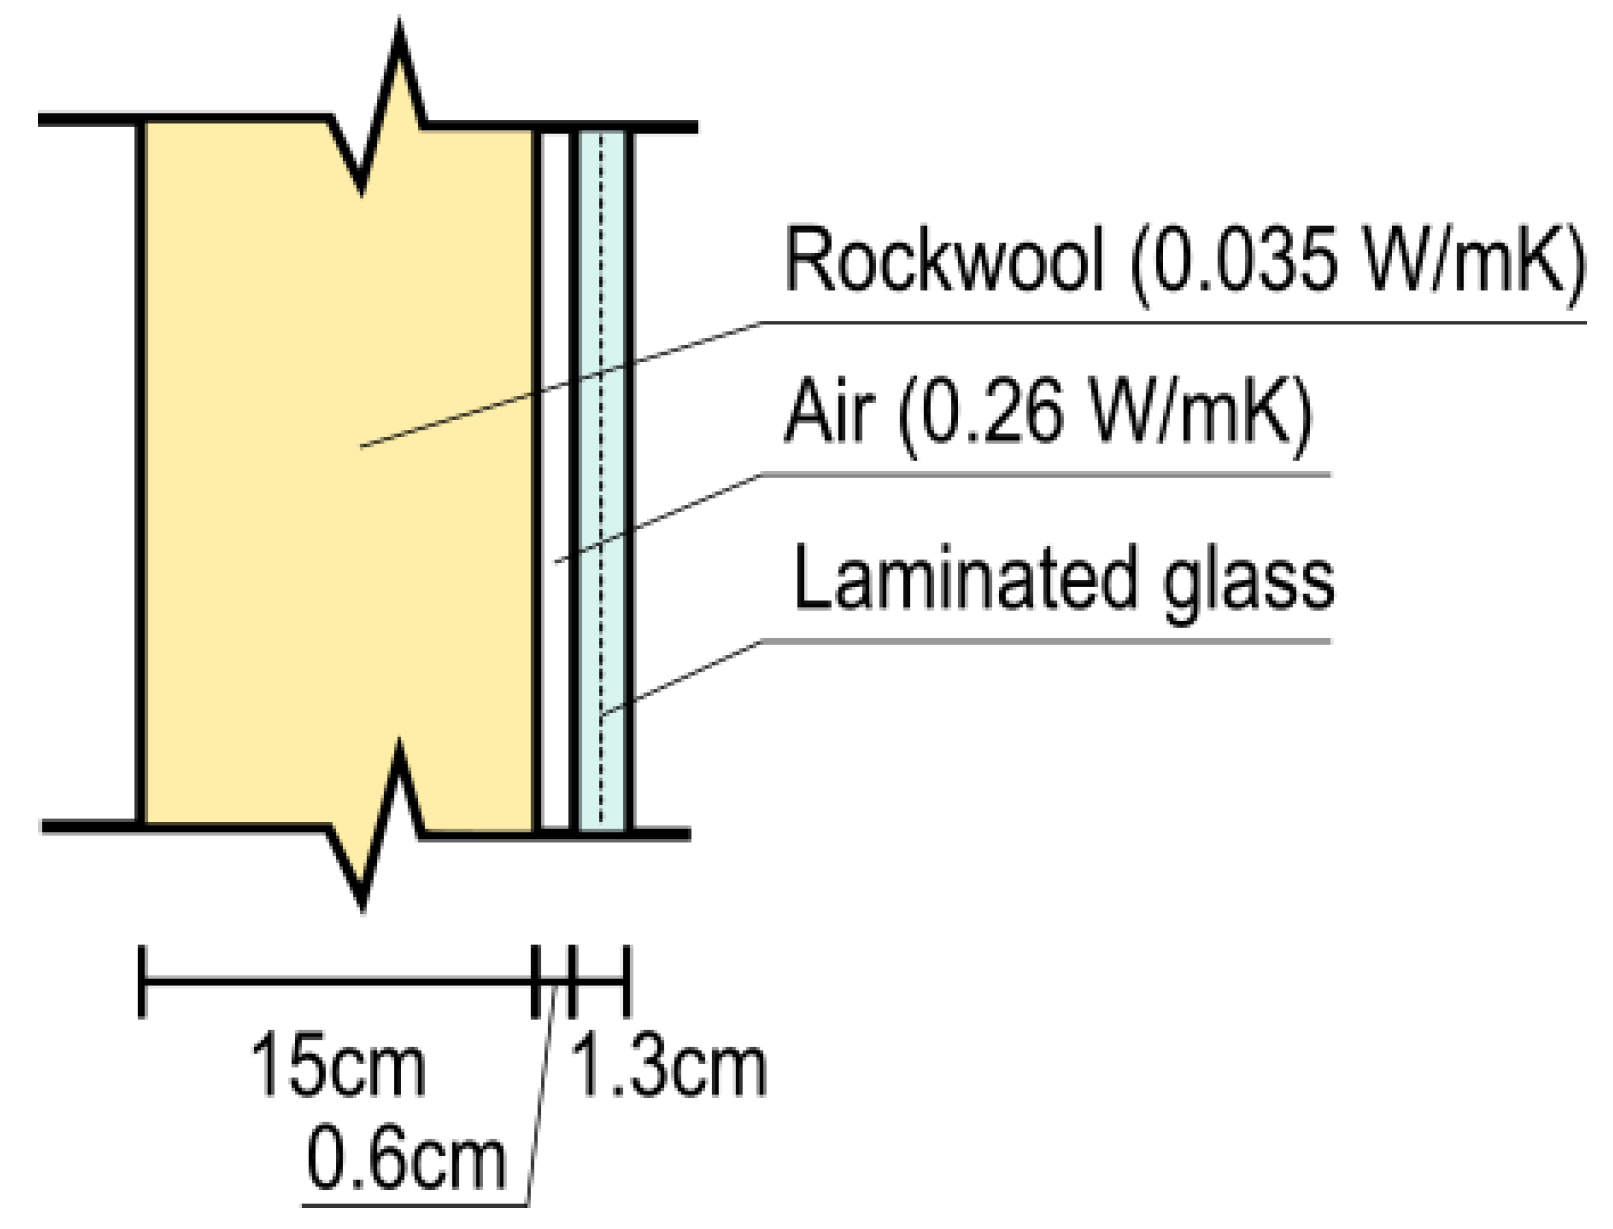
2.1.1. Spandrel Build-Up
2.1.2. Environmental Conditions
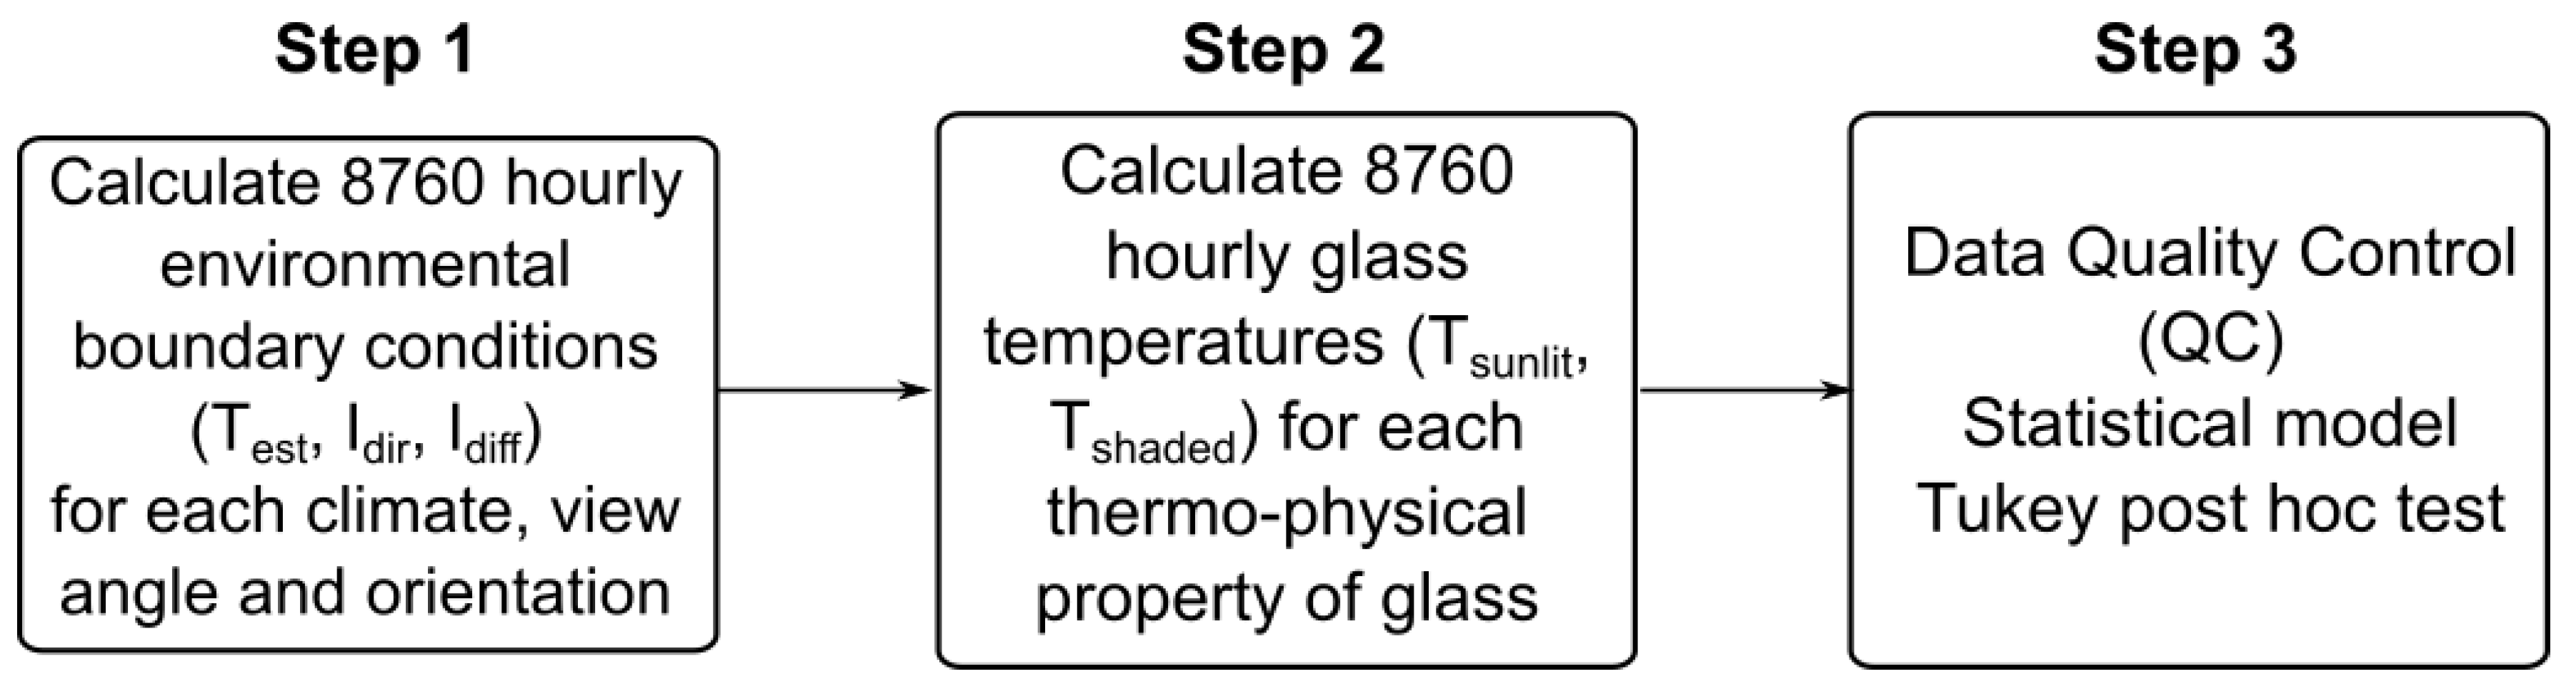
2.2. Methods
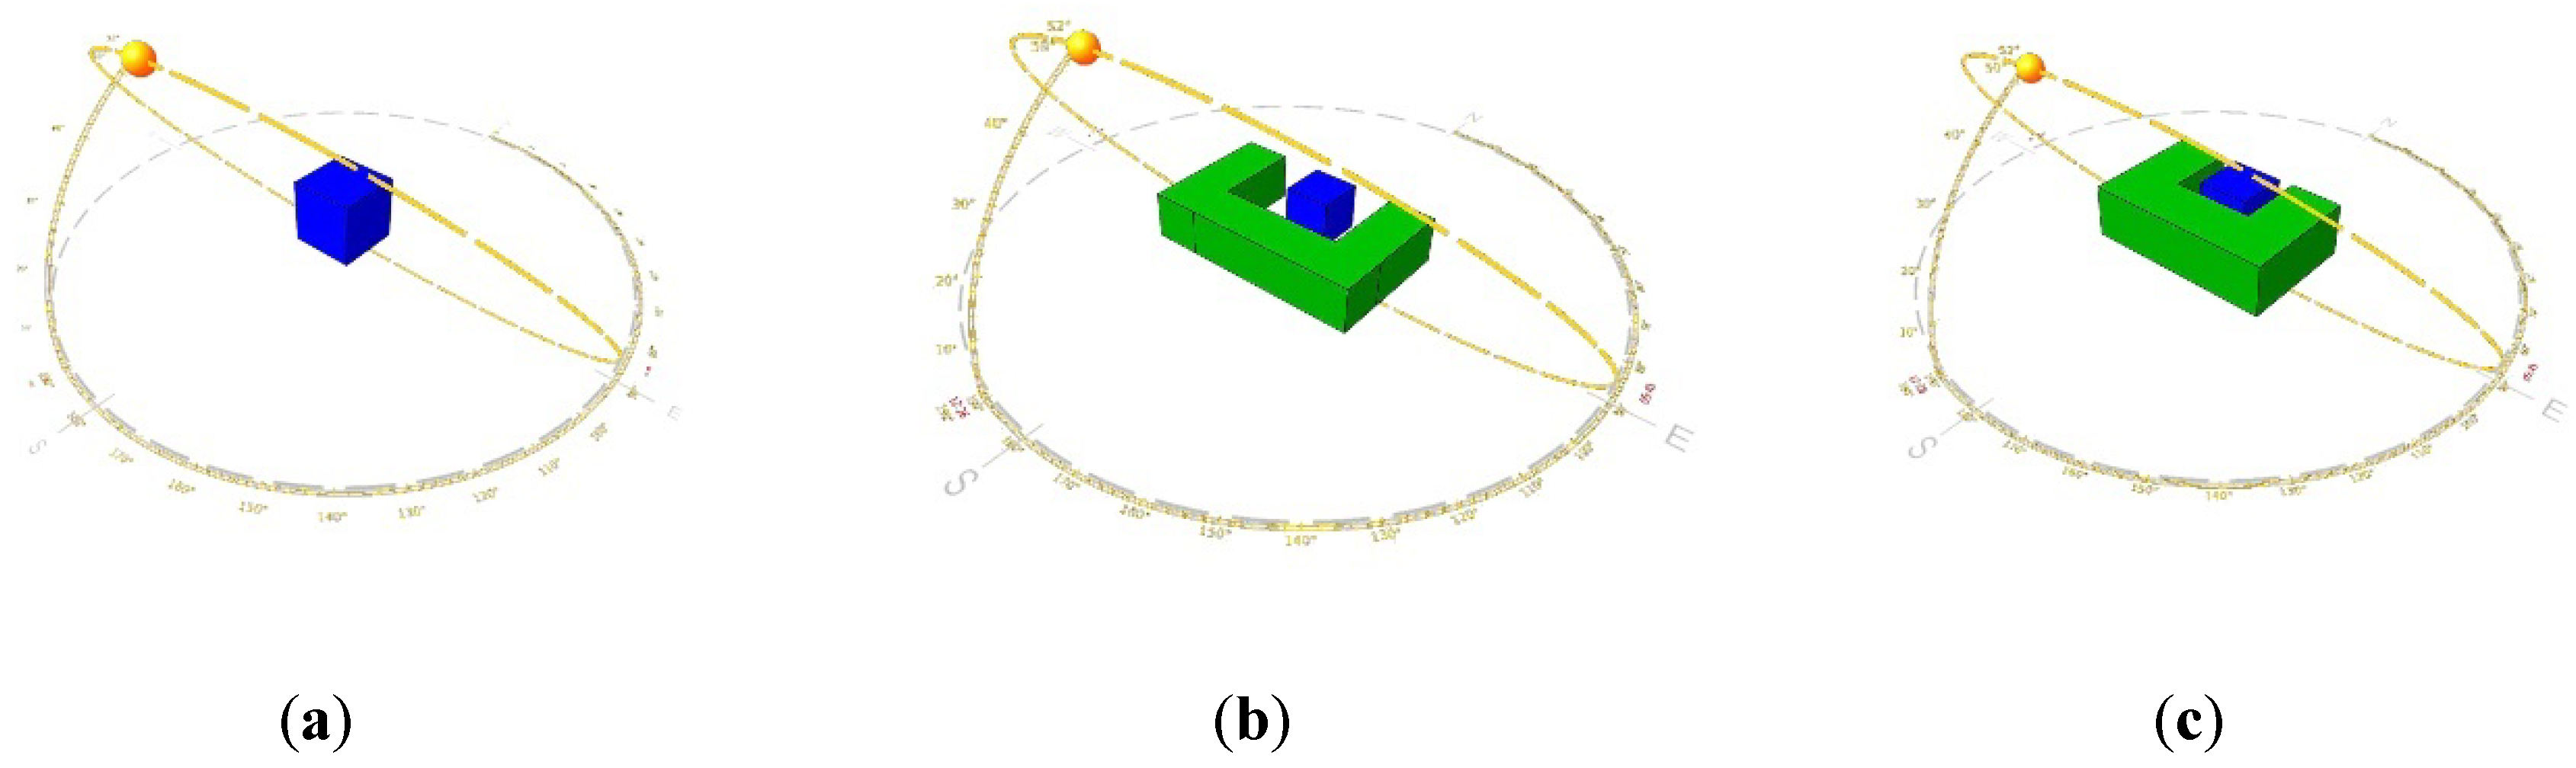
2.2.1. Step 1: Hourly Environmental Conditions
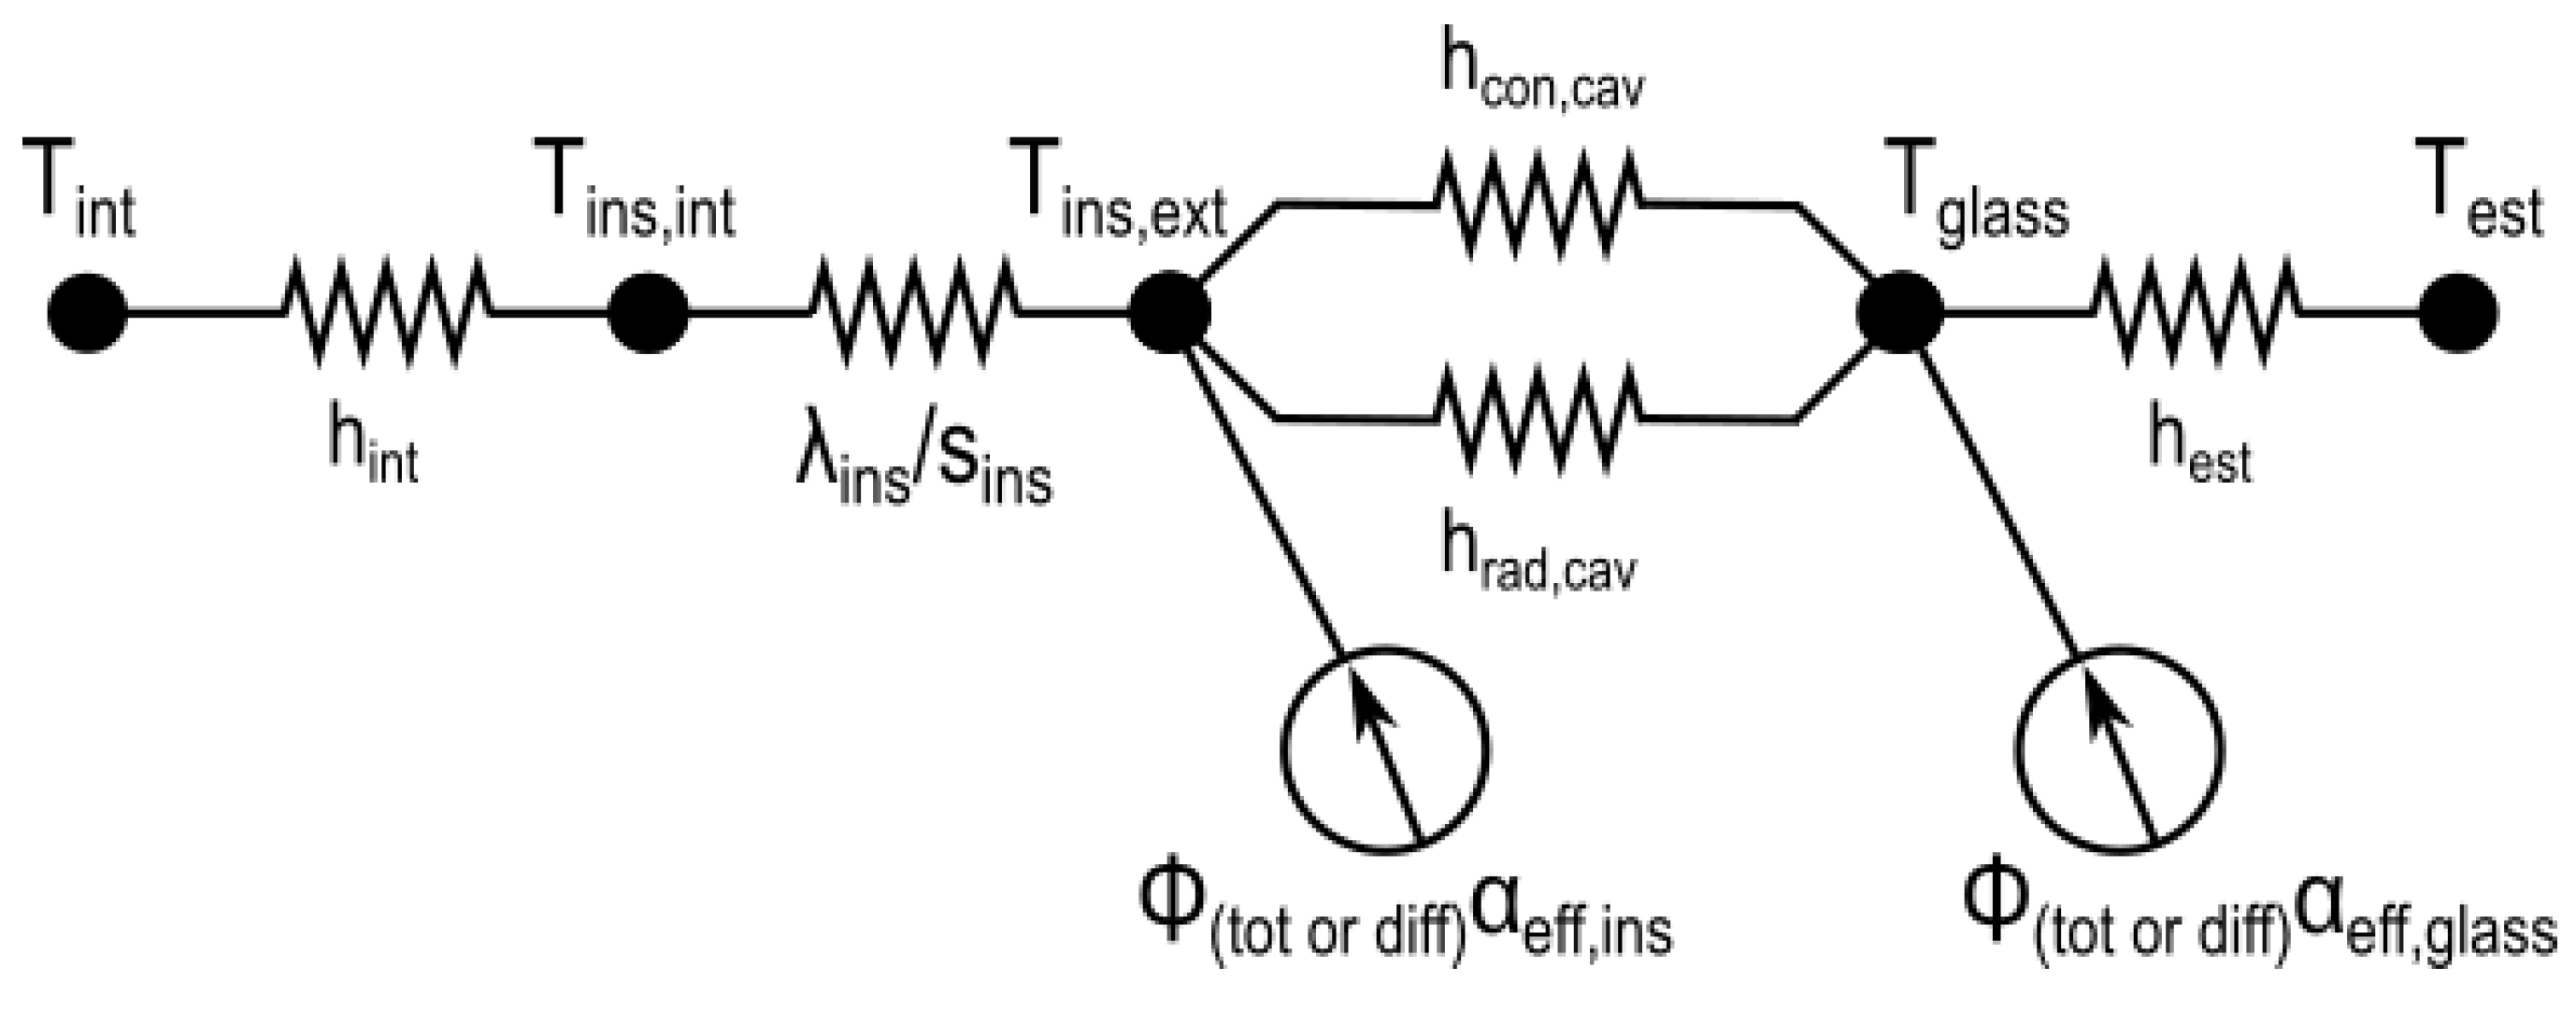
2.2.2. Step 2: Hourly Glass Temperatures
2.2.3. Step 3: Data Analysis
3. Results
3.1. Maximum Temperature Gradients and Relevant Thermal Stresses
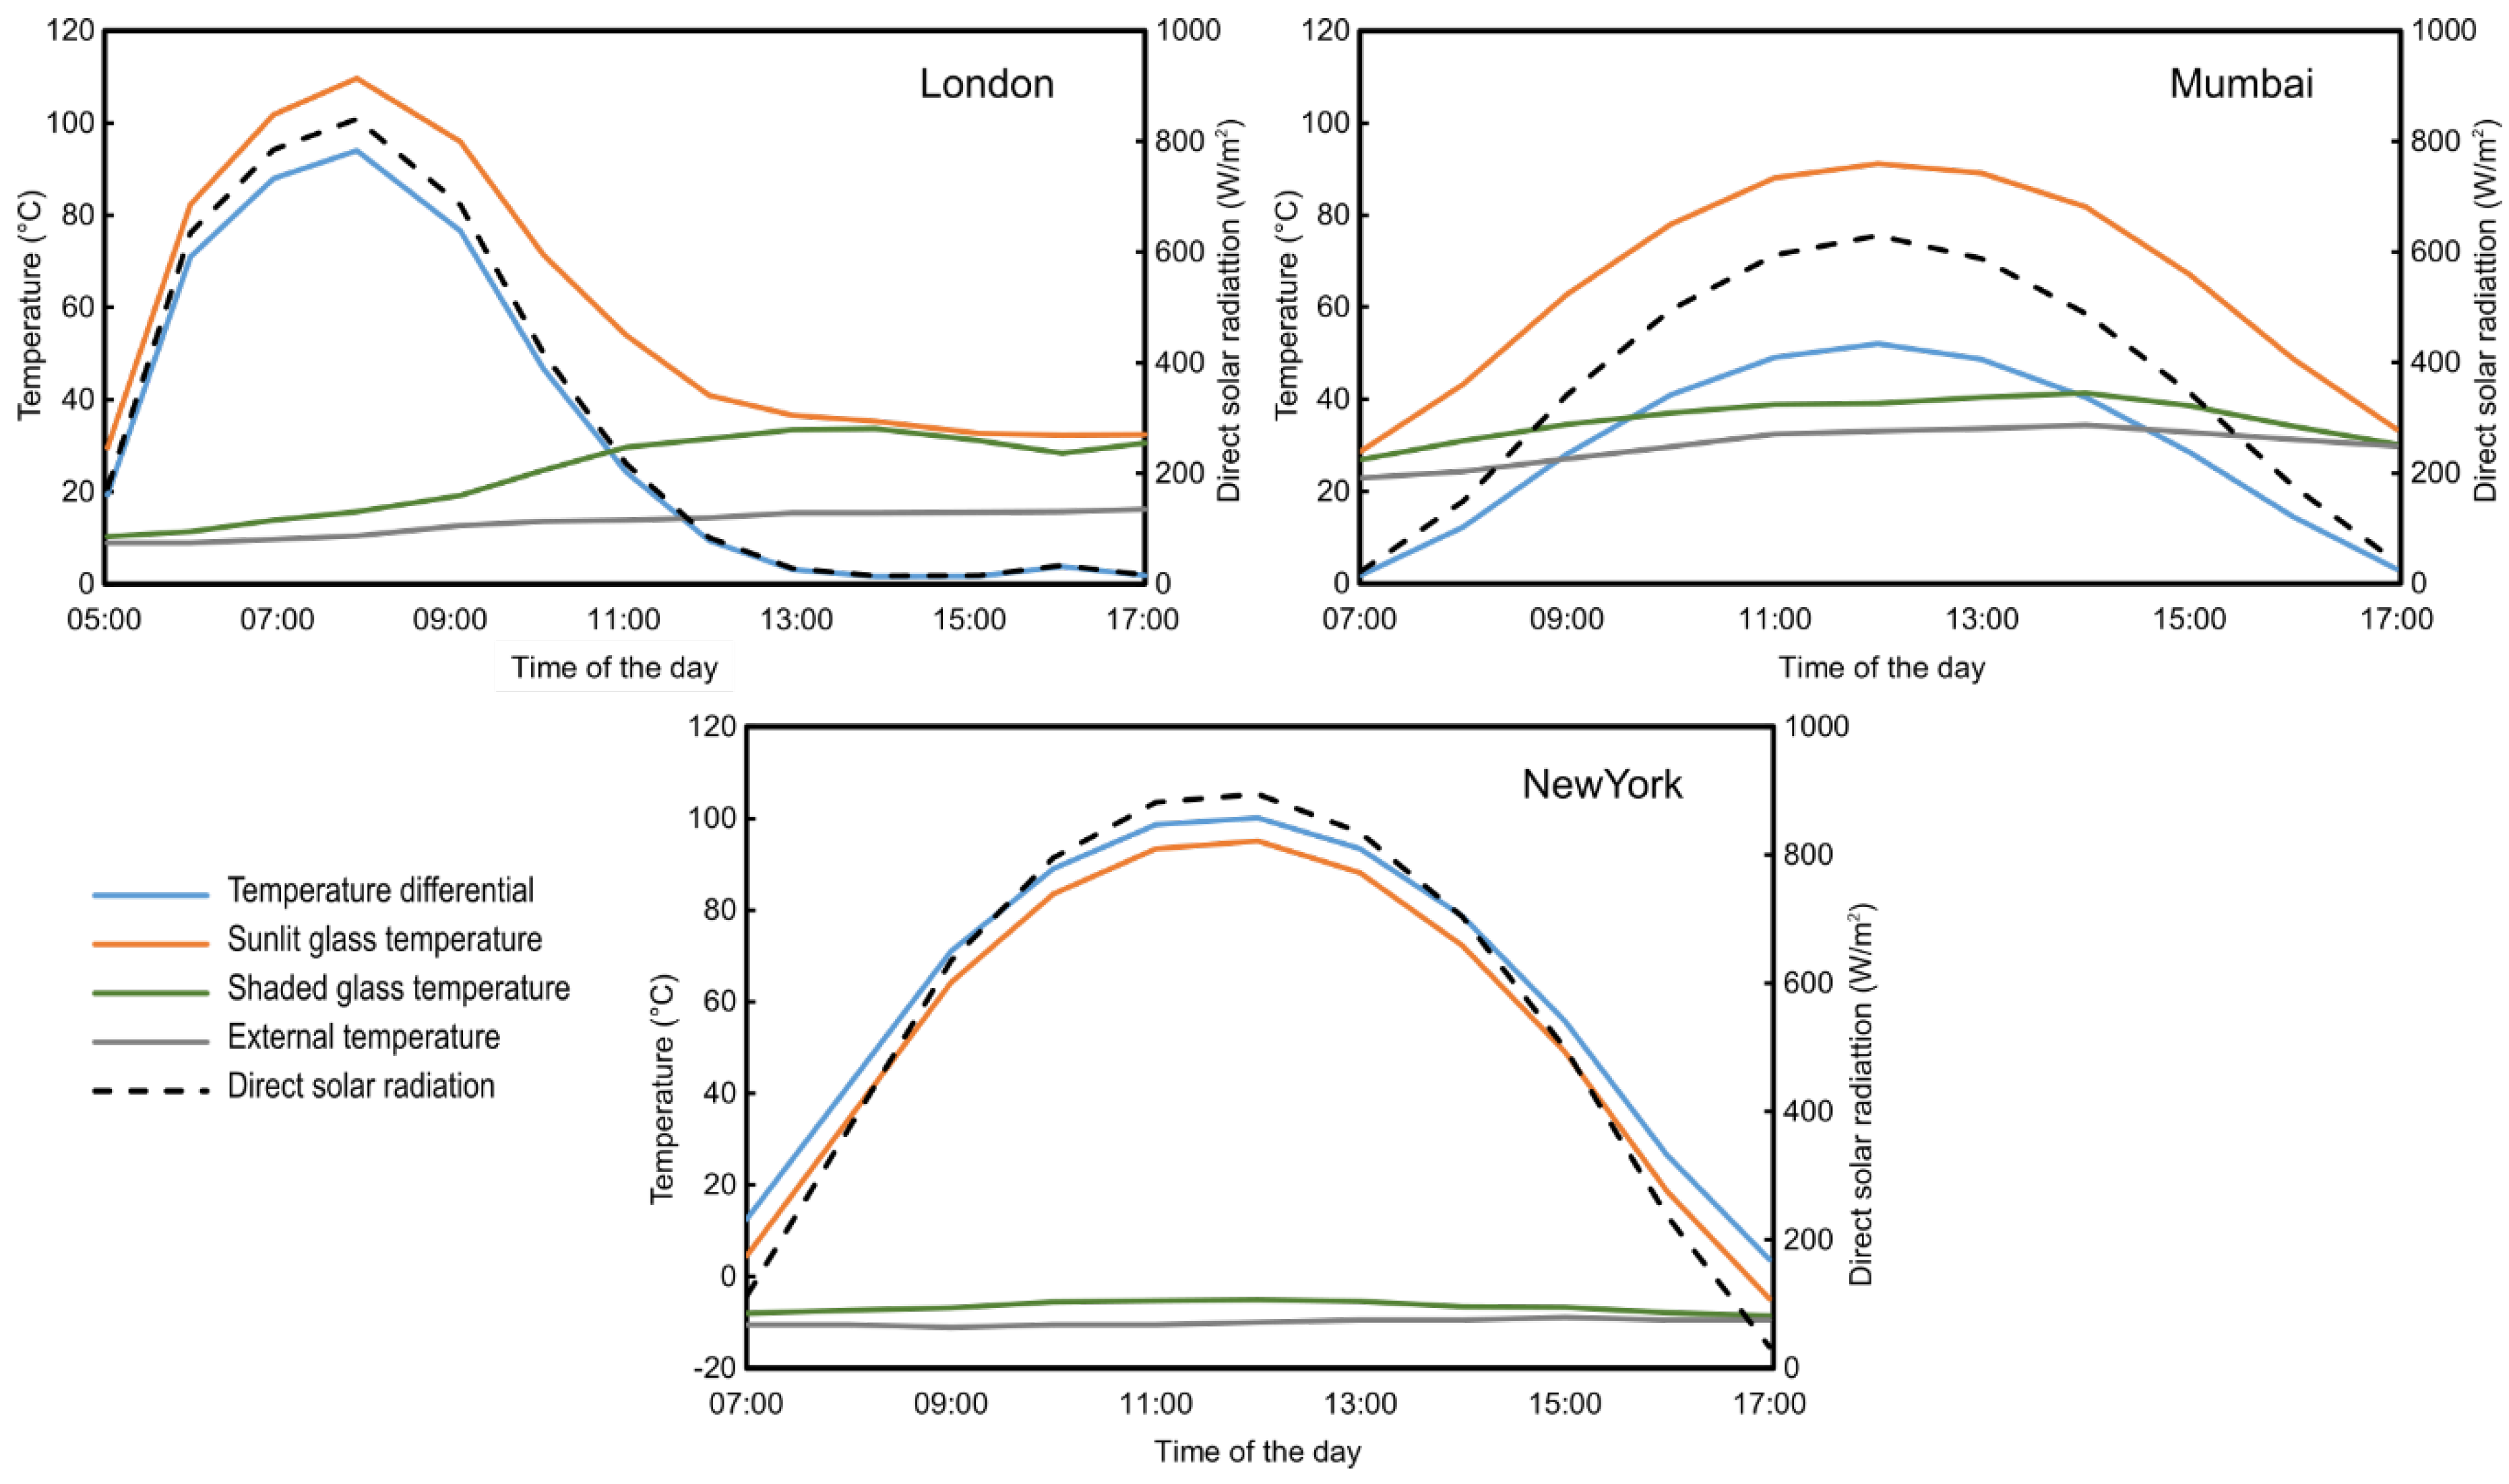
3.2. Temperatures of the Shaded and Sunlit Parts of the Glass at Peak Conditions the Worst Combination of Insulation and Glass Types
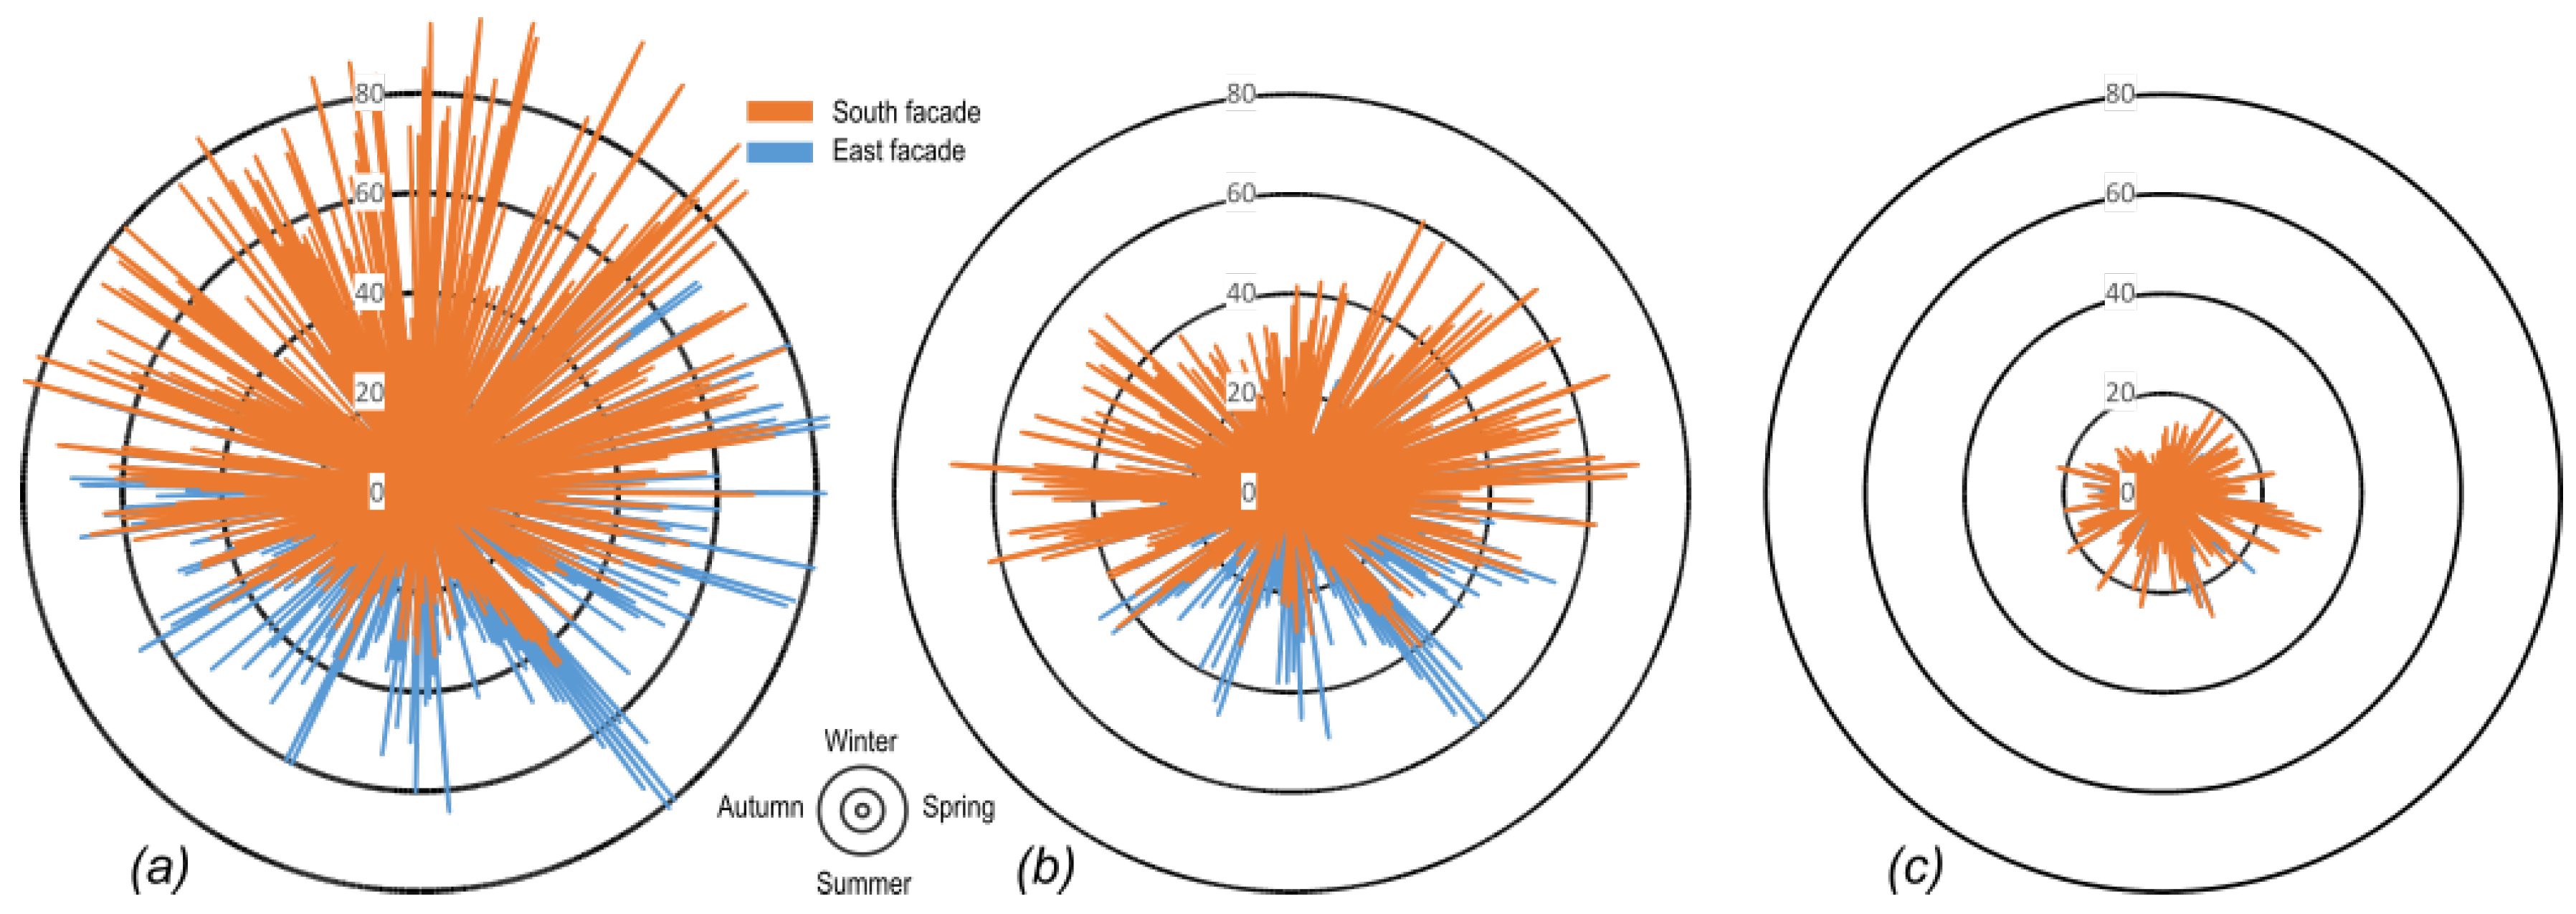
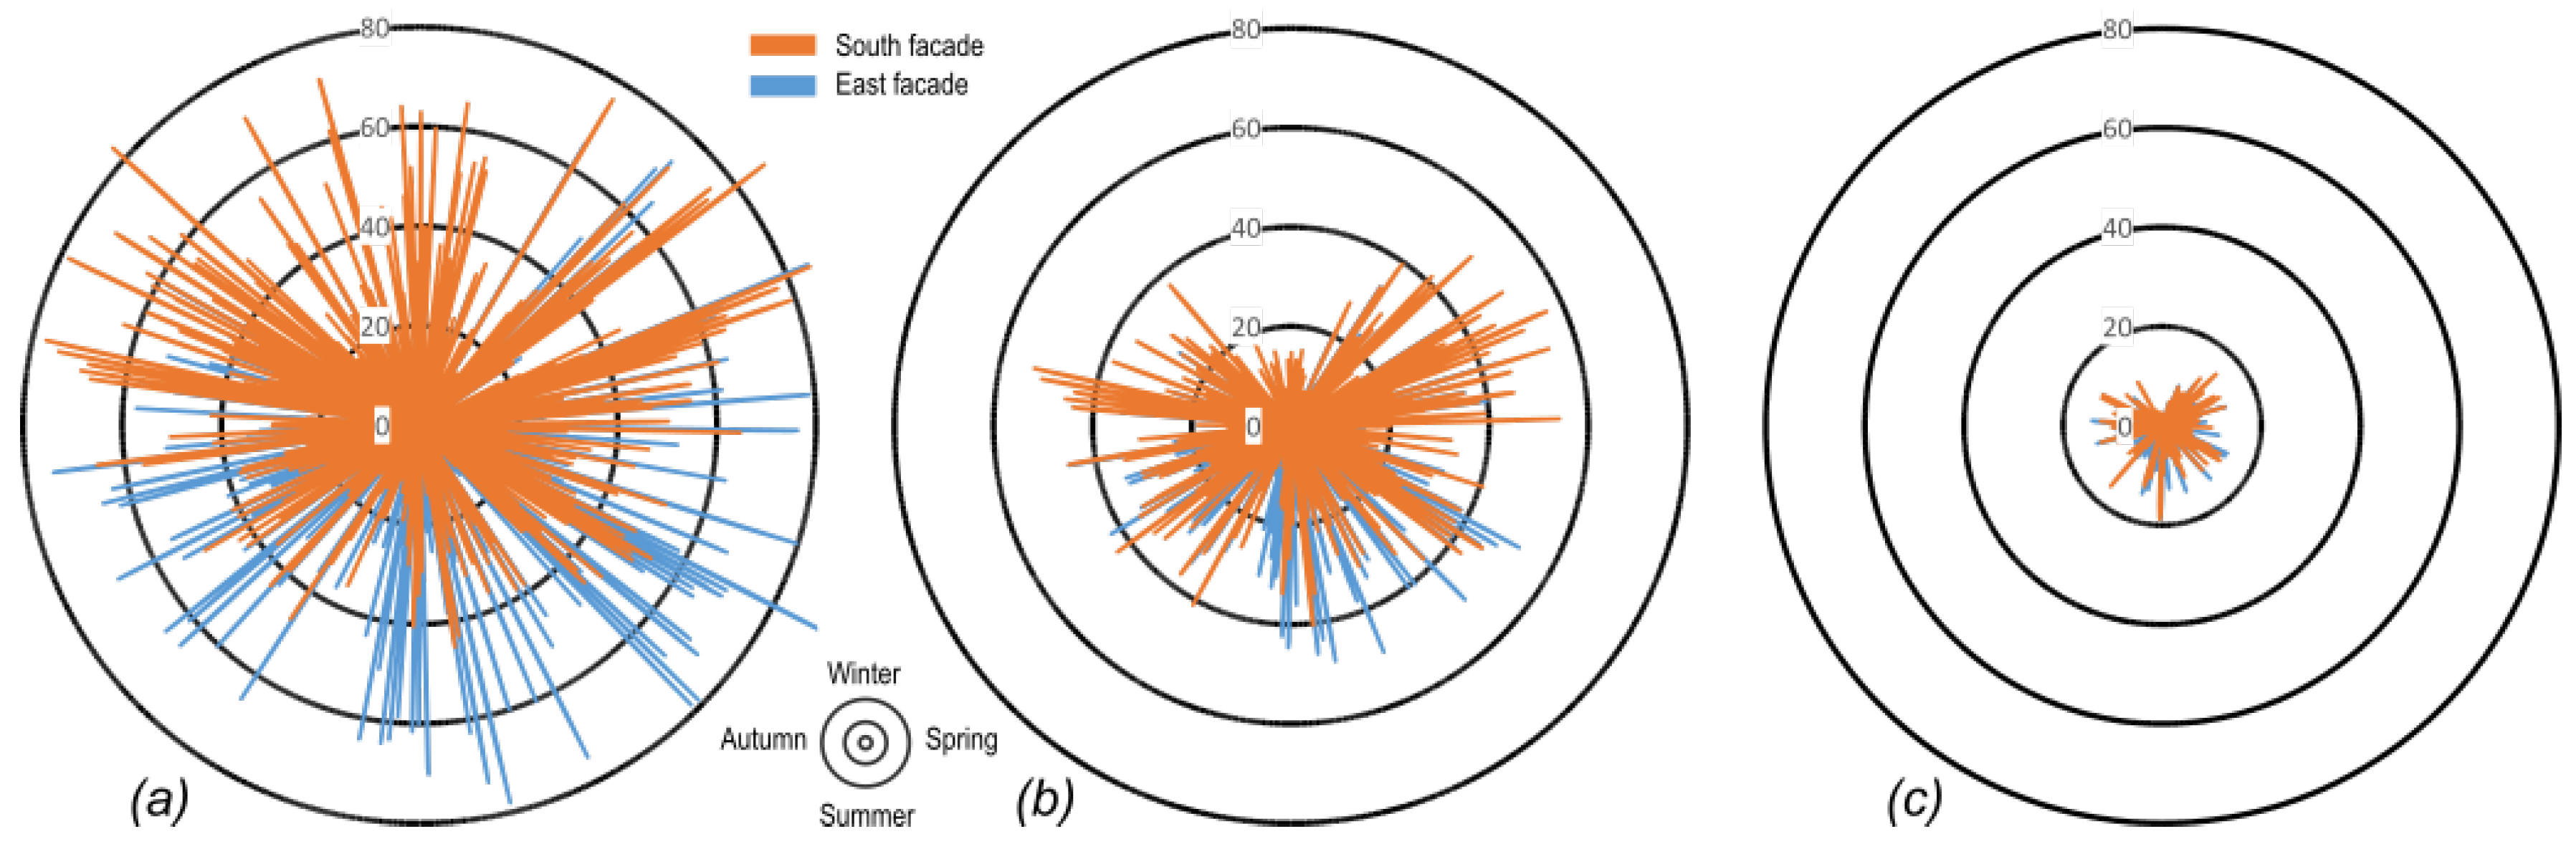
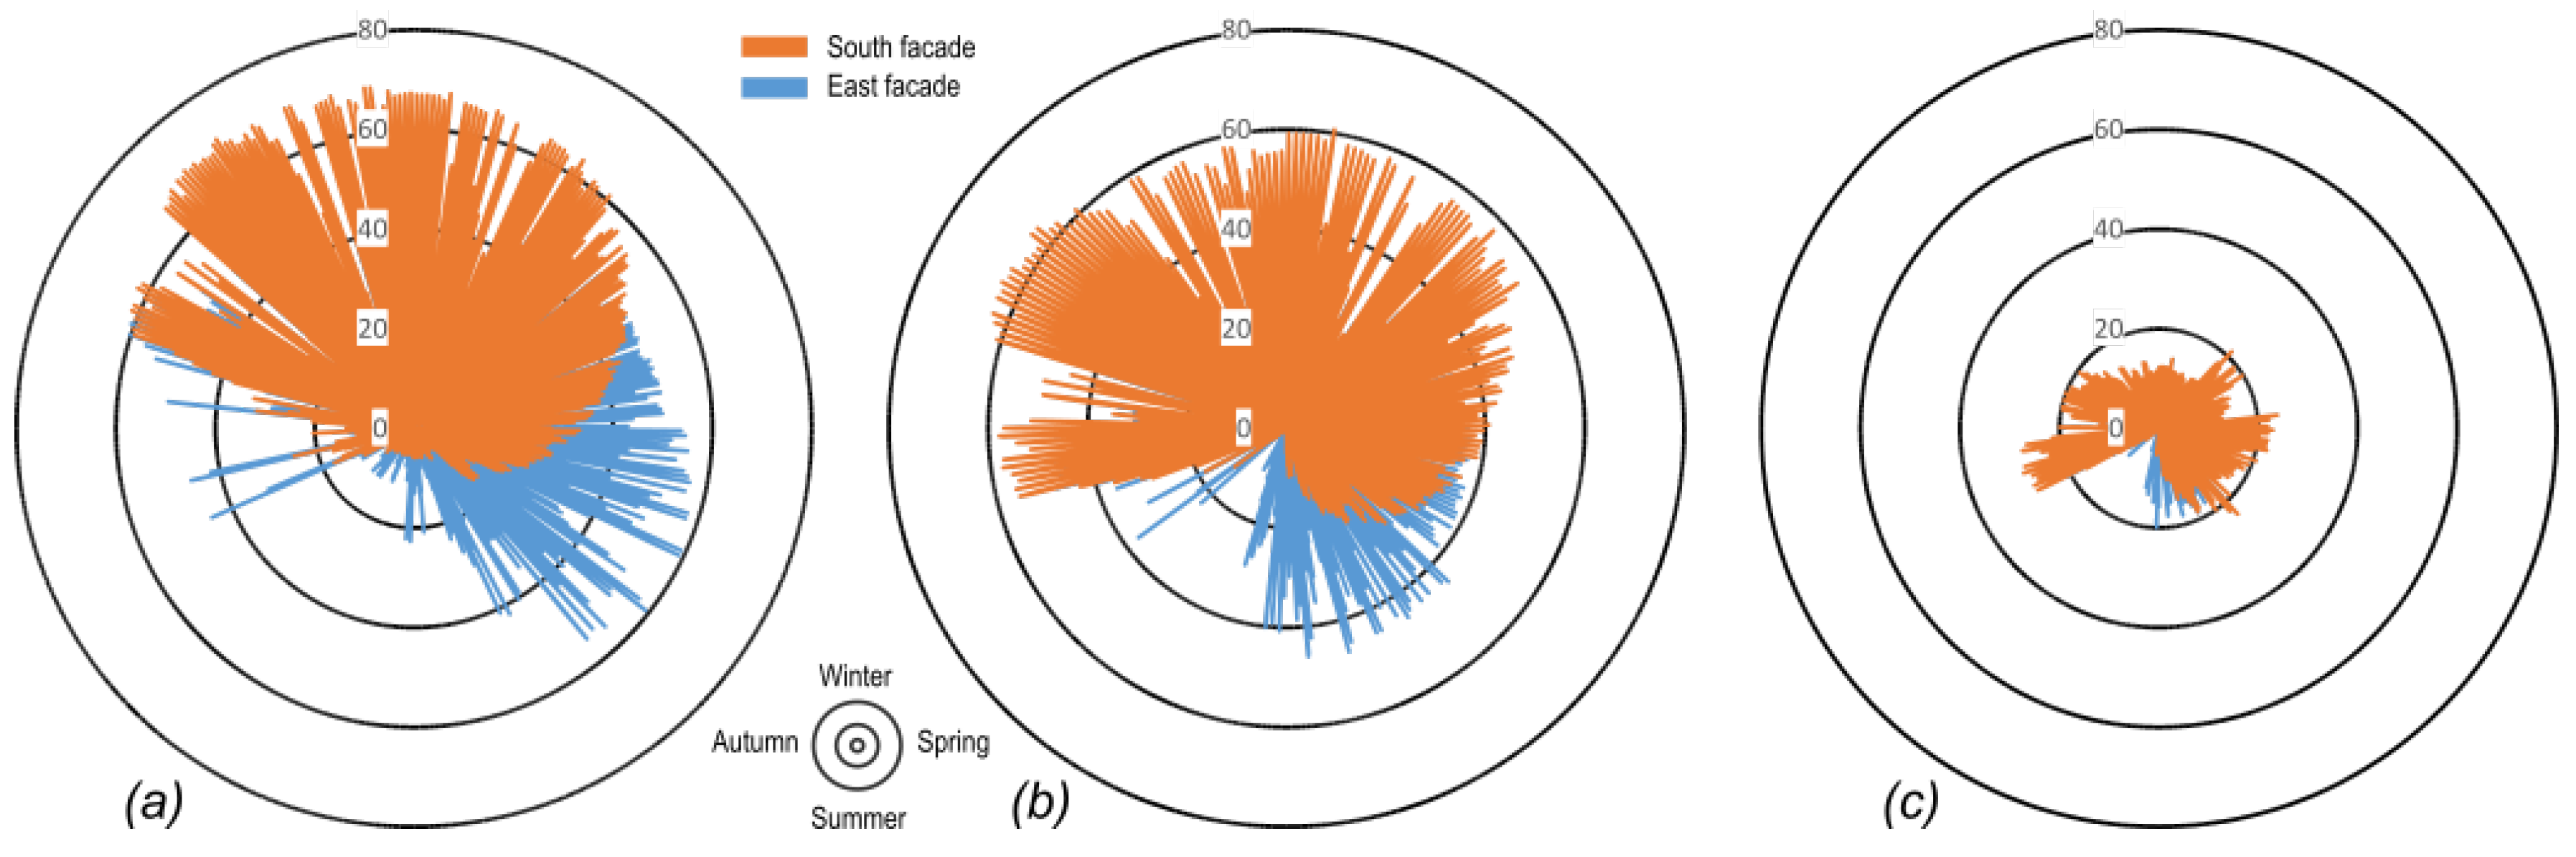
3.3. Thermal Stress Variation across the Year for the Worst Combination of Insulation and Glass Types
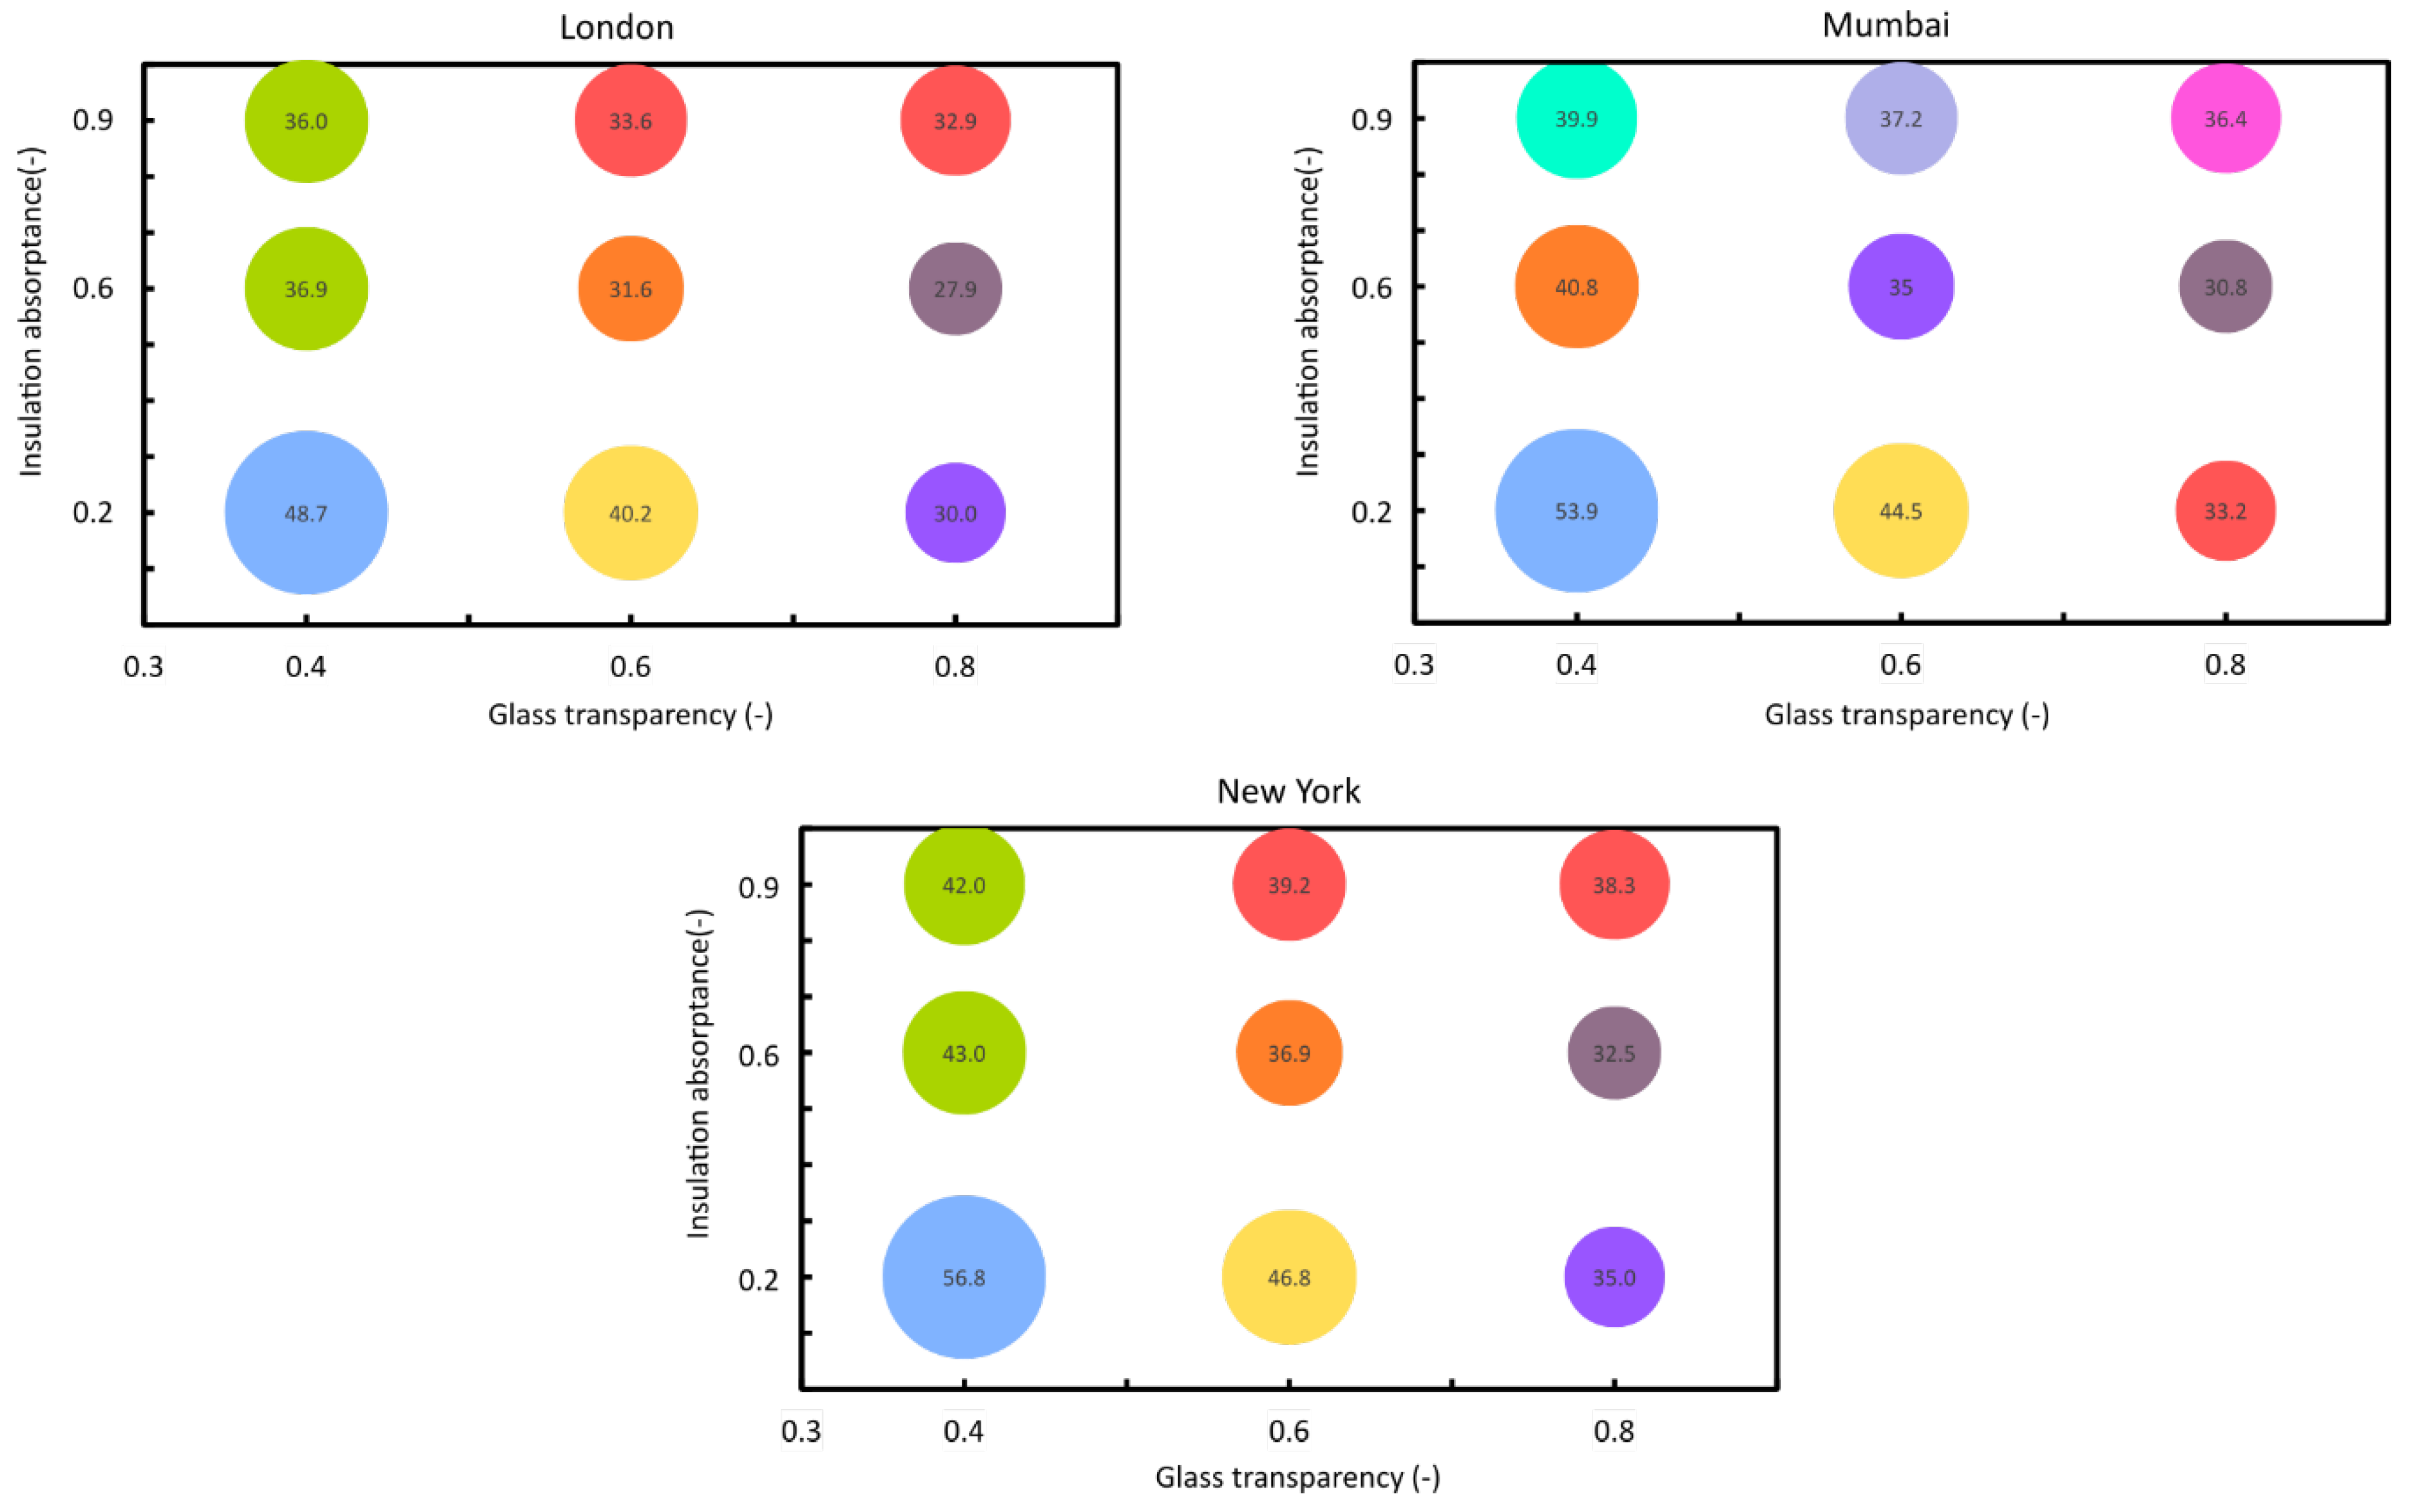
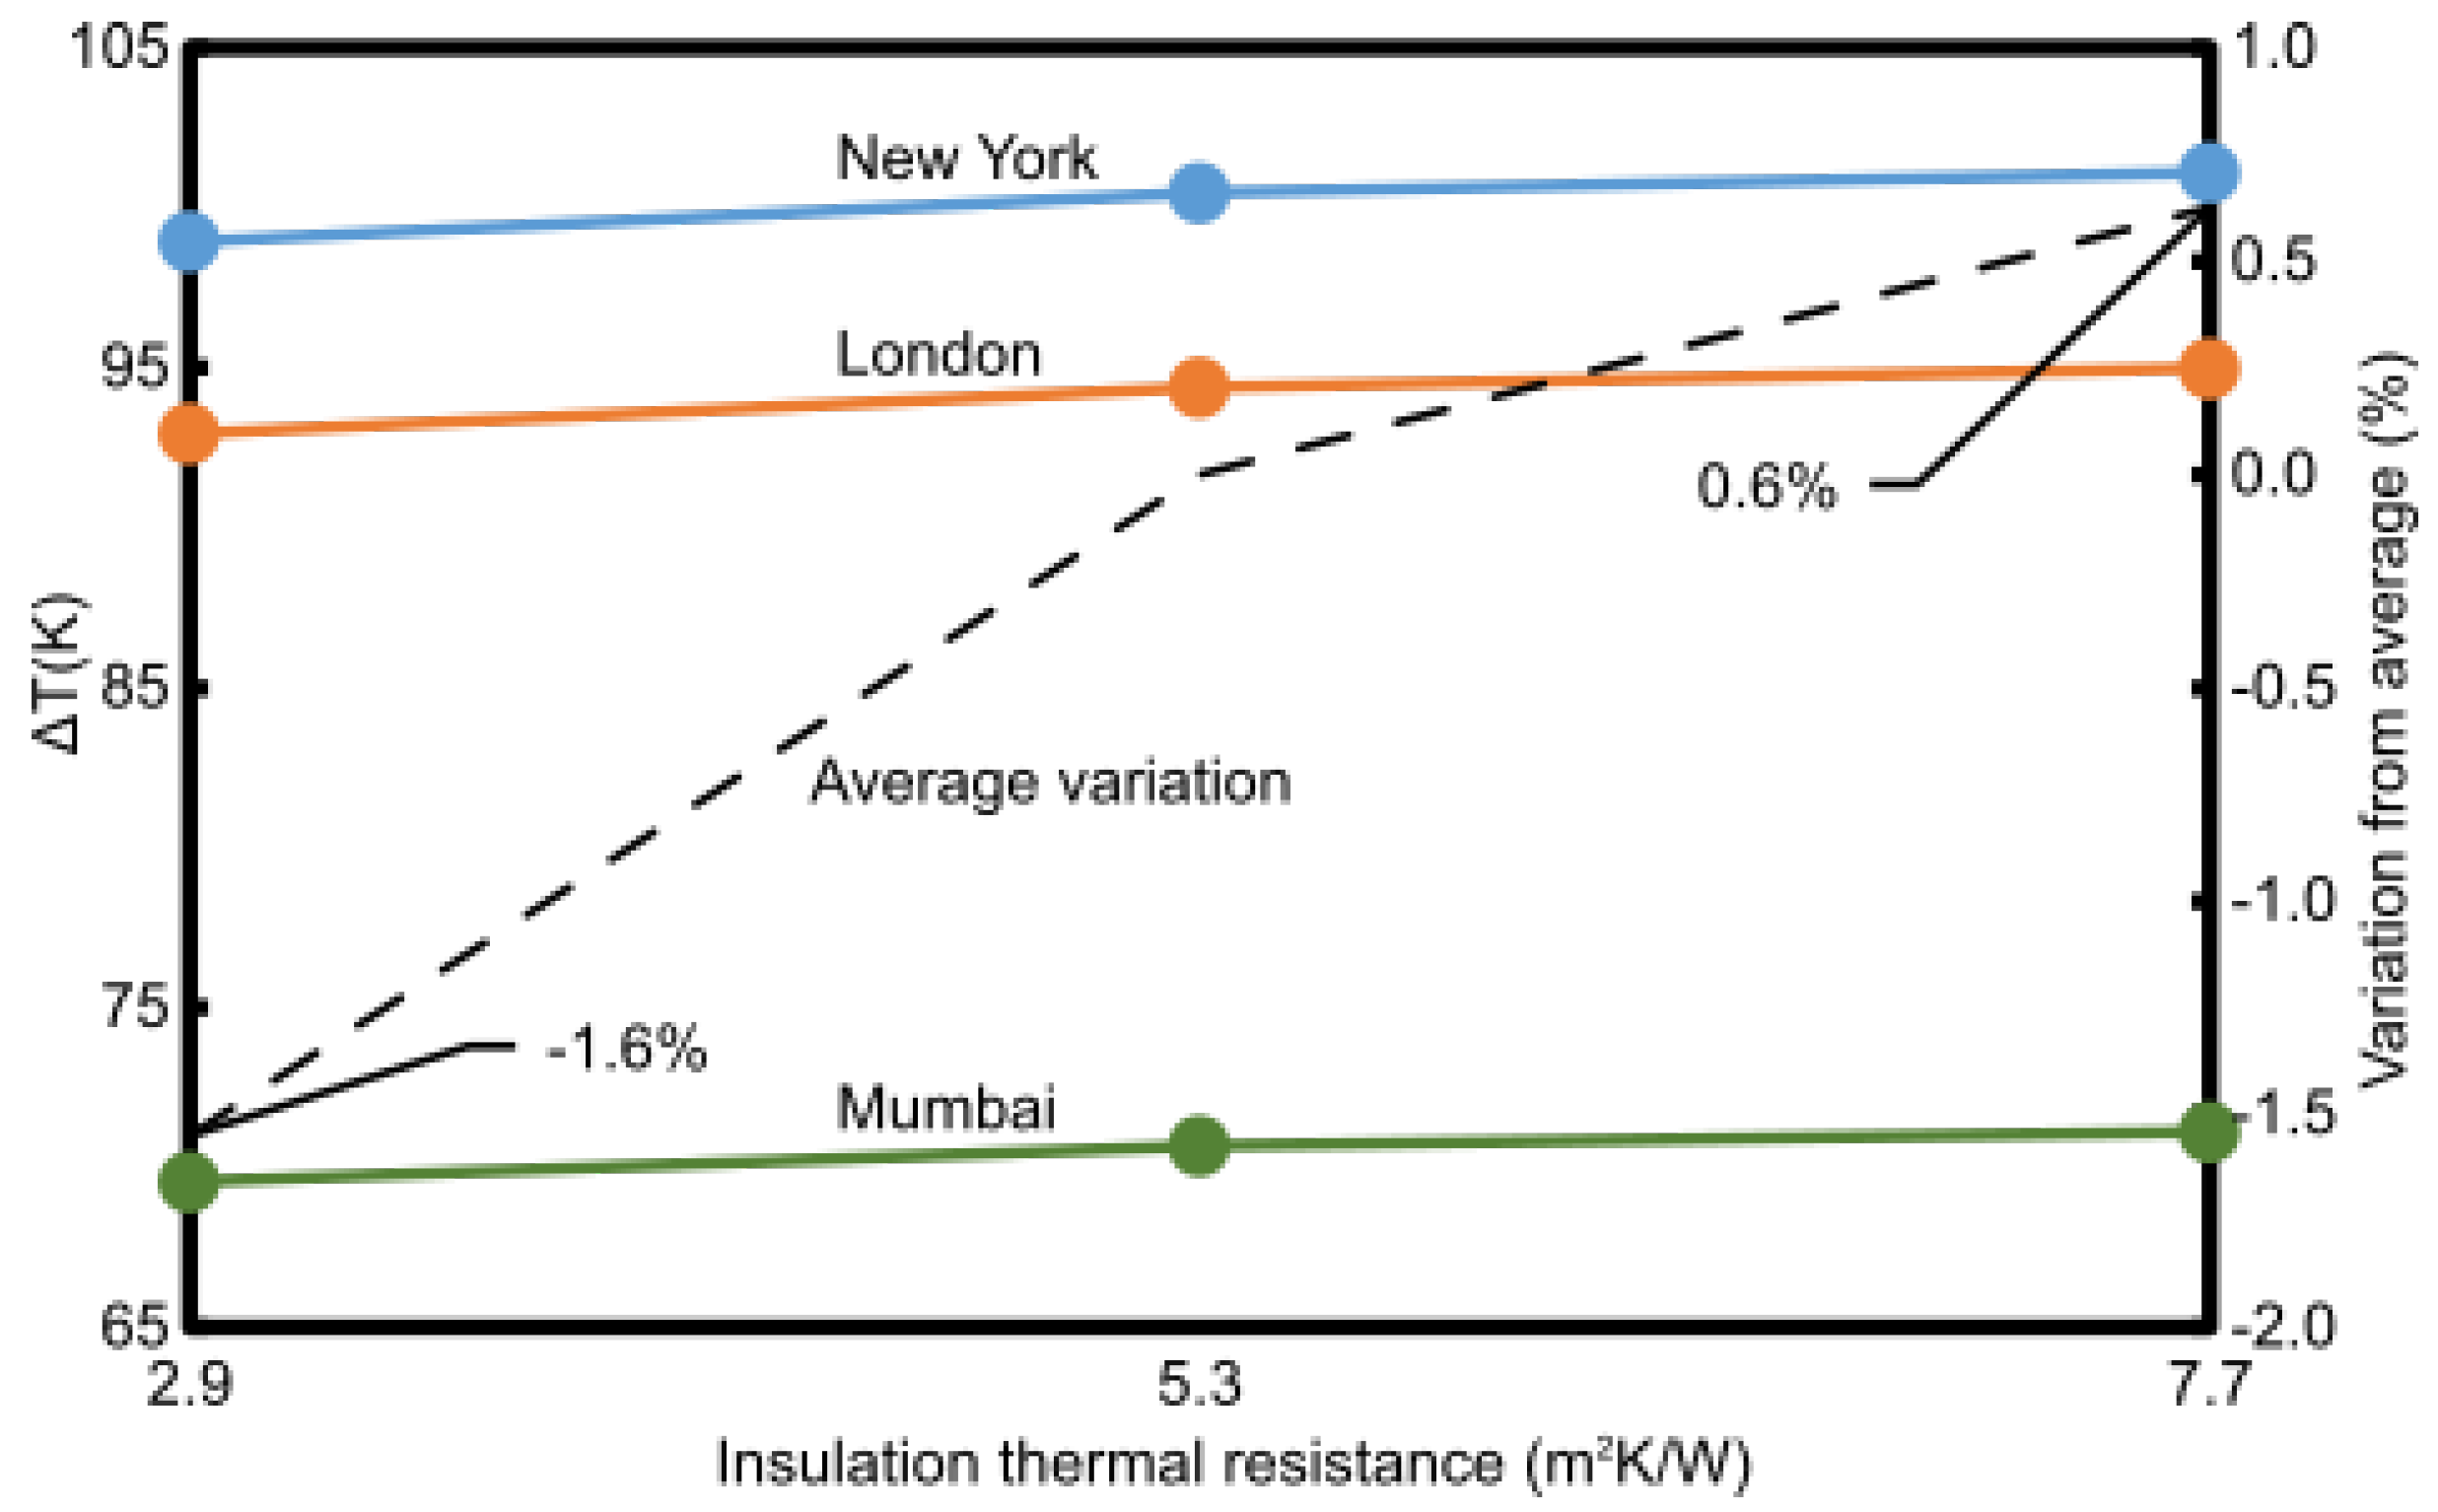
3.4. Incidence of the Thermo-physical Properties of the Spandrel (Step 3)
4. Discussion
4.1. Discussion of Results
4.2. Limitations of the Study
5. Conclusions
Supplementary Materials
Author Contributions
Funding
Conflicts of Interest
Appendix A

| Rinsulation for tins,min = 10 cm (m2K/W) | Rinsulation for tins,max = 20 cm (m2K/W) | |
|---|---|---|
| Polyurethane () | 3.8 | 7.7 |
| Rockwool () | 2.9 | 5.7 |
| Location | Time of the Day | Test (°C) | Idir (W/m2) | Glass Type | Insulation Color | |
|---|---|---|---|---|---|---|
| Condition 1 | New York | 12:00 pm | −10.0 | 894 | Nearly opaque | Light |
| Condition 2 | London | 8:00 am | 10.4 | 840 | Nearly opaque | Light |
| Condition 3 | Mumbai | 12:00 pm | 33.1 | 629 | Nearly opaque | Light |

References
- Kassem, M.; Mitchell, D. Bridging the gap between selection decisions of façade systems at the early design phase: Issues, challenges and solutions. J. Façade Des. Eng. 2015, 3, 165–183. [Google Scholar] [CrossRef]
- Montali, J.; Overend, M.; Pelken, P.M.; Sauchelli, M. Knowledge-Based Engineering in the design for manufacture of prefabricated façades: Current gaps and future trends. Archit. Eng. Des. Manag. 2017, 14, 78–94. [Google Scholar] [CrossRef]
- Klein, T. Integral Façade Construction-Towards a New Product Architecture for Curtain Walls. Ph.D. Thesis, Delft University, Delft, The Netherlands, 2013. [Google Scholar]
- Voss, E. An Approach to Support the Development of Manufacturable Façade Designs. Ph.D. Thesis, University of Cambridge, Cambridge, UK, 2013. [Google Scholar]
- Bergers, M.; Natividad, K.; Morse, S.M.; Norville, H.S. Full scale tests of heat strengthened glass with ceramic frit. Glas. Struct. Eng. 2016, 1, 261–276. [Google Scholar] [CrossRef][Green Version]
- Dunlap, A.; Asava, R. Three-dimensional condensation risk analysis of insulated curtain wall spandrels. In Advances in Hygrothermal Performance of Building Envelopes: Materials, Systems and Simulations; ASTM International: West Kanshohoken, PA, USA, 2017; Volume 1599, pp. 232–260. [Google Scholar]
- Behr, R.A. On-site investigations of spandrel glass microenvironments. Build. Environ. 1995, 30, 61–72. [Google Scholar] [CrossRef]
- Triano, J.; Cocca, J. Thermal breakage of spandrel glass: A case study in Forensic Engineering 2012: Gateway to a Better Tomorrow. In Proceedings of the 6th Congress on Forensic Engineering, San Francisco, CA, USA, 31 October–3 November 2012; 2013; pp. 143–150. [Google Scholar]
- Jazaeri, J.; Gordon, R.L.; Alpcan, T. Influence of building envelopes, climates, and occupancy patterns on residential HVAC demand. J. Build. Eng. 2019, 22, 33–47. [Google Scholar] [CrossRef]
- Favoino, F.; Overend, M.; Jin, Q. The optimal thermo-optical properties and energy saving potential of adaptive glazing technologies. Appl. Energy 2015, 156, 1–15. [Google Scholar] [CrossRef]
- Ko, M.; Gosti, T.; Kristl, Ž. Influence of architectural building envelope characteristics on energy performance in Central European climatic conditions. J. Build. Eng. 2018, 15, 278–288. [Google Scholar]
- Kültür, S.; Türkeri, N.; Knaack, U. A Holistic Decision Support Tool for Façade Design. Buildings 2019, 9, 186. [Google Scholar] [CrossRef]
- Stamoulis, M.N.; Santos, G.H.; Lenz, W.B.; Tusset, A.M. Genetic Algorithm Applied to Multi-Criteria Selection of Thermal Insulation on Industrial Shed Roof. Buildings 2019, 9, 238. [Google Scholar] [CrossRef]
- Faye, M.; Lartigue, B.; Kane, S. Influence of structural and thermophysical parameters of insulating aggregates on the effective thermal conductivity of lightweight concrete. J. Build. Eng. 2019, 21, 74–81. [Google Scholar] [CrossRef]
- Widiastuti, R.; Caesarendra, W.; Prianto, E.; Budi, W.S. Study on the Leaves Densities as Parameter for Effectiveness of Energy Transfer on the Green Façade. Buildings 2018, 8, 138. [Google Scholar] [CrossRef]
- Widiastuti, R.; Caesarendra, W.; Zaini, J. Observation to Building Thermal Characteristic of Green Façade Model Based on Various Leaves Covered Area. Buildings 2019, 9, 75. [Google Scholar] [CrossRef]
- Tarabieh, K.; Aboulmagd, A. Thermal Performance Evaluation of Common Exterior Residential Wall Types in Egypt. Buildings 2019, 9, 95. [Google Scholar] [CrossRef]
- CSTB, NF DTU P3-Travaux de Bâtiment-Travaux de Vitrerie-Miroiterie-Partie 3: Mémento Calculs des Contraintes Thermiques. 2006. Available online: https://boutique.cstb.fr/39-vitrerie-miroiterie/207-nf-dtu-39-travaux-de-vitrerie-miroiterie-3260050850032.html (accessed on 2 April 2020).
- British Standard Institution, BS EN 673-Glass in Building—Determination of Thermal Transmittance (U Value)—Calculation Method; BSI Standards Publication: London, UK, 2011.
- Statistical Analysis System Institute. 2019. Available online: https://www.sas.com/en_us/home.html (accessed on 3 April 2020).


| Insulation Code | Description | Absorptance (-) | Emissivity (-) | Thermal Conductivity (W/mK) | Thickness (cm) |
|---|---|---|---|---|---|
| A1 | Light color | 0.20 | 0.02 | 0.035 | 15 |
| A2 | Medium color | 0.55 | 0.02 | 0.035 | 15 |
| A3 | Dark color | 0.90 | 0.02 | 0.035 | 15 |
| Insulation Code | Description | Solar Transmittance (-) | Solar Absorptance (-) | Emissivity towards Interior (-) | Emissivity towards Exterior (-) |
|---|---|---|---|---|---|
| G1 | Very transparent | 0.81 | 0.12 | 0.84 | 0.84 |
| G2 | Semi-transparent | 0.63 | 0.29 | 0.30 | 0.84 |
| G3 | Nearly opaque | 0.36 | 0.59 | 0.84 | 0.84 |
| Location | Typical Meteorological Year | Latitude/Longitude | Maximum Global Irradiance on the Horizontal (W/m2) | Maximum External Temperature (°C) | Minimum External Temperature (°C) |
|---|---|---|---|---|---|
| London | Kew EWY | 51°34′ N–0°11′ W | 952.6 | 26.6 | −6.1 |
| New York | New York TMY2 | 40° 42′ N–74° 0′ O | 1038.5 | 35.0 | −15.6 |
| Mumbai | Mumbai IWEC | 19°04′ N–72°52′ E | 1011.9 | 40.0 | 12.4 |
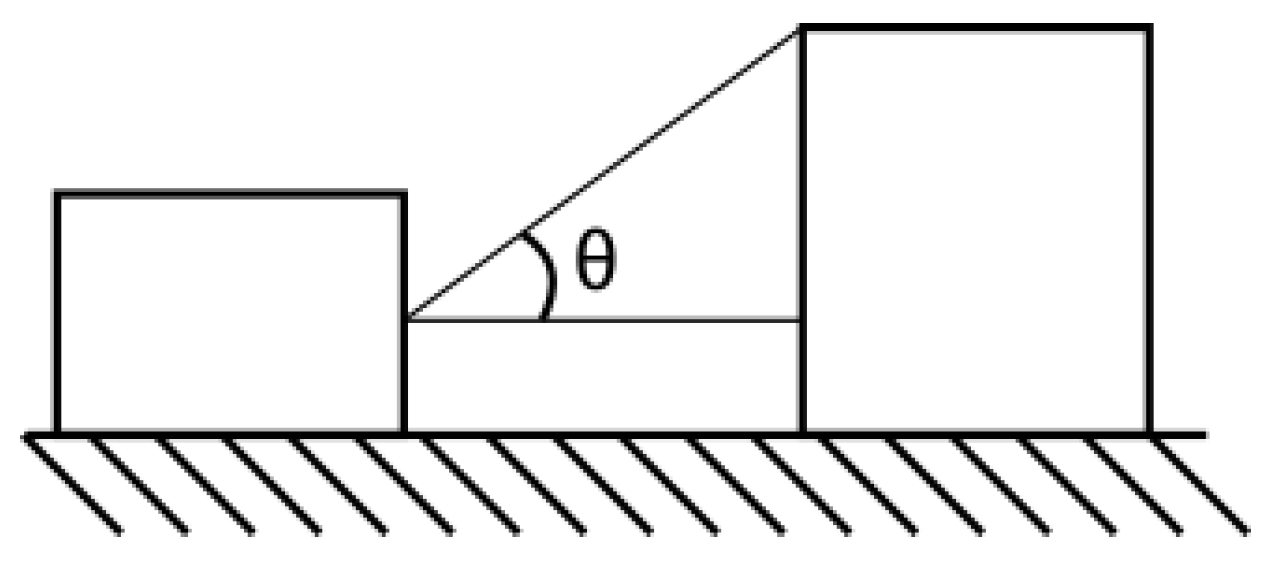
| Location | View Angles Analyzed (°) | Orientations Analyzed |
|---|---|---|
| London | 0-30-60 | E-S-W |
| New York | 0-30-60 | E-S-W |
| Mumbai | 0-30-60 | E-S-W |
| Exposition Type | ||||||||||
|---|---|---|---|---|---|---|---|---|---|---|
| South | East | West | ||||||||
| View Angle θ | View Angle θ | View Angle θ | ||||||||
| Glass Type | Insulation Color | 0° | 30° | 60° | 0° | 30° | 60° | 0° | 30° | 60° |
| Very transparent | Light | 37 | 26 | 12 | 30 | 22 | 10 | 30 | 22 | 10 |
| Medium | 34 | 24 | 11 | 28 | 21 | 10 | 28 | 21 | 9 | |
| Dark | 40 | 28 | 13 | 33 | 24 | 11 | 33 | 24 | 11 | |
| Semi-transparent | Light | 49 | 34 | 16 | 41 | 30 | 14 | 41 | 30 | 13 |
| Medium | 39 | 27 | 13 | 32 | 23 | 11 | 32 | 23 | 10 | |
| Dark | 41 | 29 | 13 | 34 | 25 | 12 | 34 | 25 | 11 | |
| Nearly opaque | Light | 59 | 42 | 19 | 49 | 36 | 17 | 49 | 36 | 16 |
| Medium | 45 | 31 | 15 | 37 | 27 | 13 | 37 | 27 | 12 | |
| Dark | 44 | 31 | 14 | 36 | 27 | 13 | 37 | 27 | 12 | |
| Exposition Type | ||||||||||
|---|---|---|---|---|---|---|---|---|---|---|
| South | East | West | ||||||||
| View Angle θ | View Angle θ | View Angle θ | ||||||||
| Glass Type | Insulation Color | 0° | 30° | 60° | 0° | 30° | 60° | 0° | 30° | 60° |
| Very transparent | Light | 54 | 35 | 12 | 58 | 32 | 11 | 58 | 28 | 9 |
| Medium | 50 | 32 | 11 | 54 | 30 | 11 | 54 | 26 | 9 | |
| Dark | 59 | 38 | 13 | 64 | 35 | 13 | 63 | 31 | 10 | |
| Semi-transparent | Light | 72 | 47 | 16 | 78 | 43 | 15 | 77 | 38 | 13 |
| Medium | 57 | 37 | 12 | 61 | 34 | 12 | 61 | 30 | 10 | |
| Dark | 60 | 39 | 13 | 65 | 36 | 13 | 65 | 31 | 11 | |
| Nearly opaque | Light | 87 | 57 | 19 | 94 | 52 | 19 | 94 | 46 | 15 |
| Medium | 66 | 43 | 14 | 71 | 39 | 14 | 71 | 34 | 12 | |
| Dark | 64 | 42 | 14 | 70 | 39 | 14 | 69 | 34 | 11 | |
| Exposition Type | ||||||||||
|---|---|---|---|---|---|---|---|---|---|---|
| South | East | West | ||||||||
| View Angle θ | View Angle θ | View Angle θ | ||||||||
| Glass Type | Insulation Color | 0° | 30° | 60° | 0° | 30° | 60° | 0° | 30° | 60° |
| Very transparent | Light | 32 | 21 | 7 | 34 | 19 | 7 | 34 | 17 | 6 |
| Medium | 30 | 19 | 6 | 32 | 18 | 6 | 32 | 15 | 5 | |
| Dark | 35 | 23 | 8 | 38 | 21 | 7 | 38 | 18 | 6 | |
| Semi-transparent | Light | 43 | 28 | 9 | 46 | 26 | 9 | 46 | 22 | 8 |
| Medium | 34 | 22 | 7 | 36 | 20 | 7 | 36 | 18 | 6 | |
| Dark | 36 | 23 | 8 | 39 | 21 | 8 | 38 | 19 | 6 | |
| Nearly opaque | Light | 52 | 34 | 11 | 56 | 31 | 11 | 56 | 27 | 9 |
| Medium | 39 | 25 | 8 | 42 | 23 | 8 | 42 | 20 | 7 | |
| Dark | 38 | 25 | 8 | 41 | 23 | 8 | 41 | 20 | 7 | |
| Exposition Type | ||||||||||
|---|---|---|---|---|---|---|---|---|---|---|
| South | East | West | ||||||||
| View Angle θ | View Angle θ | View Angle θ | ||||||||
| Glass Type | Insulation Color | 0° | 30° | 60° | 0° | 30° | 60° | 0° | 30° | 60° |
| Very transparent | Light | 43 | 40 | 18 | 37 | 29 | 13 | 40 | 31 | 14 |
| Medium | 40 | 37 | 16 | 35 | 27 | 12 | 37 | 29 | 13 | |
| Dark | 48 | 43 | 19 | 41 | 32 | 14 | 44 | 34 | 15 | |
| Semi-transparent | Light | 58 | 53 | 24 | 50 | 39 | 17 | 53 | 42 | 19 |
| Medium | 46 | 42 | 19 | 39 | 31 | 14 | 42 | 33 | 15 | |
| Dark | 49 | 44 | 20 | 42 | 33 | 14 | 45 | 35 | 16 | |
| Nearly opaque | Light | 70 | 64 | 29 | 61 | 48 | 21 | 65 | 50 | 23 |
| Medium | 53 | 49 | 22 | 46 | 36 | 16 | 49 | 38 | 17 | |
| Dark | 52 | 48 | 21 | 45 | 35 | 16 | 48 | 37 | 17 | |
| Exposition Type | ||||||||||
|---|---|---|---|---|---|---|---|---|---|---|
| South | East | West | ||||||||
| View Angle θ | View Angle θ | View Angle θ | ||||||||
| Glass Type | Insulation Color | 0° | 30° | 60° | 0° | 30° | 60° | 0° | 30° | 60° |
| Very transparent | Light | 26 | 24 | 10 | 22 | 17 | 8 | 24 | 18 | 8 |
| Medium | 24 | 22 | 10 | 21 | 16 | 7 | 22 | 17 | 8 | |
| Dark | 28 | 26 | 11 | 24 | 19 | 8 | 26 | 20 | 9 | |
| Semi-transparent | Light | 34 | 32 | 14 | 30 | 23 | 10 | 32 | 25 | 11 |
| Medium | 27 | 25 | 11 | 23 | 18 | 8 | 25 | 19 | 9 | |
| Dark | 29 | 26 | 12 | 25 | 20 | 9 | 26 | 21 | 9 | |
| Nearly opaque | Light | 42 | 38 | 17 | 36 | 28 | 12 | 38 | 30 | 14 |
| Medium | 32 | 29 | 13 | 27 | 21 | 9 | 29 | 23 | 10 | |
| Dark | 31 | 28 | 13 | 27 | 21 | 9 | 28 | 22 | 10 | |
© 2020 by the authors. Licensee MDPI, Basel, Switzerland. This article is an open access article distributed under the terms and conditions of the Creative Commons Attribution (CC BY) license (http://creativecommons.org/licenses/by/4.0/).
Share and Cite
Montali, J.; Laffranchini, L.; Micono, C. Early-Stage Temperature Gradients in Glazed Spandrels Due to Aesthetical Features to Support Design for Thermal Shock. Buildings 2020, 10, 80. https://doi.org/10.3390/buildings10050080
Montali J, Laffranchini L, Micono C. Early-Stage Temperature Gradients in Glazed Spandrels Due to Aesthetical Features to Support Design for Thermal Shock. Buildings. 2020; 10(5):80. https://doi.org/10.3390/buildings10050080
Chicago/Turabian StyleMontali, Jacopo, Luciano Laffranchini, and Carlo Micono. 2020. "Early-Stage Temperature Gradients in Glazed Spandrels Due to Aesthetical Features to Support Design for Thermal Shock" Buildings 10, no. 5: 80. https://doi.org/10.3390/buildings10050080
APA StyleMontali, J., Laffranchini, L., & Micono, C. (2020). Early-Stage Temperature Gradients in Glazed Spandrels Due to Aesthetical Features to Support Design for Thermal Shock. Buildings, 10(5), 80. https://doi.org/10.3390/buildings10050080