Article

Modeling of Precipitation Hardening during Coiling of Nb–Mo Steels

1
Centre for Metallurgical Process Engineering, The University of British Columbia, Vancouver, BC V6T 1Z4, Canada
2
Department of Materials Science and Engineering, National Taiwan University, Taipei 10617, Taiwan
3
Technical Research Center, Hyundai-Steel Company, Dangjin 167-32, Korea
4
Niobium Tech Asia, Singapore 068898, Singapore
5
NiobelCon bvba, 2970 Schilde, Belgium
*
Author to whom correspondence should be addressed.
Metals 2018, 8(10), 758; https://doi.org/10.3390/met8100758
Submission received: 21 August 2018 / Revised: 19 September 2018 / Accepted: 21 September 2018 / Published: 25 September 2018
(This article belongs to the Special Issue Advances in Microalloyed Steels)

Abstract

:
Nb–Mo low-alloyed steels are promising advanced high strength steels (AHSS) because of the highly dislocated bainitic ferrite microstructure conferring an excellent combination of strength and toughness. In this study, the potential of precipitation strengthening during coiling for hot-strip Nb–Mo-bearing low-carbon steels has been investigated using hot-torsion and aging tests to simulate the hot-rolling process including coiling. The obtained microstructures were characterized using electron backscatter diffraction (EBSD), highlighting the effects of Nb and Mo additions on formation and tempering of the bainitic ferrite microstructures. Further, the evolution of nanometer-sized precipitates was quantified with high-resolution transmission electron microscopy (HR-TEM). The resulting age hardening kinetics have been modelled by combining a phenomenological precipitation strengthening model with a tempering model. Analysis of the model suggests a narrower coiling temperature window to maximize the precipitation strengthening potential in bainite/ferrite high strength low-alloyed (HSLA) steels than that for conventional HSLA steels with polygonal ferrite/pearlite microstructures.

Graphical Abstract

1. Introduction

High strength low-alloyed (HSLA) and similar microalloyed low-carbon steels have been developed since the 1960s and their production continuously increases, especially for automotive and pipeline industries, because of their high strength, excellent ductility, and good weldability [1,2,3]. Originally the high strength of these steels was obtained by a combination of refining the ferrite-pearlite microstructure and precipitation hardening due to adding microalloying elements such as Nb, V, or Ti [1,4]. Optimizing the coil cooling process is critical to realize the precipitation strengthening potential in hot band. Models have been developed to predict the precipitation behavior for these conventional HSLA steels [4,5].
Nowadays there is a strong driving force to develop new advanced high strength steels (AHSS) to meet the future challenges in the automotive, energy and construction sectors [2,6]. In particular, Nb-Mo-bearing HSLA steels offer a tremendous opportunity to develop high-performance steels with increased strength [7,8,9,10]. Nb is known to be a powerful microalloying element to accumulate strain in austenite by delaying recrystallization because of solute drag and/or strain-induced precipitation [11,12,13]. Mo addition affects considerably the austenite-to-ferrite transformation by delaying polygonal ferrite formation, inhibiting pearlite and promoting bainite formation [7,8,14]. The high dislocation density and the resulting fine substructure significantly increases the strength of these steels. In addition to transformation hardening, the precipitation strengthening potential of Nb–Mo HSLA steels have been observed to be substantial [8,14]. Indeed, in highly dislocated ferrite or bainite, precipitation occurs on dislocations [9,15,16]. The precipitation strengthening is thus expected to be promoted as compared to polygonal ferrite by a higher precipitate density as the dislocation density increases [8,14]. In addition, Mo has a supplementary potential for precipitation strengthening by increasing the volume fraction of precipitates as (Nbx, Mo1−x) (CN) mixed carbides or carbo-nitrides have been observed [8,9].
The goal of this study is to develop a precipitation strengthening model for hot-rolled Nb–Mo HSLA steels applicable to industrial coiling conditions. Four low-carbon steels with various levels of Nb and Mo content were investigated. Laboratory hot-torsion tests were performed to simulate the hot-rolling process. The hardening potential was assessed performing aging at typical coiling temperatures. Systematic electron backscatter diffraction (EBSD) and high-resolution transmission electron microscopy (HR-TEM) studies were conducted to capture the microstructure and precipitation changes. A first version of the precipitation strengthening model using the approach used for conventional HSLA steels [5] has been presented previously [17], in which tempering of the bainitic-ferrite microstructure during aging was not considered even though it appears to have a non-negligible effect on the resulting mechanical properties [18]. The present paper provides the detailed microstructure analyses for tempering and coiling simulations at various temperatures to assess the microstructure contribution to mechanical properties as well as a revised age hardening model that considers both precipitation and transformation hardening contributions. The proposed modeling approach is validated with laboratory coil cooling simulations of the investigated Nb–Mo HSLA steels.

2. Materials and Methods

The steel compositions are similar to those of typical industrially hot-rolled HSLA steels but with systematic variations in the Nb and Mn contents, as listed in Table 1. The steels are laboratory steels that were vacuum melted to produce 50 kg ingots from which torsion specimens were machined with a gage section of 12.7 mm in length and a diameter of 10.3 mm.
The thermo-mechanical simulations are summarized in Figure 1. The as-received specimens were subjected to hot-torsion tests using a DSI HTS 100 hot torsion tester (Dynamic Systems Inc., Poestenkill, NY, USA) in order to simulate hot-rolling where the nominal deformation occurs within approximately a layer of 1 mm from the sample surface [19]. The as-received samples were soaked at 1250 °C for 15 min to dissolve the Nb and Mo containing precipitates, before undergoing 10 torsion passes at a strain rate of 1/s between 1100 and 900 °C, including three roughing passes (R1–R3) and seven finishing passes (F1–F7) for a total strain of 3.2. The details of the hot-torsion test schedule are shown in Table 2. Subsequently, different cooling strategies were employed to produce (i) as-quenched (AQ), i.e. under-aged, specimens and (ii) coil cooling simulated specimens. In the first test series (path 1 in Figure 1), the primary goal of the hot-torsion tests had been to create as-quenched specimens without Nb and Mo containing precipitates but with a typical hot-strip rolling microstructure for subsequent age hardening tests (path 2). The specimens were quenched with pressurized He-gas from 900 °C to 400 °C at an initial cooling rate of 40 °C/s followed by air cooling to room temperature. In the second series of hot torsion testing (path 3 in Figure 1), the specimens were cooled from 900 °C to a designated coiling temperature, T c , in the range of 650 °C to 500 °C at a cooling rate of 40 °C/s followed by cooling at 0.5 °C/min for 3 h to simulate coil cooling.
The as-quenched specimens were then subjected to isothermal aging tests (see path 2 in Figure 1) at three temperatures, i.e., 530 °C, 580 °C and 630 °C, to cover the range of typical coiling temperatures. Heat treatments were carried out in a tube furnace under argon atmosphere. The aging tests were interrupted at pre-selected times to perform microhardness measurements at room temperature after natural air cooling. The same sample is thus used to follow the entire aging kinetics for a given temperature. The reported aging time, t, represents the cumulative effective time, not counting the heating time, i.e. the time before the temperature of the sample reaches 20 °C below the investigated temperature. For each aging time, ten hardness measurements were made in the cross-section of the specimen at 500 μm from the surface to avoid edge effects but to remain in the fully deformed area. A load of 1 kgf was applied for 15 s, leading to an indent diagonal of order of 100 μm.
Electron backscatter diffraction (EBSD) mapping was conducted to characterize the microstructure at 500 ± 200 μm from the sample surface in different conditions, i.e. as-quenched (AQ), peak-aged (PA), over-aged (OA) and coil cooling simulated. SiC grinding papers and diamond polishing down to 1 μm were used for sample preparation, followed by electro-polishing performed at room temperature using an electrolyte of 95% acetic and 5% perchloric acids, applying a voltage of 15 V for 30 s. EBSD acquisition was performed in a Zeiss Sigma field emission scanning electron microscope (SEM) using an EDAX DigiView EBSD Camera (EDAX/Ametek, Draper, UT, USA) and TSL Orientation Imaging Microscopy (OIM) software (Version 6.2, EDAX/Ametek, Mahwah, NJ, USA). A 20 kV accelerating voltage and 60 μm aperture were set for the SEM parameters and a square grid with a step size of 0.2 μm for the EBSD scan. The possible phases selected for EBSD analysis were body-centered-cubic (BCC) and face-centered-cubic (FCC) structures corresponding to ferrite and austenite, respectively. For data processing, high angle grain boundaries (HAGB) are defined by disorientations higher than 15°, whereas low angle grain boundaries (LAGB) have disorientations between 2° and 15° [20]. Kernel average misorientation (KAM) is used to measure lattice disorientation below 2° using all Kernel points up to the second nearest neighbors. The martensite areas were not properly indexed because martensite laths are highly dislocated and relatively small with respect to the applied step size. Martensite islands appear on the inverse pole figure (IPF) maps as clusters of randomly oriented points [21] (see Figure 2a) with low index quality (IQ) values [22] (see Figure 2b). A combination of both criteria was used to determine potential martensite constituents (see Figure 2c). Clusters of low IQ (typically <0.35) with a size of at least 0.2 μm2 (i.e., 5 pixels) are considered as martensite islands (see Figure 2d).
The mean grain size of the microstructure is determined as the average equivalent area diameter (EQAD), accounting for all microstructure constituents (i.e., irregular ferrite, martensite and austenite), with a minimum disorientation between grains of 2°, as given by Equation (1):
  E Q A D 2 ° = 2 A π ( n I F + n M + n R A )  
where A is the investigated area and the ni (i = IF, M, RA) are the numbers of irregular ferrite (IF), martensite (M) and retained austenite (RA) grains. No significant difference of the EQAD values was observed including or excluding the grains cut at the border of the map, because of a sufficiently large number of grains in the investigated maps (>2000).
Further, selected high-resolution transmission electron microscopy (HR-TEM) studies were conducted to characterize the precipitates at various aging stages. TEM specimens were prepared by cutting discs at 0.5–1 mm from the edge of the torsion specimens, thinned mechanically down to 0.06 mm, and then twin-jet electro-polished to perforation using a mixture of 5% perchloric acid, 15% glycerol, and 80% ethanol at a potential of 35 V and a temperature of −2 °C. TEM observations were conducted using a Tecnai G2 F20 field emission gun transmission electron microscope (FEG-TEM) equipped with an energy dispersive spectrometer (EDS). The size measurement of carbides was conducted by HR-TEM and at least 50 carbide particles were measured for each condition. The specimens were tilted to the <100> zone axis to obtain Moiré fringes from the BCC matrix and the (Nb,Mo)C particle. The crystallographic orientation relationship between the matrix and the (Nb,Mo)C was determined by fast Fourier transformed (FFT) image and identified as the Baker-Nutting orientation relationship (BN-OR), {100}α//{110}carbide, <100>α//<110>carbide, as usually observed for these carbides [8,9]. Based on the BN-OR, the (Nb,Mo)C carbides could be detected precisely and their sizes could be measured accurately. The number density of carbides (the number of carbides per unit volume of ferrite matrix, µm−3) for each steel was determined from 10 HR-TEM frames with a total examined area of 10 µm2. The thickness of the observed area was measured by using electron energy-loss spectroscopy (EELS). EELS is an analysis of the energy distribution of electrons which involves the inelastical scattering events. The inelastically scattered electrons with different energy loss are categorized into the spectrum and the thin foil thickness, η, is obtained as η = λln(It/I0) where I 0 is the integrated intensity of the zero-loss peak, I t is the total intensity and λ is the inelastic mean free path of electrons.

3. Results and Discussion

3.1. Age Hardening Results

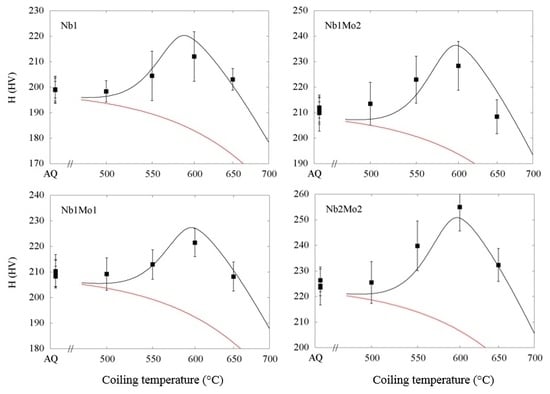
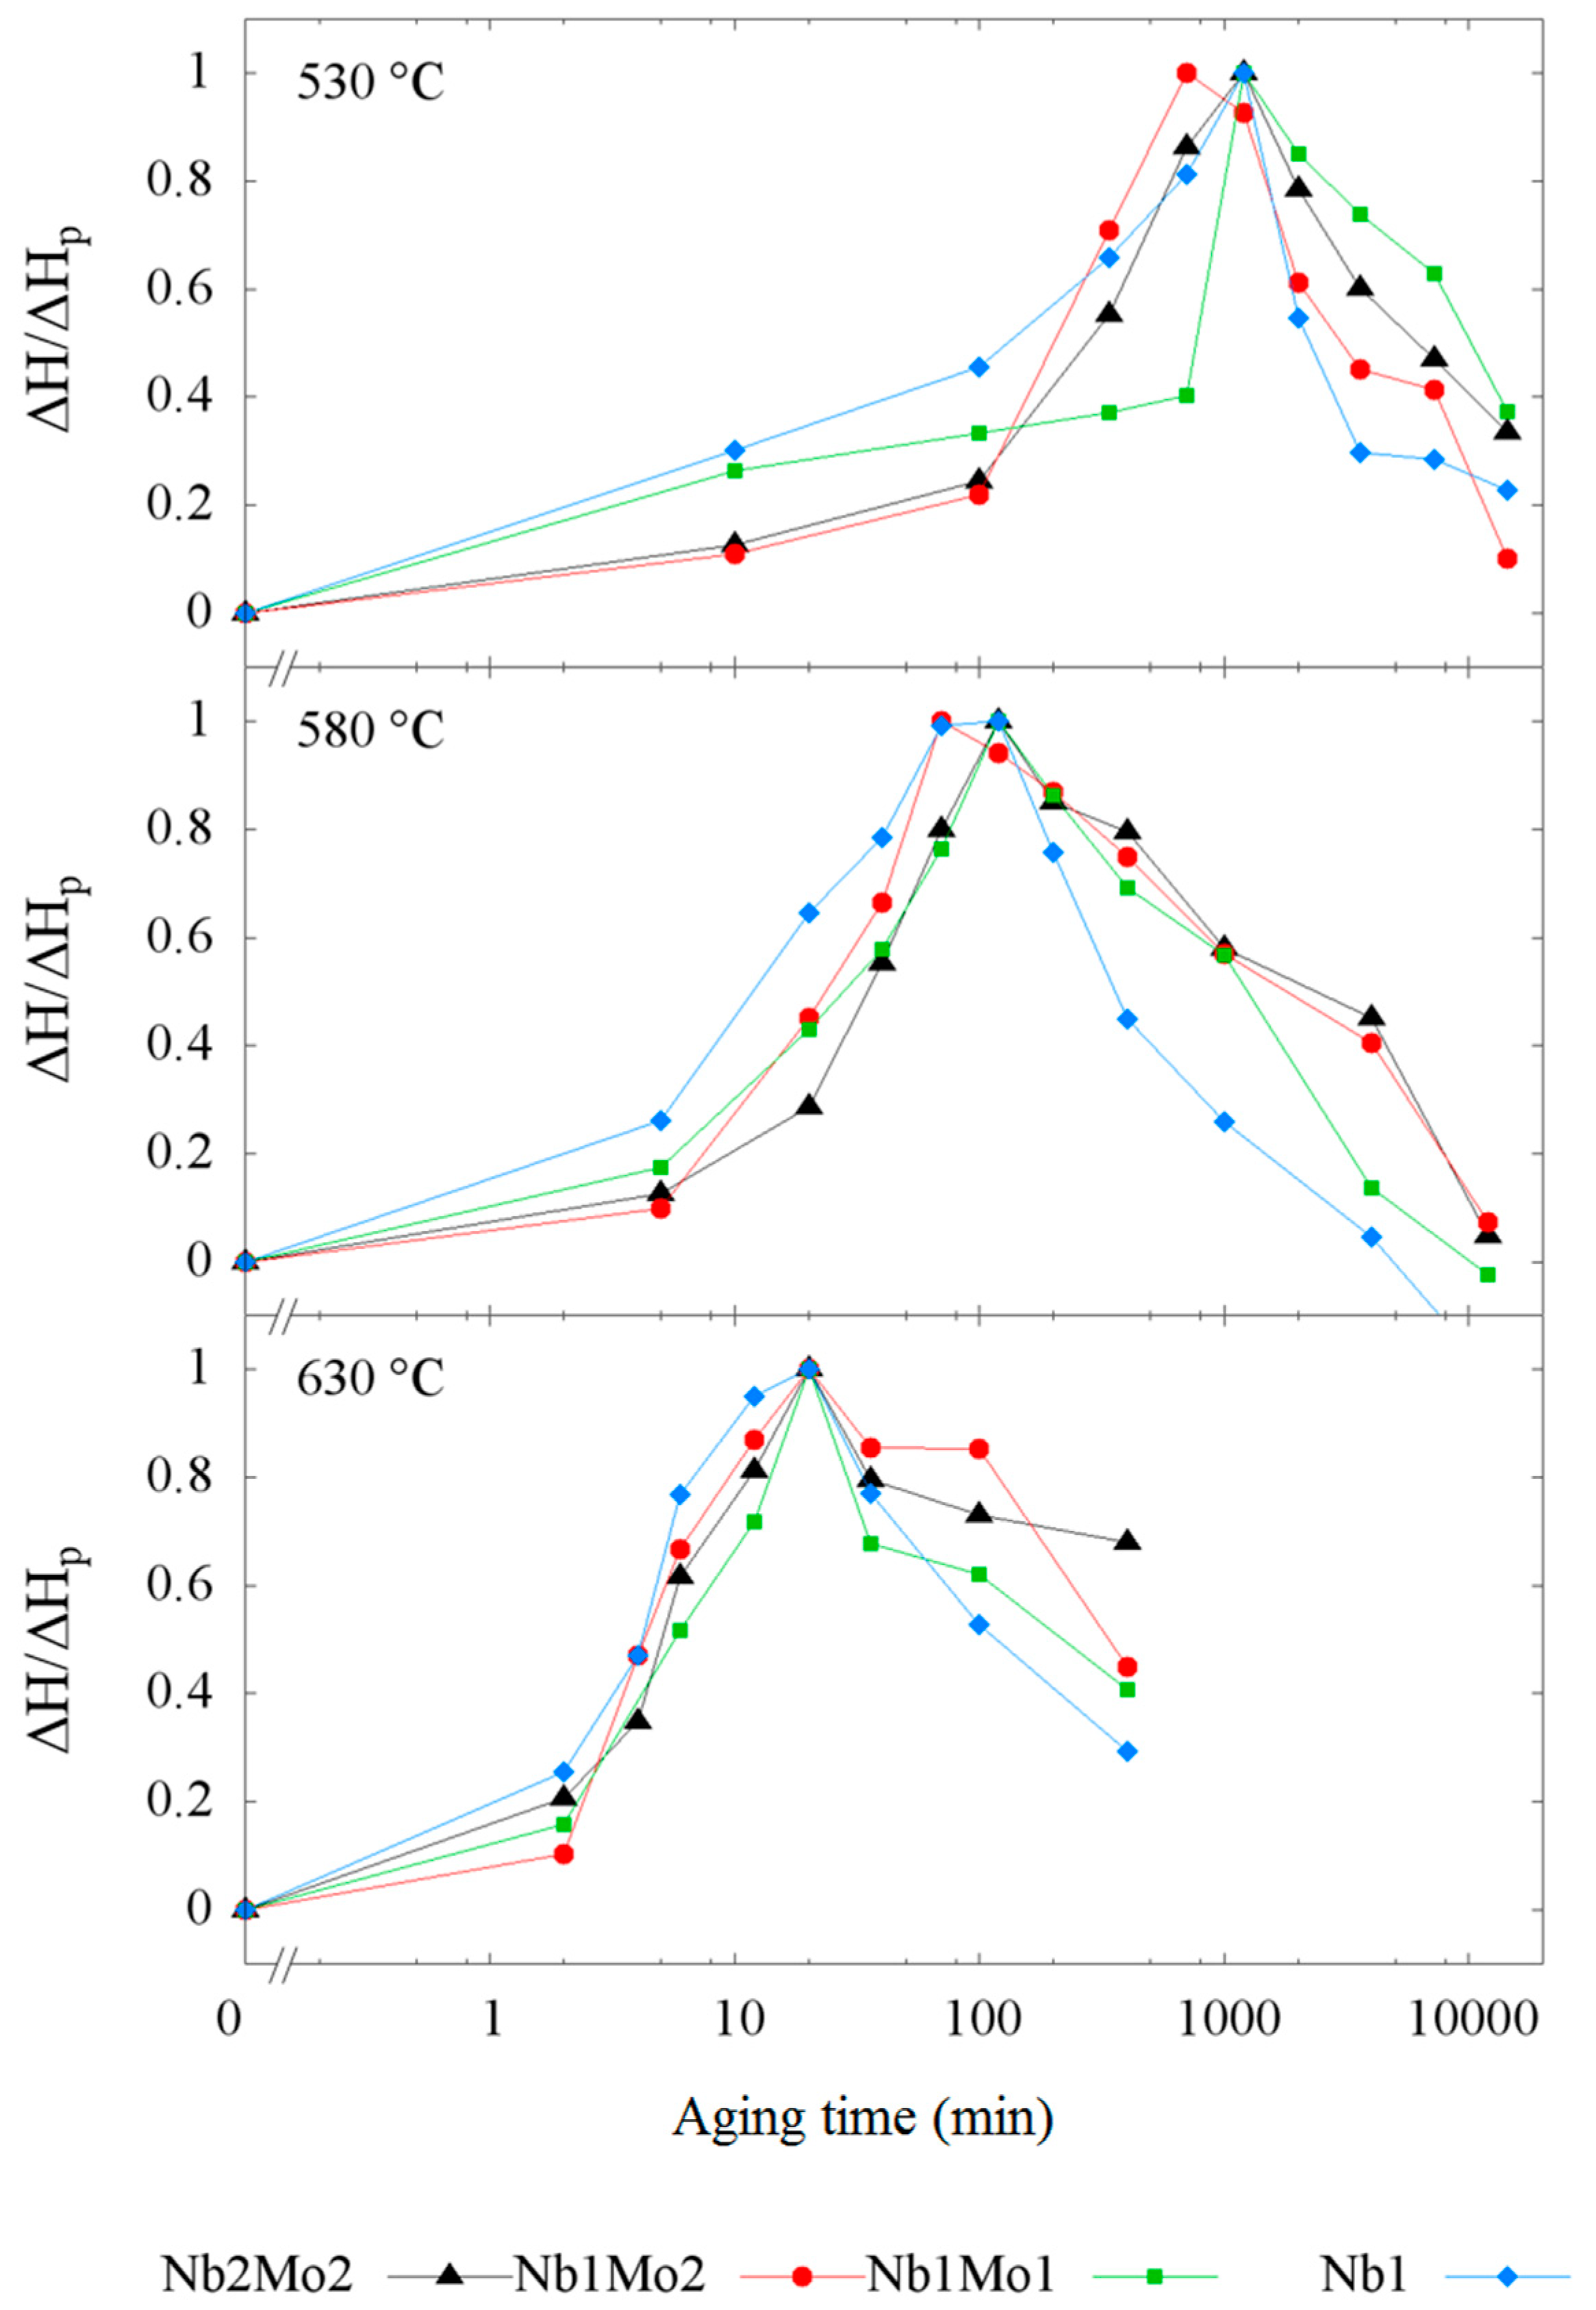
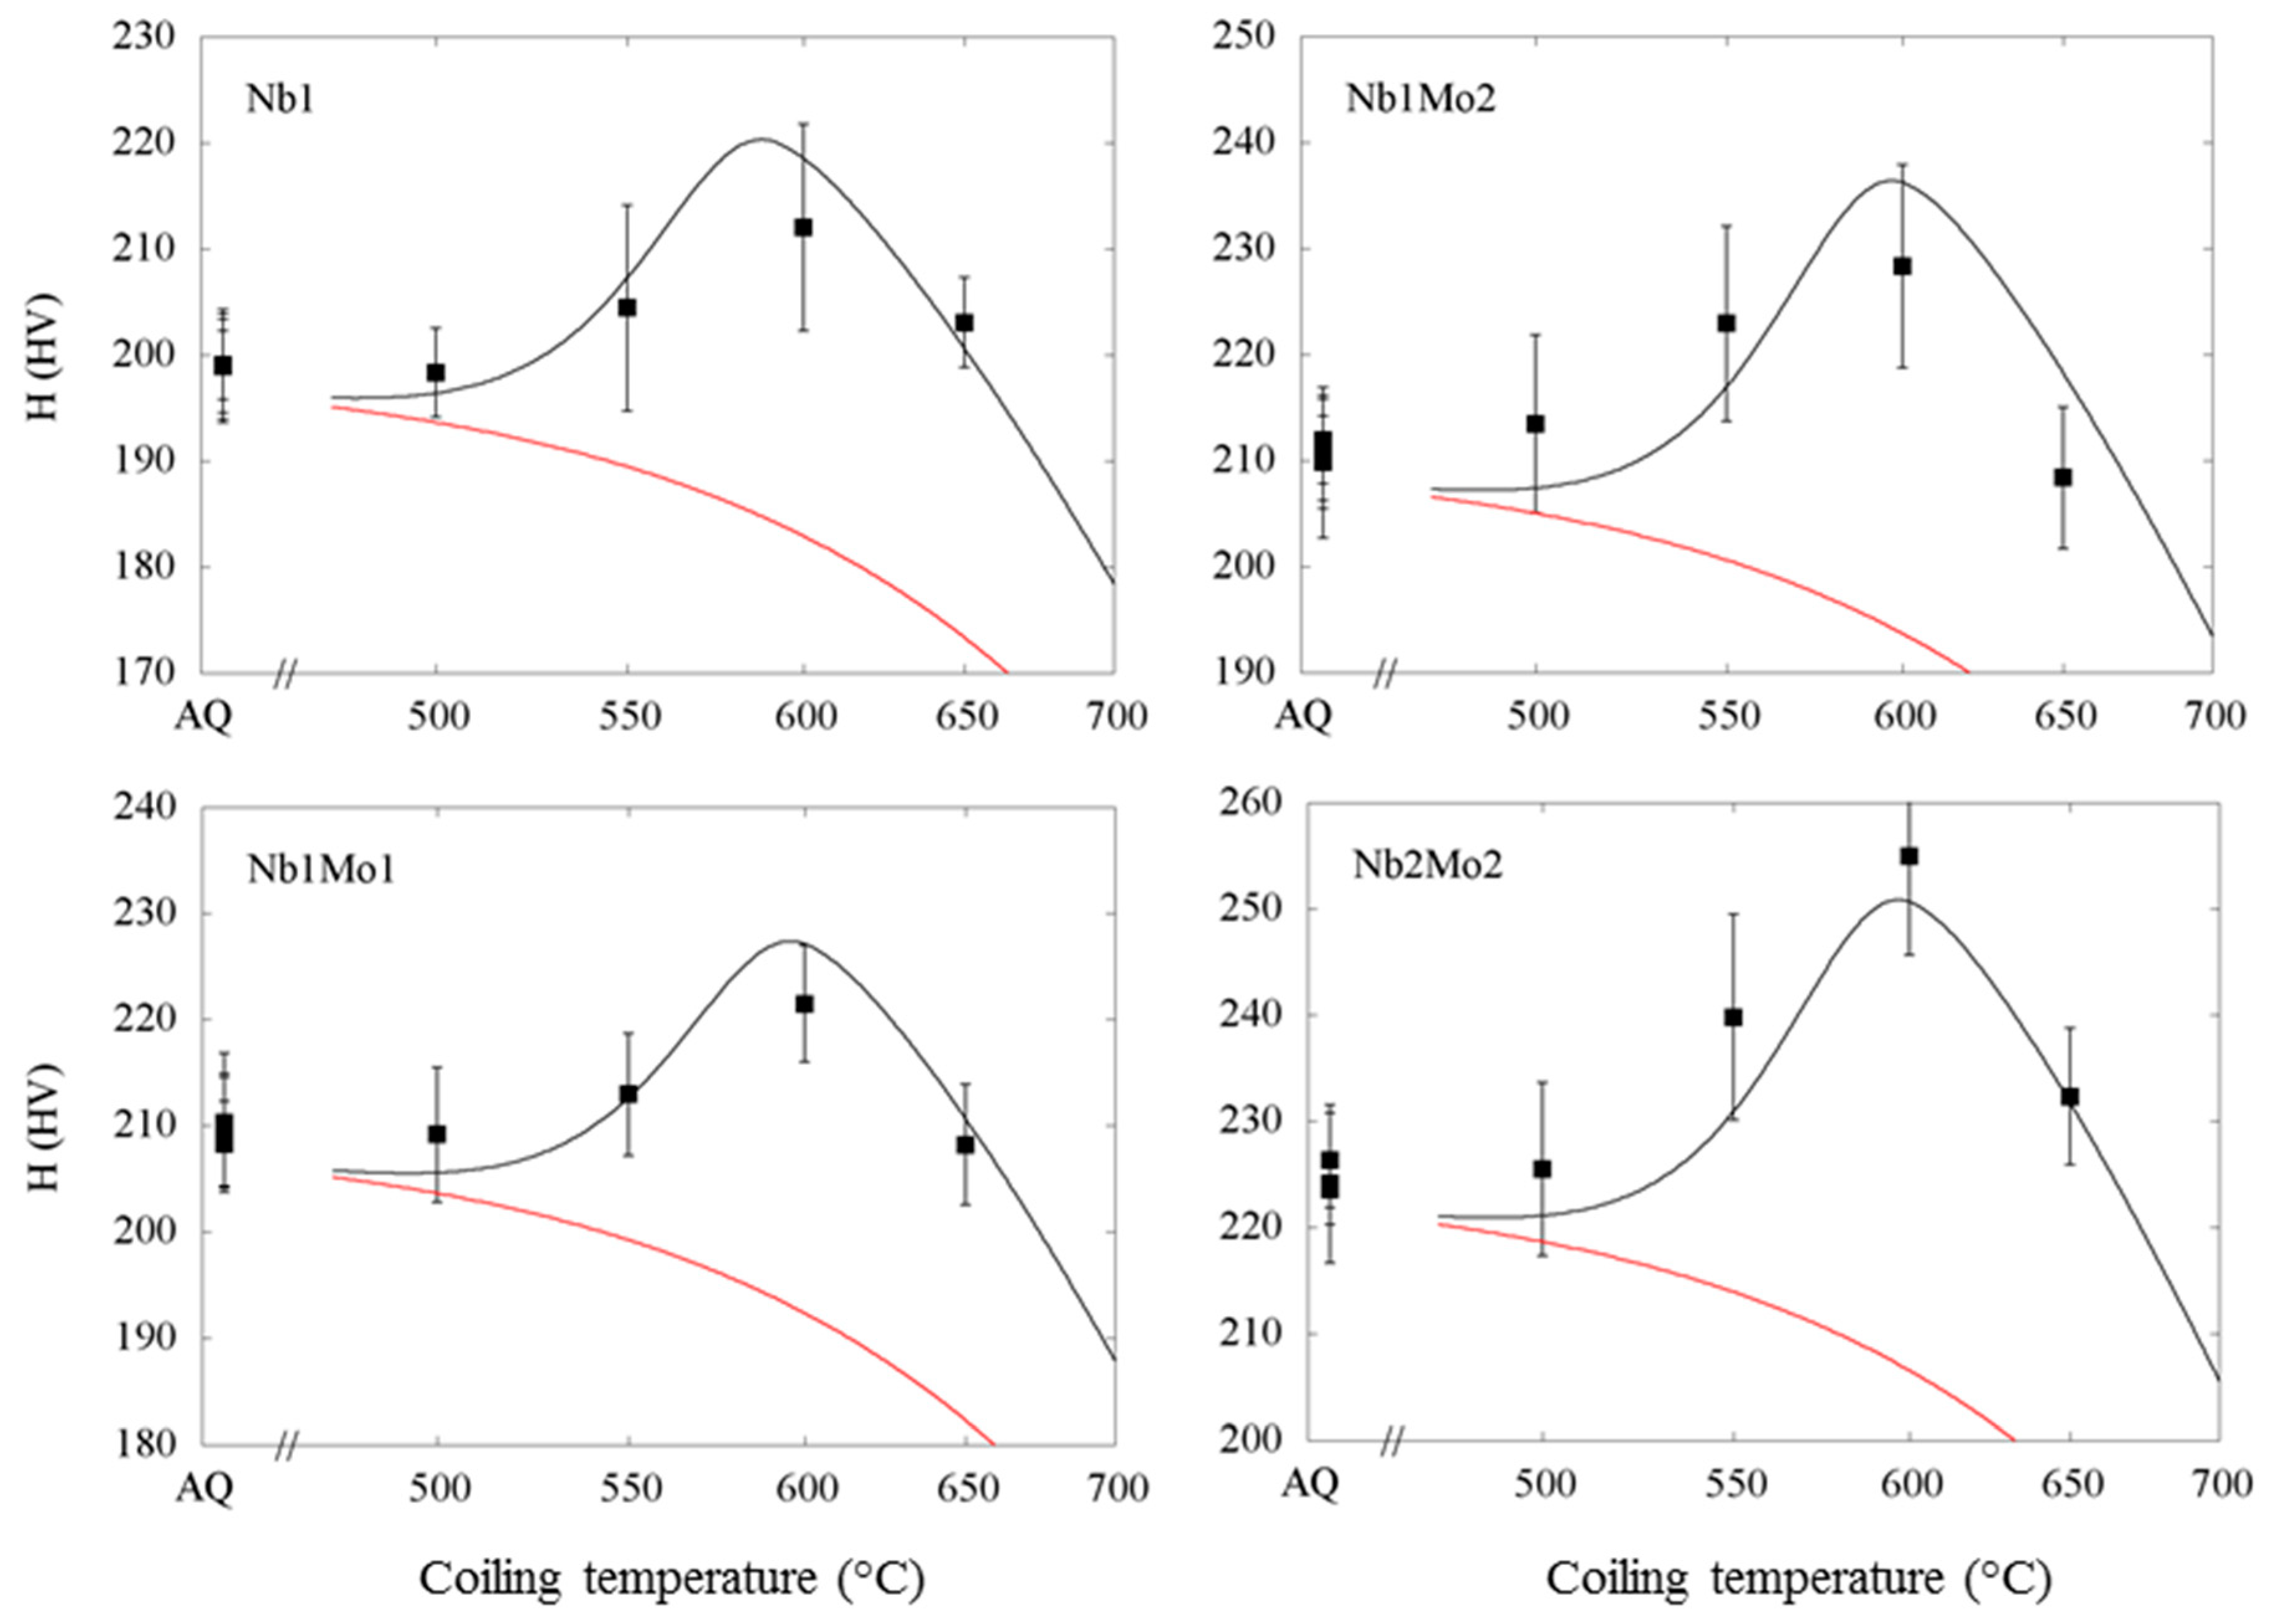
3.1.1. Hardness Kinetics

The age hardening curves at the three investigated temperatures are shown for the four steels in Figure 3. Age hardening peaks are observed for all curves, due to the precipitation strengthening effect, well-known in microalloyed steels [1]. The magnitude of the hardness peaks appears to be independent of temperature for a given steel grade. The as-quenched and the peak hardness increase with alloying content, as shown in Figure 4. The difference of peak and as-quenched hardness indicates the apparent peak precipitation hardening increment, Δ H p , that increases from 22 HV for the Nb1 and Nb1Mo1 steels, to 29 HV for the Nb1Mo2 steel and 30 HV for the Nb2Mo2 steel. It is worth noting that no hardening was observed for an Nb-free 0.2 wt.% Mo steel initially included in the study, meaning that Mo itself does not produce significant precipitation strength.
Figure 5 provides a comparison of the age hardening kinetics for the four Nb-bearing steels by presenting the normalized hardness change, i.e., ∆H/∆Hp where ∆H = HH(as-quenched), for each temperature. The kinetics are similar for the four steels, with peak aging times of approximately 20, 120, and 1200 min at 630, 580, and 530 °C, respectively. Nevertheless, the aging curve of the Nb1 steel that does not contain Mo is slightly shifted to shorter times compared to the other steels.

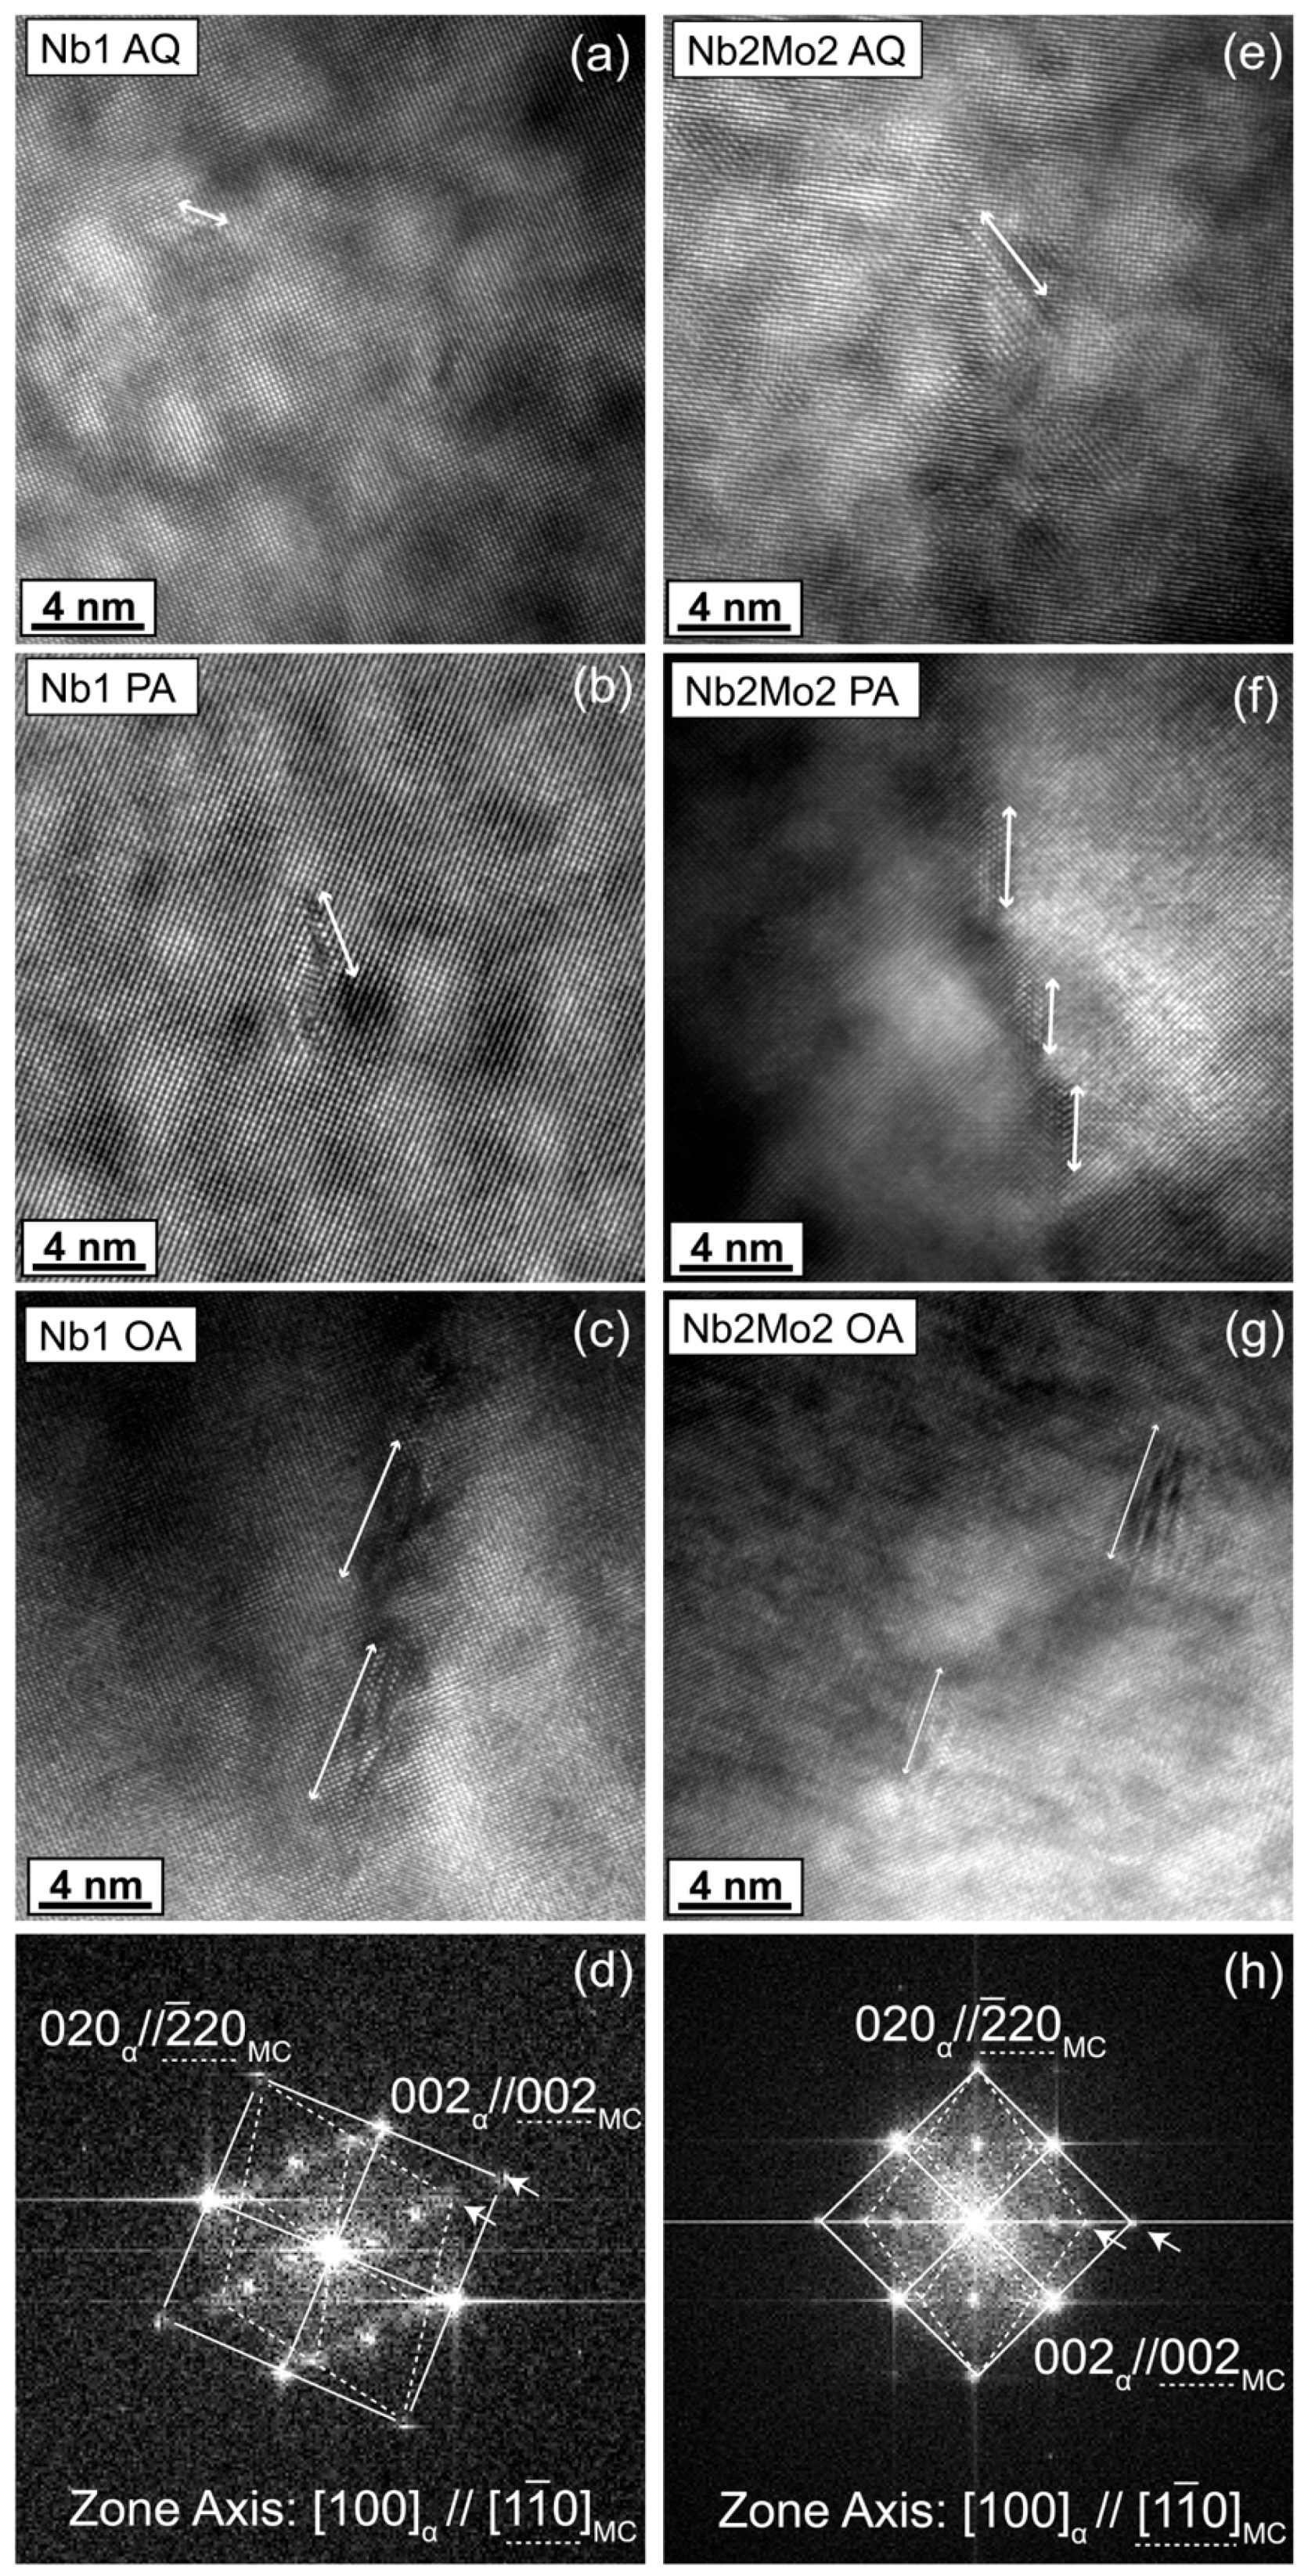
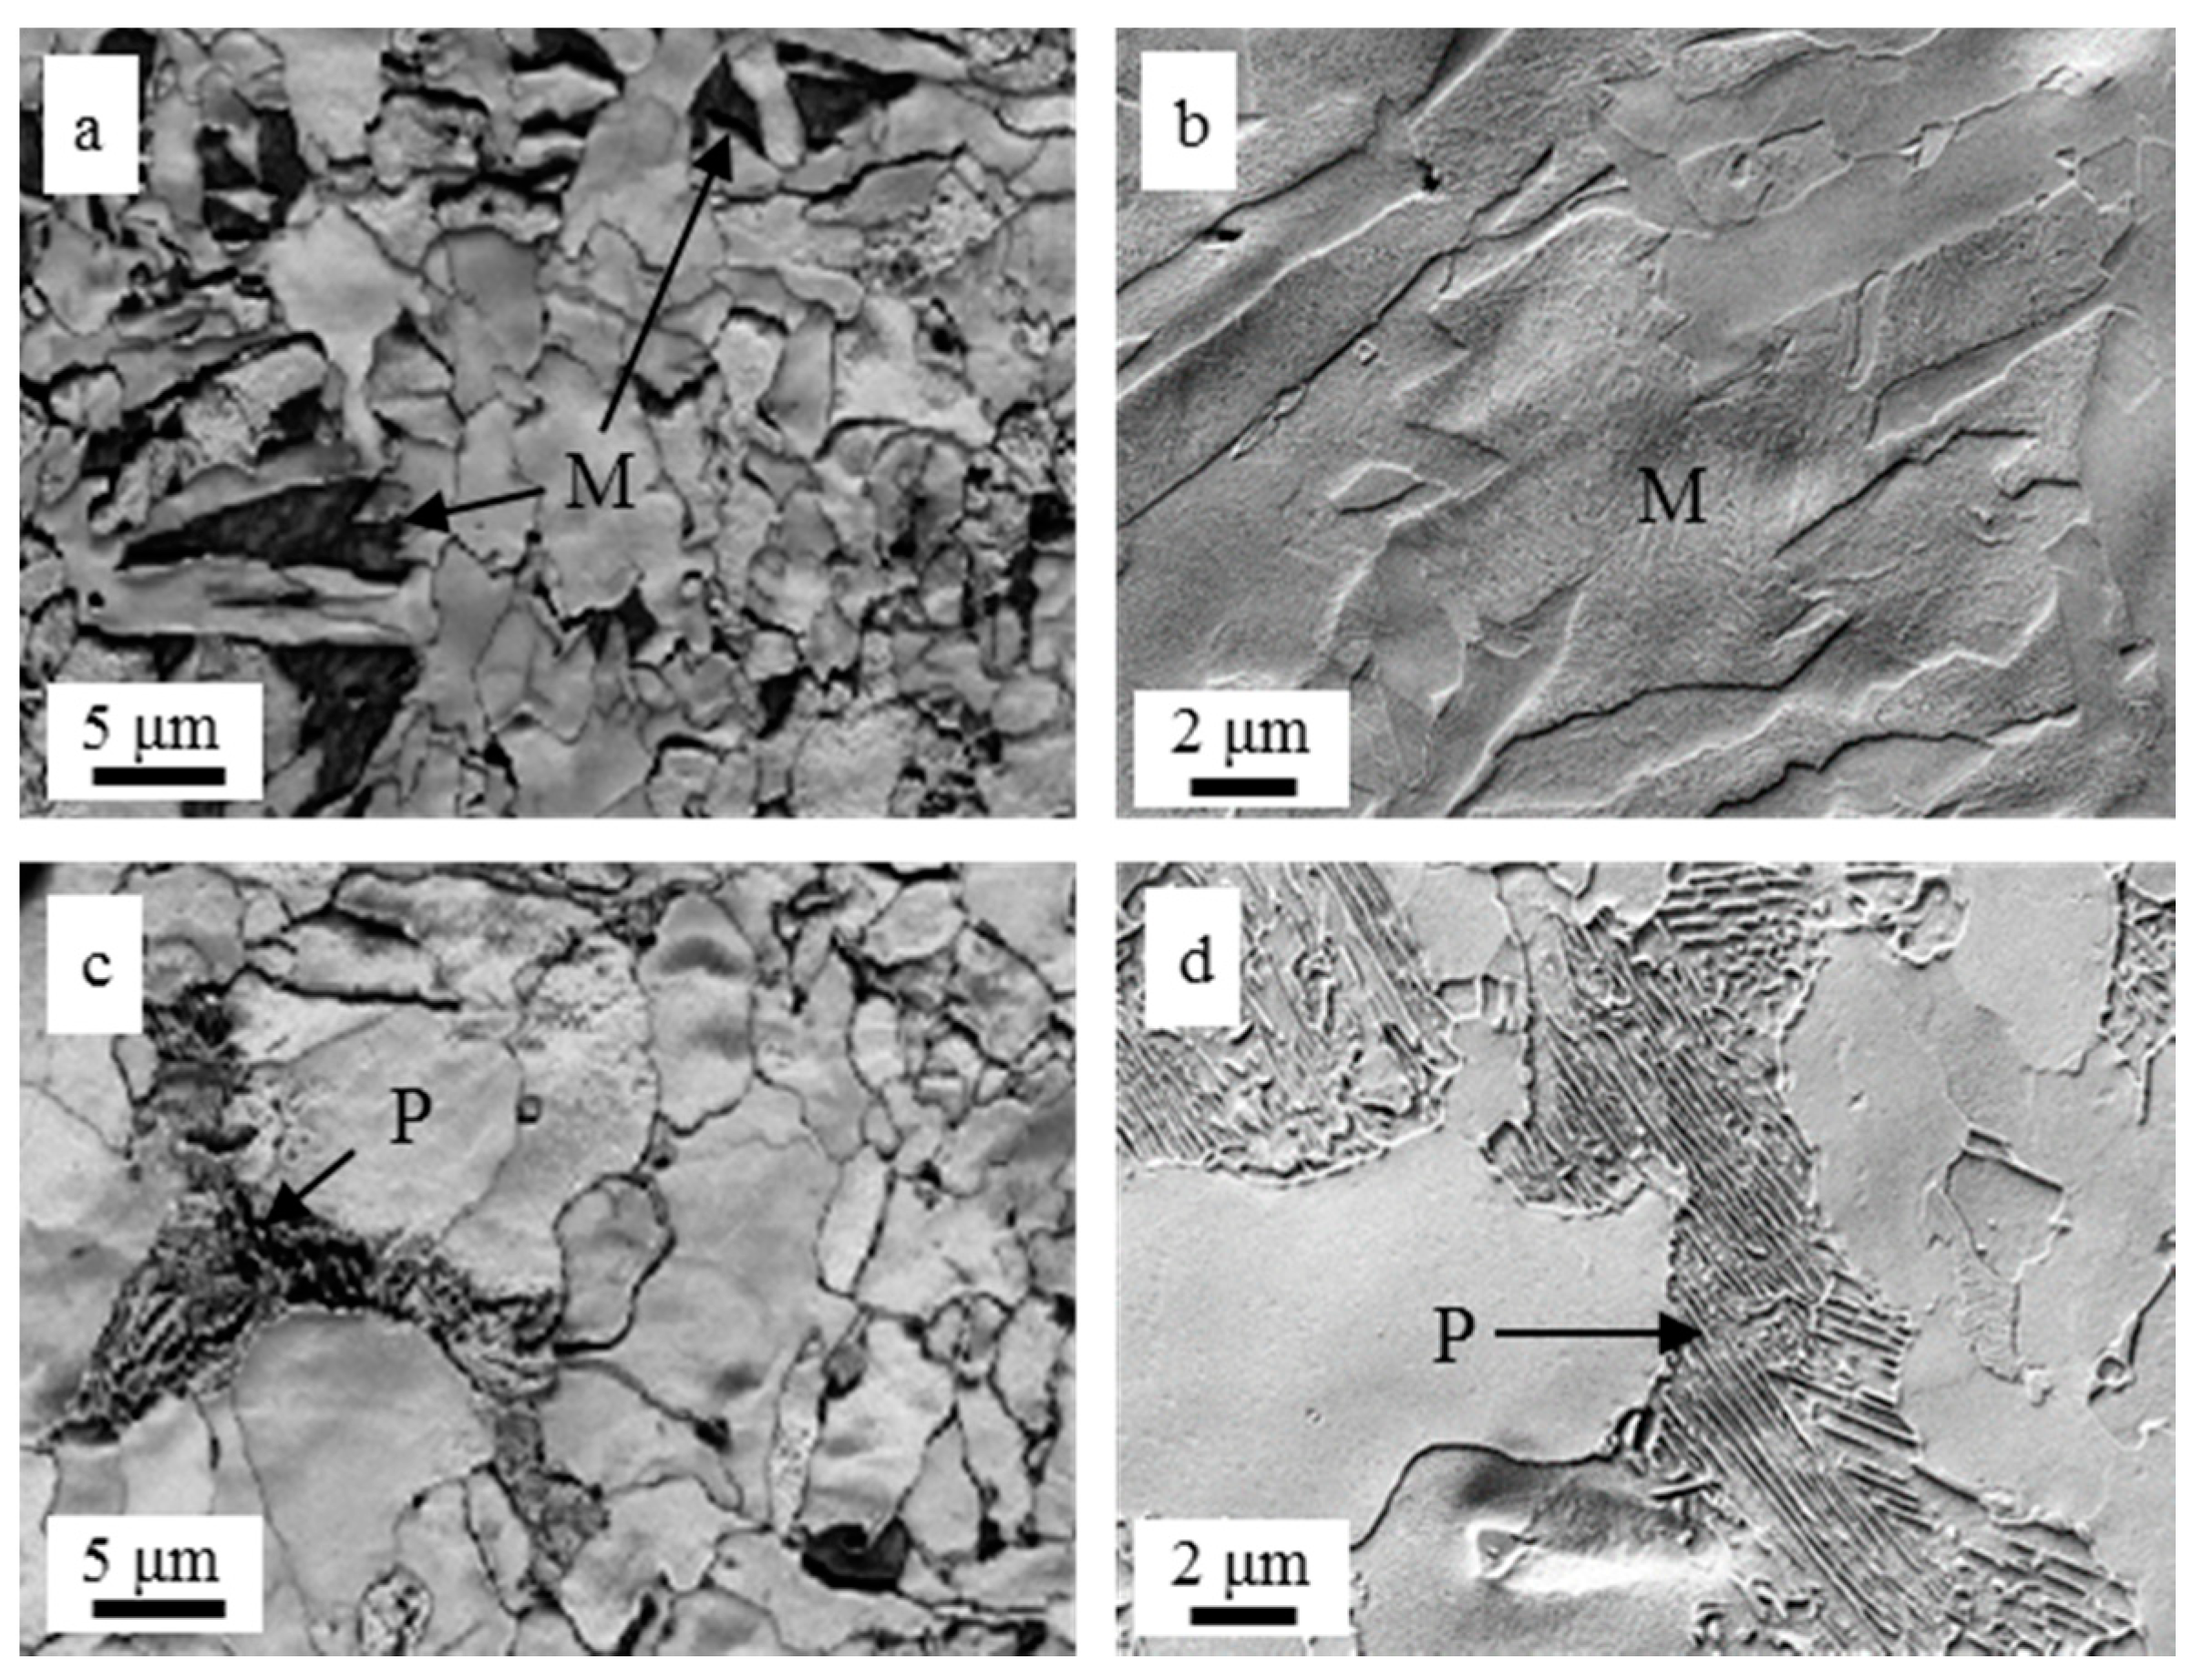
3.1.2. Microstructure

Figure 6 shows the as-quenched microstructures of the four investigated steels. All of them are composed of a mixture of ferrite and bainitic ferrite grains, denoted here as irregular ferrite (IF) microstructure, with small fractions of martensite and retained austenite (M/A) islands (see Table 3). No pearlite was observed in the as-quenched conditions. The bainitic ferrite is characterized by large grains delimited by HAGB with high KAM and a high density of LAGB, corresponding to bainite laths or highly dislocated substructures. The ferrite grains are small, more polygonal, and less dislocated. However, the ferrite and bainitic ferrite grains cannot be strictly separated by EBSD features (KAM, grain size, etc.) because of the continuity of the IF. Nevertheless, the microstructure appears to be more ferritic for the Nb1 steel and to become more bainitic with increasing Mo content. Secondly, the bainitic ferrite is more and more dislocated with increasing Nb and Mo contents. Consequently, the mean KAM values of IF increases with the alloying content (see Table 3). A similar trend is obtained when considering the LAGB densities. Further, the HAGB have predominantly disorientation angles between 54° and 60° that are characteristics of the FCC-BCC transformation according to specific orientation relationships, such as Kurdjumov-Sachs or Nishiyama-Wasserman. The resulting bimodal disorientation frequency distribution is typical for a bainitic ferrite microstructure, whereas a random, i.e., MacKenzie, distribution is observed for polygonal ferrite microstructures [20]. The frequency and density of LAGB increases with increasing Nb and Mo contents, as listed in Table 3 indicating an increased bainitic ferrite fraction with increasing Mo and/or Nb content.
Finally, the overall grain size (EQAD), taking into account the substructure of the bainitic ferrite grains, decreases with increasing Nb and Mo content (Table 3). The refinement of the as-quenched IF microstructure with increasing Nb content is consistent with the known effect of Nb on ferrite grain refinement through increasing austenite pancaking by inhibiting recrystallization [11,12]. Further, Mo is known to considerably delay the austenite-to-ferrite transformation and to promote bainite formation [7,8,14]. These microstructure changes lead to an increase of the as-quenched hardness with the Nb and Mo contents, as shown in Figure 3 and Figure 4. Note that the relatively wide standard deviation observed (approx. 5 HV) is the result of local microstructure heterogeneities after the hot-rolling simulation process because of the complex irregular ferrite microstructures with areas of fine ferrite grains and large bainitic ferrite grains.
The evolution of the microstructure during aging has been investigated for two steels, the least and the most alloyed, at two aging conditions. Figure 7 shows the EBSD maps of the Nb1 and Nb2Mo2 steels after 15 min (peak-aged condition) and 690 min (over-aged condition) holding at 630 °C. Tempering of the microstructure during aging is obvious for both steels compared to the as-quenched conditions shown in Figure 6. After 15 min of aging no M/A is observed, and after over-aging the microstructure appears to be slightly recovered, with the ferrite microstructure appearing to be less irregular. The tempering leads to coarsening of the microstructure with an increase of the overall grain size for the Nb1 steel from 2.6 µm in the AQ condition to 3.2 µm in the over-aged (OA) condition and for the Nb2Mo2 steel from 1.9 to 2.4 µm, respectively. The recovery effect on the mean KAM is more challenging to capture because of statistical reasons, but a significant decrease is observed for the Nb1 steel from 0.48 in the AQ condition to 0.38 for the OA condition.
Further, the HR-TEM investigation confirmed the presence of fine precipitates, as shown in Figure 8 for the Nb1 and Nb2Mo2 steels. Two types of carbides were observed in the AQ samples, i.e., coarse and monolayer platelet carbides. The coarse carbides were likely strain-induced carbides formed in austenite at higher temperatures [9,11], while the tiny platelets, of approximately 2 nm in length, precipitated in the irregular ferrite. However, the ultra-fine carbides are rarely observed in the as-quenched condition and it is suggested that the strength of the present steels is not markedly influenced by these tiny and rare carbides. The compositions of these ultra-fine carbides have not been characterized because of their small size. In the samples with peak-aged condition (aged for 25 min at 630 °C), a large number of nano-sized precipitates is observed in the irregular ferrite for all four samples. The carbide number densities are 4 × 10³, 5 × 10³, 5.8 × 10³, and 9.2 × 103 µm−3 for the Nb1, Nb1Mo1, Nb1Mo2, and Nb2Mo2 steels, respectively. The increase in carbide number density with increasing Mo and Nb additions is consistent with the observations made in a recent study by Zhang et al. [23]. The fast Fourier transform diffractograms are obtained from the HR-TEM Moiré fringe images and confirm the Baker-Nutting orientation relationship (BN-OR) between carbides and ferrite. On the other hand, the carbide sizes, i.e., their lengths, for the four investigated steels in the peak-aged condition are very similar with 3.9 ± 1.3, 4.1 ± 1.6, 4.2 ± 1.4, and 3.7 ± 1 nm, respectively. For the over-aged samples (aged for 400 min at 630 °C), the size of these precipitates is larger, i.e., 5.5–6 nm in length with a few atomic layers wide in all investigated steels, as summarized in Figure 9. In the over-aged Nb-Mo-bearing steels, the chemical compositions of the nanometer-sized carbides, (Nbx, Mox−1)C, were determined using EDX spectroscopy. The Nb/Mo ratio was estimated to be 1:1 for Nb1Mo2 and Nb2Mo2, while 3:2 for Nb1Mo1, indicating an increase of the Mo content in the precipitate composition with increase of the nominal Mo bulk composition, in accordance with other studies [8,9]. These results provide, however, only an approximate composition analysis because the nanometer sized carbides are embedded in the ferrite matrix and the nanoprobe of the electron beam may have spread from the nanometer-sized carbide to the ferrite matrix. Thus, a more advanced and precise analysis would be required to quantify the three-dimensional distribution of chemical compositions in the corresponding (Nbx, Mox−1)C carbides.

3.2. Modeling

3.2.1. Time-Temperature Equivalence

The hardening peak observed during aging is due to precipitation of carbides but microstructure analysis shows that it is also affected by softening of the as-quenched microstructure because of tempering. To model the true precipitation strengthening effect this softening contribution is determined from the microstructure parameters obtained by EBSD using a general yield strength model [1].
The temperature independence of the peak hardness suggests that the tempering state is similar and the same fraction of alloying elements have precipitated at the peak. This is consistent with the solubility of Nb in ferrite being much lower than the Nb content of the steels such that the equilibrium fraction precipitated is essentially independent of temperature.
The timescale of the age hardening kinetics shifts to longer times with decreasing temperature. A temperature-corrected time, P, is introduced in Equation (2) based on the Arrhenius law such that:
  P = t exp ( Q R T )  
where Q (kJ/mol) is an effective activation energy, T is the aging temperature (K), and R the universal gas constant (J/mol/K). At the peak aging time, t p , the precipitation and tempering states are the same for the three temperatures. The relationship between the peak aging time and the temperature is then given by Equation (3):
  ln ( t p ) = Q R T + ln ( P P )  
where ln ( P P ) is the intercept of the Arrhenius-plot. The peak aging time is determined for each age hardening curve with a polynomial fit to consider all the hardness measurements near the peak. The analysis of the peak aging times permits to determine Q, as shown in Figure 10. For the four investigated steels, Q is approximately 230 kJ/mol. The value of P P is the same for the Nb–Mo-bearing steels but is slightly smaller for the Nb1 steel, i.e., 10−12 min vs 7 × 10⁻¹³ min. The slightly faster age hardening behavior in the Nb1 steel may be rationalized with the faster diffusion of Nb compared to Mo [24].

3.2.2. Tempering

To determine the microstructure softening during aging, a general yield stress model is used with Equation (4), considering a linear sum of the various yield stress contributions [1]:
  σ y = σ 0 + σ s s + σ g s + σ ρ + σ p p t  
where σ 0 is the friction stress, σ s s accounts for solid solution strength, σ g s is the Hall-Petch relation to account for the role of grain size, σ ρ is the contribution from dislocations and σ p p t is the precipitation strength. Except σ p p t all these strengthening contributions may be assessed from the literature and/or from the microstructure analyses previously detailed. For convenience, all of these contributions are referred to as the yield stress of the bulk, i.e., σ b u l k = σ 0 + σ s s + σ g s + σ ρ .
The friction stress and the solid solution strength from alloying elements are estimated to be 108 MPa for the four steels according to Equation (5), as proposed by Choquet et al. [25]:
  σ 0 + σ s s = 63 + 23   M n + 53   S i + 700   P  
where the stress is in MPa and concentrations are in wt.%. This relationship does not account for potential solute solution strength of Nb and Mo, which, however, appears to be rather low even in the as-quenched condition of the present steels. For example, the solution strength for 0.2 wt.% Mo is estimated to be 2 MPa [26]. The grain size contribution is determined using the Hall-Petch relationship implemented by Iza-Mendia and Gutiérrez [20]. Here, a lower strengthening contribution is taken into account for LAGB than for HAGB that is proportional to the square root of the disorientation angle between grains [27]. This model appears to be a realistic approach to describe irregular ferrite microstructures with various disorientation profiles and LAGB densities. After implementation of the model to include M/A, the grain boundary strengthening contribution is described by Equation (6) as:
  σ g s = k y [ 2 ° θ < 15 ° f I F θ θ 15 + θ 15 ° f I F θ + f M / A ]   E Q A D 2 ° 1 / 2  
where f I F θ is the grain boundary frequency of disorientation θ (°) in the irregular ferrite and f M / A is the M/A phase boundary frequency with the sum of the boundary fraction f I F θ + f M / A = 2 ° θ < 15 ° f I F θ + θ 15 ° f I F θ + f M / A = 1 . The parameter k y is the Hall-Petch coefficient that had been obtained after calibration of the model with ferrite-pearlite microstructures [20], i.e., k y = 19.4   MPa . mm 0.5 . The dislocation strengthening contribution is determined using the Taylor relationship, i.e. Equation (7), considering the geometrically necessary dislocation density ρ G N D [28] only:
  σ ρ = α M G b ρ G N D      
where α = 0.3 is a constant, M = 3 the Taylor factor, μ = 80   G P a the shear modulus, and b = 0.25   nm the magnitude of the Burgers vector. Here ρ G N D is assessed from K A M ¯ (in rad), the mean KAM value of the irregular ferrite, using the approach of Calcagnotto et al. [22]. However, overestimations of the dislocation density using this law were reported [10,20,22]. As shown in Equation (8), a noise term, K A M n o i s e , to account for the relative angular resolution of the EBSD measurement was thus introduced:
  ρ G N D = 2 ( K A M ¯ K A M n o i s e ) u b    
where u is the unit length, corresponding to the mean distance between the center of the reference pixel and the centers of all the pixels included in the KAM calculation. K A M n o i s e = 0.3° has been determined as the y-intercept of the mean KAM as a function of the unit length measured in several irregular ferrite grains with various distortion states. Finally the dislocations densities in the investigated conditions range from between 5 × 10¹³ m−2 for the over-aged Nb1 to 2.2 × 10¹⁴ m−2 for the as-quenched Nb2Mo2. It is worth noting that part of the geometrically necessary dislocations are not included in this calculation because the maximum disorientation considered in the KAM calculation is 2°. However, the larger disorientations are incorporated into the grain size strengthening contribution term by having different strengthening coefficients for LAGB.
The validity of the general yield stress model in Equation (4) is tested on the as-quenched conditions because the precipitation strengthening contribution is expected to be negligible, considering the small size and low density of the precipitates. The modeled yield stress values are compared to the hardness measurements, using a basic relationship H = κ σ [29,30] where κ is a conversion factor that here was determined to be 3.7 HV/MPa from the average of the conversion factors obtained for each steel. This conversion factor provides a consistent description of the experimental hardness measurements with an increase of the grain size and dislocation strengthening contributions with increasing Nb–Mo content (see Figure 11). However, the conversion factor is higher than expected [29] as the present analysis considers a lower limit for the dislocation density and does not account for any solute solution and/or precipitation strengthening contributions from Nb and Mo.
The softening due to tempering of the microstructure during aging is then estimated from Equation (4) using the EBSD data obtained for tempered Nb1 and Nb2Mo2 steels (see Figure 7) and considering σ p p t = 0 . Figure 12 shows the softening fraction plotted as a function of aging time at 630 °C. In a first approximation, the normalized tempering behavior is assumed to be the same for both steels. Equation (9) is employed to describe the softening fraction because of tempering [31]:
  τ ( t ) = 1 σ b u l k ( t ) σ b u l k A Q = 1 e ( D 1 t m 1 )  
where the predicted yield stress of the bulk as a function of the aging time (in min) is normalized to the as-quenched conditions for each steel. The adjustable parameters in Equation (9) are taken to be D 1 = 0.045 and m 1 = 0.13 in order to reasonably well describe the trend of the tempering behavior at 630 °C for the six microstructures investigated. Considering that the timescale for tempering is shifted with the temperature according to the Arrhenius law, the model can then be extrapolated to other aging temperatures using the temperature-corrected time of Equation (2) with the Q and Pp determined from the age hardening curves, see Figure 10.

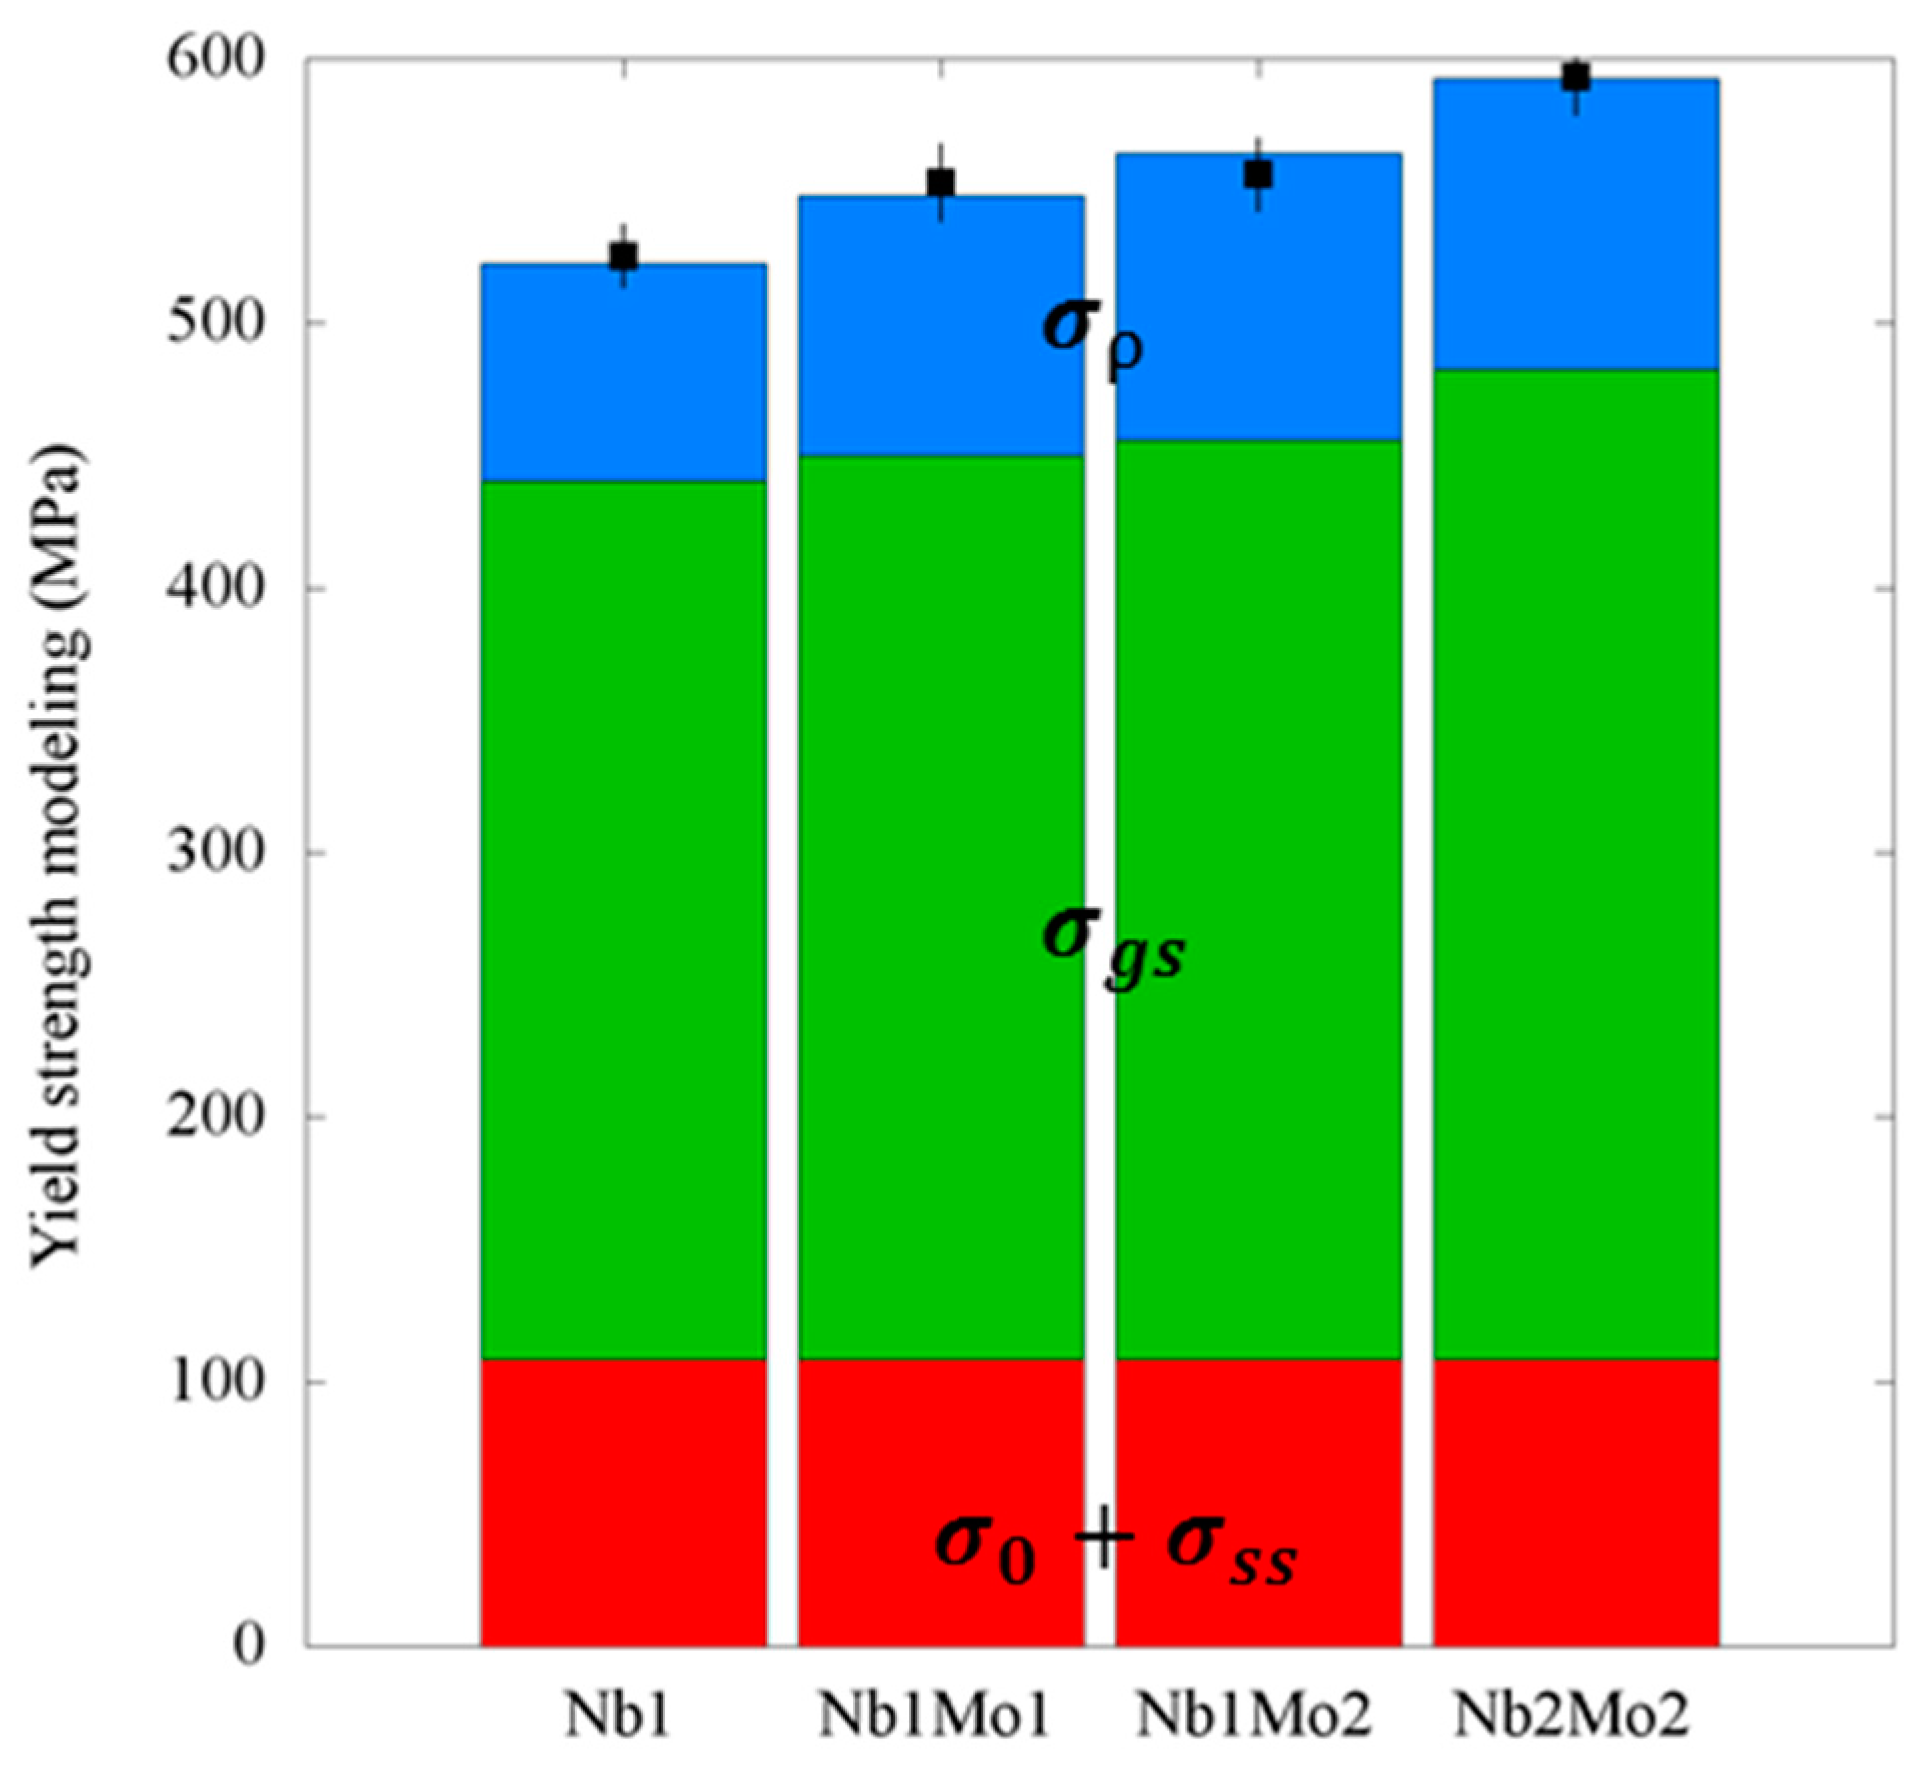
3.2.3. Precipitation Strengthening Model

The age hardening curve is the result of a combination of precipitation hardening and bulk softening due to tempering, as schematically presented in Figure 13.
The true precipitation strengthening curves are thus obtained by subtracting the microstructure softening from the age hardening curves. A precipitation hardening model has been developed to describe the normalized master curves. The model is based on the Shercliff-Ashby approach [32] with Equations (10)–(12), assuming that the total precipitation strengthening is the harmonic mean of precipitate shearing ( Δ s h , also known as Friedel effect) and bypassing ( Δ b y , also known as Orowan looping), i.e.,:
  Δ σ p p t = 2 1 Δ σ s h + 1 Δ σ b y  
  Δ σ s h = K 1 f 1 / 2 r 1 / 2  
  σ b y = K 2 f 1 / 2 r  
Here f and r are the volume fraction and mean radius of the precipitates, respectively. K 1 and K 2 are constants. In the Shercliff-Ashby approach originally applied to aluminum alloys [32] and adopted in previous studies for HSLA steels containing Ti, V, and Nb [4,5], a precipitate coarsening law according to the Lifshitz-Slyozov-Wagner (LSW) theory is assumed, i.e., r ( t ) t 1 / 3 , such that Equation (13) provides the hardening model:
  Δ H p p t Δ H p = 2 C 1 ( 1 exp ( P * / τ 1 ) ) 1 / 2 P * 1 / 6 1 + P * 1 / 2  
where τ 1 = 0.35 and C 1 = 1.03 are normalization constants. This model appears to be suitable to describe the over-aging behavior for Nb–Mo-bearing steels. However, it overestimates the under-aged strengthening behavior.
For shorter aging times a growth law is assumed instead, i.e., r ( t ) t 1 / 2 . For the evolution of the precipitation fraction, a Johnson-Mehl-Avrami-Kolmogorov (JMAK) law given by Equation (14) is adopted, i.e.,:
f ( t ) = 1 exp ( t n β )  
where β is a temperature-dependent rate parameter. The exponent n is taken to be 1.35 from Perrard et al. [16], who studied the precipitation of NbC in highly dislocated HSLA Nb-bearing steels. Assuming that Δ σ s h and Δ σ b y are equal at the aging peak and combining Equations (10) and (11), Equation (15) is obtained as hardening model:
  Δ H p p t Δ H p = 2 C 2 ( 1 exp ( P * n / τ 2 ) ) 1 / 2 P * 1 / 4 1 + P * 3 / 4  
with τ 2 = 0.36 and C 2 = 1.03 as normalization parameters. This model describes adequately the under-aged hardening kinetics. Therefore, the precipitation hardening model used in this study is a combination of these two models, with Equation (15) for P * < 1 and Equation (13) for P * > 1 , i.e., the transition from a growth to a coarsening law occurs at the aging peak. Such a transition is reasonable as the decrease in precipitation strength is associated with an increase in inter-particle spacing due to coarsening.
The contributions of tempering and precipitation on age hardening are shown in Figure 14 for the four investigated steels. The master curve obtained from the above-described analysis to describe the hardness measurements performed at the three aging temperatures is plotted using Equation (2) as a function of the normalized temperature-corrected time P * = P / P p . The red curve shows the microstructure softening because of tempering described in Equation (9) and the blue curve shows the age hardening behavior after adding the precipitation strengthening contribution from the models according to Equations (13) and (15). The simulated hardening evolution is in good agreement with the experimental measurements except for short times at lower aging temperatures (580 °C and mainly 530 °C). A more detailed investigation of the microstructure softening because of tempering, especially at lower aging temperatures, may explain this discrepancy.

3.3. Coiling Simulations

3.3.1. Microstructure

The transformation hardening is assessed by microstructure investigation after coiling simulations (see path 3 in Figure 1) using the general yield stress model previously described with Equations (4)–(8). Coiling temperatures of 500 °C, 550 °C, 600 °C, and 650 °C were studied for Nb1 and Nb1Mo2 steels to quantify the effect of Mo on transformation hardening and for Nb1Mo1 and Nb2Mo2 steels only the coiling temperature of 600 °C was considered.
As an example, Figure 15 shows the Nb1 and Nb1Mo2 microstructures after coiling simulations. For Nb1, no M/A is observed for any of the coiling temperatures compared to the as-quenched condition (see Figure 6). However, at the coiling temperature of 500 °C the irregular ferrite microstructure is otherwise very similar to that of the as-quenched condition, e.g., in terms of the bainitic ferrite fraction, while with the increase of coiling temperature this fraction seems to decrease and ferrite grains appear to be coarser. Similarly, the decrease of bainitic ferrite in the irregular ferrite microstructure with increasing coiling temperature is also observed for Nb1Mo2. However, M/A is observed after coiling simulation in Nb1Mo2. The fraction is rather low at 550 °C and 650 °C but significant at 600 °C. Figure 16a,b show that M/A islands are coarser and localized in the bainitic ferrite for a coiling temperature of 600 °C compared to the as-quenched condition where M/A was in the form of fine islands randomly distributed in the microstructure. For coiling simulation at 650 °C a small portion of pearlite is also observed (see Figure 16c,d). This illustrates the microstructure changes from an irregular ferrite microstructure containing significant bainitic ferrite fraction at low coiling temperature to a ferrite-pearlite microstructure with increasing coiling temperature. These observations confirm the delaying effect of Mo on the austenite-to-ferrite transformation [7,8,14].
Similar observations were made for Nb1Mo1 and Nb2Mo2 coiling simulated at 600 °C. The microstructure features for coiling simulation are reported in Table 4 for the four investigated steels. The increase of the overall grain size with increasing the coiling simulation temperature is clearly observed, with an EQAD approximately 15% larger after coiling at 600 °C than in the as-quenched condition (see Table 3). The measurements of the irregular ferrite mean KAM indicate that the bainitic ferrite fraction is approximately the same for the as-quenched microstructure and after coiling simulation at 500 °C and decrease with increasing the coiling temperature.

3.3.2. Transformation Hardening

The significant microstructure differences observed after coiling simulations have a clear effect on the mechanical properties. Using the EBSD data presented in Table 4 combined with the general yield stress model described in Equations (4)–(8), the softening fraction of the resulting transformation products from the coiling simulation with respect to the as-quenched condition is calculated and shown in Figure 17. Although the microstructures are different between the four steels, no significant differences in the relative coil cooling softening fraction is obtained. Similar to the softening because of tempering, see Equation (9), Equation (16) describes the softening fraction as a function of coiling temperature such that:
  τ   ( T c ) = 1 σ b u l k ( T c ) σ b u l k A Q = 1 e ( D 2 T c m 2 )  
where T c is the coiling temperature (in °C), whereas D 2 = 5.0 × 10⁻¹⁹ and m 2 = 6.2 are fitting constants.

3.3.3. Model Validation

The generalization of the precipitation strengthening model for non-isothermal treatment paths is given by Equation (17) obtained by integrating P over the time-temperature path, i.e., [4]:
  P = t T c t 450 ° C exp ( Q R T ( t ) ) d t  
where T ( t ) is the temperature as a function of time during coiling. The limit of 450 °C is taken here because precipitation rates become insignificant below this temperature for coil cooling conditions.
Figure 18 shows the hardening obtained after coiling as a function of temperature for the coil cooling rate of 0.5 °C/min employed in the tests. The red curve is the microstructure strength without precipitation as obtained with the softening analysis (see Figure 17) and the black curve is the overall strength including precipitation strength contribution, calculated from Equations (13), (15), and (17). The model predictions are in reasonable agreement with the measured hardness values on the coil cooled samples considering the complex microstructural changes occurring during coiling. At low coiling temperature, the strength is similar to the as-quenched conditions with a predominantly bainitic ferrite microstructure with little or no precipitation hardening. When the coiling temperature increases, the microstructure is less bainitic but the loss of strength is compensated by precipitation hardening, until a maximum at 600 °C is reached. Above that temperature, precipitate coarsening is expected at the detriment of precipitation hardening. Finally, for higher coiling temperatures, a lower strength than at the as-quenched conditions is expected, with a ferrite-pearlite microstructure and reduced precipitation hardening.
The conclusions regarding the precipitation hardening as a function of coiling simulation have been confirmed with TEM observations. The largest carbide number density is observed for coiling simulations at 600 °C with values of 8.6 × 10², 9 × 10², and 2.9 × 103 µm−3 for the Nb1Mo1, Nb1Mo2, and Nb2Mo2 steels, respectively. The carbide sizes for this coiling condition falls independent of steel chemistry in the range of 4.2 to 4.5 nm that is comparable to the peak-aged condition (see Figure 9). The carbide density is about a factor 3 larger in the Nb2Mo2 steel as compared to the other steels with lower Nb content. For 550 °C coiling simulation, the number density of carbides is significantly lower and their sizes are smaller than at 600 °C confirming an under-aged condition. In detail, the carbide number density is 1.1 × 10², 3.3 × 10², and 8.1 × 102 µm−3 for the Nb1Mo1, Nb1Mo2 and Nb2Mo2 steels, respectively, and the average carbide size is 3 nm independent of steel chemistry. At 650 °C coiling temperature, precipitates are only recorded in the Nb2Mo2 specimens with a carbide number density of 1.1×103 µm−3 that is comparable to that observed at 550 °C and an average carbide size of 5.3 nm which is consistent with an over-aged condition. In the steels with a lower Nb content, however, the carbide density is remarkably low for this coiling condition where the microstructure is primarily polygonal ferrite with a low dislocation density reducing the effective nucleation density for carbide formation. Thus, the reduced precipitation strength for these steels appears to also be affected by a lower nuclei density rather than by the otherwise proposed coarsening behavior. Further studies will be required to quantify in more detail the precipitation behavior at higher coiling temperatures (>650 °C) in the steels with lower Nb contents (<0.1 wt.%).
Optimum precipitation strengthening windows were determined in previous studies for a complex-phase Nb–Mo steel (0.05C-1.9Mn-0.05Nb-0.5Mo-0.004N-0.04Si-0.05Al (wt.%)) by Sarkar et al. [33] and conventional HSLA-Nb steels with a polygonal ferrite/pearlite microstructure by Militzer et al. [4]. As shown elsewhere [18], the predicted precipitation strengthening contribution as a function of coiling temperature is similar for the Nb–Mo complex-phase steel as that obtained for the Nb–Mo steels investigated here. The optimum coiling temperature window to have at least 90% of precipitation peak strength is much narrower in the Nb–Mo steels as compared to that of 100 °C (570–670°C) in conventional Nb-microalloyed steels with ferrite-pearlite microstructures where transformation hardening is negligible such that only precipitation hardening is affected during coiling. In the Nb–Mo steels, on the other hand, transformation hardening is another strength contribution that depends in detail on the coiling condition. This aspect was not quantified by Sarkar et al. but the current study suggests that the coiling temperature window to have overall strength levels within 5% of the absolute peak strength is, as shown in Figure 17, about 50 °C, i.e., 575 °C to 625 °C for the investigated Nb–Mo steels (565–615 °C for Nb1).

4. Conclusions

The potential of precipitation strengthening during coiling for hot-strip Nb–Mo-bearing low-carbon steels has been investigated with laboratory studies simulating the hot-rolling process. A hardening model predicting strength changes as a function of coil cooling conditions has been developed. The model is based on a standard additive approach of the strengthening contributions, where the microstructure strengthening contribution is determined based on microstructure parameters obtained from EBSD analyses and the precipitation strengthening contribution is assessed from age hardening kinetics using a modified Shercliff-Ashby approach.
In the investigated conditions, the microstructures of the four studied steels ranges from ferrite-pearlite to irregular bainitic ferrite. The potential of Nb–Mo bearing microalloyed steels was verified as Nb and Mo have a clear strengthening effect on the microstructure, decreasing the overall grain size and increasing the dislocation density after direct quenching or coiling simulations. Increasing Nb and Mo contents also increases the precipitation strengthening potential but in the investigated composition ranges the microstructure strengthening is more significant. The microstructure strengthening potential by decreasing the coiling temperature for those steels was also verified, going from a ferrite-pearlite microstructure at higher coiling temperature to a more bainitic ferrite microstructure for lower coiling temperature. Increasing Nb and Mo content also appears to increase the M/A fraction.
The key point of the developed model is that it accounts for both precipitation age hardening and tempering of highly dislocated bainitic and/or irregular ferrite. The model provides insight into optimizing the hardening after coiling by finding the best balance between precipitation strengthening and transformation hardening due to a highly dislocated bainitic ferrite microstructure. The model predictions are in reasonable agreement with experimental hardness measurement in coil cooling simulated samples. An optimum coiling temperature window of 50 °C between 575 °C and 625 °C is concluded from this analysis for the Nb–Mo bearing steel. To extend the proposed model to predict property variations in industrial coils it is suggested to integrate it with a coil cooling model that will have to be developed and benchmarked with temperature measurements at different coil positions.

Author Contributions

J.-Y.M. and M.M. conceived and designed the hot-torsion tests and developed the model. J.-Y.M. performed the hot-torsion tests, characterized the microstructures with EBSD and analyzed the data. J.-R.Y. and Y.W.C. conducted the HR-TEM studies. N.H.G. and S.J.K. organized the laboratory steel making and conducted the hardness measurements. B.J. and H.M. coordinated the work and contributed to the interpretation of the data. J.-Y.M., M.M. and H.M. wrote the paper with the input of all co-authors.

Funding

This research was funded by the Companhia Brasileira de Metalurgia e Mineração (CBMM) grant number M201.

Acknowledgments

The fruitful discussions with W.J. Poole, J.D. Embury, and A. Deschamps as well as F. de Geuser are acknowledged with gratitude.

Conflicts of Interest

The authors declare no conflict of interest. The funding sponsors had no role in the design of the study; in the collection, analyses, or interpretation of data; in the writing of the manuscript, and in the decision to publish the results.

References

  1. Gladman, T. The Physical Metallurgy of Microalloyed Steels, 1st ed.; Institute of Materials: London, UK, 1997. [Google Scholar]
  2. Bouaziz, O.; Zurob, H.; Huang, M. Driving force and logic of development of advanced high strength steels for automotive applications. Steel Res. Int. 2013, 84, 937–947. [Google Scholar] [CrossRef]
  3. Kim, Y.M.; Kim, S.K.; Lim, Y.J.; Kim, N.J. Effect of microstructure on the yield ratio and low temperature toughness of linepipe steels. ISIJ Int. 2002, 42, 1571–1577. [Google Scholar] [CrossRef]
  4. Militzer, M.; Hawbolt, E.B.; Meadowcroft, T.R. Microstructural model for hot strip rolling of high-strength low-alloy steels. Metall. Mater. Trans. 2000, 31, 1247–1259. [Google Scholar] [CrossRef]
  5. Militzer, M.; Poole, W.J.; Sun, W. Precipitation hardening of HSLA steels. Steel Res. 1998, 69, 279–285. [Google Scholar] [CrossRef]
  6. Matlock, D.K.; Speer, J.G.; De Moor, E.; Gibbs, P.J. Recent developments in advanced high strength sheet steels for automotive applications: An overview. JEStech 2012, 15, 1–12. [Google Scholar]
  7. Mohrbacher, H.; Sun, X.; Yong, Q.; Dong, H. MoNb-based alloying concepts for low-carbon bainitic steels. In Advanced Steels: The Recent Scenario in Steel Science and Technology; Weng, Y., Dong, H., Gan, Y., Eds.; Springer: Berlin/Heidelberg, Germany, 2011; pp. 289–302. [Google Scholar]
  8. Lee, W.-B.; Hong, S.-G.; Park, C.-G.; Park, S.-H. Carbide precipitation and high-temperature strength of hot-rolled high-strength low-alloy steels containing Nb and Mo. Metall. Mater. Trans. A 2002, 33, 1689–1698. [Google Scholar] [CrossRef]
  9. Huang, B.M.; Yang, J.R.; Yen, H.W.; Hsu, C.H.; Huang, C.Y.; Mohrbacher, H. Secondary hardened bainite. Mater. Sci. Technol. 2014, 30, 1014–1023. [Google Scholar] [CrossRef]
  10. Isasti, N.; Jorge-Badiola, D.; Taheri, M.L.; Uranga, P. Microstructural features controlling mechanical properties in Nb–Momicroalloyed steels. Part I: yield strength. Metall. Mater. Trans. A 2014, 45, 4960–4971. [Google Scholar] [CrossRef]
  11. Dutta, B.; Palmiere, E.J.; Sellars, C.M. Modelling the kinetics of strain-induced precipitation in Nb microalloyed steels. Acta. Mater 2001, 49, 785–794. [Google Scholar] [CrossRef]
  12. Fernandez, A.I.; Uranga, P.; Lopez, B.; Rodriguez-Ibabe, J.M. Dynamic recrystallization behavior covering a wide austenite grain size range in Nb and Nb–Ti microalloyed steels. Mater. Sci. Eng. A 2003, 361, 367–376. [Google Scholar] [CrossRef]
  13. Hutchinson, C.R.; Zurob, H.S.; Sinclair, C.W.; Brechet, Y.J.M. The comparative effectiveness of Nb solute and NbC precipitates at impeding grain-boundary motion in Nb steels. Scr. Mater. 2008, 59, 635–637. [Google Scholar] [CrossRef]
  14. Uemori, R.; Chijiiwa, R.; Tamehiro, H.; Morikawa, H. AP-FIM study on the effect of Mo addition on microstructure in Ti-Nb steel. Appl. Surf. Sci. 1994, 76–77, 255–260. [Google Scholar] [CrossRef]
  15. Charleux, M.; Poole, W.J.; Militzer, M.; Deschamps, A. Precipitation behavior and its effect on strengthening of an HSLA-Nb/Ti steel. Metall. Mater. Trans. A 2001, 32, 1635–1647. [Google Scholar] [CrossRef]
  16. Perrard, F.; Deschamps, A.; Maugis, P. Modelling the precipitation of NbC on dislocations in α-Fe. Acta Mater. 2007, 55, 1255–1266. [Google Scholar] [CrossRef] [Green Version]
  17. Maetz, J.-Y.; Militzer, M.; Goo, N.H.; Kim, S.J.; Jian, B.; Mohrbacher, H. Modelling of precipitation hardening in Nb–Molow carbon steels. In Proceedings of the Thermomechanical Processing (TMP) Conference, Milan, Italy, 26–28 October 2016. [Google Scholar]
  18. Maetz, J.-Y.; Militzer, M.; Chen, H.Y.W.; Yang, J.R.; Goo, N.H.; Kim, S.J.; Jian, B.; Mohrbacher, H. Modeling of age hardening kinetics during coiling of high performance Nb–Mosteels. In Proceedings of the International Symposium on New Developments in Advanced High-Strength Sheets steels, Warrendale, PA, USA, 30 May–2 June 2017. [Google Scholar]
  19. Hall, D.; Worobec, J. Torsion simulation of the hot strip rolling process. In Phase Transformations during the Thermal/Mechanical Processing of Steel, Proceedings of 34th Annual Conference of Metallurgists of CIM, Vancouver, BC, Canada, 20–24 August 1995; Canadian Institute of Mining, Metallurgy and Petroleum: Westmount, QC, Canada, 1995; pp. 305–316. [Google Scholar]
  20. Iza-Mendia, A.; Gutiérrez, I. Generalization of the existing relations between microstructure and yield stress from ferrite-pearlite to high strength steels. Mater. Sci. Eng. A 2013, 561, 40–51. [Google Scholar] [CrossRef]
  21. Reichert, J. Structure and properties of complex transformation products in Nb/Mo-microalloyed steels. Ph.D. Thesis, The University of British Columbia, Vancouver, BC, Canada, April 2016. [Google Scholar]
  22. Calcagnotto, M.; Ponge, D.; Demir, E.; Raabe, D. Orientation gradients and geometrically necessary dislocations in ultrafine grained dual-phase steels studied by 2D and 3D EBSD. Mater. Sci. Eng. A 2010, 527, 2738–2746. [Google Scholar] [CrossRef]
  23. Zhang, Z.Y.; Sun, X.J.; Yong, Q.L.; Li, Z.D.; Wang, Z.Q.; Wang, G.D. Precipitation behavior of nanometer-sized carbides in Nb–Momicroalloyed high strength steel and its strengthening mechanism. Acta Metall. Sin. 2016, 52, 410. [Google Scholar]
  24. Mehrer, H. Landolt-Börnstein—Group III Condensed Matter; Springer: Berlin/Heidelberg, Germany, 1990. [Google Scholar]
  25. Choquet, P.; Fabregue, P.; Guisti, J.; Chamont, B.; Pezant, J.N.; Blancet, F. Modelling of forces, structure and final properties during the hot rolling process on the hot strip mill. In Mathematical Modelling of Hot Rolling of Steel; Canadian Institute of Mining and Metallurgy: Montreal, QC, Canada, August 1990; pp. 34–43. [Google Scholar]
  26. Pickering, F.B.; Gladman, T. Metallurgical Developments in Carbon Steels; Iron and Steel Institute: London, UK, 1963. [Google Scholar]
  27. Hansen, N. Hall-Petch relation and boundary strengthening. Scr. Mater. 2004, 51, 801–806. [Google Scholar] [CrossRef]
  28. Brewer, L.N.; Field, D.P.; Merriman, C.C. Mapping and assessing plastic deformation using EBSD. In Electron Backscatter Diffraction in Materials Science, 2nd ed.; Schwartz, A.J., Kumar, M., Adams, B.L., Field, D.P., Eds.; Springer: Berlin/Heidelberg, Germany, 2009; p. 251. [Google Scholar]
  29. Ashby, M.F.; Jones, D.R.H. Engineering Materials 2, 3rd ed.; Pergamon: Oxford, UK; Burlington, MA, USA, 1980. [Google Scholar]
  30. Zhang, P.; Li, S.X.; Zhang, Z.F. General relationship between strength and hardness. Mater. Sci. Eng. A 2011, 529, 62–73. [Google Scholar] [CrossRef]
  31. Zhang, Z.; Delagnes, D.; Bernhart, G. Microstructure evolution of hot-work tool steels during tempering and definition of a kinetic law based on hardness measurements. Mater. Sci. Eng. A 2004, 380, 222–230. [Google Scholar] [CrossRef]
  32. Shercliff, H.R.; Ashby, M.F. A process model for age hardening of aluminium alloys—I. The model. Acta Metall. Mater. 1990, 38, 1789–1802. [Google Scholar] [CrossRef]
  33. Sarkar, S.; Militzer, M. Microstructure evolution model for hot strip rolling of Nb–Mo microalloyed complex phase steel. Mater. Sci. Technol. 2009, 25, 1134–1146. [Google Scholar] [CrossRef]
Figure 1. Summary of the various thermo-mechanical treatments employed in this study: path 1 for as-quenched condition, path 2 for isothermal age hardening treatments, and path 3 for coiling simulation.
Metals 08 00758 g001
Figure 2. Example of electron backscatter diffraction (EBSD) analysis of martensite islands: (a) inverse pole figure (IPF) map; (b) index quality (IQ) map; (c) clusters of randomly-oriented points with low IQ values; and (d) clusters considered as martensite islands (>0.2 μm2) excluding grain boundary points.
Metals 08 00758 g002
Figure 3. Hardness, H, evolution during aging treatments of the as-quenched specimens for the four investigated steels: Nb1, Nb1Mo1, Nb1Mo2, Nb2Mo2. The error bars indicate the standard deviation from the ten hardness measurements.
Metals 08 00758 g003
Figure 4. As-quenched, peak-aged, and associated precipitation hardness for the four investigated steels.
Metals 08 00758 g004
Figure 5. Comparison of the age hardening kinetics for the four Nb-bearing steels at the three aging temperatures of 530 °C, 580 °C and 630 °C.
Metals 08 00758 g005
Figure 6. EBSD IPF maps (left row) and kernel average misorientation (KAM) maps (right row) of the investigated steels Nb1, Nb1Mo1, Nb1Mo2, Nb2Mo2 (top to bottom) for the as-quenched conditions (high angle grain boundaries (HAGB) in dark grey and low angle grain boundaries (LAGB) in white, martensite and retained austenite (M/A) in black).
Metals 08 00758 g006
Figure 7. EBSD IPF maps of the Nb1 and Nb2Mo2 steels peak-aged (PA), 15 min at 630 °C, (Nb1, PA and Nb2Mo2, PA) and over-aged (OA), 690 min at 630 °C (Nb1, OA and Nb2Mo2, OA).
Metals 08 00758 g007
Figure 8. High-resolution transmission electron microscopy (HR-TEM) showing the precipitates in the Nb1 and Nb2Mo2 steels: (a) as-quenched Nb1; (b) peak-aged Nb1; (c) over-aged Nb1; (d) fast Fourier transform diffractogram for the carbide and ferrite of peak-aged Nb1; (e) as-quenched Nb2Mo2; (f) peak-aged Nb2Mo2; (g) over-aged Nb2Mo2; (h) fast Fourier transform diffractogram for the carbide and ferrite in peak-aged Nb2Mo2. The arrows in the FFT images indicated the corresponding index of diffraction spots which belong to matrix and carbides.
Metals 08 00758 g008
Figure 9. The average carbide size in as-quenched, peak-aged, and over-aged conditions for the four studied steels.
Metals 08 00758 g009
Figure 10. Arrhenius plot of the peak aging times.
Metals 08 00758 g010
Figure 11. Comparison of the predicted yield stresses with hardness measurements for as-quenched conditions. The square symbols represent the hardness measurements after conversion using the relationship σ = H / κ with the error bar indicating the standard deviation.
Metals 08 00758 g011
Figure 12. Softening fraction due to tempering of the bulk microstructure during aging at 630 °C for Nb1 and Nb2Mo2 steels, calculated using Equations (4)–(8) with the EBSD data. Solid line depicts the proposed tempering model according to Equation (9).
Metals 08 00758 g012
Figure 13. Schematic representation of the effects of precipitation and tempering on yield stress.
Metals 08 00758 g013
Figure 14. Comparison of modelled and measured hardness for the four investigated steels, Nb1, Nb1Mo1, Nb1Mo2 and Nb2Mo2, at the three aging temperatures. The red curve represents the microstructure softening and the blue curve is obtained by adding the precipitation strengthening contribution.
Metals 08 00758 g014
Figure 15. EBSD IPF maps for Nb1 steel (left) and Nb1Mo2 steel (right) after coiling simulation at four coiling temperatures, i.e., 500 °C, 550 °C, 600 °C and 650 °C, with a cooling rate of 0.5 °C/min for 3 h (HAGB in dark grey and LAGB in white, M/A in black). The areas indicated by dashed lines are shown in more detail in Figure 16.
Metals 08 00758 g015
Figure 16. Microstructure investigation of Nb1Mo2 after coiling simulation at 600 °C (a,b) and at 650 °C (c,d): (a,c) are IQ EBSD maps corresponding to the selected area in Figure 15; (b,d) are SEM images to identify the structures with low IQ values, i.e., martensite (M) and pearlite (P), respectively.
Metals 08 00758 g016
Figure 17. Evolution of the microstructure softening for coiling simulation at various temperatures, calculated from the EBSD data presented in Table 4. Softening model according to Equation (16) is shown with the solid line.
Metals 08 00758 g017
Figure 18. Comparison of measured (symbols) and predicted (solid lines) hardness of hardening after coiling as a function of coiling temperature for the four investigated steels, i.e., Nb1, Nb1Mo1, Nb1Mo2 and Nb2Mo2. The red curves represent the calculated microstructure hardness without precipitation strengthening contribution.
Metals 08 00758 g018
Table 1. Chemical composition (wt.%) of the four investigated steels.
SteelCMnSiNbMo
Nb10.081.50.20.050
Nb1Mo10.081.50.20.050.1
Nb1Mo20.081.50.20.050.2
Nb2Mo20.081.50.20.10.2
Table 2. Schedule for hot-torsion tests.
PassR1–R3F1F2F3F4F5F6F7
Temperature (°C)11001024982958950922910900
Strain (1 s−1 rate)0.33 each0.350.50.40.30.30.30.1
Interpass time (s)1042.41.61.20.80.6-
Table 3. As-quenched microstructure features as determined by EBSD analysis.
SteelNb1Nb1Mo1Nb1Mo2Nb2Mo2
EQAD (>2°) (µm)2.62.42.21.9
LAGB density (mm−1)191282335392
Mean KAM (<2°)0.480.550.600.62
M/A fraction (%)3.13.53.53.9
Table 4. Microstructure features in coiling simulated samples as determined by EBSD analysis.
SteelCoiling Temperature (°C)M/A Fraction (%, ±0.5)Mean KAM (°, ±0.05)EQAD (µm, ±0.1)
Nb150000.512.7
55000.412.9
6000.30.423.0
65000.403.4
Nb1Mo16000.30.472.9
Nb1Mo25000.40.592.4
5501.00.552.4
6002.10.482.5
6500.70.403.2
Nb2Mo26002.10.562.3

