Abstract
H13 steel, which was used as the material for shield machine cutter rings, required tempering to attain superior mechanical properties. The Cr-rich carbide that precipitated during the tempering process definitely decreased the corrosion resistance of the steel. Here, we added rare earth Yttrium to enhance the corrosion resistance of H13 steel. It was found that the inclusions were modified by adding yttrium in the steel, and the formation of Cr23C6 at the grain boundaries during tempering was suppressed. Furthermore, SKPFM measurements demonstrated that the surface potential of yttrium-containing inclusion was comparable to that of the surrounding matrix, thereby reducing the pitting susceptibility of H13 steel. Further investigation showed that yttrium decreased the normal stress range at grain boundaries during the tempering process, and effectively prevented C segregation. Thus, the number of Cr-depleted zones was decreased, and grain boundaries with active Cr atoms were increased. These active Cr atoms effectively sealed the ion channels between the matrix and NaCl solution within the Cr-rich oxide layer, thus improving localized corrosion resistance in the NaCl solution. On the other hand, the electrochemical test and SKPFM exhibited that yttrium reduced the potential loss during tempering, minimized the potential degradation of the matrix, and improved the corrosion resistance of H13 steel with yttrium. Accordingly, the corrosion loss of Y-bearing H13 steel was reduced by 46.6%.
1. Introduction
H13 steel has been widely used to produce shield machine cutter rings due to its good strength, hardness, and toughness [1,2,3]. However, in aggressive environments, the cutter ring frequently experiences localized corrosion, including pitting and intergranular corrosion, which substantially shortens its service life [4,5]. This corrosion susceptibility is primarily attributed to two factors. On one hand, during tempering, Cr-rich carbides (e.g., M7C3 or M23C6) precipitate preferentially at grain boundaries, depleting the adjacent matrix of Cr and forming Cr-depleted zones [6,7]. These zones serve as anodic regions, promoting localized galvanic corrosion upon exposure to corrosive environments. On the other hand, in addition to microstructural vulnerability, the presence of non-metallic inclusions (e.g., Al2O3 or MnS) in steel can act as pit initiation sites [8].
Cr is a key alloying element in steel for enhancing passivity by forming a protective Cr2O3 layer on the surface. However, during high-temperature heat treatment, Cr reacts with C to form carbides, reducing its effective concentration in the matrix and compromising corrosion resistance [9].
In recent years, the corrosion resistance of steels has been improved significantly by adding rare earths [10,11,12,13,14,15,16,17,18]. For instance, rare earth-modified inclusions were added to low-alloy steels for enhancing the corrosion resistances of the steels [19,20,21]. The mechanism by which rare earths improved the corrosion resistance of steels primarily revolved around rare earth-modified inclusions [22,23,24].
While previous studies have focused on the effects of rare earths on pitting corrosion resistance, their role in mitigating localized corrosion in H13 steel remains underexplored. Notably, rare earths have shown promise in mitigating localized corrosion risk in low alloy steel, as the combination of Cr and rare earth effectively reduced corrosion compared to Cr alone [25], but rare earths’ influence on the localized corrosion behavior of H13 steel in NaCl solutions has not been systematically investigated. Therefore, the corrosion resistance of H13 steel with and without yttrium addition in NaCl solution was studied, and the role of yttrium was discussed.
2. Experimental Method
In this study, H13 steel samples with and without yttrium (hereafter referred to as Y) were prepared to investigate the role of Y in H13 steel corrosion. A 50 kg medium-frequency induction vacuum furnace (model RCVIM-50) was employed for the melting of H13 steel. Once the rare earth yttrium particles with a purity of 99.9% and with size of 3–5 mm were melted completely using a feeding device, the rare earth yttrium was added 5 min before the molten steel came out of the furnace, and then the molten steel with a temperature of 1600 °C was poured into the mold at a temperature of 25 °C. Both steels underwent the same heat treatment, involving oil quenching after heating at 1080 °C for 30 min, followed by air cooling after maintaining at 580 °C for 2 h. The quenched and tempered H13 steel samples without and with Y were called as Q and QT, and YQ and YQT, respectively. These four samples were subjected to a 20 h full-immersion test in a 0.1 mol/L NaCl solution at 25 °C. As shown in Figure 1, the corrosion area was divided into dark area (DA), brown area (BA), and light area (LA) based on the color of the corrosion products. To analyze the yttrium content, inductively coupled plasma mass spectrometry (ICP-MS) was utilized. Carbon content was determined by high-frequency combustion-infrared absorption spectroscopy (HF-IR). Silicon content was analyzed using X-ray fluorescence spectrometry (XRF). Manganese, chromium, molybdenum, and vanadium contents were measured via inductively coupled plasma optical emission spectrometry (ICP-OES). The chemical compositions of both steels are listed in Table 1, revealing 140 ppm Y for the rare earth steel.

Figure 1.
Schematic diagram of experimental design covering heat treatment processes for samples, immersion corrosion testing, and corrosion morphology zoning analysis.

Table 1.
Nominal compositions of the experimental steels (wt.%).
Microstructural characterization was conducted using field-emission scanning electron microscopy (FE-SEM, ZEISS SUPRA55, Carl Zeiss AG, Oberkochen, Germany) operating at 15 kV to investigate the corrosion morphology evolution and the distribution of second-phase particles. The samples were mechanically polished to 1 μm finish, followed by 4% Nital etching (4 mL HNO3 + 96 mL C2H5OH) for 30 ± 5 s to reveal grain boundaries. Energy-dispersive X-ray spectroscopy (EDS) with a spatial resolution of 1 μm was employed to detect elemental at the corrosion pits and oxide scales. Microstructural characterization of martensite was conducted using a FEI Talos F200X field-emission transmission electron microscope (TEM, Thermo Fisher Scientific, Hillsboro, OR, USA). operating at 200 keV with a STEM resolution of 0.16 nm and a minimum electron probe size of 0.25 nm. The analysis comprised bright-field (BF) and dark-field (DF) imaging to visualize martensitic lath/plate morphology, energy-dispersive X-ray spectroscopy (EDS) for quantitative mapping of elemental segregation at grain boundaries, and selective area electron diffraction (SADP) in double-tilt mode to index carbide types. XPS tests of corrosion products were conducted using Thermo Scientific ESCALAB 250Xi equipment, and the element content of the fine spectrum was calculated with Thermo Avantage (v6.9.0) software. X-ray diffraction (XRD) tests were conducted to identify crystalline phases using an Ultima IV X-ray diffractometer (Rigaku Corporation, Tokyo, Japan) operating at 40 kV acceleration voltage and 150 mA tube current. The electrochemical test was carried out on VersaSTAT3 potentiostat (Princeton Applied Research, Oak Ridge, TN, USA). The sample size was 10 mm × 10 mm, and the solution used for the test was 0.1 mol/L NaCl solution. The test used a three-electrode system, the working electrode was H13 steel, the auxiliary electrode was a platinum sheet, the reference electrode was a saturated calomel (SCE) electrode, the potential polarization scanning rate was 0.33 mV/s, and the test temperature was 25 °C. The local volt potential difference (Delta psi) of the sample was determined with a scanning Kelvin probe force microscope (SKPFM) of the Oxford Jupiter XR (Oxford Instruments Asylum Research, Santa Barbara, CA, USA). The scanning resolution was 100 nm. The distribution of rare earth yttrium was examined using ToF SIMS 5-100/ION TOF ToF SIMS 5-100 (IONTOF GmbH, Münster, Germany). To quantify corrosion damage, the three-dimensional (3D) surface morphology of the corrosion sample was measured using a 3D measuring laser microscope (OLS4000, Olympus Corporation, Tokyo, Japan) after removal of corrosion products.
3. Result
3.1. Microstructure
Figure 2a–d show the microstructures of martensite in the four samples mentioned above. Notably, all samples possessed a lath-like martensitic structure. Compared to the quenched state, the tempering precipitates in the QT and YQT samples precipitated at the grain boundaries (abbreviated as GB in Figure 2), as shown in Figure 2c,d. Interestingly, the tempering precipitates precipitated in the YQT sample were much finer, indicating that Y suppressed the tempering precipitates’ precipitation. The X-ray diffraction (XRD) analysis results of the four specimens, as shown in Figure 2e, exhibited only the characteristic peaks of the matrix α-Fe. The precipitates were not evident in the XRD results due to their low content.
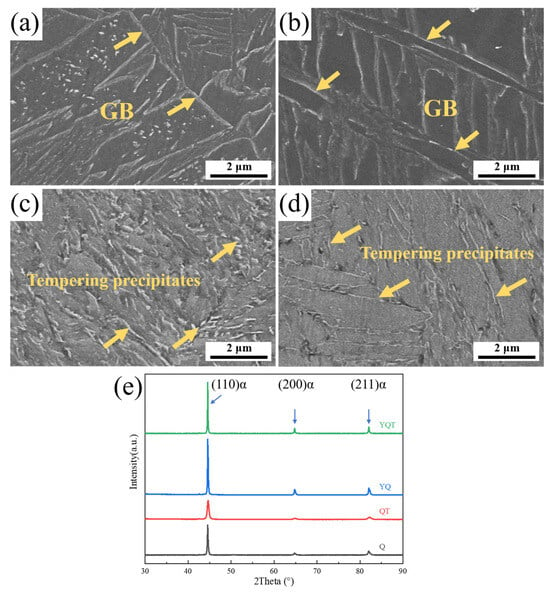
Figure 2.
SEM micrographs and corresponding XRD patterns of the samples: (a) Q, (b) YQ, (c) QT, (d) YQT, and (e) XRD results for all samples.
To further investigate element migration and elemental distribution at grain boundaries during tempering, as well as to clearly identify the type of precipitate, TEM micrographs and EDS maps of the Q, QT, YQ, and YQT samples were presented. Along with this, the calibration of diffraction patterns for the precipitate at the grain boundary and that for the matrix of the H13 steel were both carried out, as shown in Figure 3. As evident from Figure 3a,b, no elemental segregation was found at grain boundaries in the quenched samples. In contrast, Figure 3c,d revealed a pronounced enrichment of Cr at the grain boundaries in the tempered samples. Moreover, Figure 3c showed a clear accumulation of C element at the grain boundary. In Figure 3d, C element segregation was inconspicuous, indicating that Y restrained its segregation behavior during tempering. The presence of enriched regions (solid box) of both C and Cr elements in Figure 3c suggested potential formation of Cr-rich carbide at the grain boundary, accompanied by Cr-depleted zones (dashed circle). Conversely, in Figure 3d, Cr was uniformly distributed across the grain boundary without forming enrichment or depletion zones, suggesting that yttrium was beneficial in decreasing the formation of Cr-rich carbides and Cr-depleted zones. The carbides precipitated at the grain boundaries were identified as Cr23C6 through selected-area electron diffraction (SAED) analysis, as shown in Figure 3e.
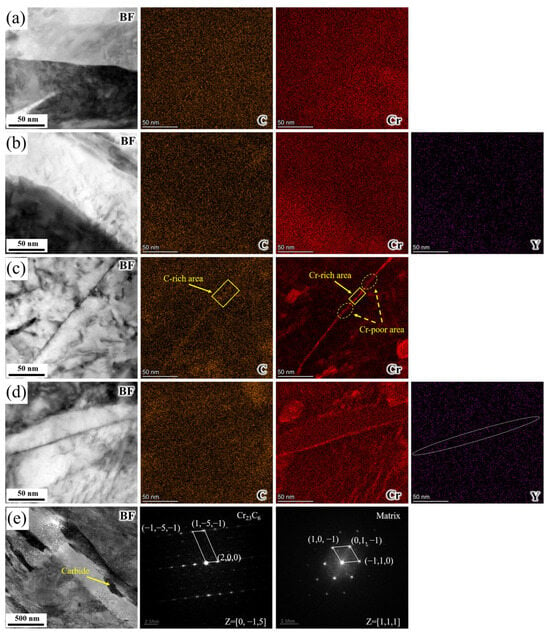
Figure 3.
(a–d) TEM micrographs and TEM-EDS elemental mappings of GBs in samples Q, YQ, QT, and YQT. (e) SAED pattern for carbide and matrix in the QT sample.
The distribution of rare earth Y was characterized using a TOF-SIMS. The results are presented in Figure 4. Figure 4a shows the TOF-SIMS spectrum, indicating the presence of Y element in this region. Figure 4b depicts the mapping of Cr element distribution, while Figure 4c displays the mapping of Y element distribution. Figure 4d is a comparative map of Cr and Y element distributions. One can see that the grain boundaries were constructed based on the segregation tendency of Cr elements. It was observed that Y existed in the region where Cr elements were enriched at the grain boundaries. No obvious inclusions were found in the same region, suggesting that rare earth Y might segregate towards the grain boundaries in atomic form. Given the relatively large radius of rare earth atoms, they were more likely to occupy defect sites such as grain boundaries [26].
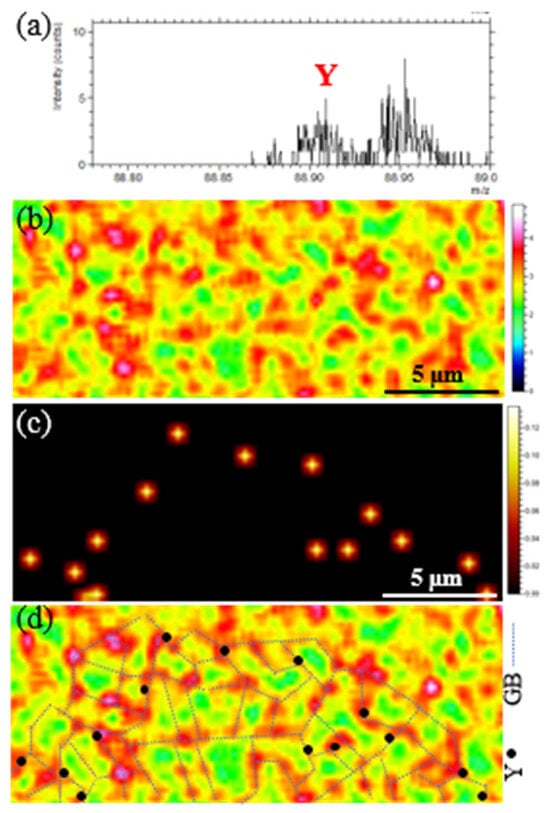
Figure 4.
TOF-SIMS analysis results of the YQT sample: (a) TOF-SIMS spectrum, (b) distribution of Cr, (c) distribution of Y, (d) comparative map illustrating the elemental distributions of Cr and Y.
3.2. Immersion Test
To study the effect of Y and tempering treatment on the corrosion resistance of H13 steel, the Q, QT, YQ, and YQT samples underwent 20 h full immersion tests in 0.1 mol/L NaCl solution at 25 °C. As shown in Figure 1, the macroscopic morphologies of the four samples after the corrosion revealed that the Q and YQ samples remained largely uncorroded, while the tempered QT and YQT samples experienced severe corrosion, indicating that tempering treatment significantly damaged the corrosion resistance of H13 steel. Figure 5a shows the SEM morphology of a pit on the Q sample post-immersion corrosion. Figure 5b shows the EDS spectrum of Point 1, revealing that an Al-Mg-O inclusion triggered pitting in H13 steel. Notably, no pit was observed on the YQ sample after immersion. Figure 5c depicts the SEM morphology of the YQ sample, and Figure 5d shows the EDS spectrum of Point 2, indicating that Y inclusion did not induce pitting.
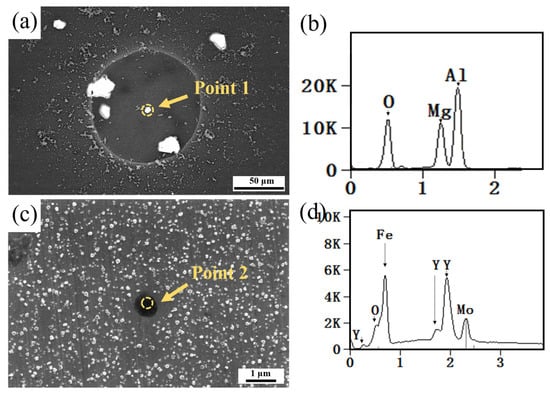
Figure 5.
SEM micrographs of Q and YQ after corrosion: (a) Q; (c) YQ. EDS analysis of (b) Point 1 in (a) and (d) Point 2 in (c).
Figure 6a,b shows the corrosion morphologies of the DA zones in the QT and YQT samples, respectively. In comparison to the YQT sample, the QT sample displayed large particles of corrosion products, indicating that severe surface corrosion occurred. Figure 6b,e shows the morphology of the BA zones under SEM, featuring porous tree-like Fe-rich corrosion products. Notably, the QT sample exhibited a more profuse growth of these tree-like structures. Meanwhile, Figure 6c,f displays the morphologies of the LA zones, revealing that the YQT sample had significantly fewer corrosion products compared to the QT sample.
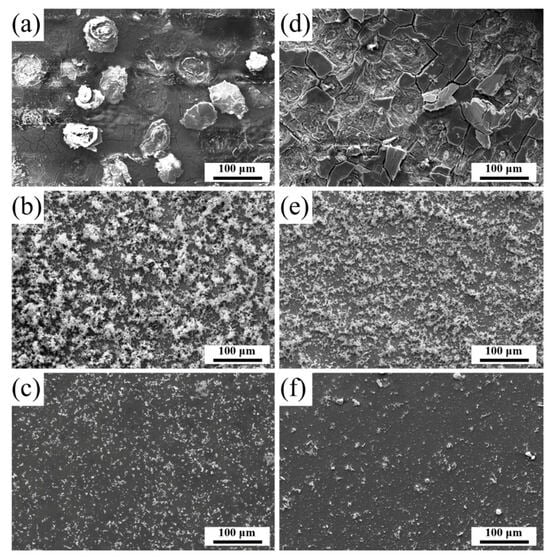
Figure 6.
SEM micrographs of post-corrosion surfaces for (a–c) QT and (d–f) YQT samples. (a–c) Corrosion regions DA, BA, and LA of the QT sample; (d–f) Corresponding regions DA, BA, and LA of the YQT sample.
Figure 7a is an enlargement of Figure 6c, and Figure 7b is an EDS line scan spectrum taken along the green arrow in Figure 7a. The large white loose corrosion products observed in the middle of Figure 7a were identified as Fe-rich oxides, while the surrounding dense small oxides were Cr-rich oxides. Figure 7c shows the morphology of the Cr-rich oxide in Figure 7a, revealing loosely arranged gully within the Cr-rich oxide layer. This indicated that the Cr-rich corrosion product layer of the QT sample contained loose fracture zones, which served as channels for the NaCl solution to rapidly corrode the underlying matrix. In contrast, Figure 7d shows the morphology of corresponding Cr-rich oxide in the YQT sample. It was evident that presence of Y had resulted in the formation of a complete and dense Cr-rich oxide layer on the surface of the YQT sample, effectively preventing the corrosion of the matrix by the NaCl solution. Figure 7e,f shows the cross-sectional morphologies seen in Figure 7c,d. In Figure 7e, it is observed that the matrix of the QT sample had been corroded, as the corrosion solution had penetrated into the matrix along the loose fracture zones in Figure 7c, causing the matrix to be dissolved. In contrast, in Figure 7f, the matrix of the YQT sample remained intact due to the protective effect of the dense oxide layer shown in Figure 7d.
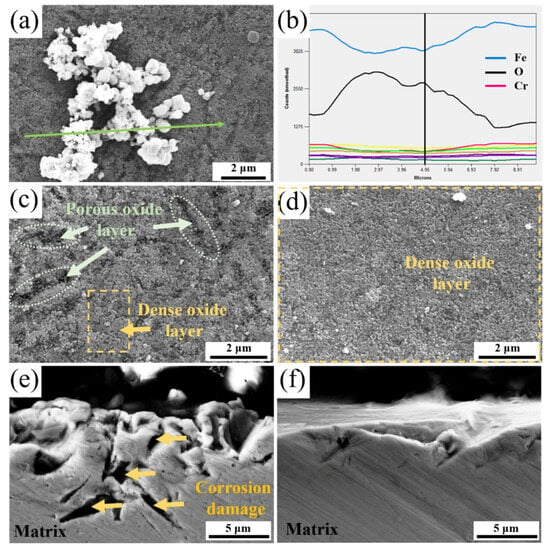
Figure 7.
SEM analysis of corrosion products: (a,c) Surface morphologies of QT sample; (d) Surface morphology of YQT sample; (b) EDS line scan spectrum corresponding to the marked line in (a); (e,f) Cross-sectional morphologies of (c) and (d), respectively.
Figure 8 shows the XPS full spectra of the Q, YQ, QT, and YQT samples after immersion corrosion. The Fe 2p and Fe 3p peaks of Q surpassed those of the YQ sample, indicating a more pronounced corrosion effect in the Q sample. This observation echoed the pitting corrosion observed in Figure 5. Furthermore, upon comparing quenched (Q, YQ) and tempered (QT, YQT) samples, the Fe 2p, Cr 2p, and O 1s peaks in the tempered samples were markedly intensified, showing a significant loss in the corrosion resistance of H13 steel due to tempering.
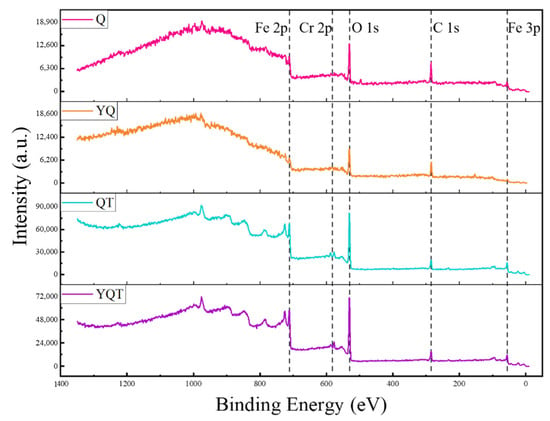
Figure 8.
Full XPS spectra of Q, YQ, QT, and YQT samples.
To investigate further differences in the corrosion products between QT and YQT samples, XPS fine spectra of Fe 2p, O 1s and Cr 2p peaks are presented in Figure 9a–c, respectively. And the characteristic peak parameters of XPS spectra are given in Table 2 [27,28,29,30,31]. Figure 9d shows the elemental content calculated from XPS fine spectra. Notably, Cr content in the YQT sample was 2.56%, which was 28% higher than that in the QT sample. This increase stemmed from the role of Y in Figure 7d, where it eliminated porous areas within the Cr-rich oxide layer, fostering a complete and dense Cr-rich corrosion layer, also enriching Cr content in the corrosion product.
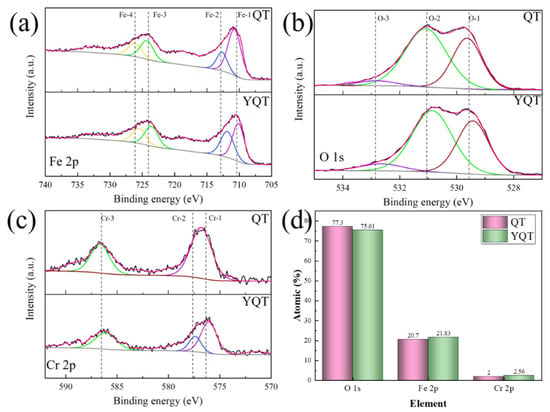
Figure 9.
High-resolution XPS spectra of the H13 steel (a) Fe 2p, (b) O 1s, and (c) Cr 2p; (d) element percentage.

Table 2.
Characteristic peak parameters of XPS spectra on the passive films of the H13 steel.
3.3. Electrochemical Test
Figure 10 shows the potentiodynamic polarization curves and electrochemical impedance spectroscopies (EISs) of the Q, YQ, QT, and YQT samples in 0.1 mol/L NaCl solution at 25 °C. The Ecorr (corrosion potential) values for the Q, YQ, QT, and YQT samples were −0.486 V, −0.509 V, −0.594 V, and −0.554 V, respectively. Upon tempering, the Ecorr of Y-free H13 steel decreased from −0.486 V to −0.594 V, which was a shift of 0.108 V. Meanwhile, the Ecorr of Y-containing H13 steel declined from −0.509 V to −0.554 V, which was only a smaller decrement of 0.045 V. Clearly, Y reduced the potential loss by 63 mV. The icorr (corrosion current density) values for the Q, YQ, QT, and YQT samples were 4.59 × 10⁻⁶ A·cm−2, 4.77 × 10⁻⁶ A·cm−2, 4.46 × 10⁻⁶ A·cm−2, and 5.32 × 10⁻⁶ A·cm−2, respectively, as calculated using the Tafel extrapolation method. Notably, the differences among these samples were not statistically significant. The Nyquist plots and equivalent circuit diagrams for the four samples are presented in Figure 10b. In this context, Rcp represents the passivation film resistance, while Rct denotes the charge transfer resistance during corrosion reactions. After fitting with ZSimpWin(v3.30) software, the sums of Rcp and Rct for the Q, YQ, QT, and YQT samples were 2.81 × 10³ Ω·cm2, 2.56 × 10³ Ω·cm2, 2.14 × 10³ Ω·cm2, and 2.02 × 10³ Ω·cm2, respectively. Based on the EIS results, the fitted resistance values of the YQT sample were larger than those of the QT sample, indicating that the YQT sample exhibited superior corrosion resistance compared to the QT sample in this study. This clearly demonstrated that the addition of Y significantly mitigated loss in corrosion resistance of H13 steel caused by tempering.
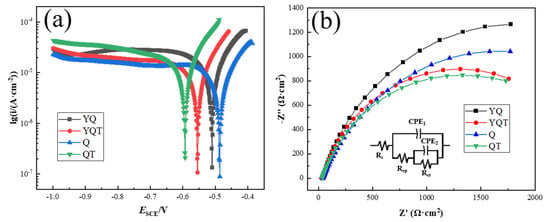
Figure 10.
Electrochemical test results of four samples in 0.1 mol/L NaCl solution at 25 °C: (a) Potentiodynamic polarization curves; (b) Nyquist plots.
4. Analysis and Discussion
4.1. Effect of Yttrium on Tempering Process of H13 Steel
The SEM morphologies in Figure 2 revealed that Y suppressed carbide precipitation at the grain boundaries of tempered-H13 steel. The TEM-EDS maps in Figure 3 showed that Y inhibited the segregation of C, the precipitation of Cr-rich carbide, and the formation of Cr-depleted zones at the grain boundary in the tempered-H13 steel. Digital Micrograph(v3.53) software was utilized to conduct stress–strain calculations based on HRTEM images [32,33,34,35,36]. To delve deeper into the role of Y during the tempering of H13 steel, stress–strain calculations of grain boundaries in the Q, YQ, QT, and YQT samples are shown in Figure 11. Figure 11a–d show HRTEM morphologies and GPA stress–strain distribution at the grain boundaries of the Q, YQ, QT, and YQT samples, respectively. Numerous red areas were evident, indicating a significant normal stress distribution in the quenched-H13 steel. Compared to the quenched samples, the tempered samples exhibited a notable reduction in red regions, with minimal changes in blue regions, suggesting that tempering decreased the normal stress distribution at the grain boundaries but had little impact on the negative stress region. By comparing Figure 11c,d, one can see that the normal stress region in the YQT sample was smaller than that in the QT sample, indicating that Y reduced the normal stress distribution at the grain boundary of tempered H13 steel.
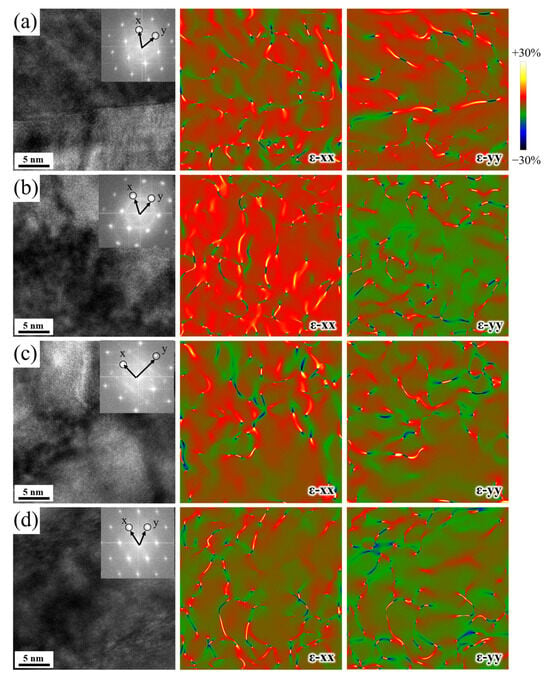
Figure 11.
HRTEM and strain distributions calculated by GPA of GB in (a) Q, (b) YQ, (c) QT, and (d) YQT samples.
Combining the element distribution shown in Figure 3 with the stress distribution depicted in Figure 11, we observed that the addition of Y reduced the extent of normal stress at grain boundaries and inhibited the segregation of C element at these locations. This phenomenon could be attributed to the following mechanisms:
The C atoms occupying interstitial sites in the α-Fe lattice and the Y atoms substituting for Fe atoms spontaneously migrated towards regions of tensile normal stress. This migration behavior was driven by the principle of minimizing the system’s total energy, as the redistribution of these atoms helped to alleviate lattice distortion in the matrix.
From an atomic-size perspective, the radius of the Y atom significantly exceeded that of the Fe atom. When Y substituted for Fe at grain boundaries, it compressed the octahedral interstitial sites in the α-Fe crystal lattice. This compression increased the activation energy required for C atoms to diffuse into these sites, thereby effectively hindering C atom segregation at the grain boundaries. Conversely, C atoms were unable to displace Y atoms at the grain boundaries.
As shown in Figure 10, this interaction reduced the extent of the red-colored high normal stress region. Consequently, the reduced C concentration at grain boundaries made it thermodynamically unfavorable to form Cr23C6. The lack of carbide formation in turn prevented the formation of Cr-depleted zones adjacent to these carbides.
4.2. Effect of Y on Pitting of H13 Steel
The corrosion morphologies of quenched samples in Figure 4 indicated that Y inclusion was less prone to inducing pitting corrosion. The reason was that Y can reduce the pitting corrosion sensitivity [37,38,39]. Pitting typically arises from the potential difference between high-potential inclusion and low-potential matrix [40,41]. As evident from Figure 3a,b, the matrix composition and element distribution remained consistent in quenched samples, suggesting similar low potential for both the Q and YQ matrix. By reducing the potential of inclusion, rare earth reduced potential difference, thereby inhibiting pitting initiation [42].
Figure 12 presents the morphology, composition, and surface potential of Y-containing inclusions in the YQT sample. It was observed from Figure 12d that the surface potential of these inclusions was comparable to that of the surrounding matrix, indicating that Y-containing inclusions did not induce pitting corrosion.
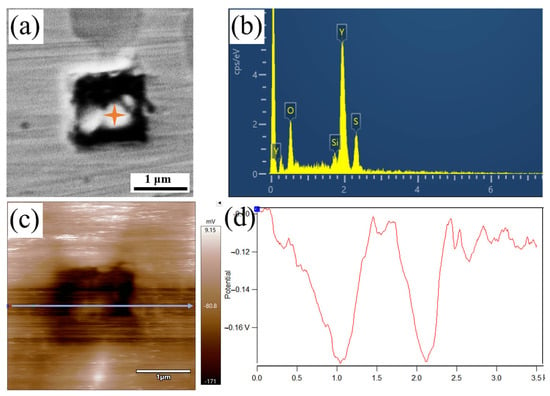
Figure 12.
The characteristics of Y-containing inclusion in the YQT sample: (a) SEM morphology, (b) EDS energy spectrum, (c) surface potential distribution, and (d) potential variation along the line marked in (c).
4.3. Effect of Y on Localized Corrosion of H13 Steel
As mentioned above, Y could inhibit pitting initiation by modifying inclusion. On the other hand, the role of Y in improving the corrosion resistance of H13 steel by inhibited precipitation of tempered Cr23C6 carbide can also not be ignored.
In Figure 1, after immersion corrosion, tempered QT and YQT samples exhibited severe corrosion. The corrosion morphology of the QT sample revealed localized corrosion accompanied by multiple pitting sites, indicating a significant decline in its corrosion resistance compared to the Q sample. Comparing corrosion morphologies of the YQ and YQT samples, it became apparent that tempering also compromised corrosion resistance of Y-containing H13 steel. Notably, during the tempering process, only the matrix underwent element segregation and carbide precipitation. This tempering-induced matrix alteration lowered its potential, and consequently weakened the corrosion resistance of H13 steel. In the electrochemical test conducted in Section 3.3, tempering treatment resulted in a 0.108 V decrease in Ecorr for H13 steel without Y and a 0.045 V decrease for H13 steel with Y. Y reduced the potential loss by 63 mV. This reduction in Ecorr was attributed to carbide precipitation in the matrix during tempering. Notably, the addition of Y reduced the Ecorr loss by 58.3% by inhibiting carbide precipitation, thereby enhancing the corrosion resistance of tempered H13 steel.
Figure 13a,b showed the surface potential size and distribution of uncorroded QT and YQT samples, respectively. Figure 13c displayed the volta potential of the lines marked in Figure 13a,b. It was evident from Figure 13c that the average surface potential of the YQT sample was 46 mV, which was higher than that of the QT sample, indicating better corrosion resistance for the YQT sample. This further confirmed the authenticity of Y enhancing corrosion resistance of H13 steel by inhibiting potential loss during tempering.
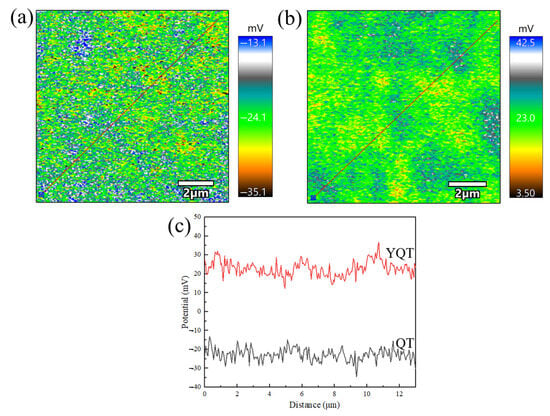
Figure 13.
Volta potential images measured by SKPFM of (a) QT sample, (b) YQT sample, (c) volta potential of the lines marked in (a,b).
Figure 1 showed the morphologies of the QT and YQT samples after 20 h of immersion corrosion. As mentioned above, the corrosion morphology was classified into DA, BA, and LA regions. Using Image-Pro Plus(v6.0) software, the area of each region was calculated. For the QT sample, the areas of DA, BA, and LA were 23.83 mm2, 73.33 mm2, and 2.84 mm2, respectively. For the YQT sample, these areas were 11.57 mm2, 56.81 mm2, and 31.62 mm2, respectively. Clearly, the addition of Y reduced the DA area by 51.45%. It also decreased the BA area by 22.53% and increased the LA area from 2.84 mm2 to 31.62 mm2. This was because Y facilitated the formation of a complete and dense Cr-rich oxide layer on the YQT sample’s surface, eliminating the loosely arranged gully regions presented in the Cr-rich oxide layer of the QT sample. Y effectively blocked the ion channels between the matrix and the NaCl solution within the Cr-rich oxide layer, thereby decreasing the BA area and increasing the LA area.
After removing the corrosion products, the three-dimensional morphologies, height, and plane appearance of the YQT and QT samples surfaces are shown in Figure 14. The surface of the YQT sample was smooth, and there was only a large corrosion pit numbered 1# in the middle. In contrast, the surface of the QT sample was rough and there were a significant number of corrosion sites. The obvious corrosion pits in the QT sample were numbered as 2#–6#. Measurements using the 3D laser microscope OLS4000 revealed volume losses of 4.7 × 107 μm3 and 8.8 × 107 μm3 for the YQT and QT samples, respectively, indicating that Y reduced the corrosion volume loss of H13 steel by 46.6%. Figure 15 displays the depths of the 1#–6# corrosion pits, which were 15.61 μm, 15.60 μm, 11.33 μm, 21.23 μm, 8.59 μm, and 9.27 μm, respectively. It can be seen that Y has little effect on the depth of the corrosion pit. The primary reason for enhancing the localized corrosion resistance of H13 steel was the reduced corrosion area due to Y addition, crucial for H13 steel where localized corrosion was the main form of corrosion.
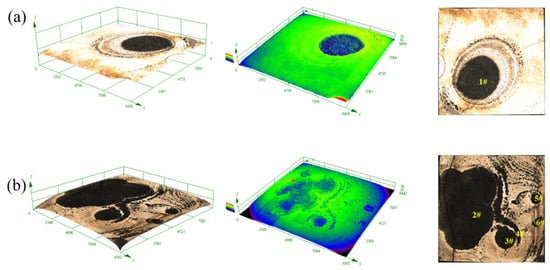
Figure 14.
Surface morphologies after immersion corrosion of (a) YQT sample and (b) QT sample.
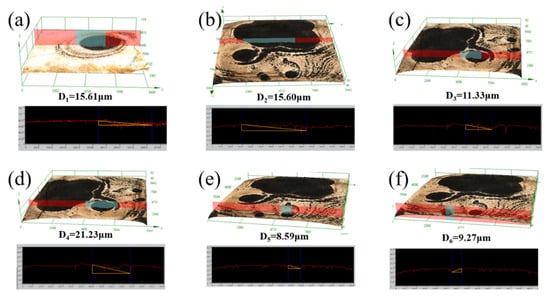
Figure 15.
Measured depths of corrosion pits (a) 1#, (b) 2#, (c) 3#, (d) 4#, (e) 5#, (f) 6#.
Figure 16a–f depicted the formation process of corrosion pits in the QT sample. Corrosion initiated at low-potential defects, and progressively eroded the matrix along grain boundaries lacking active Cr. This created an ion exchange channel between the matrix and the corrosion solution, leading to matrix corrosion damage. As the matrix underwent internal corrosion dissolution, the corrosion pits expanded further along the grain boundaries. Figure 16g–i presented the cross-sectional morphologies of the YQT specimen, revealing an absence of carbides around the corrosion pits. Minute intergranular corrosion is observed in Figure 16h. Compared with the QT specimen, the YQT sample exhibited significantly reduced intergranular corrosion damage due to the diminished carbide precipitation along grain boundaries.
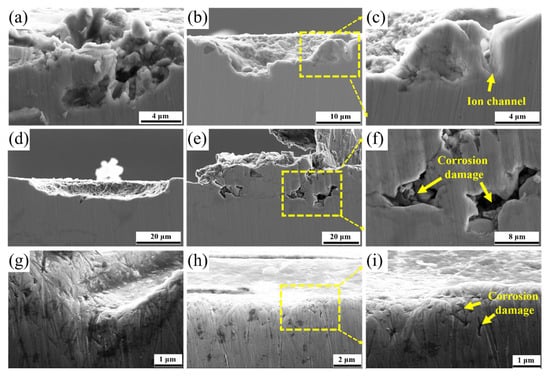
Figure 16.
Formation process of corrosion pit in H13 steel. (a–f) QT sample and (g–i) YQT sample.
Figure 17 depicts the schematic diagram illustrating how closed the ion channel was between the matrix and the NaCl solution within the Cr-rich oxide layer. The schematic diagram in the QT sample indicated that Cr-rich carbide and Cr-poor region existed on the grain boundary. As the Cr element formed carbides on the grain boundary, there was a scarcity of chemically active Cr atoms there. During the early phase of corrosion, oxygen absorption corrosion prevailed on the sample surface, as illustrated by the reaction mechanism described in Equation (1). Active Cr atoms residing on the sample surface participated in anodic reactions, as illustrated by the reaction mechanism described in Equations (2) and (3), leading to the dense nucleation and deposition of Cr2O3 particles, which subsequently coalesced into a compact, protective oxide layer. Concurrently, Fe atoms underwent oxidation to form Fe2O3, as illustrated by the reaction mechanism described in Equations (4)–(6), exhibiting a coarse and porous microstructure.
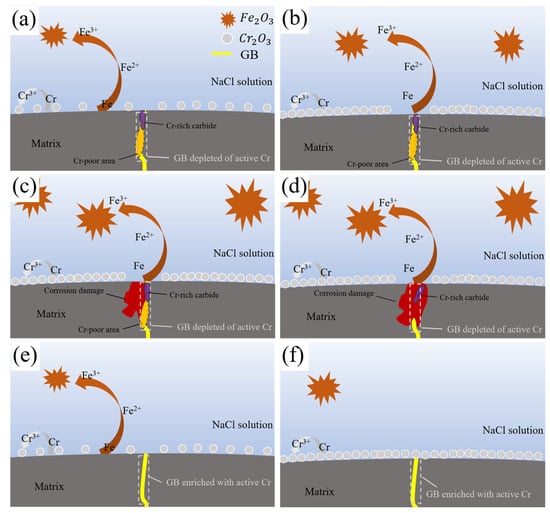
Figure 17.
Intergranular corrosion damage schematic diagram for H13 steel. (a–d) QT and (e,f) YQT.
Owing to the dearth of active Cr atoms at the grain boundaries of the QT specimen, the formation of a continuous, dense Cr2O3 oxide layer was impeded, thereby compromising the integrity and continuity of the protective oxide scale. At these grain boundaries, the presence of carbides engendered a localized electrochemical environment conducive to corrosion. Specifically, cathodic reduction reactions occurred on the carbide surfaces, while anodic dissolution reactions were localized in the Cr-depleted regions of the adjacent matrix. This galvanic coupling precipitated preferential dissolution of the matrix adjacent to the grain boundaries, with the carbides remaining largely unaffected. Over time, this selective corrosion mechanism culminated in the formation of corrosion channels that penetrated deeply into the substrate along the grain boundaries, significantly undermining the material’s structural integrity and corrosion resistance.
In contrast, the schematic diagram in the YQT sample showed that a large number of chemically active Cr atoms were present on the grain boundary of the YQT sample. During the corrosion process, these chemically active Cr atoms formed Cr-rich oxides at the grain boundaries, resulting in a complete and compact Cr-rich oxide layer on the YQT sample surface. This closed the ion channel between the matrix and NaCl solution, enhancing the corrosion resistance of H13 steel.
5. Conclusions
The comprehensive investigation into the influence of Y on the corrosion behavior of H13 steel has yielded several insights that collectively elucidate the reasons underlying the enhanced corrosion resistance.
Firstly, SKPFM measurements show that Y-containing inclusions in H13 steel share an equivalent electric potential with the surrounding matrix, preventing matrix dissolution and pitting pit formation. This unique property significantly bolsters the steel’s pitting corrosion resistance by averting localized corrosion initiation.
Secondly, Y addition substantially modifies microstructural features at grain boundaries—critical sites for corrosion. It reduces carbon segregation and the formation and quantity of Cr-rich carbides and Cr-depleted zones. During tempering, Y mitigates matrix loss, preserving corrosion resistance. These microstructural changes are vital for enhancing overall corrosion performance by reducing intergranular corrosion susceptibility.
Thirdly, Y promotes the enrichment of chemically active Cr atoms at grain boundaries, essential for forming a continuous, dense Cr-rich oxide layer. This layer acts as a barrier, preventing ion channel formation between the matrix and NaCl solution, thereby significantly enhancing localized corrosion resistance against pitting and crevice corrosion.
Lastly, Y reduces corrosion volume damage in H13 steel by 46.6%, primarily by suppressing Cr-rich carbide formation at grain boundaries during tempering, minimizing corrosion initiation and propagation sites. The combined effects of Y on inclusion modification, oxide layer formation, and carbide suppression collectively contribute to the substantial improvement in H13 steel’s corrosion resistance.
In summary, the addition of yttrium to H13 steel enhances its corrosion resistance through multiple mechanisms, including the modification of inclusion behavior, microstructural features at grain boundaries, oxide layer formation, and suppression of carbide formation. These findings provide valuable insights into the design of corrosion-resistant alloys and highlight the potential of yttrium as an effective alloying element for improving the performance of H13 steel in corrosive environments.
Author Contributions
Y.W.: Writing—review and editing, Writing—original draft, Visualization, Methodology, Conceptualization. X.F.: Resources, Investigation. L.Z.: Visualization, Resources. B.Y.: Writing—review and editing, Supervision, Project administration, Funding acquisition. All authors have read and agreed to the published version of the manuscript.
Funding
This research was funded by the Key R&D Program of Shandong Province (No. 2021CXGC010209), the Fundamental Research Funds for the Central Universities (No. FRF-BD-23-01).
Data Availability Statement
Data will be made available on request.
Conflicts of Interest
The authors declare no conflicts of interest.
References
- Jie, F.; Huashan, L.; Lisha, F.; Dun, W.; Huan, T.; Yimin, X. Wear performance of modified H-13 and H418E steels for TBM disc cutter ring. Eng. Fail. Anal. 2024, 156, 107783. [Google Scholar] [CrossRef]
- Wang, H.; Zhang, M.; Sun, R.; Cui, S.; Mo, J. Performance improvement strategy of the TBM disc cutter ring material and evaluation of impact-sliding friction and wear performance. Wear 2023, 526–527, 204943. [Google Scholar] [CrossRef]
- Tian, J.; Hu, Y.; Liu, X.; Yang, Z. Wear performance and mechanisms of H13 steels sliding against different Rock types. Surf. Topogr. Metrol. Prop. 2020, 8, 25003. [Google Scholar] [CrossRef]
- Zheng, Y.; Wu, K.; Wang, L.; Jiang, Y.; Liu, Y. Structural damage assessment and failure mode analysis for cross-fault submarine tunnels. Eng. Fail. Anal. 2024, 157, 107853. [Google Scholar] [CrossRef]
- Liu, T.; Huang, H.; Yan, Z.; Tang, X.; Liu, H. A case study on key techniques for long-distance sea-crossing shield tunneling. Mar. Georesour. Geotechnol. 2020, 38, 786–803. [Google Scholar] [CrossRef]
- Liu, H.; Wei, J.; Dong, J.; Zhou, Y.; Ke, W. The synergy between cementite spheroidization and Cu alloying on the corrosion resistance of ferrite-pearlite steel in acidic chloride solution. J. Mater. Sci. Technol. 2021, 84, 65–75. [Google Scholar] [CrossRef]
- Zhou, Y.; Liu, Y.; Zhou, X.; Liu, C.; Yu, J.; Huang, Y.; Li, H.; Li, W. Precipitation and hot deformation behavior of austenitic heat-resistant steels: A review. J. Mater. Sci. Technol. 2017, 33, 1448–1456. [Google Scholar] [CrossRef]
- Zhang, S.; Liu, J.; Tang, M.; Zhang, X.; Wu, K. Effects of deoxidation methods on the inclusion characteristics and corrosion behaviour of high-strength low-alloy steels in marine environments. J. Iron Steel Res. 2018, 30, 222–228. [Google Scholar]
- Gao, B.; Xu, T.; Wang, L.; Liu, Y.; Liu, J.; Zhang, Y.; Sui, Y.; Sun, W.; Chen, X.; Li, X.; et al. Achieving a superior combination of tensile properties and corrosion resistance in AISI420 martensitic stainless steel by low-temperature tempering. Corros. Sci. 2023, 225, 111551. [Google Scholar] [CrossRef]
- Wang, L.; Lin, Q.; Yue, L.; Liu, L.; Guo, F.; Wang, F. Study of application of rare earth elements in advanced low alloy steels. J. Alloys Compd. 2008, 451, 534–537. [Google Scholar] [CrossRef]
- Wang, K.L.; Zhang, Q.B.; Sun, M.L.; Wei, X.G.; Zhu, Y.M. Microstructure and corrosion resistance of laser clad coatings with rare earth elements. Corros. Sci. 2001, 43, 255–267. [Google Scholar] [CrossRef]
- Bai, Y.; Zheng, S.; Liu, N.; Liu, Y.; Wang, X.; Qiu, L.; Gong, A. The Role of Rare Earths on Steel and Rare Earth Steel Corrosion Mechanism of Research Progress. Coatings 2024, 14, 465. [Google Scholar] [CrossRef]
- Zhang, X.; Wei, W.; Cheng, L.; Liu, J.; Wu, K.; Liu, M. Effects of niobium and rare earth elements on microstructure and initial marine corrosion behavior of low-alloy steels. Appl. Surf. Sci. 2019, 475, 83–93. [Google Scholar] [CrossRef]
- Tang, L.; Yan, M. Effects of rare earths addition on the microstructure, wear and corrosion resistances of plasma nitrided 30CrMnSiA steel. Surf. Coat. Technol. 2012, 206, 2363–2370. [Google Scholar] [CrossRef]
- Lin, N.; Xie, F.; Zhong, T.; Wu, X.; Tian, W. Influence of adding various rare earths on microstructures and corrosion resistance of chromizing coatings prepared via pack cementation on P110 steel. J. Rare Earth. 2010, 28, 301–304. [Google Scholar] [CrossRef]
- Wang, X.; Wu, Z.; Li, B.; Chen, W.; Zhang, J.; Mao, J. Inclusions modification by rare earth in steel and the resulting properties: A review. J. Rare Earth 2024, 42, 431–445. [Google Scholar] [CrossRef]
- Liu, L.; Yu, S.; Cao, W. Zn–Fe and Y-modified Zn–Fe coatings on 42CrMo steel via pack cementation. Rare Met. 2021, 40, 2266–2274. [Google Scholar] [CrossRef]
- Li, X.; Deng, S.; Fu, H.; Mu, G. Synergistic inhibition effect of rare earth cerium(IV) ion and anionic surfactant on the corrosion of cold rolled steel in H2SO4 solution. Corros. Sci. 2008, 50, 2635–2645. [Google Scholar] [CrossRef]
- Liu, C.L.C.; Jiang, Z.J.Z.; Zhao, J.; Cheng, X.; Liu, Z.; Zhang, D.; Li, X. Influence of rare earth metals on mechanisms of localised corrosion induced by inclusions in Zr-Ti deoxidised low alloy steel. Corros. Sci. 2020, 166, 108463. [Google Scholar] [CrossRef]
- Zhang, T.; Hao, L.; Jiang, Z.; Liu, C.; Zhu, L.; Cheng, X.; Liu, Z.; Wang, N.; Li, X. Investigation of rare earth (RE) on improving the corrosion resistance of Zr-Ti deoxidized low alloy steel in the simulated tropic marine atmospheric environment. Corros. Sci. 2023, 221, 111335. [Google Scholar] [CrossRef]
- Liu, C.; Revilla, R.I.; Liu, Z.; Zhang, D.; Li, X.; Terryn, H. Effect of inclusions modified by rare earth elements (Ce, La) on localized marine corrosion in Q460NH weathering steel. Corros. Sci. 2017, 129, 82–90. [Google Scholar] [CrossRef]
- Zhang, S.; Liu, J.; Tang, M.; Zhang, X.; Wu, K. Role of rare earth elements on the improvement of corrosion resistance of micro-alloyed steels in 3.5 wt.% NaCl solution. J. Mater. Res. Technol. JMRT 2021, 11, 519–534. [Google Scholar] [CrossRef]
- Zhang, S.; Li, H.; Jiang, Z.; Feng, H.; Wen, Z.; Ren, J.; Han, P. Unveiling the mechanism of yttrium significantly improving high-temperature oxidation resistance of super-austenitic stainless steel S32654. J. Mater. Sci. Technol. 2022, 115, 103–114. [Google Scholar] [CrossRef]
- Wang, C.; Ma, R.; Zhou, Y.; Liu, Y.; Ke, W. Effects of rare earth modifying inclusions on the pitting corrosion of 13Cr4Ni martensitic stainless steel. J. Mater. Sci. Technol. 2021, 93, 232–243. [Google Scholar] [CrossRef]
- Liu, T.; Chen, T.; Zhou, X.; Sun, L.; Yang, W.; Liu, C.; Cheng, X.; Li, X. Investigation of Cr and rare earth on the corrosion resistance of HRB400 rebar in simulated concrete pore solutions containing chloride and sulfate ions. Constr. Build. Mater. 2024, 423, 135935. [Google Scholar] [CrossRef]
- Zhou, X.; Yao, N.; Shi, J. Unraveling electrochemical performance of a 10CrMo steel in alkaline concrete pore solutions with red mud and ground granulated blast-furnace slag. Corros. Sci. 2022, 207, 110568. [Google Scholar] [CrossRef]
- Xiao, Y.; Tang, J.; Wang, Y.; Lin, B.; Nie, Z.; Li, Y.; Normand, B.; Wang, H. Corrosion behavior of 2205 duplex stainless steel in NaCl solutions containing sulfide ions. Corros. Sci. 2022, 200, 110240. [Google Scholar] [CrossRef]
- Liu, H.H.; Fu, P.X.; Liu, H.W.; Cao, Y.F.; Sun, C.; Du, N.Y.; Li, D.Z. Effects of Rare Earth elements on microstructure evolution and mechanical properties of 718H pre-hardened mold steel. J. Mater. Sci. Technol. 2020, 50, 245–256. [Google Scholar] [CrossRef]
- Wu, M.; Ma, H.; Shi, J. Beneficial and detrimental effects of molybdate as an inhibitor on reinforcing steels in saturated Ca(OH)2 solution: Spontaneous passivation. Cem. Concr. Compos. 2021, 116, 103887. [Google Scholar] [CrossRef]
- Ma, L.; Pascalidou, E.; Wiame, F.; Zanna, S.; Maurice, V.; Marcus, P. Passivation mechanisms and pre-oxidation effects on model surfaces of FeCrNi austenitic stainless steel. Corros. Sci. 2020, 167, 108483. [Google Scholar] [CrossRef]
- Ming, J.; Zhou, X.; Zuo, H.; Jiang, L.; Zou, Y.; Shi, J. Effects of stray current and silicate ions on electrochemical behavior of a high-strength prestressing steel in simulated concrete pore solutions. Corros. Sci. 2022, 197, 110083. [Google Scholar] [CrossRef]
- Takeda, M.; Suzuki, J. Crystallographic heterodyne phase detection for highly sensitive lattice-distortion measurements. J. Opt. Soc. Am. A Opt. Image Sci. Vis. 1996, 13, 1495–1500. [Google Scholar] [CrossRef]
- Hÿtch, M.J.; Snoeck, E.; Kilaas, R. Quantitative measurement of displacement and strain fields from HREM micrographs. Ultramicroscopy 1998, 74, 131–146. [Google Scholar] [CrossRef]
- Chen, Y.; Yang, B.; Zhou, Y.; Wu, Y.; Zhu, H. Evaluation of pitting corrosion in duplex stainless steel Fe20Cr9Ni for nuclear power application. Acta Mater. 2020, 197, 172–183. [Google Scholar] [CrossRef]
- Dingreville, R.; Berbenni, S. On the interaction of solutes with grain boundaries. Acta Mater. 2016, 104, 237–249. [Google Scholar] [CrossRef]
- Huang, C.X.; Wang, Y.F.; Ma, X.L.; Yin, S.; Höppel, H.W.; Göken, M.; Wu, X.L.; Gao, H.J.; Zhu, Y.T. Interface affected zone for optimal strength and ductility in heterogeneous laminate. Mater. Today 2018, 21, 713–719. [Google Scholar] [CrossRef]
- Ha, H.; Park, C.; Kwon, H. Effects of misch metal on the formation of non-metallic inclusions and the associated resistance to pitting corrosion in 25% Cr duplex stainless steels. Scripta Mater. 2006, 55, 991–994. [Google Scholar] [CrossRef]
- Jeon, S.; Kim, S.; Choi, M.; Kim, J.; Kim, K.; Park, Y. Effects of cerium on the compositional variations in and around inclusions and the initiation and propagation of pitting corrosion in hyperduplex stainless steels. Corros. Sci. 2013, 75, 367–375. [Google Scholar] [CrossRef]
- Shi, W.; Yang, S.F.; Li, J.; Li, J. Correlation between evolution of inclusions and pitting corrosion in 304 stainless steel with yttrium addition. Sci. Rep. 2018, 8, 4830. [Google Scholar] [CrossRef] [PubMed]
- Kaneko, M.; Isaacs, H.S. Effects of molybdenum on the pitting of ferritic- and austenitic-stainless steels in bromide and chloride solutions. Corros. Sci. 2002, 44, 1825–1834. [Google Scholar] [CrossRef]
- Örnek, C.; Engelberg, D. SKPFM measured Volta potential correlated with strain localisation in microstructure to understand corrosion susceptibility of cold-rolled grade 2205 duplex stainless steel. Corros. Sci. 2015, 99, 164–171. [Google Scholar] [CrossRef]
- Che, Z.; Revilla, R.I.; Li, C.; Liu, J.; Liu, W.; Wouters, B.; Marcoen, K.; Cheng, X.; Liu, C.; Li, X. Role of Te-RE alloying on the passive film and pitting corrosion behavior of 316L stainless steel. Corros. Sci. 2024, 240, 112457. [Google Scholar] [CrossRef]
Disclaimer/Publisher’s Note: The statements, opinions and data contained in all publications are solely those of the individual author(s) and contributor(s) and not of MDPI and/or the editor(s). MDPI and/or the editor(s) disclaim responsibility for any injury to people or property resulting from any ideas, methods, instructions or products referred to in the content. |
© 2025 by the authors. Licensee MDPI, Basel, Switzerland. This article is an open access article distributed under the terms and conditions of the Creative Commons Attribution (CC BY) license (https://creativecommons.org/licenses/by/4.0/).