Abstract
In welding solidification, the morphology of residual liquid in the solid–liquid coexistence region affects the susceptibility to solidification cracking because this cracking is due to localized shrinkage strain in the residual liquid. Therefore, it is important to observe the residual liquid state during solidification in detail to elucidate the occurrence of solidification cracking. In this study, a high-magnification in situ observation system was developed by combining an optical microscope and a high-speed camera. This system enables continuous, high-magnification, and high-resolution observation of welding solidification, because the objective lens of a microscope is attached to a high-speed camera. Laser welding solidification of stainless steel sheets was observed using this system and the morphology of residual liquid was visualized with higher magnification and higher definition than previous observation methods. Compared with a high-magnification image and quenched solidification microstructure, the residual state of the liquid phase during solidification could be observed in detail and dynamically. Additionally, the difference in solidification between two types of stainless sheets could be observed with high magnification in situ at one point. Finally, the combination of the observation results from this system and a high-temperature ductility curve revealed the relationship between the morphology of residual liquid and solidification cracking susceptibility.
1. Introduction
Welding solidification cracking occurs in the final solidification zone where the liquid phase remains in the brittle temperature range (BTR). The susceptibility to solidification cracking is affected by various factors such as the chemical composition, welding conditions, and shape of the base materials or bead [1,2,3,4,5,6]. In the solid–liquid coexistence region during solidification, a residual liquid film composed of low-melting-point elements such as P and S [7,8,9,10] is subjected to shrinkage strain, which causes solidification cracking. The morphology of the residual liquid film during solidification depends on the material component, which in turn affects the ductility and the amount of strain on the liquid [11,12]. Therefore, the morphology of the residual liquid is a critical parameter in solidification cracking susceptibility, and it is important to identify the relationship between the two. However, most studies on solidification are based on observations after welding is completed [13,14,15]. Thus, there are still many unknowns about solidification phenomena during welding.
Several direct observations of welding solidification have been conducted to identify its phenomena [16]. Measurement by means of in situ observation (MISO) is an example [17,18,19]. This system observes and analyzes solidification and hot cracking by imaging with a camera and an optical microscope and analyzing with a film analyzer. Additionally, with the development of digital and optical technologies in recent years, several studies have been conducted to visualize the initiation of solidification cracking [20,21]. Through these investigations, several issues were identified in the direct observation of the welding solidification process. First is the limitation of magnification. Conventional systems observed the molten pool on the laser irradiation surface, which prevented the lens from being positioned sufficiently close to the molten pool. As a result, it was impossible to visualize the morphology of residual liquid between dendrites, which affected solidification cracking phenomena. In addition, the insufficient focus technology did not allow for the visualization of residual liquid morphology clearly. The second issue was the inability to eliminate external disturbances such as fumes and laser reflections, which obstructed the clear observation of the solidification process. Meanwhile, another observation method has also been proposed. Observation techniques using X-rays can visualize not only the formation of the microstructure but also the initiation of solidification cracking with high magnification and resolution [22,23,24,25,26]. However, high-power X-rays need to be irradiated to achieve high-resolution observation, necessitating large-scale equipment. Furthermore, welding equipment needs to be brought into the X-ray irradiation facility. Therefore, this method cannot be easily implemented. These issues make it difficult to observe the morphology of residual liquid during welding solidification. Therefore, a high-magnification direct observation system that allows precise focusing, is unaffected by external disturbances, and can be operated easily is highly desirable for a deeper understanding of solidification and cracking phenomena.
In this study, a system was developed to observe welding solidification in situ and clearly at high magnification. This system observed the backside of a thin plate during welding using imaging equipment consisting of a high-speed camera, an optical microscope, and a laser heat source.
The high-magnification in situ observation system was used to observe welding solidification in two types of imaging conditions. The observation at the end of the molten pool visualized the morphology of residual liquid clearly in the BTR. The observation at a fixed point on two types of stainless steel sheets was conducted to compare solidification phenomena at a local area in detail. The solidification phenomena observed with this system were evaluated by comparing the solidified microstructure with the quenched microstructure just behind the molten pool. Finally, from the observation results by this system and high-temperature ductility curve, the relationship between residual liquid morphology and solidification cracking susceptibility was investigated in detail.
2. Materials and Methods
2.1. Materials
A JIS (Japanese Industrial Standards) SUS310S austenitic stainless steel sheet (Nippon Yakin Kogyo Co., Kawasaki, Japan) with a thickness of 1 mm was used as the base metal for establishing the high-magnification in situ observation system, because this material has a relatively simple solidified microstructure and residual liquid morphology. To compare the solidifications of two materials, a fixed point was observed on both a JIS SUS310S sheet and a JIS SUS430 ferritic stainless steel sheet (Angang Lianzhong Stainless steel Co., Guangzhou, China). The chemical compositions of the base metals are listed in Table 1.

Table 1.
Chemical composition of base metals.
2.2. Experimental Procedure for High-Magnification In Situ Observation
Figure 1 shows the schematics of the system for high-magnification in situ observation of the rear end of the molten pool. A specimen was fixed on a jig, which was set vertically on a motorized slider. Bead-on-plate welding was performed in the horizontal direction, and the molten pool was observed from the opposite side of the laser-irradiated surface during welding. On the observation side, a high-speed camera with an optical microscope component was installed. The backside of the specimen was observed to prevent fumes and reflected laser light from being captured. Additionally, the observation area was irradiated with LED light using a coaxial illuminating device attached to the optical microscope to observe with uniform and sufficient brightness. Because the depth of focus was shallow in this observation, a restraint jig was used to securely restrain areas outside the imaging and welding areas. The imaging equipment was placed on a fine-motion slider to control the distance between the specimen and the imaging equipment precisely. Shielding jigs were installed on both sides to prevent the oxidation of a welding bead. On the laser-irradiated side, a box-shaped jig with a slit in the laser-irradiated area was placed to create an argon atmosphere. On the observation side, shield nozzles made of a copper pipe were placed in front of and behind the molten pool. The welding conditions are shown in Table 2. A diode laser was used as the heat source with the CW mode. The laser spot diameter was set to 2 mm and irradiated with just-focus on the front surface. The laser power was set to form a bead with the same width on the front and back surfaces. The imaging conditions are shown in Table 3. The magnification of this system can be freely selected by changing the objective lens attached to the revolver. In this study, two types of objective lenses were used. A 10× objective lens (M Plan Apo 10×, f = 20 mm, Mitutoyo, Kawasaki, Japan) was used to observe overall solidification, and a 20× objective lens (M Plan Apo 20×, f = 10 mm, Mitutoyo) was used to observe the solidification microstructure in detail. A 725 nm short-pass filter was mounted on the high-speed camera.
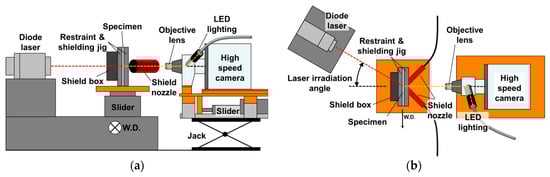
Figure 1.
Schematic illustration of high-magnification in situ observation system for observing the rear end of the molten pool: (a) side view; (b) top view.
Table 2.
Welding conditions.
Table 3.
Imaging conditions for observing the rear end of the molten pool.
Schematic illustrations of the high-magnification in situ observation system for observing a fixed point are shown in Figure 2. The laser was set on the motorized slider, and the position in the specimen observed by the imaging equipment was fixed. Welding conditions were the same as Table 2. Imaging conditions are shown in Table 4. A 20× objective lens was used and a teleconverter was mounted on the high-speed camera to observe solidification phenomena at even higher magnification.
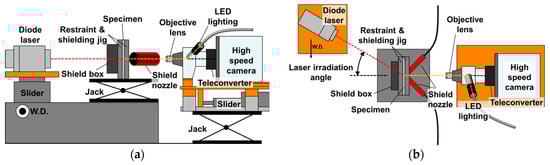
Figure 2.
Schematic illustration of high-magnification in situ observation system for observing fixed point: (a) side view; (b) top view.
Table 4.
Imaging conditions for observing fixed point.
2.3. Experimental Procedure for Temperature Measurement at the Backward of Molten Pool
Instead of the imaging equipment in Figure 1, a multi-sensor camera was set on the backside of the specimen. This multi-sensor camera can measure the temperature without calibration of emissivity via two-color pyrometry [27,28]. Additionally, the temperature measurement area was visualized using another sensor built into this camera. The welding conditions were those in Table 2. The conditions for imaging and temperature measurement are shown in Table 5. A visualized image was produced by irradiating an 808 nm laser lighting from outside the focal lens with an 810 nm band-pass filter. The temperature was measured via two-color pyrometry with the images taken using 650 nm and 850 nm band-pass filters.
Table 5.
The conditions for imaging and measuring temperature.
2.4. Experimental Procedure for the Observation of Solidification Microstructure
The solidification microstructure just behind the molten pool was obtained via liquid Sn quenching [14]. Liquid Sn was poured over the molten pool when the molten pool reached a steady state during welding. The laser was stopped at the moment the liquid Sn covered the whole molten pool. From the quenched specimen, the observation area around the molten pool was cut out. Polishing and electrolytic corrosion were performed on the specimen using 10% oxalic acid.
2.5. Procedure for Quantification of Residual Liquid
From in situ fixed-point observation images of SUS310S taken with a 20× objective lens, the quantification of residual liquid was conducted. Figure 3 shows the outline of the quantification method. Within the in situ observation image, which was an 8-bit image, a narrow strip-shaped micro-region (the area within the red frame in Figure 3) that was nearly isothermal and parallel to the rear edge of the molten pool was cropped, and the image was binarized based on brightness. The number of pixels classified as liquid was counted within the cropped region. The area fraction of residual liquid was defined as the total number of liquid pixels divided by the total number of pixels in the cropped image (6000 pixels). Binarization was performed using the same cropping coordinates and a consistent liquid brightness threshold, allowing for quantitative evaluation of the temporal variation in the liquid area fraction.
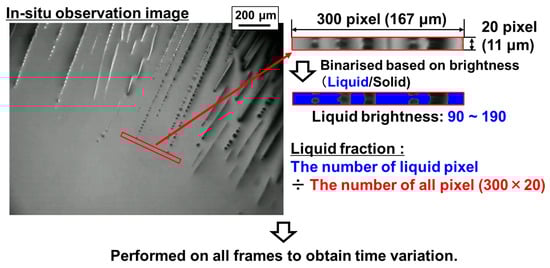
Figure 3.
Schematics of procedure for quantification of residual liquid.
3. Results and Discussion
3.1. Bead Appearance and Cross-Section
The front, back, and cross-section of the bead of SUS310S are shown in Figure 4. Bead oxidation was prevented enough on both sides. The bead width was 4.25 mm on the front and 3.76 mm on the back. The cross-sectional image also shows that a two-dimensional bead was formed.
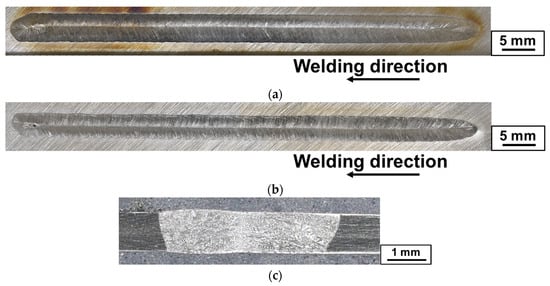
Figure 4.
Bead appearance of SUS310S: (a) front side; (b) back side; (c) cross-section.
3.2. In Situ Observation at the End of the Molten Pool
Figure 5 shows high-magnification in situ images taken with the 10× and 20× objective lenses. Continuous solidification from the molten pool was observed from the left side of each image to the right. In the image for the 10× lens, the shooting range was about 1.9 mm. Behind the molten pool, a residual liquid film and a solidified microstructure were clearly observed while capturing a small area. With the 20× objective lens, even though the magnification was higher, the image was as clear as that taken with the 10× lens. The image of the 20× lens showed even more details of the residual liquid state between dendrites. These images showed that this system could observe the solidification just behind the molten pool at high magnification and resolution.
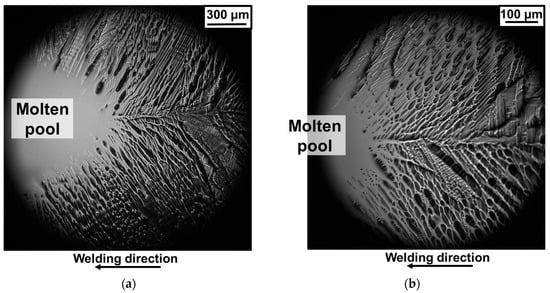
Figure 5.
A high-magnification in situ observation image at the end of molten pool: (a) 10× objective lens; (b) 20× objective lens.
The solidification sequence was observed by focusing on one region in the movie taken with the 20× objective lens, as shown in Figure 6. Focusing on the area framed in red in Figure 6, at 0 ms, the liquid and solid phases were not clearly distinguishable. At 21 ms and 33 ms, the liquid phase existed in the center of the frame and both sides had become solid. Panels (e) and (f) showed little change in morphology, suggesting that most of the solidification had finished at 63 ms.
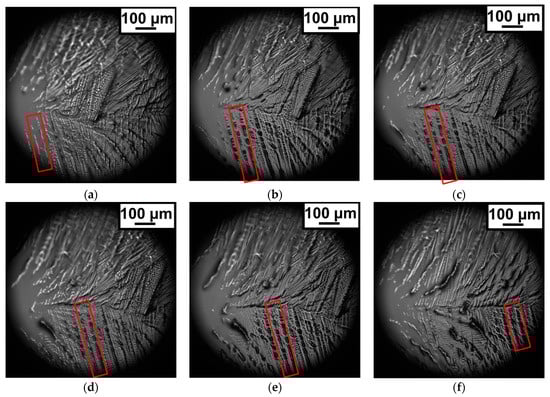
Figure 6.
In situ sequence observation images (20× objective lens): (a) 0 ms; (b) 21 ms; (c) 33 ms; (d) 53 ms; (e) 63 ms; (f) 120 ms.
The temperature distribution corresponding to the in situ observation images shown in Figure 5 was investigated. Figure 7 shows the visualized image and the temperature distribution taken by the multi-sensor camera. The visualized image clearly showed the end of the molten pool. Considering that the liquidus temperature of SUS310S is 1424 °C and the BTR is 102 °C [29], the temperature distribution around the BTR (1424–1322 °C) was accurately obtained.
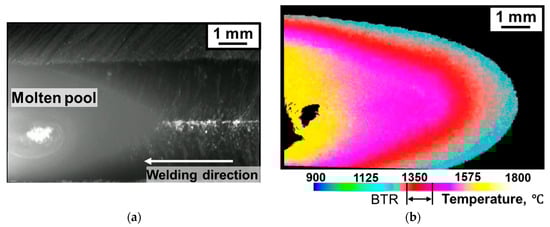
Figure 7.
Visualized images taken by multi-sensor camera: (a) visualized image; (b) temperature distribution.
Figure 8 shows the BTR obtained by combining the high-magnification in situ image and the temperature distribution. The entire BTR could be observed properly in these welding conditions using the 10× objective lens. When the 20× objective lens was used, the change in morphology of the residual liquid in the temperature range from the liquidus temperature to the middle of the BTR could be observed in more detail. The solidification in the final solidification zone was not observed in these conditions. This indicated that even higher magnification was required to observe the solidification in the final solidification zone between dendrites.
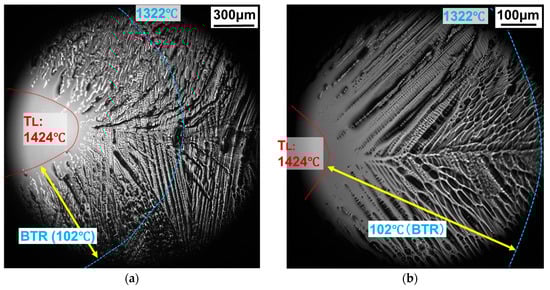
Figure 8.
BTR in a high-magnification in situ observation image: (a) 10× objective lens; (b) 20× objective lens.
3.3. Comparison with Quenched Solidified Microstructure
Figure 9 shows the comparison between the solidified microstructure in the in situ image and the quenched microstructure. The red lines in both images show the edge of molten pool. Primary dendrite arm spacing was determined by measuring a length containing 10 primary dendrite arms and calculating the average as one dendrite arm spacing. The primary dendrite arm spacing was 24.9 μm in the in situ image and 21.5 μm in the Sn-quenched microstructure. The difference in length was small, which indicated that these images allowed microstructure observation with the same quality. Secondary dendrite arm spacing was determined by measuring a length containing 20 secondary dendrite arms and calculating the average as one dendrite arm spacing. The secondary dendrite arm spacing was 6.27 μm in the in situ image and 6.47 μm in the Sn-quenched microstructure. The difference in secondary dendrite arm spacing was also quite small, which indicated that these images processed equivalent image quality. These results indicated that the high-magnification in situ images provided sufficient resolution for visualizing the solidified structure. The observation of quenched microstructures requires numerous difficult processes, such as pouring liquid Sn into the molten pool, polishing, and etching. In contrast, this system enabled the detailed visualization of solidification microstructure solely through imaging during bead-on-plate welding, demonstrating that it allowed for simpler microstructure observation compared to conventional methods.
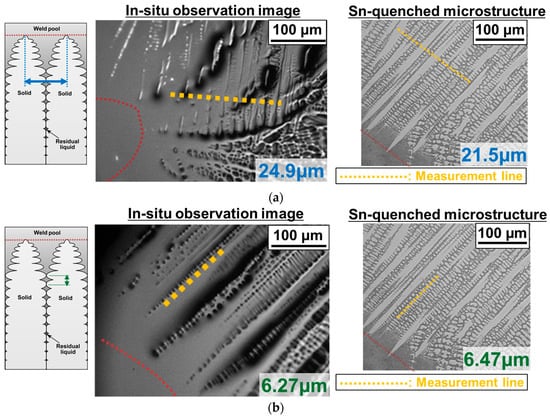
Figure 9.
Comparison of dendrite arm spacing: (a) primary dendrite arm spacing; (b) secondary dendrite arm spacing.
Solidification phenomena and the appearance of residual liquid in the in situ observation image and the quenched microstructure were compared in several temperature ranges in the BTR. Figure 10 shows the comparison of solidification microstructure and residual liquid in the BTR. In the higher temperature range which is shown as (i) in Figure 10, the fraction of liquid was relatively large. In the quenched microstructure, the secondary dendrite arm could be seen clearly. In the middle range of the BTR which is shown as (ii) in Figure 10, it was observed that the residual liquid between dendrites became thinner. This phenomenon meant that gradual solidification was observed. In the quenched microstructure, primary dendrite arm size gradually increased. In the lower temperature range which is shown as (iii) in Figure 10, residual liquid between dendrites solidified and the fraction of solid seemed to stop increasing after 1350 °C. The quenched microstructure also showed that this area had quite a low percentage of liquid since the solid was bridged. This result shows that the in situ observation image and quenched solidification microstructure were in good agreement, and it could be said that the residual state of the liquid phase could be observed in detail and dynamically by this observation system.
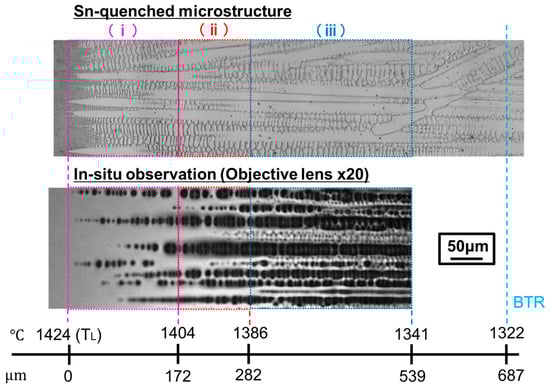
Figure 10.
Composition of solidification microstructure and residual liquid in BTR.
3.4. In Situ Observation at Fixed Point
High-magnification in situ observation images of SUS310S are shown in Figure 11. From (b) to (e), the molten pool went ahead to the left side, and the formation of dendrites was observed. Focusing on the red framed area, residual liquid between dendrites gradually decreased from (c) to (f). After (g), the high-brightness area between dendrites did not decrease, which indicated that most of the solidification had been completed. From the BTR shown in Figure 8, it was found that (g) was located in the BTR. In addition, (k) was already colder than the BTR and the morphology of the microstructure was the same as (g). Therefore, it was considered that the fraction of liquid was already quite small in the middle point of the BTR, which was the same morphology as Figure 10.
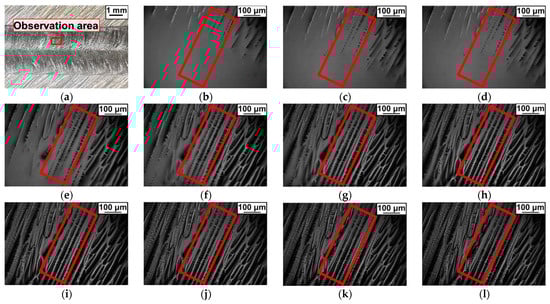
Figure 11.
High-magnification in situ observation image at fixed point (SUS310S): (a) observation area on the bead; (b) 0 ms; (c) 40 ms; (d) 80 ms; (e) 120 ms; (f) 160 ms; (g) 200 ms; (h) 240 ms; (i) 280 ms; (j) 320 ms; (k) 840 ms; (l) 1640 ms.
High-magnification in situ images of SUS430 are shown in Figure 12. From (b) to (f), as with SUS310S, gradual solid formation was observed just behind the molten pool. The solidified microstructure was less uneven than in SUS310S, and the residual liquid was thin and fine. The solid phase seen at low brightness stopped growing at an earlier time than in SUS310S. The microstructure after solidifying had the same brightness as the residual liquid, so it was difficult to distinguish between the solid phase and residual liquid. In (i), which was a completely solidified area, grain boundary migration was observed [30]. The migrated grain boundary extended across the dendrites. These results indicated that this observation system could observe the differences in morphology and the appearance of residual liquid and solidified microstructure in different stainless steels. They further indicated the possibility of observing microstructural changes in the solid phase of some materials.
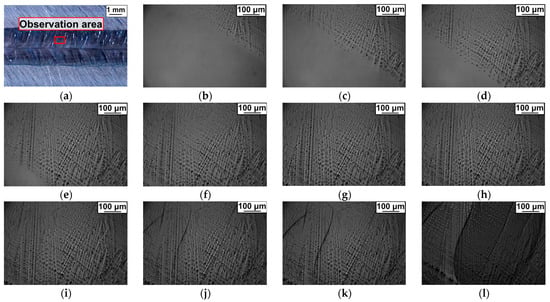
Figure 12.
High-magnification in situ observation image at fixed point (SUS430): (a) observation area on the bead; (b) 0 ms; (c) 40 ms; (d) 80 ms; (e) 120 ms; (f) 160 ms; (g) 200 ms; (h) 240 ms; (i) 440 ms; (j) 840 ms; (k) 1640 ms; (l) room temperature.
3.5. Application to Evaluation for Solidification Crack
By combining the temperature history shown in Figure 7 and the history of the liquid phase fraction obtained from in situ observation images, the relationship between the residual liquid fraction and temperature was derived. In addition, the relationship between the residual liquid morphology obtained by this system and the solidification cracking phenomena was investigated. Figure 13 summarizes the high-temperature ductility curve of SUS310S obtained from the in-plane restraint relaxation high-temperature cracking test [29], the quantification result of residual liquid, the quenched microstructure, and the in situ observation image. The high-temperature ductility curve is an indicator that quantitatively demonstrates solidification cracking susceptibility. Although high-brightness pixels were present even in the solid area, resulting in the liquid fraction not reaching 0% at the end of solidification, the variation in the amount of residual liquid during the early to middle stages of solidification was successfully captured.
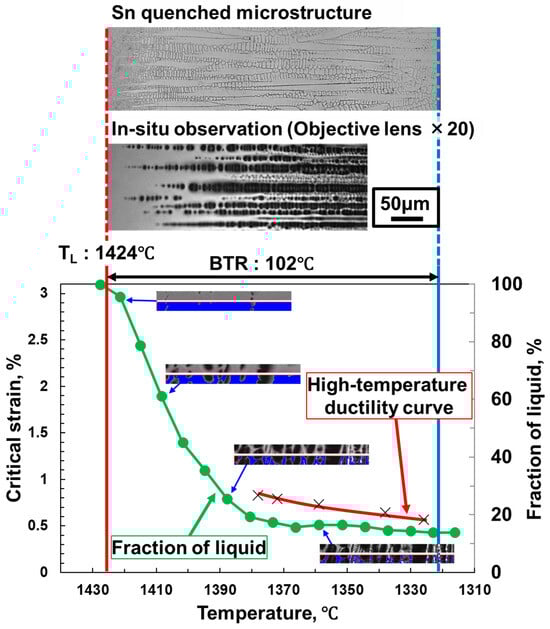
Figure 13.
Relationship between residual liquid morphology and solidification cracking susceptibility in SUS310S.
At the initial solidification stage, the residual liquid gradually decreased, and cracks did not occur in the in-plane restraint relaxation high-temperature cracking evaluation test. It was considered that cracks did not occur because the high liquid fraction prevented strain concentration. Cracks occur from the mid-solidification stage when the reduction in residual liquid became small, and the critical strain for crack initiation remained low, even at a lower temperature. At the mid-solidification stage, the liquid fraction was almost consistent, suggesting that the solidification of residual liquid film progressed at an extremely fine scale. Solidification at such a fine scale is considered to be too small to be visualized by this system. In the quenched microstructure, dendrite secondary arms gradually became small, and in situ observation images revealed elongated residual liquid. It is thought that solidification cracking occurred due to the concentration of strain in thin residual liquid film between dendrites. This conclusion is consistent with the conventional understanding of solidification cracking, which concluded that solidification cracking occurred at the interdendritic liquid film [31,32]. At the late solidification stage, no change in the liquid phase fraction was observed, and cracking ceased to occur. In the quenched microstructure, solid phases bridged each other, and in situ observation images revealed a structure similar to that in the mid-solidification stage. This result indicates that this is the final solidification region where residual liquid became extremely small. Moreover, it was considered that the bridging of the solid phase enhanced ductility, thereby preventing cracking.
Thus, the morphology of residual liquid observed by this system enabled evaluation of the solidification cracking phenomena in detail. The application of this investigation to various materials and welding conditions is expected to clarify the influence of residual liquid morphology on solidification cracking phenomena.
4. Conclusions
In this study, a high-magnification in situ observation system was developed, and welding solidification phenomena of stainless steel sheets were observed. The results of this study are summarized as follows.
- (1)
- Welding solidification phenomena, especially the morphology of the residual liquid just behind the molten pool, could be observed at high-magnification and high-resolution by using this observation system.
- (2)
- The comparison of the microstructure behind the molten pool showed good agreement between the in situ observation images and the quenched specimen, confirming that this system can dynamically and precisely observe the state of the residual liquid with a simpler procedure than previous methods.
- (3)
- The combination of temperature measurement, liquid Sn quenching, and in situ observation revealed the relationship between temperature, solidification microstructure, and residual liquid morphology.
- (4)
- The comparison of solidification phenomena between SUS310S and SUS430 using in situ observation at a fixed point revealed differences in the morphology of the residual liquid and solidification structure, and demonstrated the potential to observe microstructural evolution after solidification in certain materials.
- (5)
- The relationship between the morphology of the residual liquid and solidification cracking susceptibility was investigated by combining the quantified residual liquid data with the high-temperature ductility curve. The results revealed that solidification cracking occurred in the thin residual liquid film at the middle stage of solidification. Future studies are expected to clarify the influence of residual liquid morphology on solidification cracking susceptibility in other materials.
Author Contributions
Conceptualization, T.I., K.S. and M.Y.; methodology, T.I. and S.Y.; validation, K.M.; formal analysis, T.I. and K.M.; investigation, T.I. and S.Y.; resources, M.Y.; data curation, T.I. and K.M.; writing—original draft preparation, T.I.; writing—review and editing, K.M. and M.Y.; visualization, T.I.; supervision, K.M., K.S. and M.Y.; project administration, M.Y.; funding acquisition, M.Y. All authors have read and agreed to the published version of the manuscript.
Funding
This research received no external funding.
Data Availability Statement
The original contributions presented in the study are included in the article; further enquiries can be directed to the corresponding authors.
Acknowledgments
Kenshi Arima provided valuable materials for this study, which is acknowledged and appreciated.
Conflicts of Interest
The authors declare no conflicts of interest.
References
- Liu, K.; Wang, H.; Li, J.; Geng, S.; Chen, Z.; Okulov, A. A Review on Factors Influencing Solidification Cracking of Magnesium Alloys During Welding. Met. Mater. Int. 2024, 30, 1723–1742. [Google Scholar] [CrossRef]
- El-Batahgy, A.-M. Effect of Laser Welding Parameters on Fusion Zone Shape and Solidification Structure of Austenitic Stainless Steels. Mater. Lett. 1997, 32, 155–163. [Google Scholar] [CrossRef]
- Harada, T.; Ikushima, K.; Shibahara, M.; Kimura, F.; Morimoto, T. Study on Solidification Cracking Under High-Speed Narrow Gap Welding with Tandem Torches. Q. J. Jpn. Weld. Soc. 2015, 33, 190s–194s. [Google Scholar] [CrossRef]
- Bodaghi, F.; Movahedi, M.; Na, S.-J.; Zhang, L.-J.; Kokabi, A.H. Effect of Welding Current and Speed on Solidification Cracking Susceptibility in Gas Tungsten Arc Fillet Welding of Dissimilar Aluminum Alloys: Coupling a Weld Simulation and a Cracking Criterion. J. Mater. Res. Technol. 2024, 30, 4777–4785. [Google Scholar] [CrossRef]
- Mori, Y.; Masumoto, I. Considerations about the Forming of the Pear-Shaped Bead Crack. J. Jpn. Weld. Soc. 1980, 49, 19–23. [Google Scholar] [CrossRef]
- Norouzian, M.; Amne Elahi, M.; Plapper, P. A Review: Suppression of the Solidification Cracks in the Laser Welding Process by Controlling the Grain Structure and Chemical Compositions. J. Adv. Join. Process. 2023, 7, 100139. [Google Scholar] [CrossRef]
- Almomani, A.; Mourad, A.-H.I.; Barsoum, I. Effect of Sulfur, Phosphorus, Silicon, and Delta Ferrite on Weld Solidification Cracking of AISI 310S Austenitic Stainless Steel. Eng. Fail. Anal. 2022, 139, 106488. [Google Scholar] [CrossRef]
- Matsuda, F.; Ueyama, T. Solidification Crack Susceptibility in Laser Beam Weld Metal of 0.2C-Low Alloy Steels. Effect of Bead Configuration and S and P Contents. Q. J. Jpn. Weld. Soc. 1993, 11, 95–101. [Google Scholar] [CrossRef]
- Ueda, K.; Yamashita, S.; Takada, A.; Ogura, T.; Saida, K. Effect of Impurity Elements on Solidification Cracking Susceptibility of High Manganese Austenitic Steel. Q. J. Jpn. Weld. Soc. 2020, 38, 306–315. [Google Scholar] [CrossRef]
- Saida, K.; Matsushita, H.; Nishimoto, K.; Kiuchi, K.; Nakayama, J. Quantitative Influence of Minor and Impurity Elements on Hot Cracking Susceptibility of Extra High-Purity Type 310 Stainless Steel. Q. J. Jpn. Weld. Soc. 2013, 31, 56–65. [Google Scholar] [CrossRef]
- Su, M.; Yuan, X.; Yue, C.; Zheng, W.; Wang, Y.; Kang, J. Influence of Liquid Film Characteristics on Hot Cracking Initiation in Al–Cu Alloys at the End of Solidification. Acta Metall. Sin. 2023, 36, 103–117. [Google Scholar] [CrossRef]
- Koseki, T. Solidification and Solidification Structure Control of Weld Metals. J. Jpn. Weld. Soc. 2001, 70, 579–595. [Google Scholar] [CrossRef]
- Yamashita, S.; Yamauchi, R.; Saida, K. Influence Mechanism of Solidification Mode on Solidification Cracking Susceptibility of Stainless Steels. Q. J. Jpn. Weld. Soc. 2022, 40, 67–76. [Google Scholar] [CrossRef]
- Matsuda, F.; Nakagawa, H.; Lee, J.-B. Weld Crack susceptibility of duplex stainless steels. (Report II). Solidification sequence of austenitic stainless steels revealed by liquid-tin quenching. Q. J. Jpn. Weld. Soc. 1989, 7, 229–234. [Google Scholar] [CrossRef]
- Yoshioka, Y.; Fukumoto, S. Effect of Nitrogen on Weld Solidification Cracking Susceptibility of Fe-25%Cr-22%Ni-P-N Fully Austenitic Stainless Steels. Q. J. Jpn. Weld. Soc. 2019, 37, 133–140. [Google Scholar] [CrossRef]
- David, S.A.; Babu, S.S.; Vitek, J.M. Welding: Solidification and Microstructure. JOM 2003, 55, 14–20. [Google Scholar] [CrossRef]
- Matsuda, F.; Nakagawa, H.; Tomita, S.; Sorada, K. Investigation of weld solidification cracking by MISO technique. (Report 1). Behaviors of solidification front, initiation and propagation of bolidification crack. Q. J. Jpn. Weld. Soc. 1988, 6, 394–400. [Google Scholar] [CrossRef]
- Matsuda, F.; Nakagawa, H.; Tomita, S.; Kohomoto, H.; Honda, Y. Investigation on weld solidification cracking by MISO technique. (Report II). Measuring of critical strain for initiation of solidification crack by rapid tensile cracking test. Q. J. Jpn. Weld. Soc. 1988, 6, 401–405. [Google Scholar] [CrossRef]
- Matsuda, F.; Nakagawa, H.; Tomita, S. Investigation on weld solidification cracking by MISO technique. (Report III). Effect of strain rate on critical strain required for initiation of solidification crack. Q. J. Jpn. Weld. Soc. 1989, 7, 100–105. [Google Scholar] [CrossRef]
- Lee, J.-H.; Itasaka, Y.; Yamashita, S.; Ogura, T.; Saida, K. Prediction of Solidification Cracking during Arc Welding of 310S Stainless Steel in U-Type Hot Cracking Test. Q. J. Jpn. Weld. Soc. 2020, 38, 68–75. [Google Scholar] [CrossRef]
- Wen, P.; Shinozaki, K.; Yamamoto, M.; Senda, Y.; Tamura, T.; Nemoto, N. In-Situ Observation of Solidification Cracking of Laser Dissimilar Welded Joints. Q. J. Jpn. Weld. Soc. 2009, 27, 134s–138s. [Google Scholar] [CrossRef]
- Feng, S.; Liotti, E.; Grant, P.S. X-Ray Imaging of Alloy Solidification: Crystal Formation, Growth, Instability and Defects. Materials 2022, 15, 1319. [Google Scholar] [CrossRef]
- Nagira, T.; Yamashita, D.; Kamai, M.; Liu, H.; Aoki, Y.; Uesugi, K.; Takeuchi, A.; Fujii, H. In Situ Observation of Solidification Crack Propagation for Type 310S and 316L Stainless Steels during TIG Welding Using Synchrotron X-Ray Imaging. J. Mater. Sci. 2021, 56, 10653–10663. [Google Scholar] [CrossRef]
- Aucott, L.; Li, J.; Rack, A.; Dong, H.B. Solidification Cracking during Welding of Steel: In Situ X-Ray Observation. IOP Conf. Ser. Mater. Sci. Eng. 2019, 529, 012026. [Google Scholar] [CrossRef]
- Nagira, T.; Kitano, H.; Kimura, T.; Yoshinaka, F.; Takamori, S.; Sawaguchi, T.; Yamashita, T.; Aoki, Y.; Fujii, H.; Takeuchi, A.; et al. In-Situ Observation of Solidification Behaviors of Fe-Mn-Cr-Ni-Si Alloy during TIG Melt-Run Welding Using Synchrotron Radiation X-Ray. Mater. Charact. 2024, 214, 114093. [Google Scholar] [CrossRef]
- Zhang, Z.; Wang, C.; Koe, B.; Schlepütz, C.M.; Irvine, S.; Mi, J. Synchrotron X-Ray Imaging and Ultrafast Tomography in Situ Study of the Fragmentation and Growth Dynamics of Dendritic Microstructures in Solidification under Ultrasound. Acta Mater. 2021, 209, 116796. [Google Scholar] [CrossRef]
- Usui, H. Temperature Measurement of Laser Welding by Two Color Method Using 2D Image Sensor. J. Jpn. Weld. Soc. 2017, 86, 427–430. [Google Scholar] [CrossRef]
- Wang, D.; Kadoi, K.; Shinozaki, K.; Yamamoto, M. Evaluation of Solidification Cracking Susceptibility for Austenitic Stainless Steel during Laser Trans-Varestraint Test Using Two-Dimensional Temperature Measurement. ISIJ Int. 2016, 56, 2022–2028. [Google Scholar] [CrossRef]
- Yang, S.; Ito, T.; Marumoto, K.; Shinozaki, K.; Yamamoto, M. In-Plane Constraint and Relaxation Type Technology for the Evaluation of Solidification Cracking Susceptibility. J. Mater. Res. Technol. 2025, 38, 5263–5273. [Google Scholar] [CrossRef]
- Shibata, S.; Watanabe, T.; Mekaru, S.; Fukumoto, I. Effect of Various Factors on Grain Boundary Migration in the Weld Metal of an Austenitic Stainless Steel. Q. J. Jpn. Weld. Soc. 1997, 15, 100–107. [Google Scholar] [CrossRef]
- Agarwal, G.; Kumar, A.; Gao, H.; Amirthalingam, M.; Moon, S.C.; Dippenaar, R.J.; Richardson, I.M.; Hermans, M.J.M. Study of Solidification Cracking in a Transformation-Induced Plasticity-Aided Steel. Met. Mater Trans. A 2018, 49, 1015–1020. [Google Scholar] [CrossRef]
- Wang, N.; Mokadem, S.; Rappaz, M.; Kurz, W. Solidification Cracking of Superalloy Single- and Bi-Crystals. Acta Mater. 2004, 52, 3173–3182. [Google Scholar] [CrossRef]
Disclaimer/Publisher’s Note: The statements, opinions and data contained in all publications are solely those of the individual author(s) and contributor(s) and not of MDPI and/or the editor(s). MDPI and/or the editor(s) disclaim responsibility for any injury to people or property resulting from any ideas, methods, instructions or products referred to in the content. |
© 2025 by the authors. Licensee MDPI, Basel, Switzerland. This article is an open access article distributed under the terms and conditions of the Creative Commons Attribution (CC BY) license (https://creativecommons.org/licenses/by/4.0/).