Abstract
This paper presents the results of an experimental investigation of a 12% Cr steel where a significant increase in Charpy impact toughness and a slight decrease in ductile-brittle transition temperature (DBTT) from 70 °C to 65 °C were obtained through thermo-mechanical processing, including interim hot forging at 1050 °C with long-term annealing at 1000 °C, as compared with conventional heat treatment. At lower temperatures ranging from −20 °C to 25 °C, the value of impact toughness comprised ~40 J cm−2 in the present 12% Cr steel subjected to thermo-mechanical processing. The amount of δ-ferrite decreased to 3.8%, whereas the size of prior austenite grains did not change and comprised about 40–50 μm. The boundaries between δ-ferrite and martensitic laths were decorated by continuous chains of Cr- and W-rich carbides. M23C6 carbides also precipitated along the boundaries of prior austenite grains, packets, blocks and martensitic laths. Thermo-mechanical processing increased the mean size of M23C6 carbides and decreased their number particle densities along the lath boundaries. Moreover, the precipitation of a high number of non-equilibrium V-rich MX particles was induced by hot forging and long-term normalizing at 1000 °C for 24 h.
1. Introduction
Nine to twelve per cent Cr martensitic steels are used for fossil power plants operating at temperatures up to 620 °C [1,2]. Nine per cent Cr steels demonstrate superior creep resistance, attributed to the stability of the tempered martensite lath structure (TMLS) evolved after normalizing followed by tempering [1,2,3,4,5,6,7,8]. These steels are used for steam turbine blades [1,2]. Increasing Cr content up to 12% enhances erosion/corrosion resistance but leads to the formation of δ-ferrite [9,10,11,12]. The volume fraction of δ-ferrite is dependent on chemical composition and heat treatment [9,10,11,12]. The creep resistance of the 12% Cr steels is lower compared with the 9% Cr steels because of instability of the TMLS attributed to the formation of the coarse Z-phase particles with chemical composition of 50 wt% (Cr + Fe) and 50% (V + Nb) and the presence of δ-ferrite [8,9,10,11,12,13,14,15]. In previous work [16,17], we reported on the creep behavior of 12% Cr steel with low N and high B contents, which demonstrates a good value of 1% creep limit compared with the Co-modified P92 type steel. The high strength of this 12% Cr steel is based on the solid solution strengthening from W, Mo, and Co, and strengthening from lath/subgrains with low-angle boundaries [16,17]. The main disadvantage of the 12% Cr steels is its susceptibility to the ductile/brittle transition at temperatures higher than the ambient one [15]. In contrast, 9% Cr-2% W-MoVNb steel shows impact toughness of 200 J cm−2 at room temperature [18], while the value of impact toughness for 12% Cr-0.6% Mo-2.2% W-4% Co-0.8% Cu-VNbB steel comprised 100 J cm−2 at room temperature [19]. Moreover, the fracture toughness of 12% Cr steels deteriorates with long-term annealing [19].
The origin and nature of the detrimental effect of δ-ferrite on the fracture toughness of martensitic steels are not yet clear [18,19,20,21,22,23,24,25,26,27,28,29,30]. Many researchers have pointed out the negative effect of δ-ferrite that is caused by the formation of brittle carbide chains along the boundaries between the δ-ferrite grains and the martensitic matrix [11,15,23,24,25,26], and a lack of cohesion between δ-ferrite grains and the surrounding matrix [27,28]. At the same time, Alkan et al. [29] and Schäfer [30] claimed that soft δ-ferrite without brittle carbides along the boundaries was beneficial to impact toughness. Experimental data from Wang et al. [10] support this conclusion. It was shown [10] that the formation of δ-ferrite in a 13Cr-4Ni martensitic steel with 0.03% C and Ti additions does not affect the lower and upper shelf energy, whereas the DBTT remarkably increases from −89 °C in the material condition without δ-ferrite to −14 °C in the steel with 7.8% of δ-ferrite. The main feature of this steel was lack of the chains of boundary M23C6 carbides in the TMLS and chains of Cr-rich and Mo-rich particles on the interfaces of δ-ferrite [10]. However, in 12% Cr steel with 0.1% C, the chains of carbides evolve along interfaces of δ-ferrite that cause deterioration of fracture toughness [19].
In the steels with Cr content ≥11%, δ-ferrite is the first solidifying phase, which partially or completely transforms into austenite during cooling, depending on the chemical composition [11]. The volume fraction of δ-ferrite can be decreased by long-term annealing at high temperatures or hot deformation [11,23,24,25]. However, it is very difficult or even impossible to attain a thermodynamically equilibrium value of δ-ferrite in high-Cr steels by heat treatment since it requires diffusion of substitutional solutes [11]. There are limited experimental results on the effect of thermo-mechanical processing (TMP) on the volume fraction and dimension of δ-ferrite and the relationship between these parameters and impact toughness of 12% Cr steels [15,19,23,24,25,26,27,28,29,30]. The aim of the present research is to report on the effect of TMP on the structural parameters of δ-ferrite and carbide chains along the boundaries of this phase in 12% Cr martensitic steel with Co, Cu and Ta doping, which demonstrates good creep resistance [16]. The second aim is to establish the relationship between characteristics of δ-ferrite and impact toughness.
2. Materials and Methods
The Co-modified 12% Cr steel with Cu and Ta doping as well as a critically low content of nitrogen and a high content of boron was produced by vacuum induction melting. Chemical composition of this steel determined via optical emission spectrometer FOUNDRY-MASTER UVR (Oxford Instruments, Abingdon, UK) and a METEK-300/600 nitrogen, hydrogen, and oxygen analyzer (METEKPROM Ltd., Izhevsk, Russia) is summarized in Table 1.

Table 1.
Chemical composition of the Co-modified 12% Cr steel (wt.%).
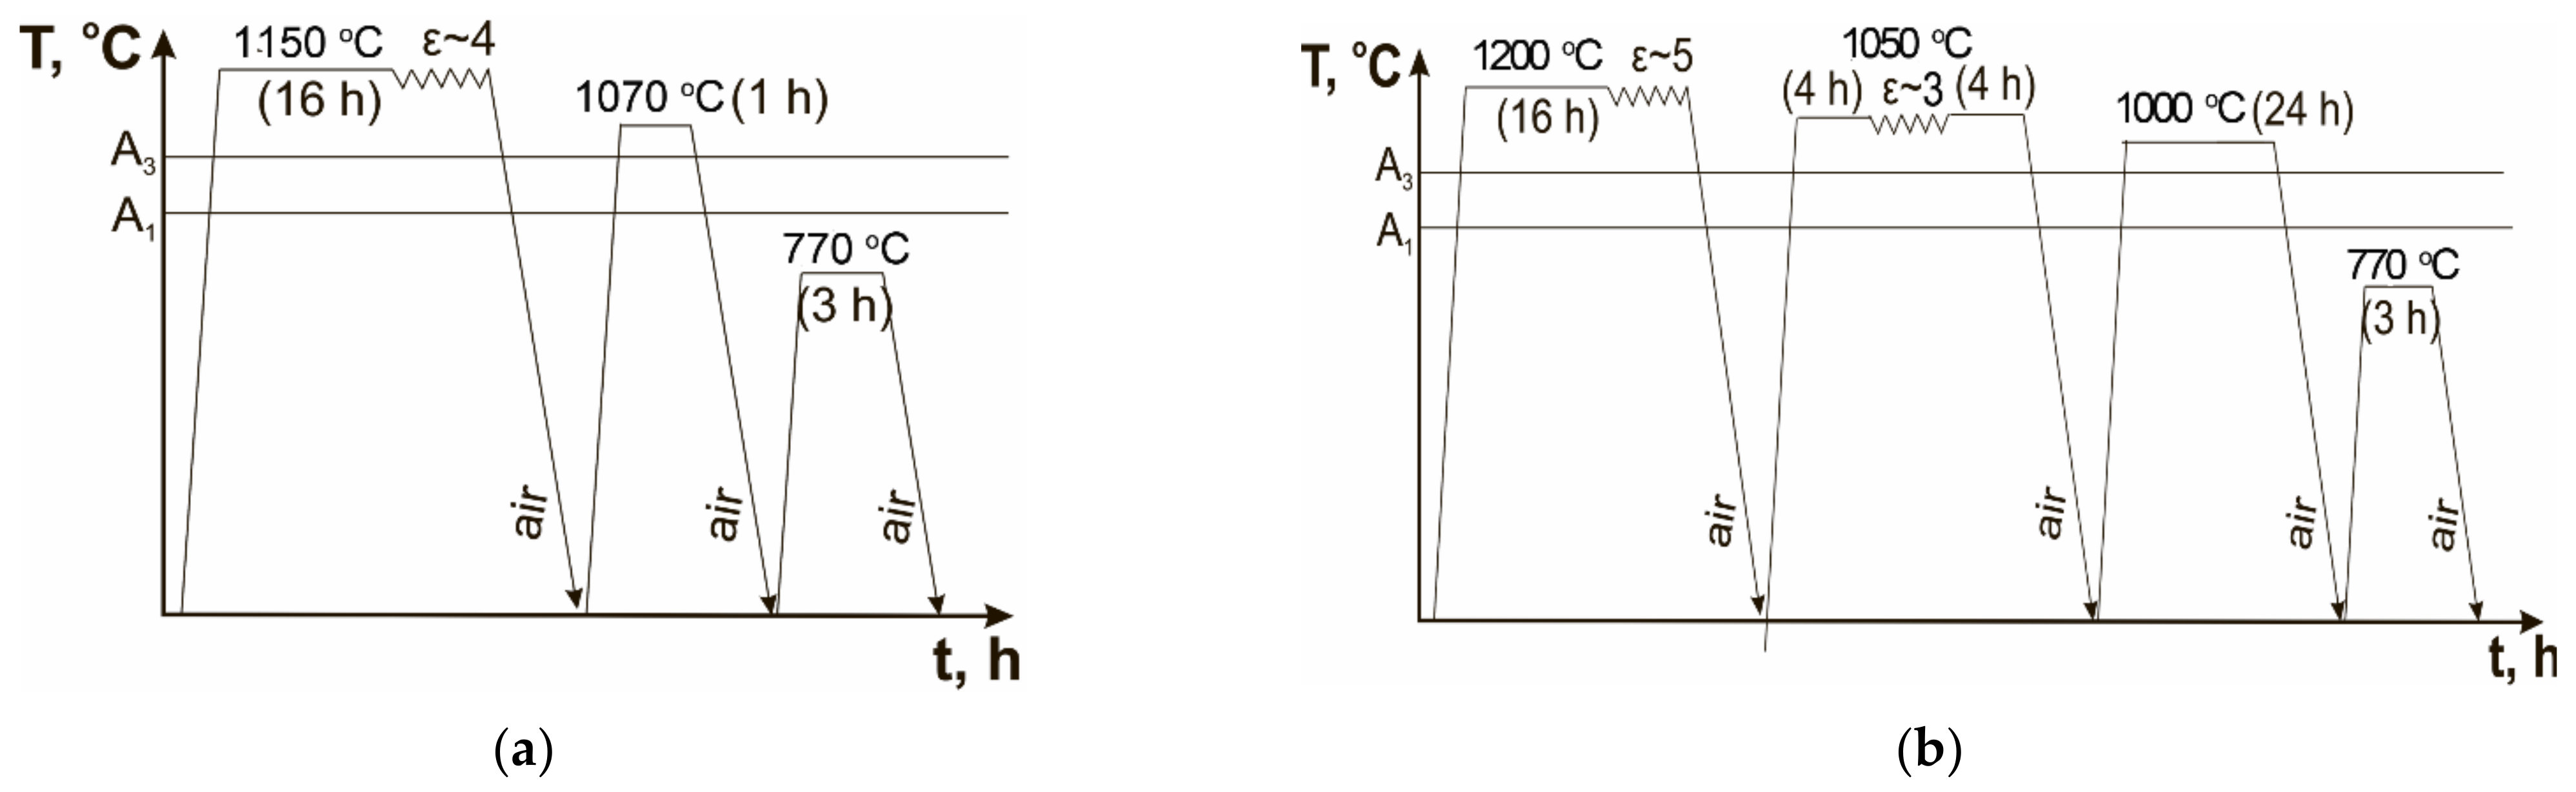
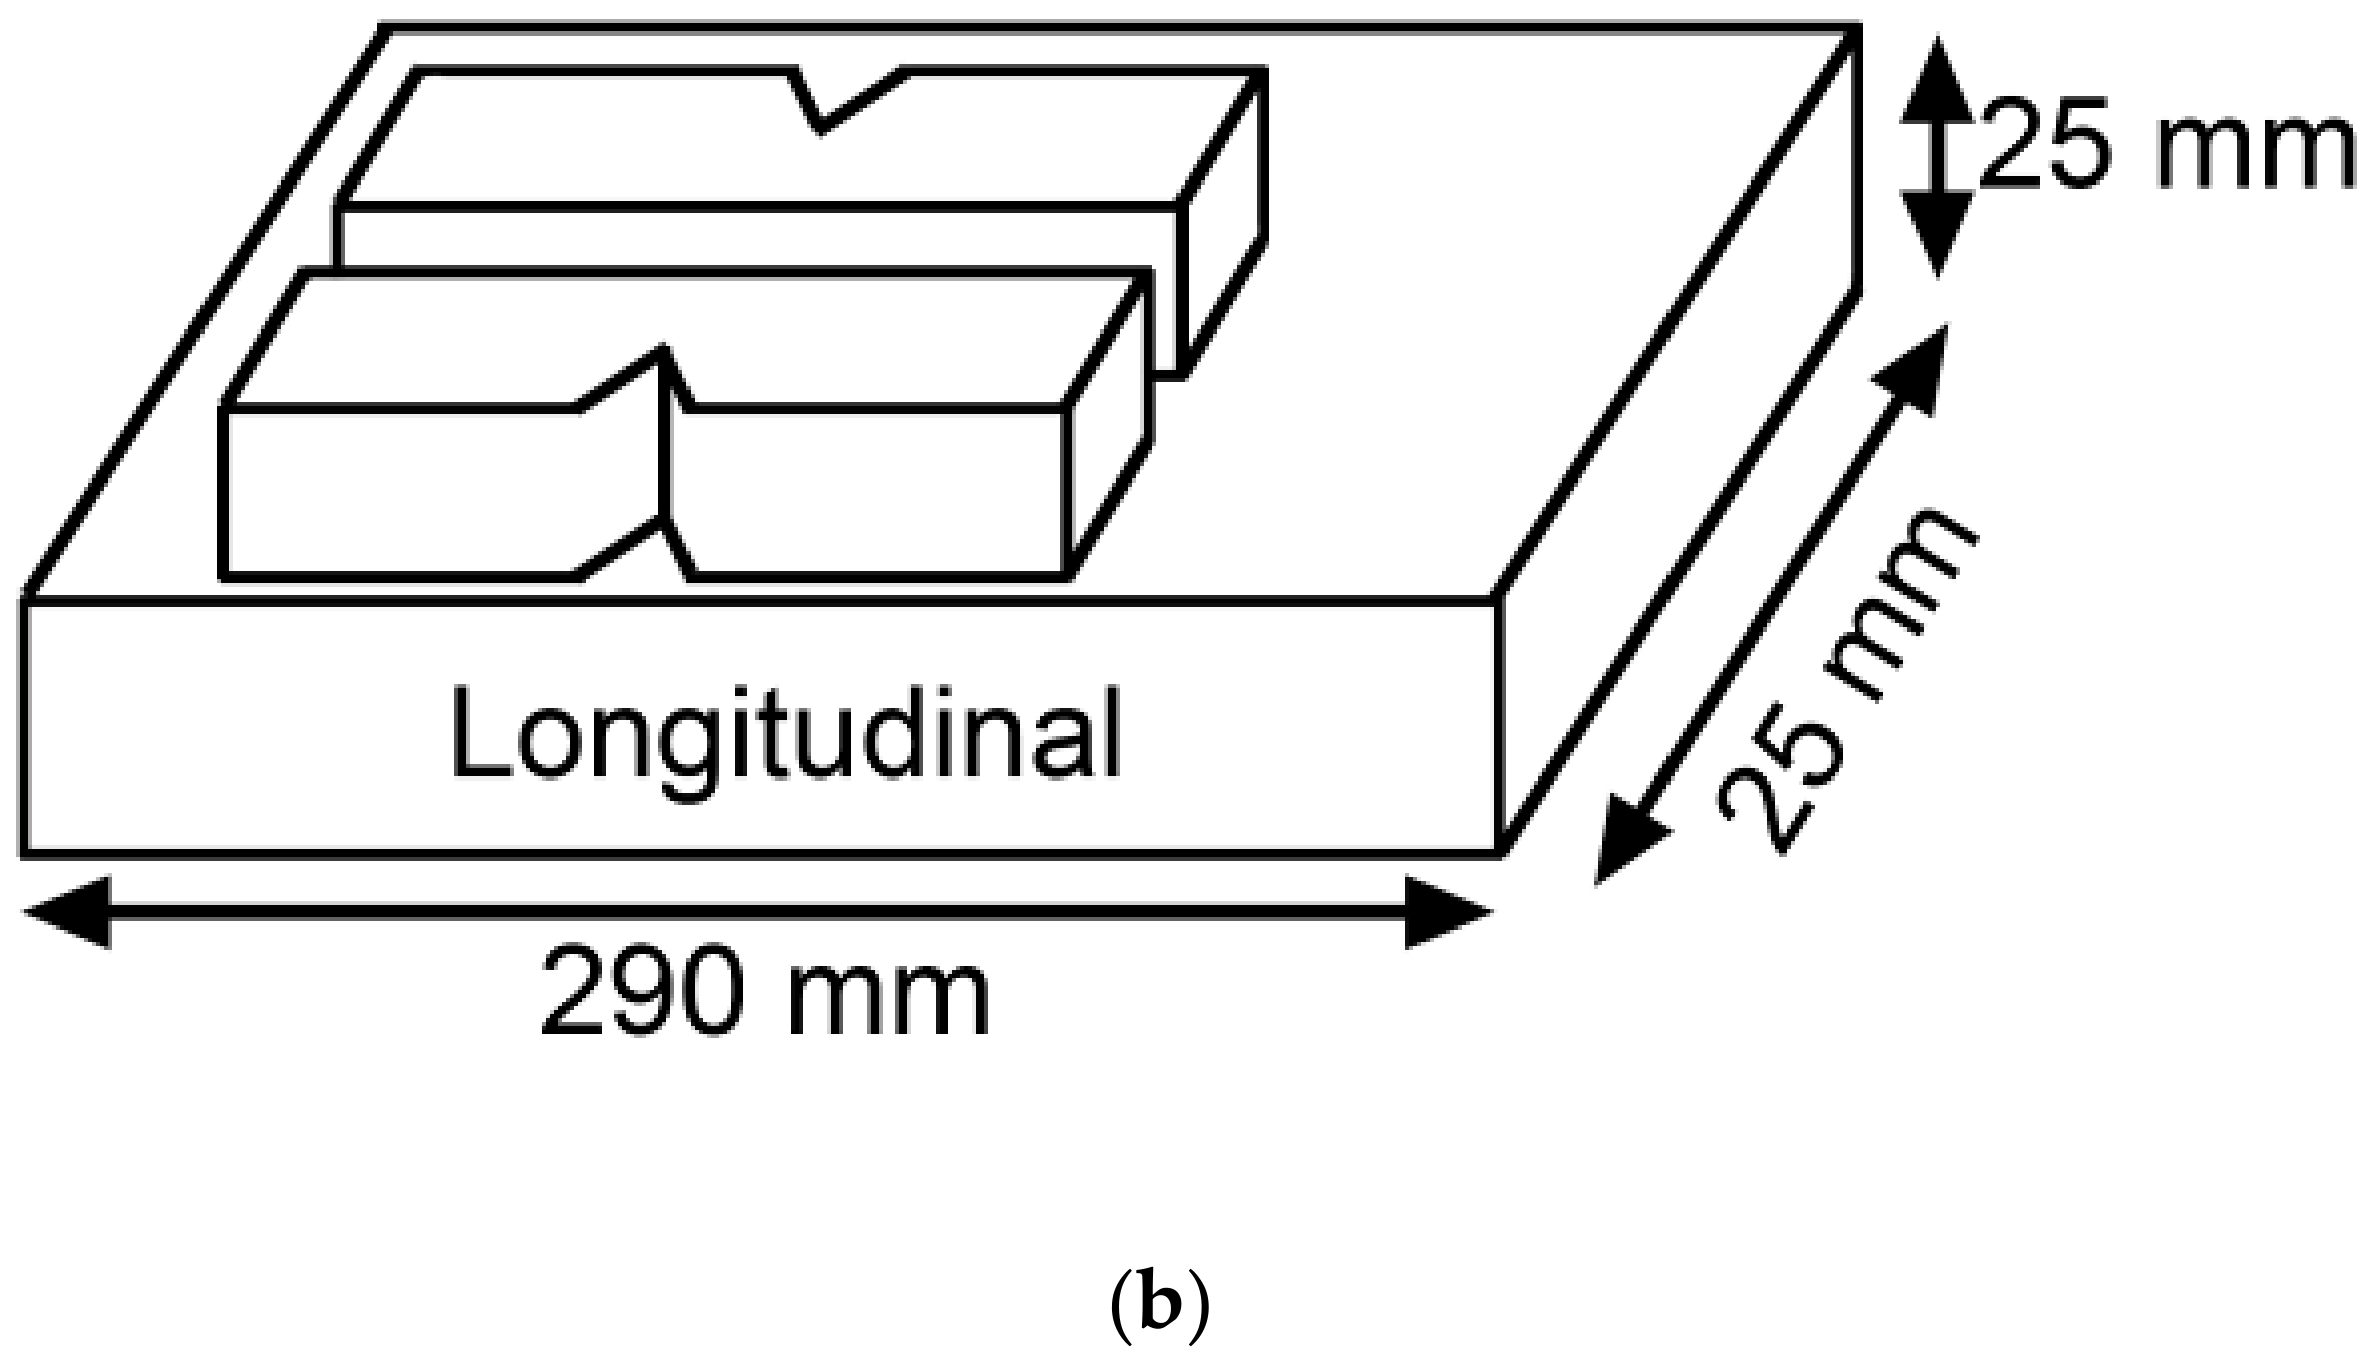
This steel was subjected to two different treatments (Figure 1). The first treatment denoted here as the conventional heat treatment (CHT) consisted of homogenization annealing at 1150 °C for 16 h followed by forging at 1150 °C with a true strain of ~4, air cooling, then normalizing at 1070 °C for 1 h, air cooling, and final tempering at 770 °C for 3 h, air cooling (Figure 1a). The second treatment denoted here as the TMP consisted of homogenization annealing at 1200 °C for 16 h with following forging at 1200 °C with a true strain of ~5, air cooling, then annealing at 1050 °C for 4 h with following forging at 1050 °C with a true strain of ~3 and annealing at 1050 °C for 4 h, air cooling; next, normalizing at 1000 °C for 24 h, air cooling, and final tempering at 770 °C for 3 h, air cooling (Figure 1b). The aim of the TMP was to decrease the δ-ferrite content. A schematic presentation of a forging operation at 1050 °C with a true strain of ~3 along with the location of Charpy V-notch samples in the forged bar with a 25 × 25 mm2 cross section and 290 mm length is represented in Figure 2. Schemas of forging operation at 1150 °C with a true strain of ~4 and at 1200 °C with a true strain of ~5 were similar to the forging operation at 1050 °C with a true strain of ~3.
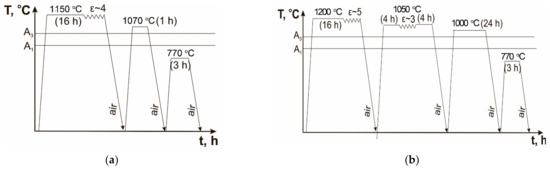
Figure 1.
(a) Schematic illustration of the CHT consisting of homogenization annealing at 1150 °C for 16 h with following forging at 1150 °C with true strain of ~4, air cooling, then normalizing at 1070 °C for 1 h, air cooling, and final tempering at 770 °C for 3 h, air cooling; (b) schema of the TMP consisting of homogenization annealing at 1200 °C for 16 h with following forging at 1200 °C with a true strain of ~5, air cooling, then annealing at 1050 °C for 4 h with following forging at 1050 °C with a true strain of ~3 and annealing at 1050 °C for 4 h, air cooling; next, normalizing at 1000 °C for 24 h, air cooling, and final tempering at 770 °C for 3 h, air cooling.
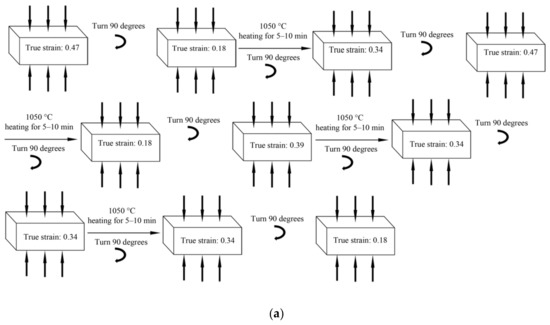

Figure 2.
(a) Schematic illustration of a forging operation at 1050 °C with a true strain of ~3; (b) the location of Charpy V-notch samples in the forged bar.
Standard Charpy V-notch specimens with a 10 × 10 mm2 cross section, 55-mm length, and 2-mm V-notch were tested using an Instron 450 J impact machine, Model SI-1M (Instron, Norwood, MA, USA), with an Instron Dynatup Impulse data acquisition system following the ASTM E-23 standard at temperatures ranging from −20 °C to 140 °C. Impact toughness was expressed in term of the amount of energy absorbed per unit cross sectional area. The percent of shear fracture was measured in accordance with the ASTM E-23 standard.
An Olympus GX70 optical microscope (Olympus Corporation, Tokyo, Japan) was used to reveal the prior austenite grain (PAG) boundaries and δ-ferrite grains by etching of grounded and polished samples in a solution of 2% HNO3 and 1% HF in distilled water. The PAG and δ-ferrite grain sizes were measured using optical micrographs by the linear intercept method, including all clearly visible boundaries. The fraction of δ-ferrite was estimated by the linear intercept method as the relation of sum of lengths of δ-ferrite grains to the length of intercept line using at least fifteen horizontal and vertical intercept lines on five optical images for each data point. The transmission electron microscope (TEM), JEOL–2100 (JEOL Ltd., Tokyo, Japan), with an INCA energy dispersive X-ray spectroscope (EDS) (Oxford Instruments, Abingdon, UK) and scanning electron microscope (SEM), Quanta 600FEG ((FEI, Hillsboro, OR, USA), were used for the structural characterization of tempered/TMP specimens. The foils for TEM and SEM were obtained by electropolishing at room temperature using Struers «Tenupol-5» machine (Struers Inc., Cleveland, OH, USA). The carbon replica for TEM was prepared using Q 150REQuorum vacuum deposition machine (Quorum Technologies, Laughton, UK). The average size of subgrains was estimated on TEM micrographs by the linear intercept method using at least six TEM images for each data point. The mean diameter of the secondary phase particles was estimated by counting from 150 to 250 particles per specimen on at least 5 arbitrarily selected typical TEM images of carbon replicas for each data point. Identification of the precipitates in TEM investigations was performed based on a combination of EDS composition measurements of the metallic elements and indexing of electron diffraction patterns using TEM of carbon replicas. The dislocation density in the lath interiors was evaluated as a number of intersections of individual dislocations with foil surfaces per unit area on at least five selected typical TEM images for each data point. Thermo-Calc software (Version 5.0.4 75, Thermo-Calc software AB, Stockholm, Sweden, 2010) was used for evaluation of phase equilibrium. The other details of the mechanical and structural characterization technique were presented in previous studies [16,17,18,19,20,21,31,32].
3. Results
3.1. Thermodynamic Analysis
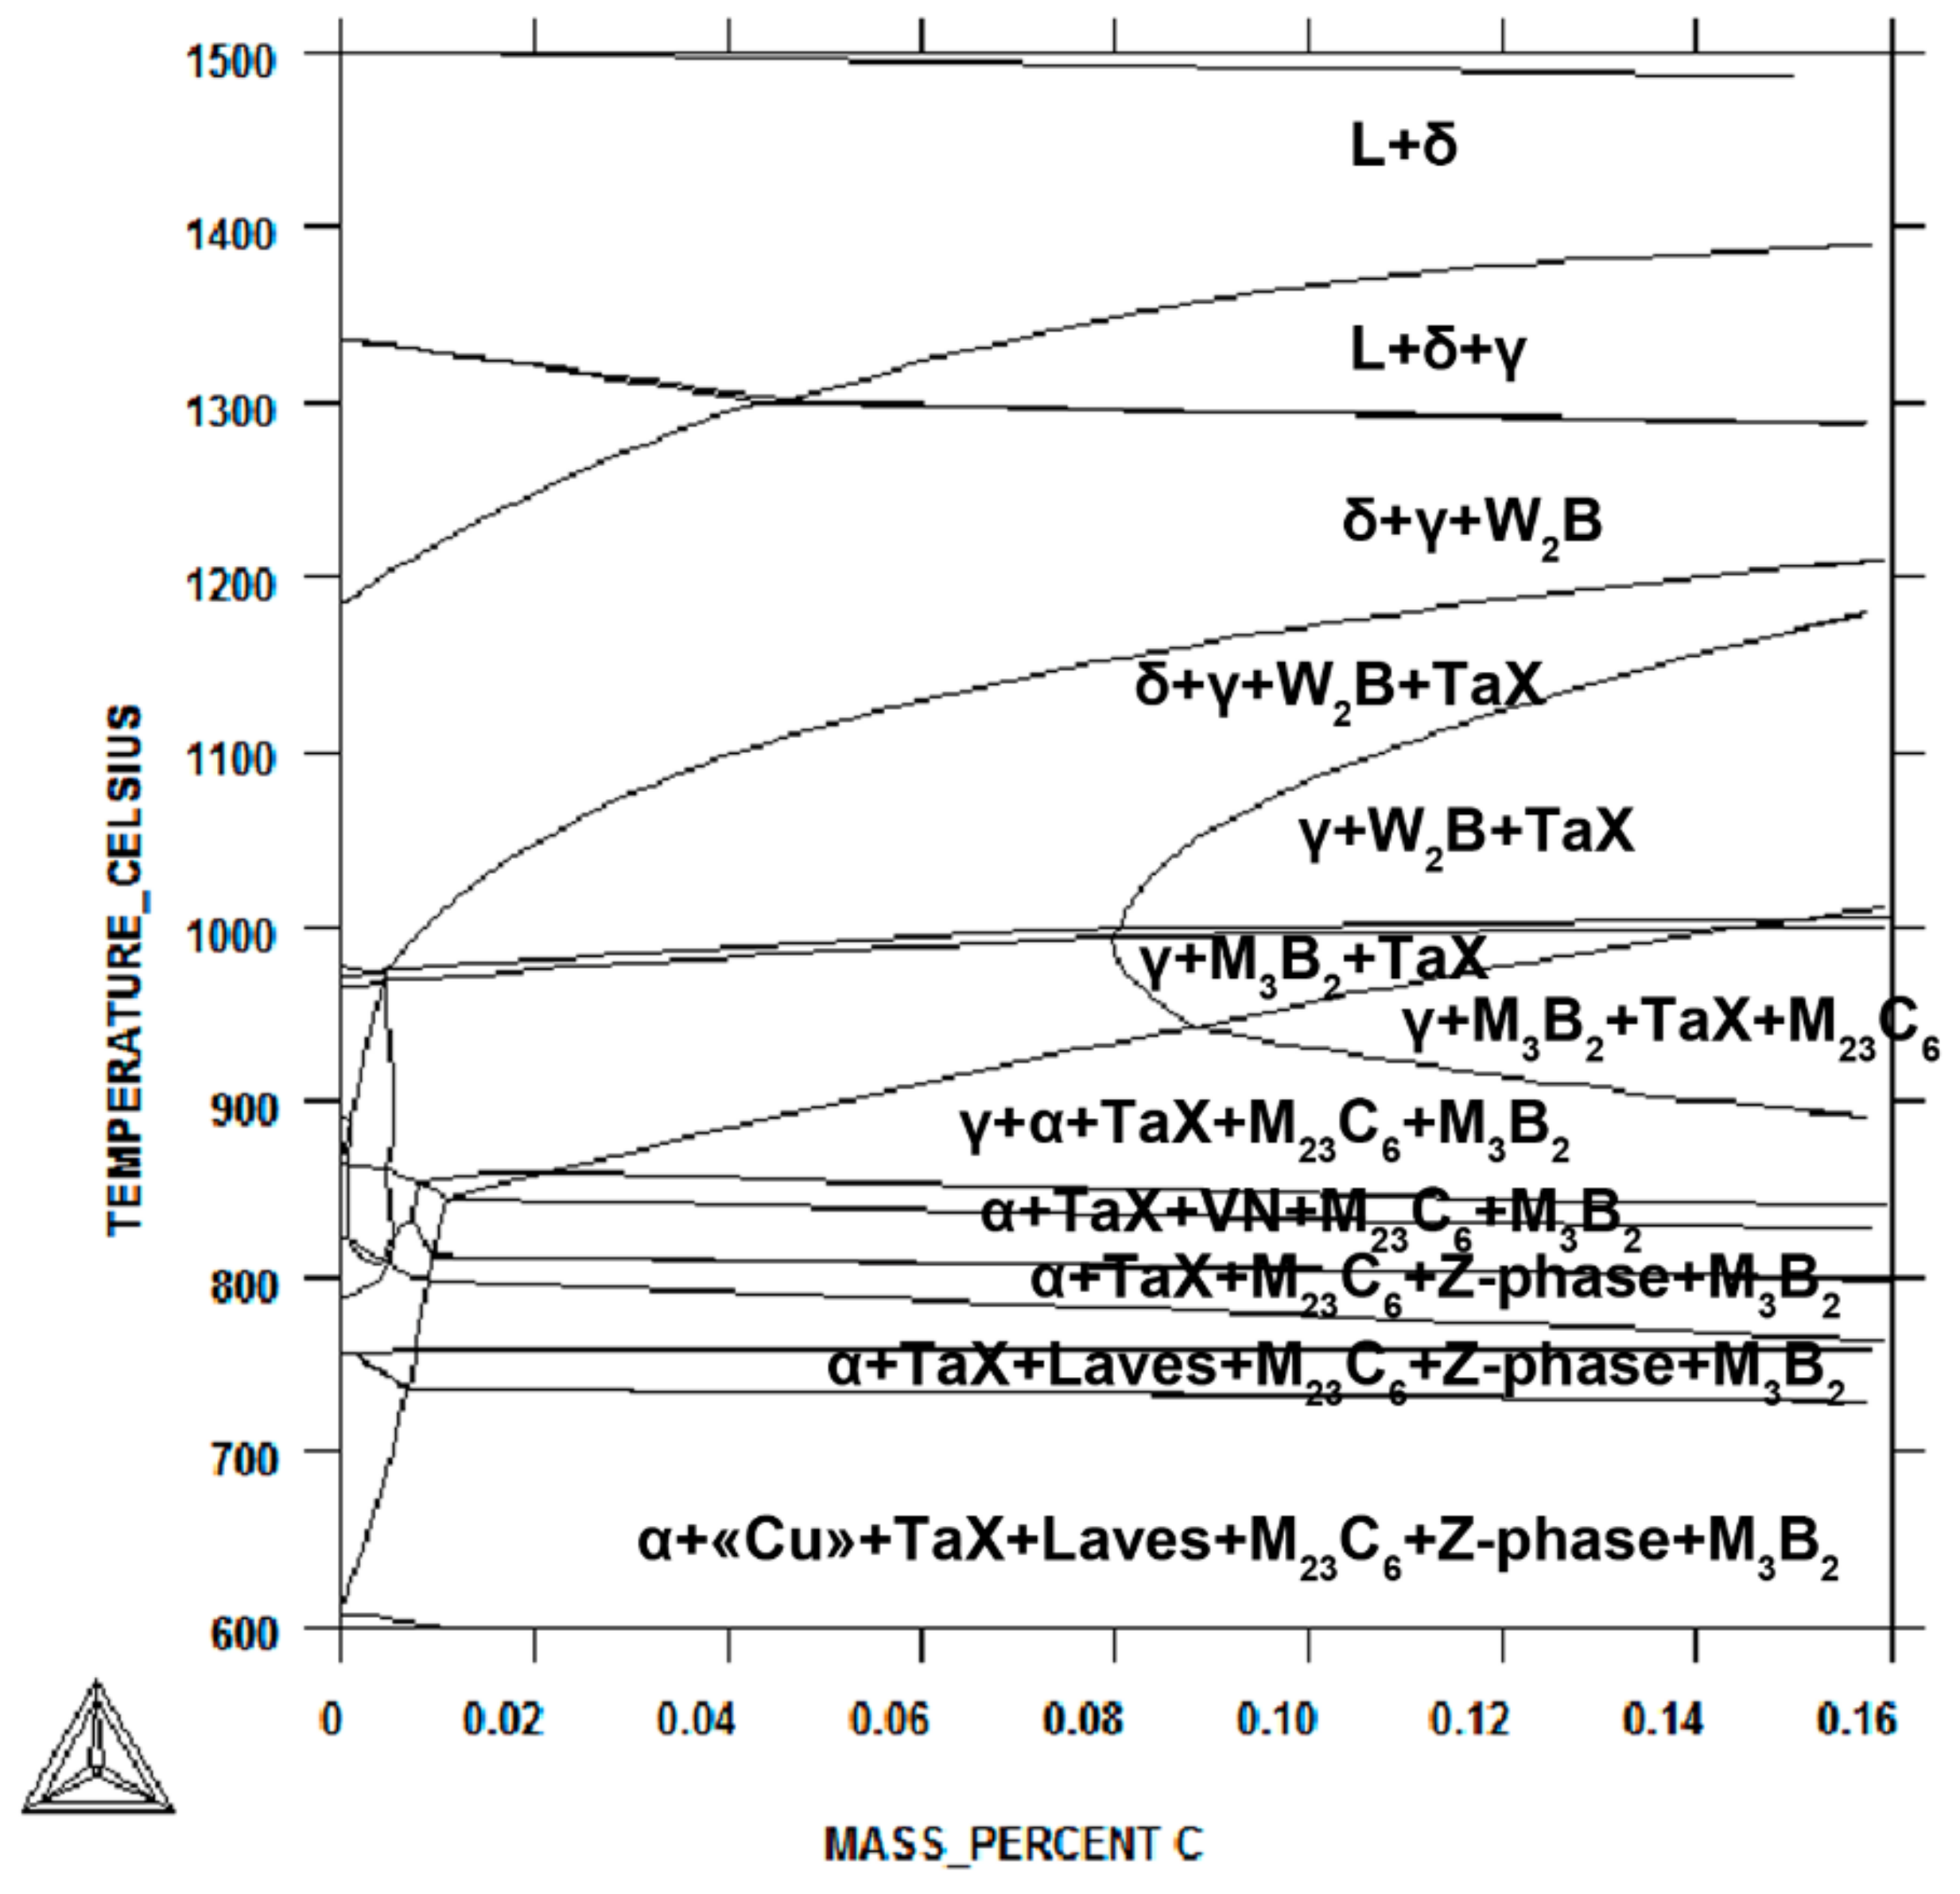
The equilibrium phase diagram for the present 12% Cr steel at temperatures ranging from 600 °C to 1500 °C is represented in Figure 3. The Cr2B_ort phase was suspended. The A1 and A3 points corresponding to the start and finish of the ferrite → austenite transformation, estimated via the Thermo-Calc software, comprised 850 °C and 920 °C, respectively (Figure 3). δ-ferrite formed at temperatures above 1100 °C (Figure 3, Table 1), and, therefore, it could be eliminated by long-term annealing at T < 1100 °C. However, in contrast to a supermartensitic steel containing 6.3 wt.% Ni, the difference in the content of substitutional solutes between δ-ferrite and austenite was low (Table 2). The content of such ferrite stabilizers as W and Nb in δ-ferrite was ~60% and ~100% higher than in austenite, respectively (Table 2). Therefore, the δ-ferrite → austenite + (Ta,Nb)X + W2B transformation will be controlled by the diffusion of these elements, taking into account that the diffusion of the interstitial elements such as C and N was fast. The C content in austenite was ~5 and ~4 times higher than that in ferrite at ~1150 °C and 1200 °C, respectively (Table 2). Solubility of the substitutional elements such as Ta, V, Co, Cr in austenite and δ-ferrite was nearly the same (Table 2).
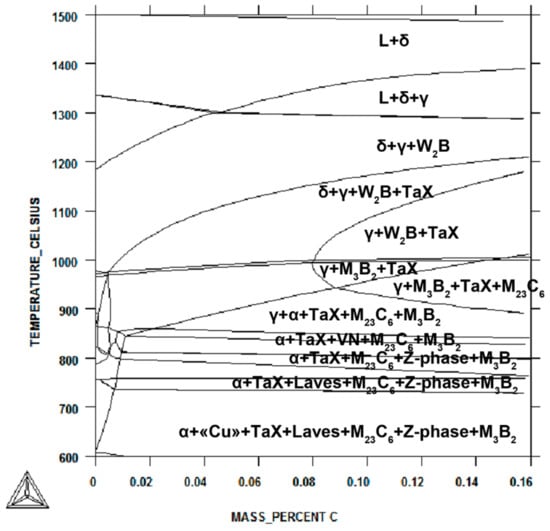
Figure 3.
The equilibrium phase diagram for the present 12% Cr steel via the Thermo-Calc software.
Table 2.
Chemical composition of δ-ferrite and austenite at different temperatures.
3.2. Structure after the CHT
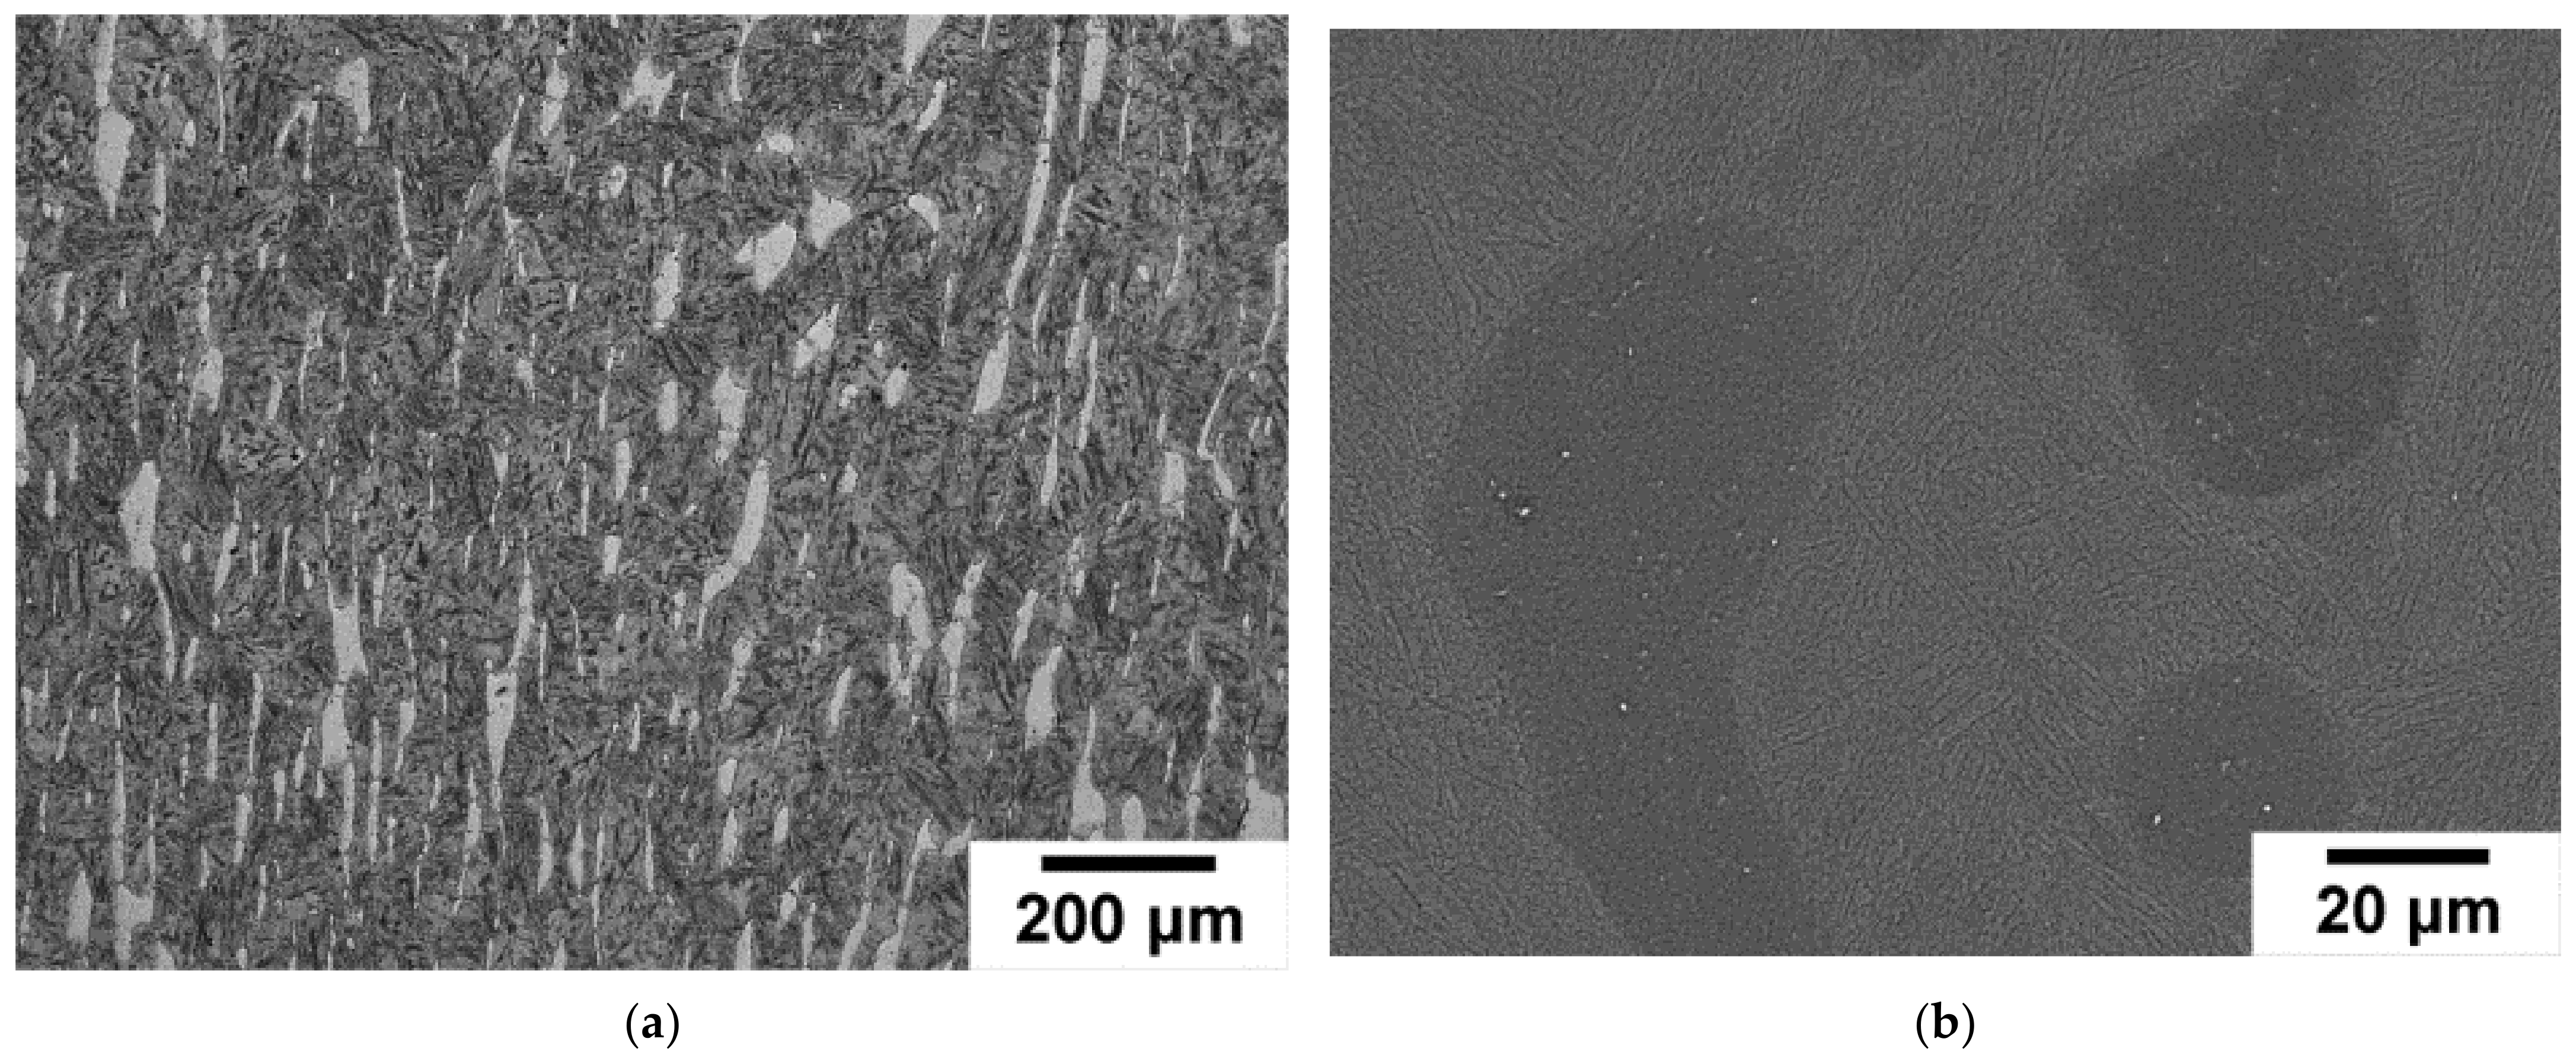
The CHT of the 12% Cr martensitic steel led to the formation of the TMLS with a mean size of PAGs of 48 μm and a certain amount of δ-ferrite grains having polygonal shape and an average dimension of 21 μm (Figure 4). The fraction of δ-ferrite did not exceed 10%, estimated via optical metallography (Figure 4a). The characteristics of the TMLS and a dispersion of the secondary particles were reported in the previous research [16,17,31]. Structural parameters for the 12% Cr steel studied after the CHT and TMP regimens are summarized in Table 3 [14].

Figure 4.
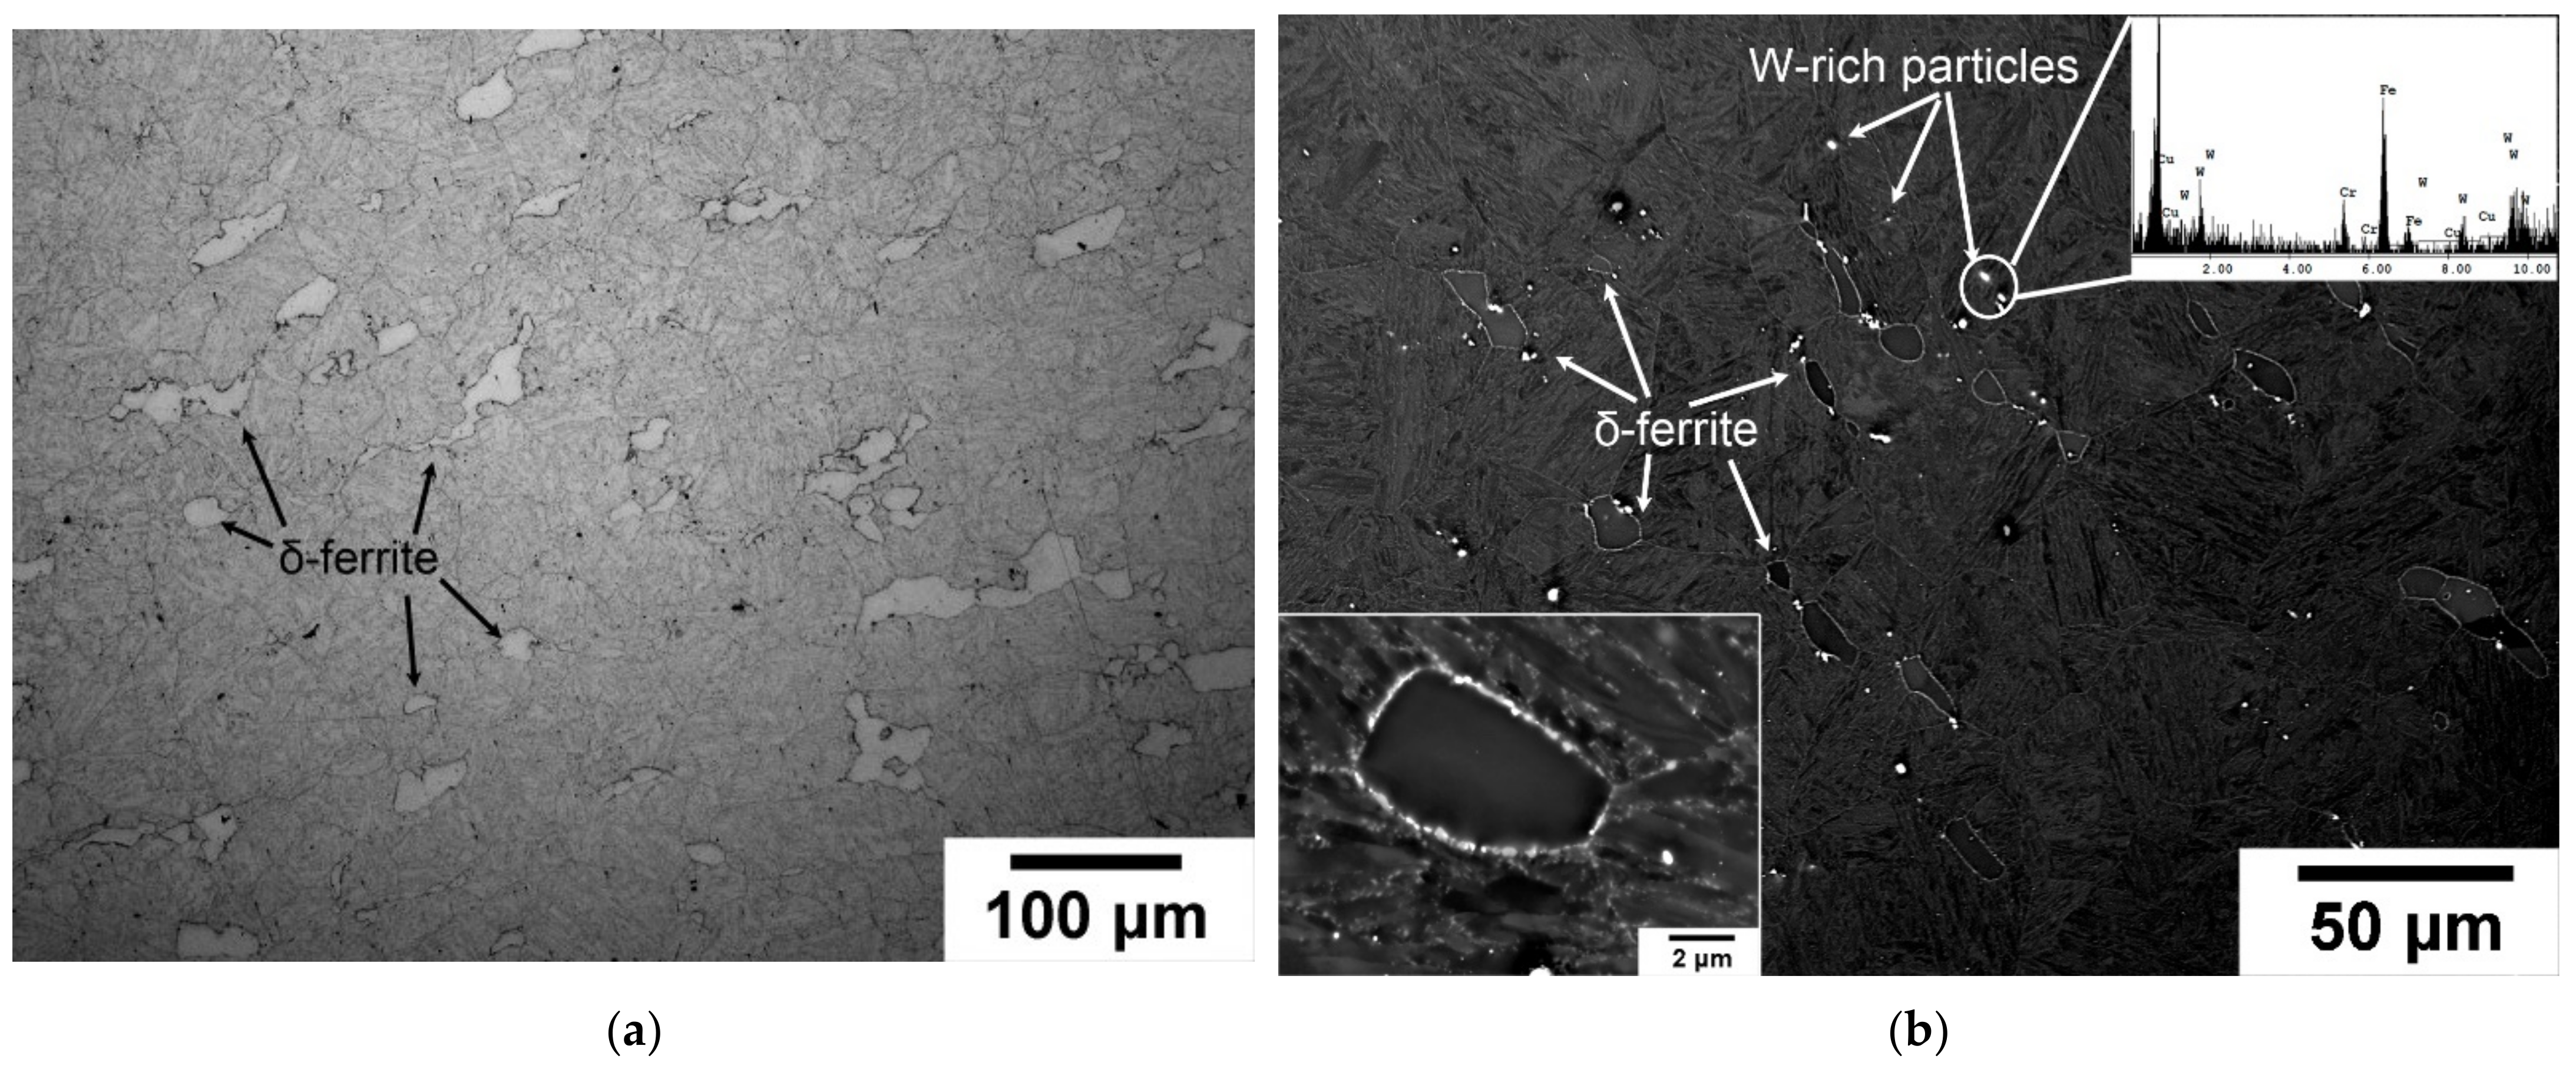
(a) Optical images of etched microstructure and (b) SEM image of the TMLS of the 12% Cr steel after the CHT.
Table 3.
Structural parameters of the 12% Cr martensitic steel after the CHT and TMP regimens.
The formation of δ-ferrite strongly depends on the chemical composition of the martensitic steel [23]. The susceptibility of martensitic steel to the δ-ferrite formation at high temperatures is described by the value of Cr equivalent (Creq) in wt.% as follows [23]:
Creq = Cr + 0.8Si + 2Mo + 1W + 4V + 2Nb+ 1.7Al + 60B − 2.0Ni − 0.4Mn − 0.6Co − 0.6Cu − 20N − 20C
The critical value of Creq for the 9–12% Cr martensitic steels is 10%. The obtained value of Creq = 12.1% for the 12% Cr steel studied indicates its high tendency to δ-ferrite formation during the solidification process. Note that the Thermo-Calc software predicted δ-ferrite fraction of about 10% at temperature of 1150 °C, that coincided with experimental data (Figure 3 and Figure 4, Table 3).
Moreover, after final tempering, the boundaries between the tempered martensite and δ-ferrite were decorated by dense chains of M23C6 carbides (grey particles) with a chemical composition (in wt.%) of 70% Cr-25% Fe-5% Mo estimated by TEM-EDS, and W-rich M6C particles (white particles) with a chemical composition (in wt.%) of 11% Cr-63% Fe-26% W estimated by TEM-EDS (Figure 4b). The mean size of W-rich particles located at the boundaries of δ-ferrite grains was 155 nm. Note that the mean size of M23C6 carbides along the boundaries of δ-ferrite was significantly larger than that along the boundaries of PAGs/packets/blocks and martensitic laths (174 nm vs. 50 nm, correspondingly). The high W content in δ-ferrite promotes the dominant precipitation of W-rich particles along the boundaries of δ-ferrite [23]. Moreover, no evidence for the presence of secondary particles inside the δ-ferrite grains was found (Figure 4b). Thus, the main feature of the 12% Cr steel subjected to CHT is a high amount of δ-ferrite (about 10%) and the formation of dense chains of the large secondary particles (M23C6 and W-rich M6C) along the boundaries between δ-ferrite and martensite.
3.3. Structure after the TMP
3.3.1. Structure after Homogenization Annealing at 1200 °C with Following Forging
Tkachev et al. [32] suggested that homogenization annealing at 1150 °C for 24 h does not provide the complete dissolution of large W-rich particles precipitated along the PAG boundaries in a 9% Cr steel additionally alloyed with Ta. These particles remain undissolved and large even after normalizing and tempering [32]. Increasing the temperature of homogenization annealing up to 1200 °C is necessary to dissolve these W-rich particles [32]. In the present 12% Cr steel, similar W-rich particles were also observed after CHT; they were located both along the PAG boundaries and along the boundaries of δ-ferrite grains (Figure 4b). Solution treatment at 1200 °C for 16 h followed by forging at the same temperature (Figure 5) led to the complete dissolution of large boundary particles, but the coarse W-rich particles inside the δ-ferrite grains remained undissolved (Figure 5b). However, the volume fraction of δ-ferrite increased up to 15–20% (Figure 5a) and was estimated as an equilibrium value using the Thermo-Calc software (Figure 3). The δ-ferrite grains exhibited both polygonal and bamboo-type shapes and an average dimension of 34 μm (Figure 5a). All next steps of the TMP were aimed to reduce the fraction of δ-ferrite down to a value of less than 5%.
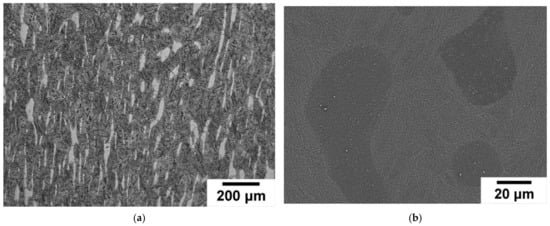
Figure 5.
(a) Optical metallography and (b) SEM image of the structure of the 12% Cr steel after homogenization annealing at 1200 °C for 16 h with following forging at 1200 °C, air cooling.
3.3.2. Structure after Annealing + Forging + Annealing at 1050 °C with Following Normalizing at 1000 °C
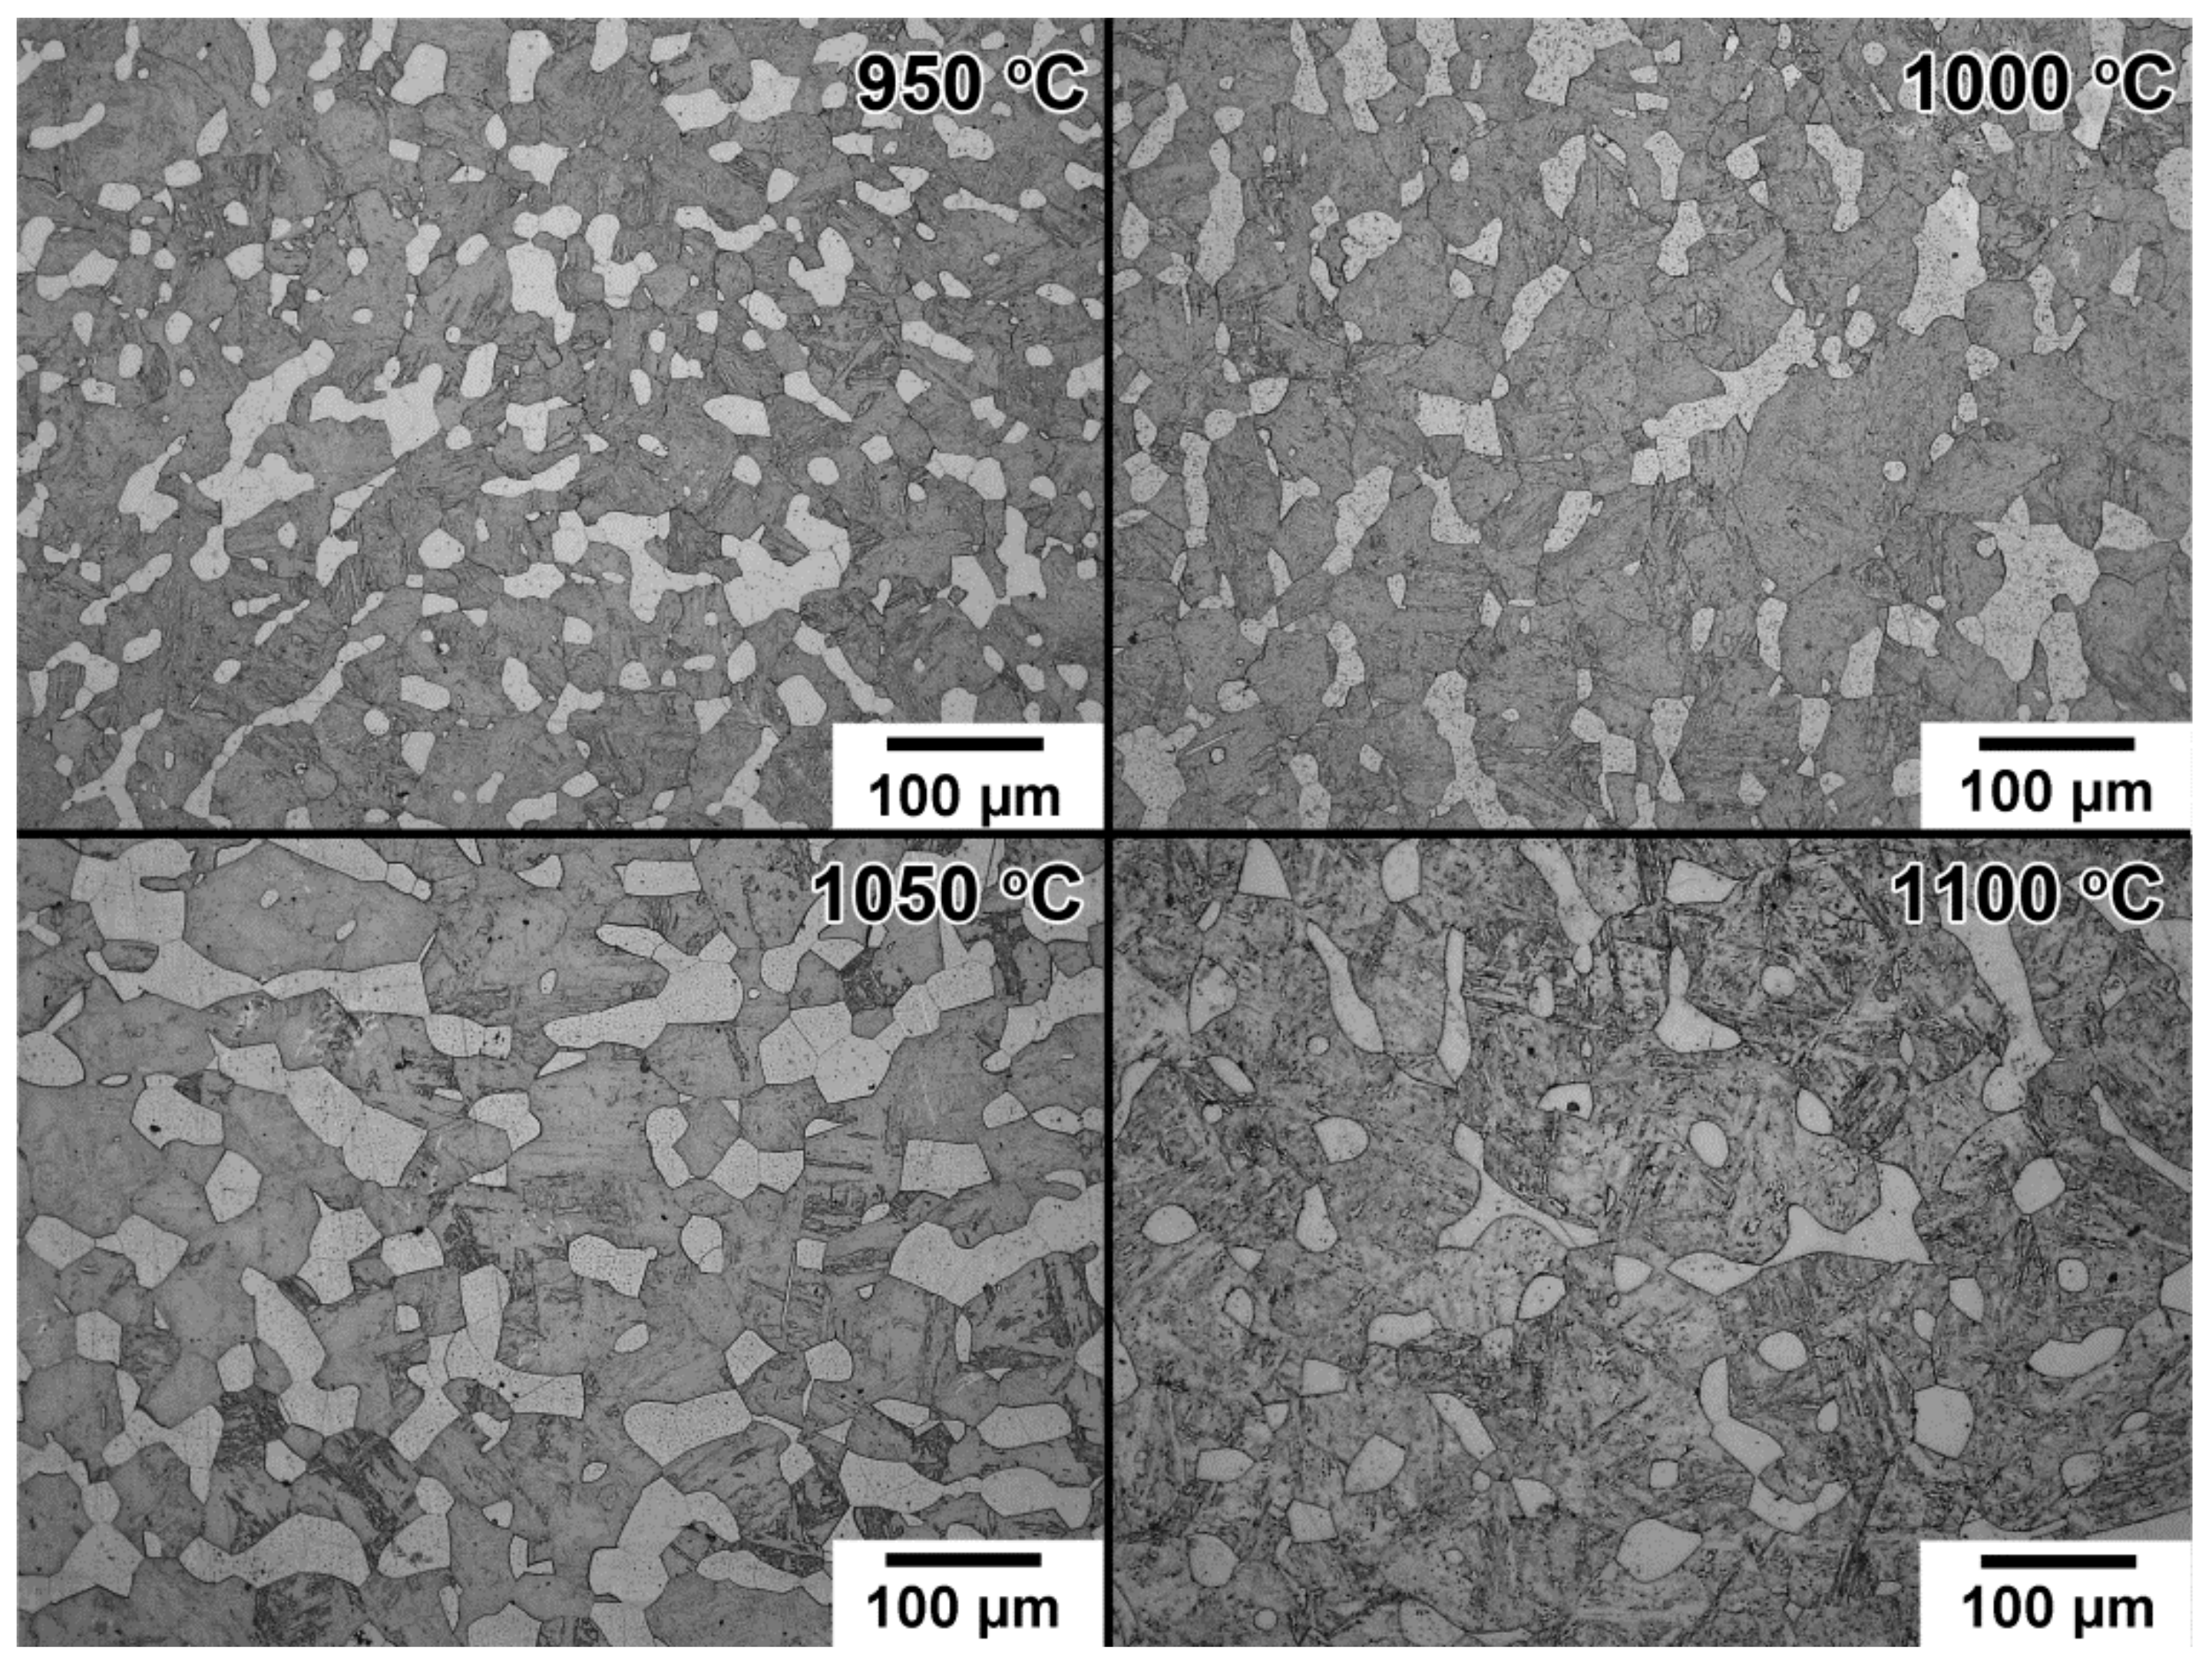
There are different ways to minimize the amount of δ-ferrite in 11–12% Cr martensitic steels: (a) long-term exposure at temperatures in the austenitic region from 950–1100 °C, at which δ-ferrite is a thermodynamically unstable phase and has to be partially or fully dissolved, and (b) carrying out the additional hot deformation in the austenitic region together with long-term exposure at temperatures as in case (a). The first way was found to be ineffective in reducing the δ-ferrite volume fraction. No significant effect of long-term annealing at temperatures of 950 °C, 1000 °C, 1050 °C, and 1100 °C for 88 h, air cooling, (Figure 6) on the volume fraction of δ-ferrite was found despite the fact that this phase was thermodynamically in non-equilibrium at T ≤ 1100 °C (Figure 3).

Figure 6.
Optical metallography of the 12% Cr steel homogenized and forged at 1200 °C after an additional long-term annealing at 950 °C, 1000 °C, 1050 °C, and 1100 °C for 88 h, air cooling.
Figure 6 demonstrates the presence of δ-ferrite after additional annealing at all temperatures in the amount of about 15–20% as it was after homogenization annealing at 1200 °C for 16 h with following forging at 1200 °C, air cooling. However, the annealing affected the shape of the δ-ferrite grains. Long-term annealing at 1100 °C produced the equiaxed shape of the δ-ferrite grains (Figure 6) instead of polygonal and bamboo-like ones (Figure 4). Liu et al. [24] concluded that the dissolution rate of δ-ferrite sharply decreases with the heating time in the steel with Creq of 10.5%, and δ-ferrite quickly dissolves only during the first 1–5 h; further heating does not change the amount of δ-ferrite. However, δ-ferrite in the present steel with Creq of 12.1% was revealed to be more resistant to dissolution under long-term exposure. Therefore, high-temperature heating alone cannot provide a homogeneous martensite structure with a low fraction of δ-ferrite.
The second method, with the addition of hot deformation, was a more effective way to eliminate δ-ferrite, as was suggested in [24]. Optical images of the structure of the 12% Cr steel homogenized and forged at 1200 °C and then annealed at 1050 °C for 4 h with following forging at 1050 °C with a true strain of ~3 and again annealed at 1050 °C for 4 h with final air cooling are represented in Figure 7a and, after subsequent normalization at 1000 °C for 24 h, air cooled, in Figure 7b. The combination of hot deformation and annealing at 1050 °C strongly reduced the fraction of δ-ferrite from 15% to 7% (Figure 5a and Figure 7a) due to the development of dynamic recrystallization and the formation of interior grain boundaries inside the δ-ferrite grains followed by the boundary splitting in a 90° triple junction between an α/γ interphase and an α/α boundary [24,33,34]. A diffusional flux of W and Ta solutes along the α/α boundary to the α/γ interphase leads to the precipitation of (Ta,Nb)X carbonitrides and the formation of an austenite groove followed by subdivision of a δ-ferrite grain by austenite films precipitated on the α/α boundary. As a result, the mean size of δ-ferrite grains significantly decreased to 9 ± 4 μm (Figure 7a). Their shape varied from bamboo-type to spherical (Figure 7a). The addition of normalizing at 1000 °C for 24 h led to a further decrease in the δ-ferrite fraction to 3.6% and provided a fine and uniform matrix microstructure (Figure 7b, Table 3). The δ-ferrite grains had a polygonal shape, mainly, and their mean size was 7 ± 4 μm. No significant effect of forging on the mean size of PAGs was detected. The mean size of PAGs was 42 ± 4 μm, the same as after the CHT (Table 3). No precipitation of W-rich particles took place during annealing and normalizing.
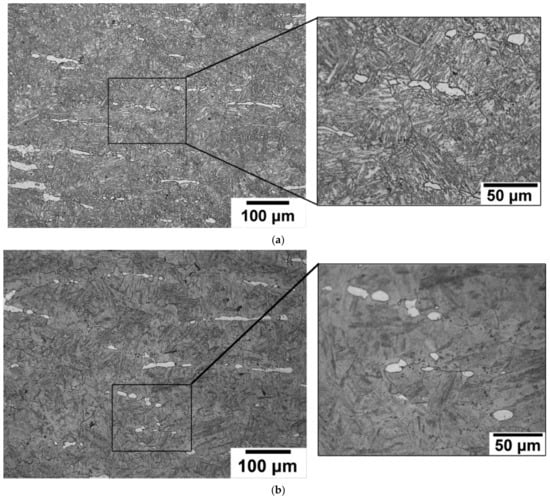
Figure 7.
(a) Optical metallography of the 12% Cr steel structure after homogenization annealing at 1200 °C for 16 h with following forging at 1200 °C, air cooling, then annealing at 1050 °C for 4 h with following forging at 1050 °C with a true strain of ~3 and annealing at 1050 °C for 4 h, air cooling, and (b) then normalizing at 1000 °C for 24 h, air cooling.
3.3.3. Structure after Tempering at 770 °C
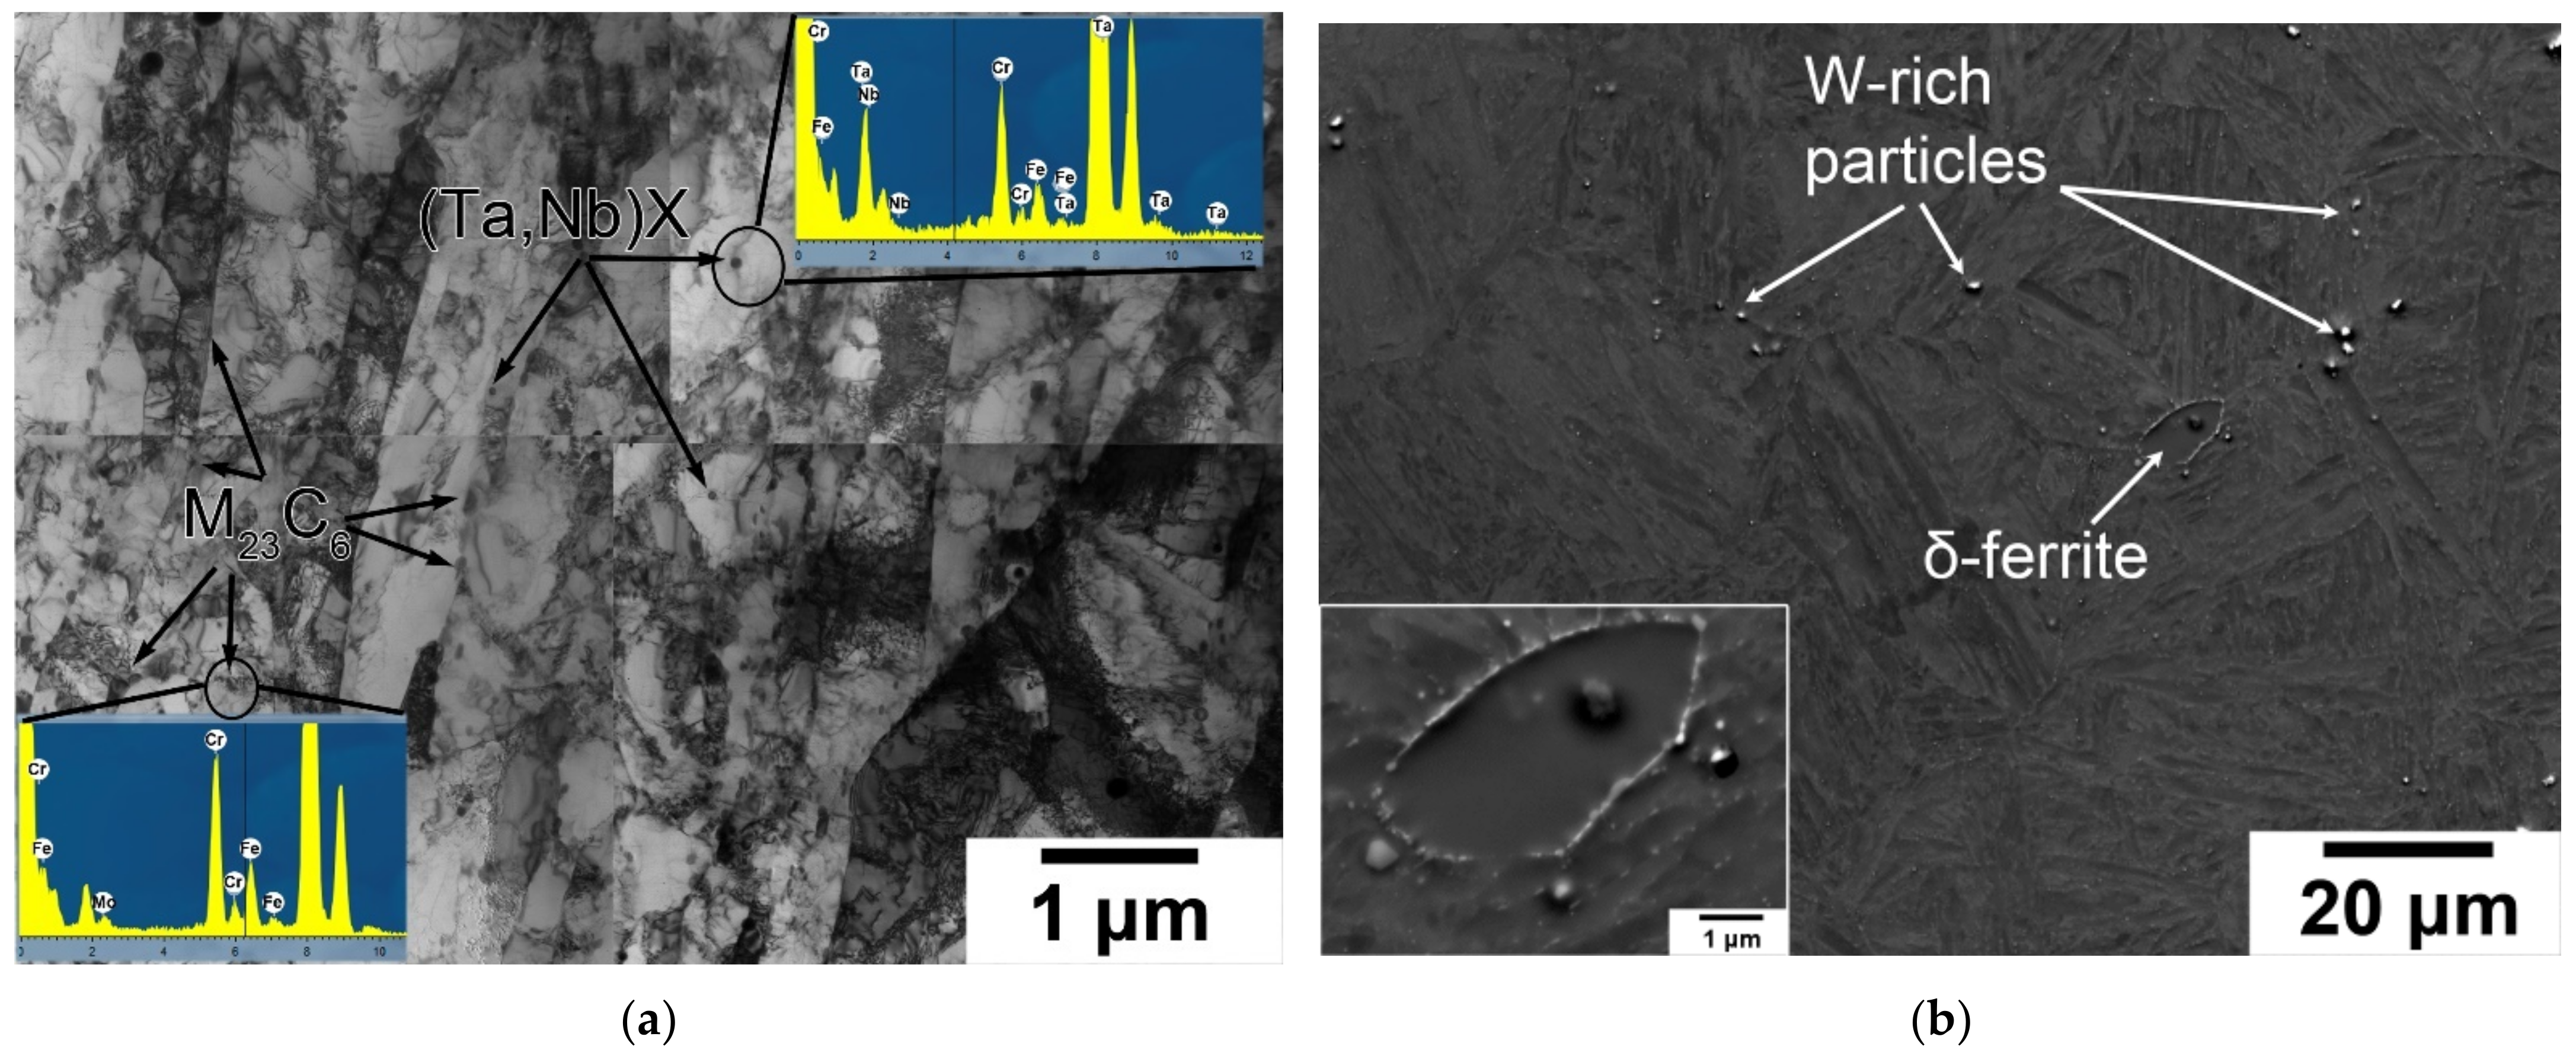
TEM and SEM images of the TMLS after TMP including final tempering at 770 °C for 3 h, air cooling, are represented in Figure 8. The TMLS after TMP and CHT was nearly the same (Figure 8a, Table 3). The boundaries of δ-ferrite grains were also decorated by dense chains of Cr-rich M23C6 carbides and W-rich M6C carbides as after CHT (Figure 4b and Figure 8b). Note that the grain boundary M23C6 and M6C carbides after the CHT and TMP regimens had similar morphology and sizes (Figure 4 and Figure 8, Table 3). For M23C6 carbides precipitated uniformly at all types of TMLS boundaries, their number particle density (β) was calculated as follows [19,34]:
where Fv is the particle volume fraction estimated using the Thermo-Calc software, D is the lath thickness, d is the particle size (Table 3). The particle densities for M23C6 carbides located along PAG/packet/block/martensitic lath boundaries were 2.5 and 1.8 μm−1 after the CHT and TMP, respectively. These values are the same as for other 9–10% Cr steels with high B content [35].

Figure 8.
(a) TEM and (b) SEM images of the TMLS after the TMP.
The main difference in the TMLS produced by CHT and TMP consisted in the dispersion of MX carbonitrides. After CHT, the MX carbonitrides were enriched by Ta and Nb with the ratio of Ta: Nb as 13: 1 and their average size comprised about 50 ± 5 nm (Table 3) [17]. No evidence for the formation of V-rich MX carbonitride was revealed. After TMP, two types of MX carbonitrides were observed:
- (i)
- Coarse (Ta,Nb)X carbonitrides with a rounded shape and an average size of 80 ± 5 nm (Figure 9a, Table 3) precipitate within the laths (Figure 8a). Their mean chemical composition was 70–80 wt.% Ta and 20–30% Nb estimated by TEM-EDS (Figure 9a). None of these particles were found within the δ-ferrite.
- (ii)
- Relatively fine V-rich MX carbonitrides with a mean chemical composition of 70–80 wt.% V, 20–25% Nb and 0–5% Cr estimated by TEM-EDS (Figure 9a) precipitated also within the laths. Their mean size was 38 ± 5 nm (Table 3). Note that the Thermo-Calc software did not predict the precipitation of the latter phase (Figure 3). Therefore, TMP promotes the precipitation of V-rich MX particles by inducing the δ-ferrite → austenite + (Ta,Nb)(C,N) transformation during hot intense plastic straining. Figure 9b demonstrates the large amount of V-rich MX particles in the present 12% Cr steel after TMP.
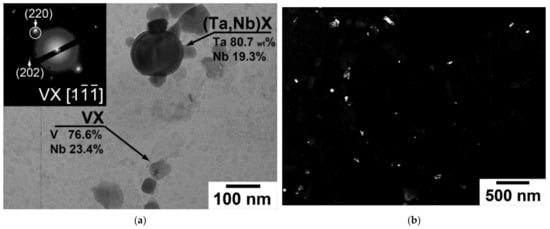
Figure 9.
(a) Bright-field TEM image of the secondary-phase particles in the present 12% Cr steel after the TMP (on carbon replica) together with the electron diffraction pattern from V-rich MX particle and (b) dark-field TEM image in reflection (220) of VX phase.
Figure 9.
(a) Bright-field TEM image of the secondary-phase particles in the present 12% Cr steel after the TMP (on carbon replica) together with the electron diffraction pattern from V-rich MX particle and (b) dark-field TEM image in reflection (220) of VX phase.

The volume fraction (Fv) of VX phase in the present 12% Cr steel after the TMP regimen was estimated as follows [34]:
where NT is the total number of secondary-phase particles, AS is the area selected in the TEM image (μm2), d is the diameter of secondary-phase particles (μm) and τ is the thickness of carbon replica (0.01 μm). The estimated volume fraction of V-rich MX particles was 0.17%. The sum volume fraction of V-rich MX particles, calculated using Equation (3), and (Ta,Nb)-rich MX particles predicted by the Thermo-Calc software comprised 0.25% (Table 3), which is close to the volume fraction of MX carbonitrides for the 9–12% Cr steels with conventional C and N contents [35].
3.4. Ductile-Brittle Transition
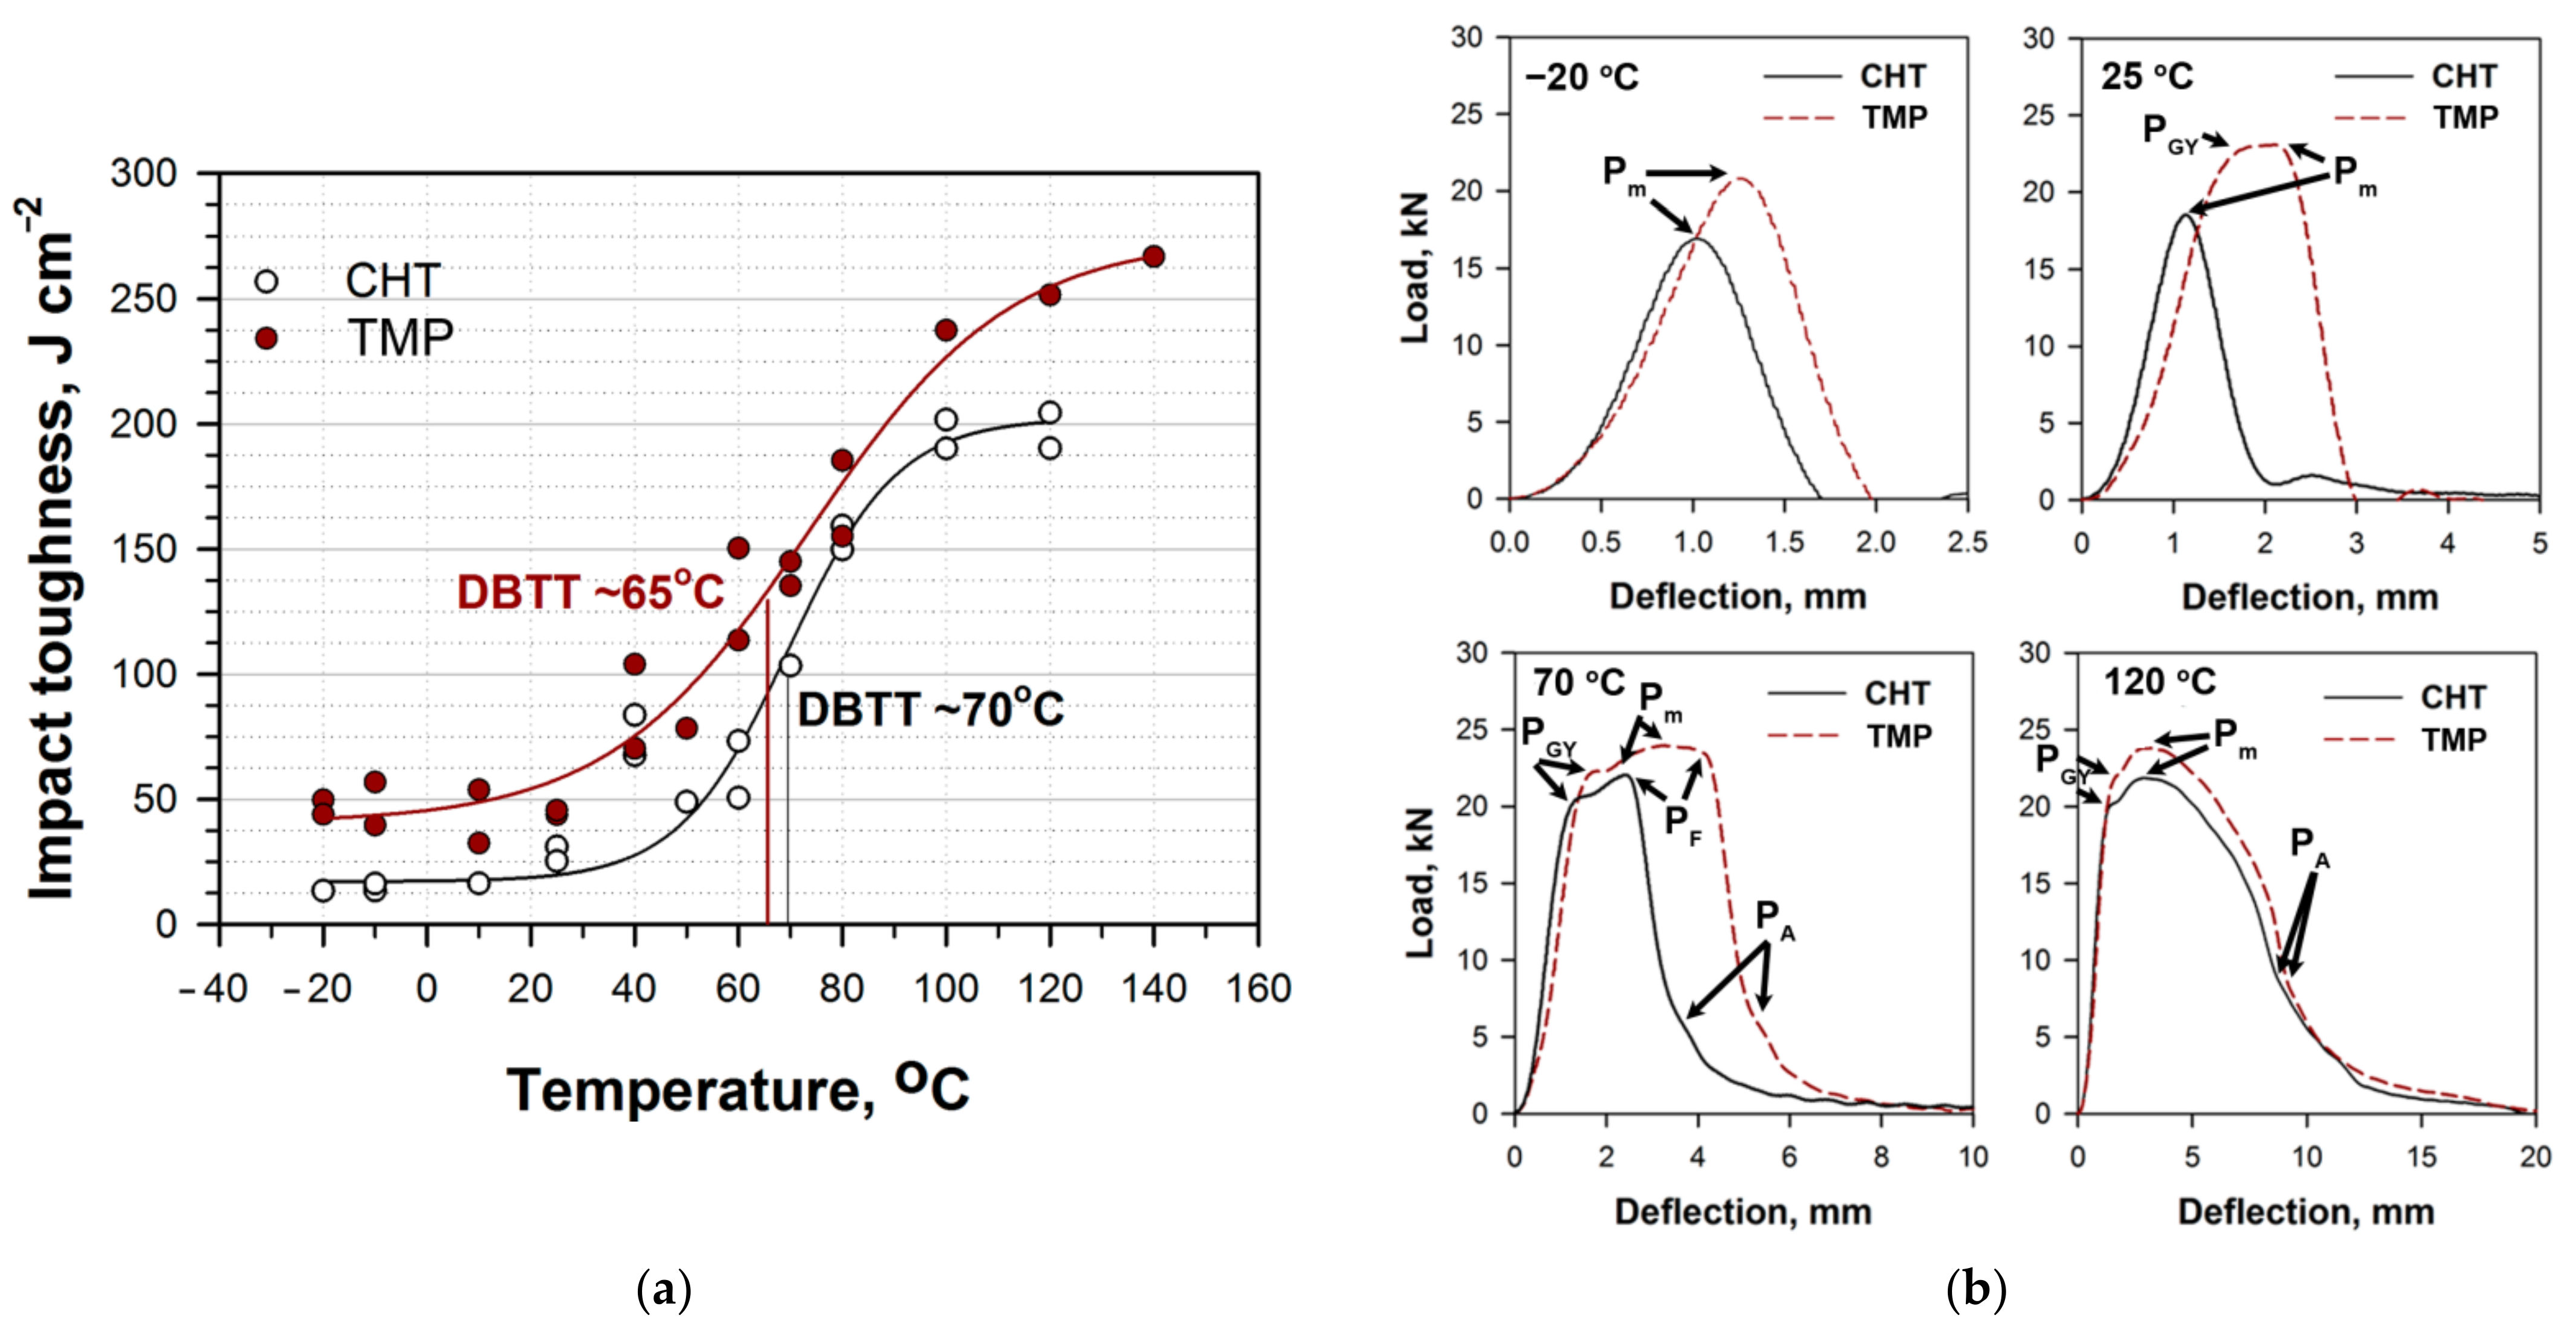
The temperature dependence of Charpy V-notch impact energy together with the load vs. deflection curves obtained from impact tests at different temperatures for the present 12% Cr steel subjected to the CHT and TMP regimens are plotted in Figure 10.
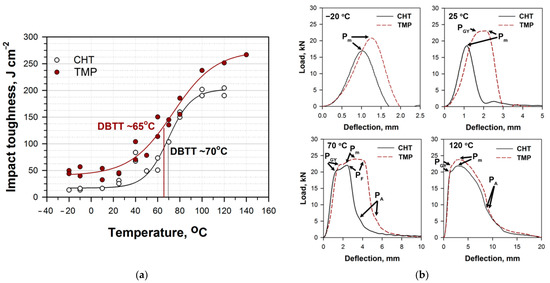
Figure 10.
(a) Temperature dependence of Charpy energy; (b) the load vs. deflection curves obtained from impact tests at different temperatures for the 12% Cr steel after the CHT and TMP regimens.
After CHT, the value of the upper shelf energy of the present 12% Cr steel was 200 J cm−2 (Figure 10a). The lower shelf region was observed below 25 °C; the transition region was revealed at temperatures ranging from 25 °C to 120 °C and the upper shelf region was located above 120 °C. The value of the lower shelf region was 15 J cm−2 (Figure 10a). The DBTT, calculated as the temperature corresponding to the impact energy absorption halfway between the upper and lower shelf energies, was about 70 °C. Therefore, this material condition is tough at ambient temperature, only.
The TMP led to an increase in Charpy V-notch impact energy at all temperatures, whereas the DBTT insignificantly shifted to lower temperatures. The lower shelf region was observed below 10 °C; the transition region was revealed at temperatures ranging from 10 °C to 120 °C and the upper shelf region was located above 120 °C. The value of the upper shelf energy was 270 J cm−2 (Figure 10a). The DBTT was about 65 °C (Figure 10a). At room and lower temperatures, the impact toughness comprised the relatively high value of about 40 J cm−2 for the 12% Cr martensitic steels, which is feasible for commercial application as a structural material for fossil power plants [1,2,36,37,38].
The maximum load (denoted as point PM in Figure 10b) on the load vs. deflection curves can be expressed in terms of the stress. The associated stress can be easily derived using the following relation [20,39]:
where σM is the maximum stress; S is the span (=40 mm); P is the maximum load; W is the specimen width (=10 mm); B is the specimen thickness (=10 mm); a is the notch depth (=2 mm); Cf is the constraint factor, which depends on the configuration of the instrumented tup: Cf = 1.363 for ASTM tup; and β is a constant depending on the yielding criterion, with β = 2 for the Tresca criterion. The area under the load-deflection curves represented in Figure 10b up to maximal point, PM, represents the fracture initiation energy, Ei, while the remaining area represents the fracture propagation energy, Ep. The calculated values for Ei and Ep are listed in Table 4.
Table 4.
Dynamic parameters calculated from the load vs. deflection curves.
At all testing temperatures, the maximum stresses after TMP were higher than those after the CHT regimen (Table 4). However, in the temperature interval from −20 °C to 25 °C, the increment in the maximum stresses after TMP exceeded 20%, whereas at elevated temperatures above 40 °C, the increment in the maximum stresses was about 10% (Table 4). At 40 °C, the maximum stresses were the highest for both the CHT and TMP regimens and comprised 1059 and 1151 MPa, respectively (Table 4). It is known [4,17] that the yield stress and, therefore, the maximum stress is dependent on a dispersion of matrix MX carbonitrides and boundary M23C6 carbides. The increased stress after TMP is attributed to the precipitation of V-rich MX carbonitrides, since the dimensions of M23C6 carbides increase slightly due to the TMP (Table 3).
In the low-temperature range from −20 °C to 25 °C, the fracture initiation energy, Ei, and the fracture propagation energy, Ep, had low values for both CHT and TMP (Figure 10b, Table 4). The Ei value increased in the low shelf region with increasing temperature, only, while Ep increased over the whole temperature interval. The TMP increased the values of Ei and Ep by a factor of 3 for the temperature range from −20 °C to 10 °C (Table 4). This leads to a strong increase in the initiation energy. At room temperature, the value of Ei after TMP was three times higher than that after the CHT, whereas the values of Ep after CHT and TMP were nearly the same (Figure 10b, Table 4). As a result, the load-deflection curves at 25 °C for the CHT and TMP had a strong difference (Figure 10b). After CHT, the load-deflection curve was typical for brittle fracture having the sharp maximum peak, whereas after TMP, the load-deflection curve had a pronounced plateau, attributed to microcrack growth up to the critical dimension in a ductile manner [37] (Figure 10b). Higher values of Ei attest to the fact that the fracture initiates after significant plastic strain in the notch region, whereas the similar values of Ep indicate the similar manner of the development of unstable crack propagation in two material conditions.
At T ≥ 70 °C/DBTT, the load-deflection curves were nearly the same after two processing routes (Figure 10b). The characteristic points of the general yield load (PGY), maximum load (PM), fast fracture load (PF), and arrest load (PA) [19] could be distinguished (Figure 10b). The TMP shifted these points to a higher load and a larger deflection of pendulum. At 120 °C, no unstable crack propagation was observed, and the displacement of pendulum was larger than the thickness of Charpy V-notch specimen. TMP shifted the PGY, PM and PA points to a higher load (Figure 10b).
For temperatures ranging from 40 °C to 120 °C, the fracture initiation energy, Ei, retained the values of about 40 ± 5 J and about 50 ± 7 J after CHT and TMP, respectively (Table 4). This indicates that energy, which is required for crack initiation, is independent of the heat treatment and microstructure of the present 12% Cr steel. On the other hand, the fracture propagation energy, Ep, after TMP was significantly higher than that after the CHT regimen which is accompanied by the transition from unstable to stable crack propagation (Table 4, Figure 10b). This fact is in accordance with higher values of the maximum stresses after TMP (Table 4).
3.5. Fractography
SEM images of the fracture surfaces of Charpy impact samples of the present 12% Cr steel after the CHT and TMP regimens are shown in Figure 11 and Figure 12.

Figure 11.
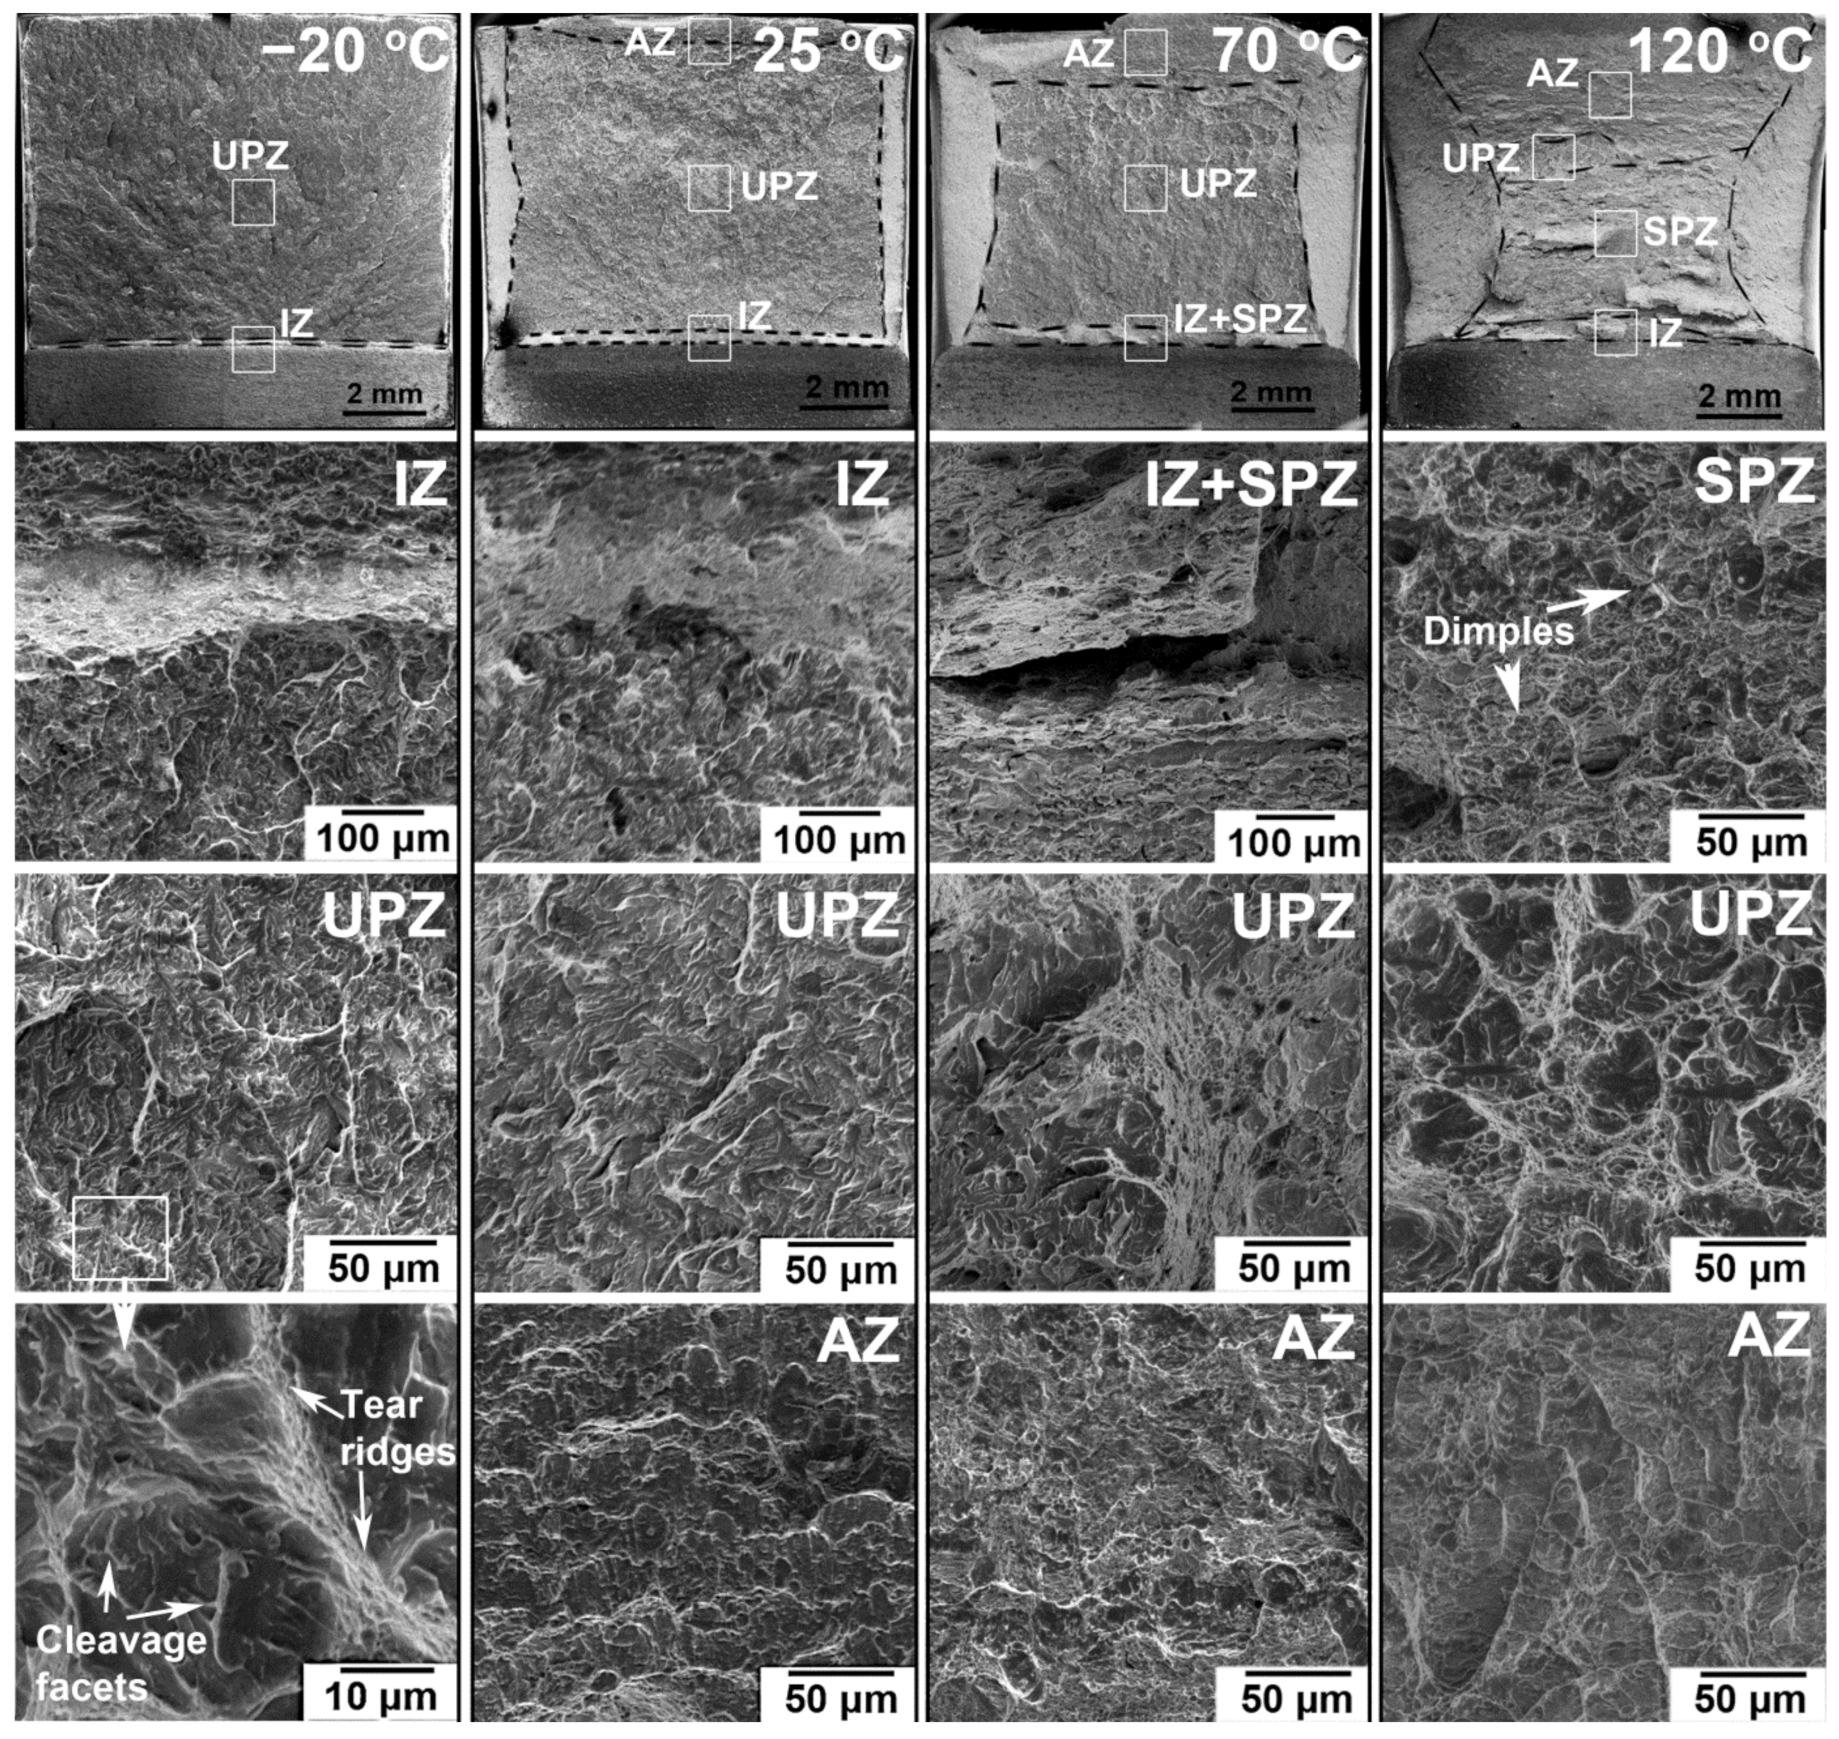
Fractography of the 12% Cr steel samples subjected to the CHT and the following impact tests at −20 °C, 25 °C, 70 °C, and 120 °C.

Figure 12.
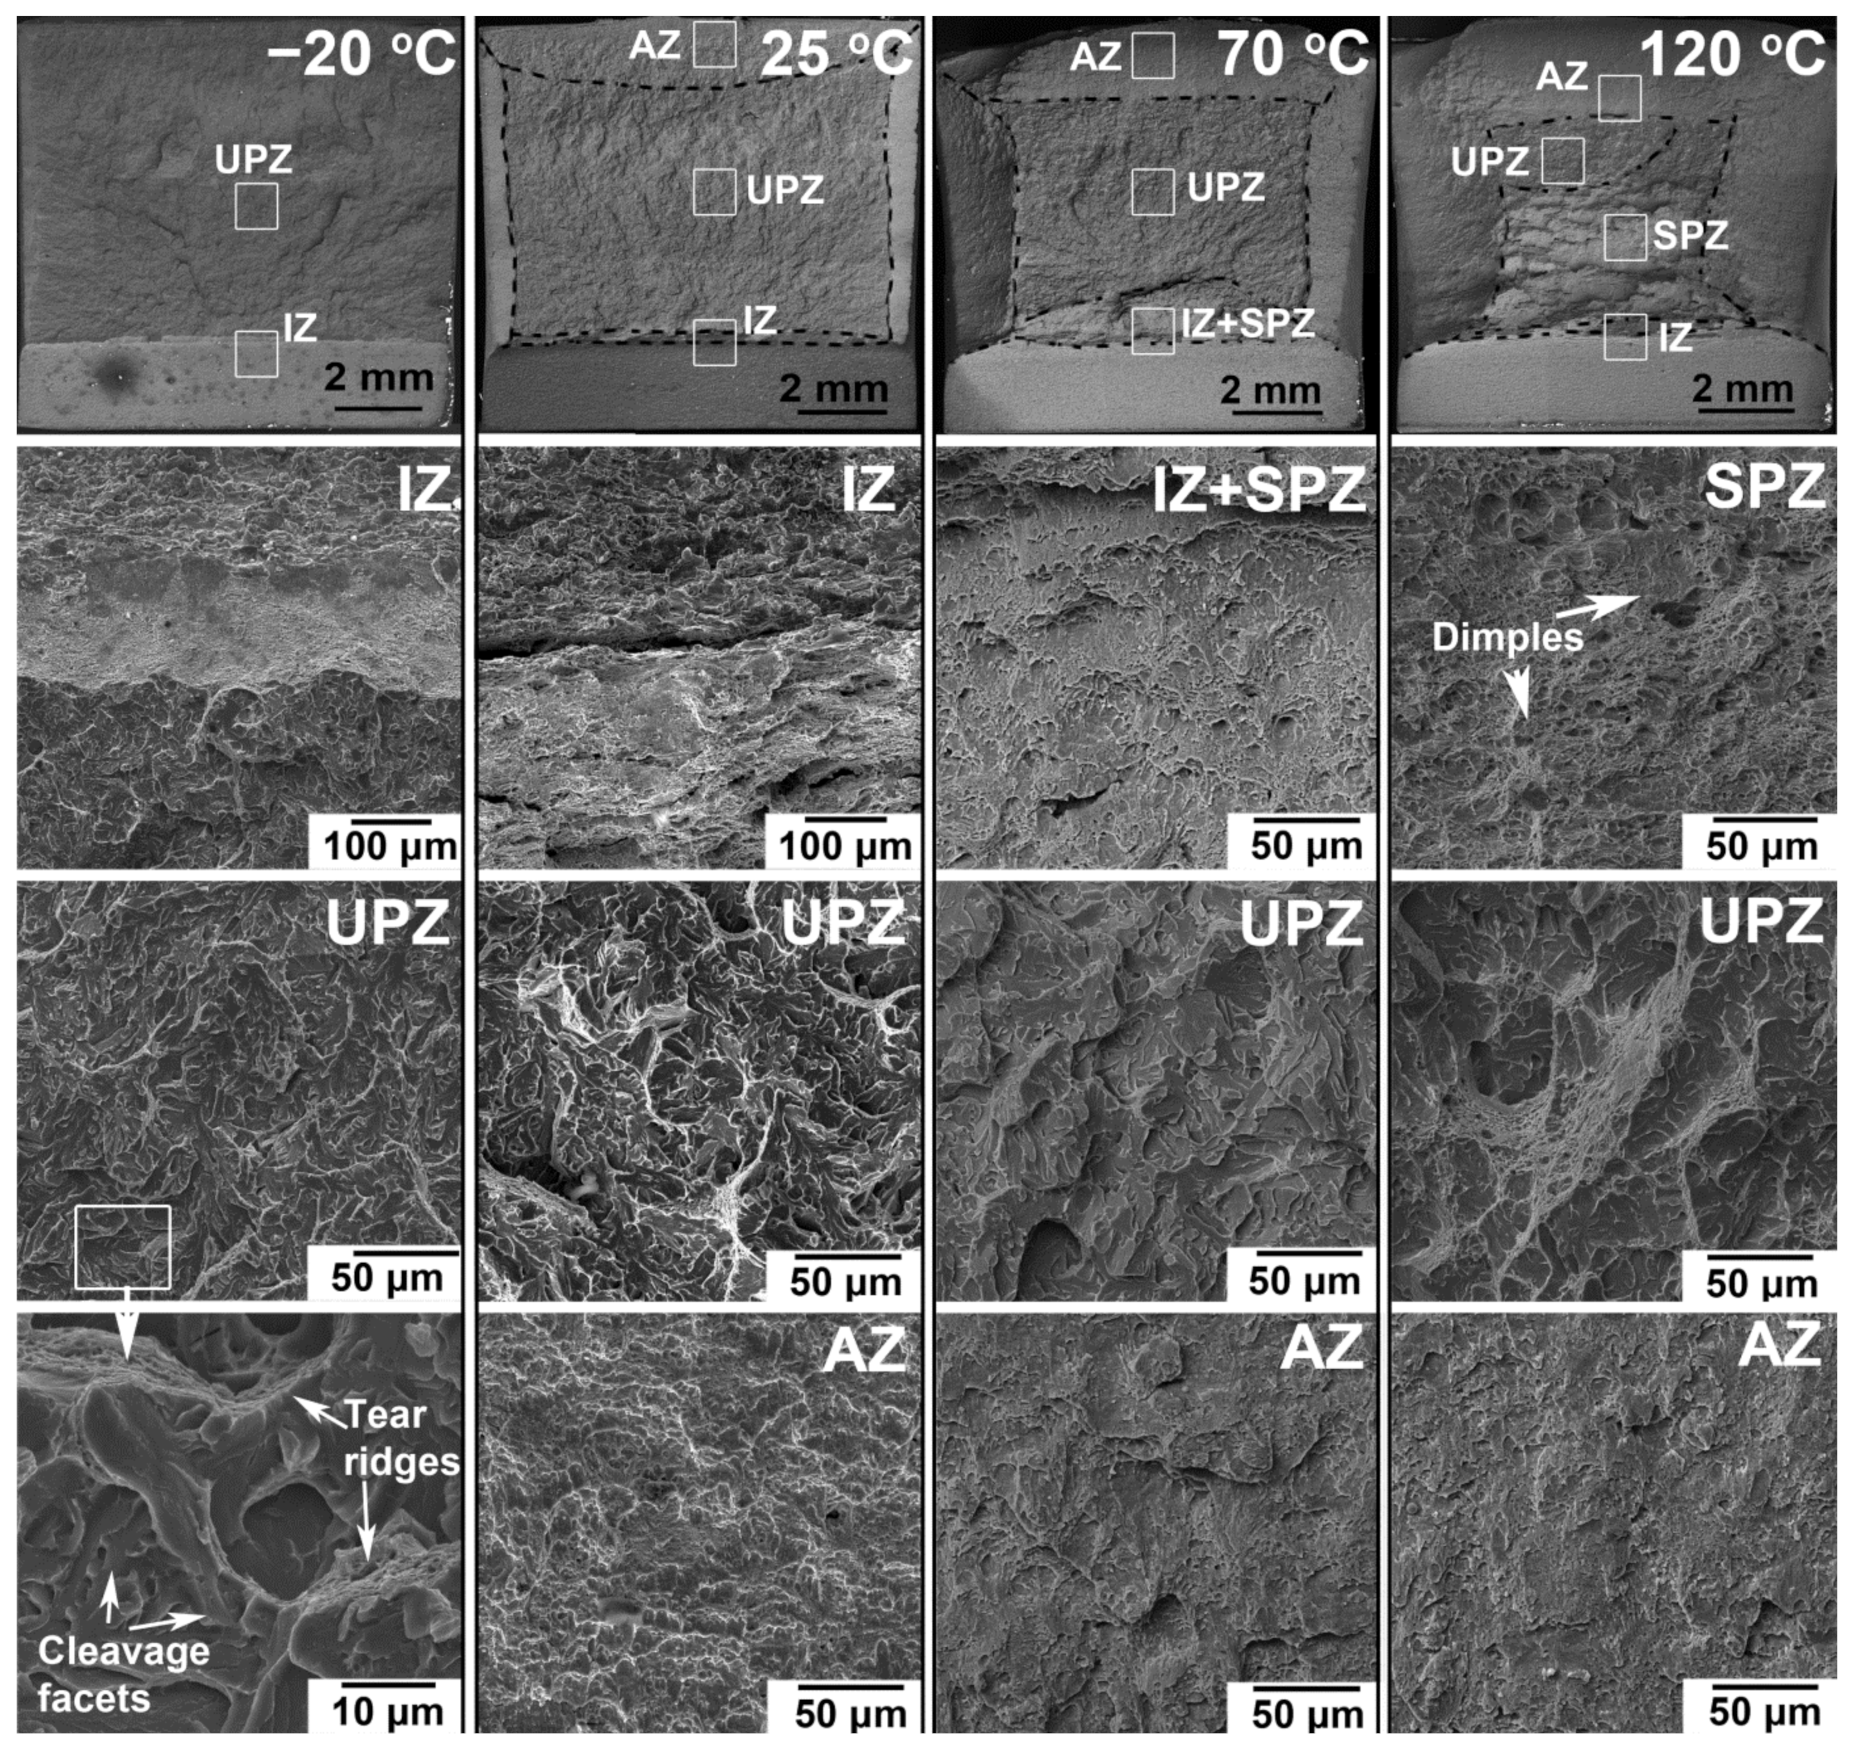
Fractography of the 12% Cr steel samples subjected to the TMP and the following impact tests at −20 °C, 25 °C, 70 °C, and 120 °C.
The dimensions of the fracture zones and percentages of the shear fracture area are listed in Table 5. Fractography observations are in agreement with the data obtained from an instrumented Charpy V-notch test. For the lower shelf region below 25 °C for CHT and below 10 °C for TMP, unstable crack propagation in a brittle manner occurred by the quasi-cleavage mechanism [19,20] (Figure 11 and Figure 12). No dimples could be observed on tear ridges. The 110 μm to 150 μm crack initiation zone was revealed and the zone of unstable crack propagation (UPZ) comprised 94–95% of all area of tested samples at −20 °C after both CHT and TMP (Table 5). At 25 °C, tear ridges exhibiting dimples and the shear-lip zone of arrested crack propagation (AZ) appeared, which led to an increase in the shear fracture up to 20–26% (Figure 11 and Figure 12, Table 5).
Table 5.
The sizes of the fracture zones and percentages of the shear fracture area.
At temperatures higher than 70 °C, the crack initiation zone (IZ), the zone of stable propagation (SPZ), where cracks extended in a ductile manner, the zone of unstable propagation (UPZ), where cracks extended in a brittle manner, and the AZ could be clearly distinguished in all material conditions (Figure 11 and Figure 12). At T ≥ DBTT, increasing temperature expanded the IZ and AZ (Table 5). The UPZ tended to be replaced by the SPZ, leading to an increase in the shear fracture above 50% (Table 5). The SPZ of the steel subjected to TMP consisted of fine dimples and cleavage facets (Figure 12). The proportion of dimples increased with increasing temperature. Only cleavage facets in the UPZ of this sample were revealed (Figure 12). At 120 °C, areas of dimple transgranular fracture attained ~90%. A portion of the UPZ with quasi-cleavage fracture was retained (Figure 11 and Figure 12, Table 5). Thus, at the upper shelf region, 90 to 99% of ductile fracture resulting from the coalescence of microvoids was revealed after both CHT and TMP (Figure 11 and Figure 12). The UPZ tended to disappear with increasing temperature.
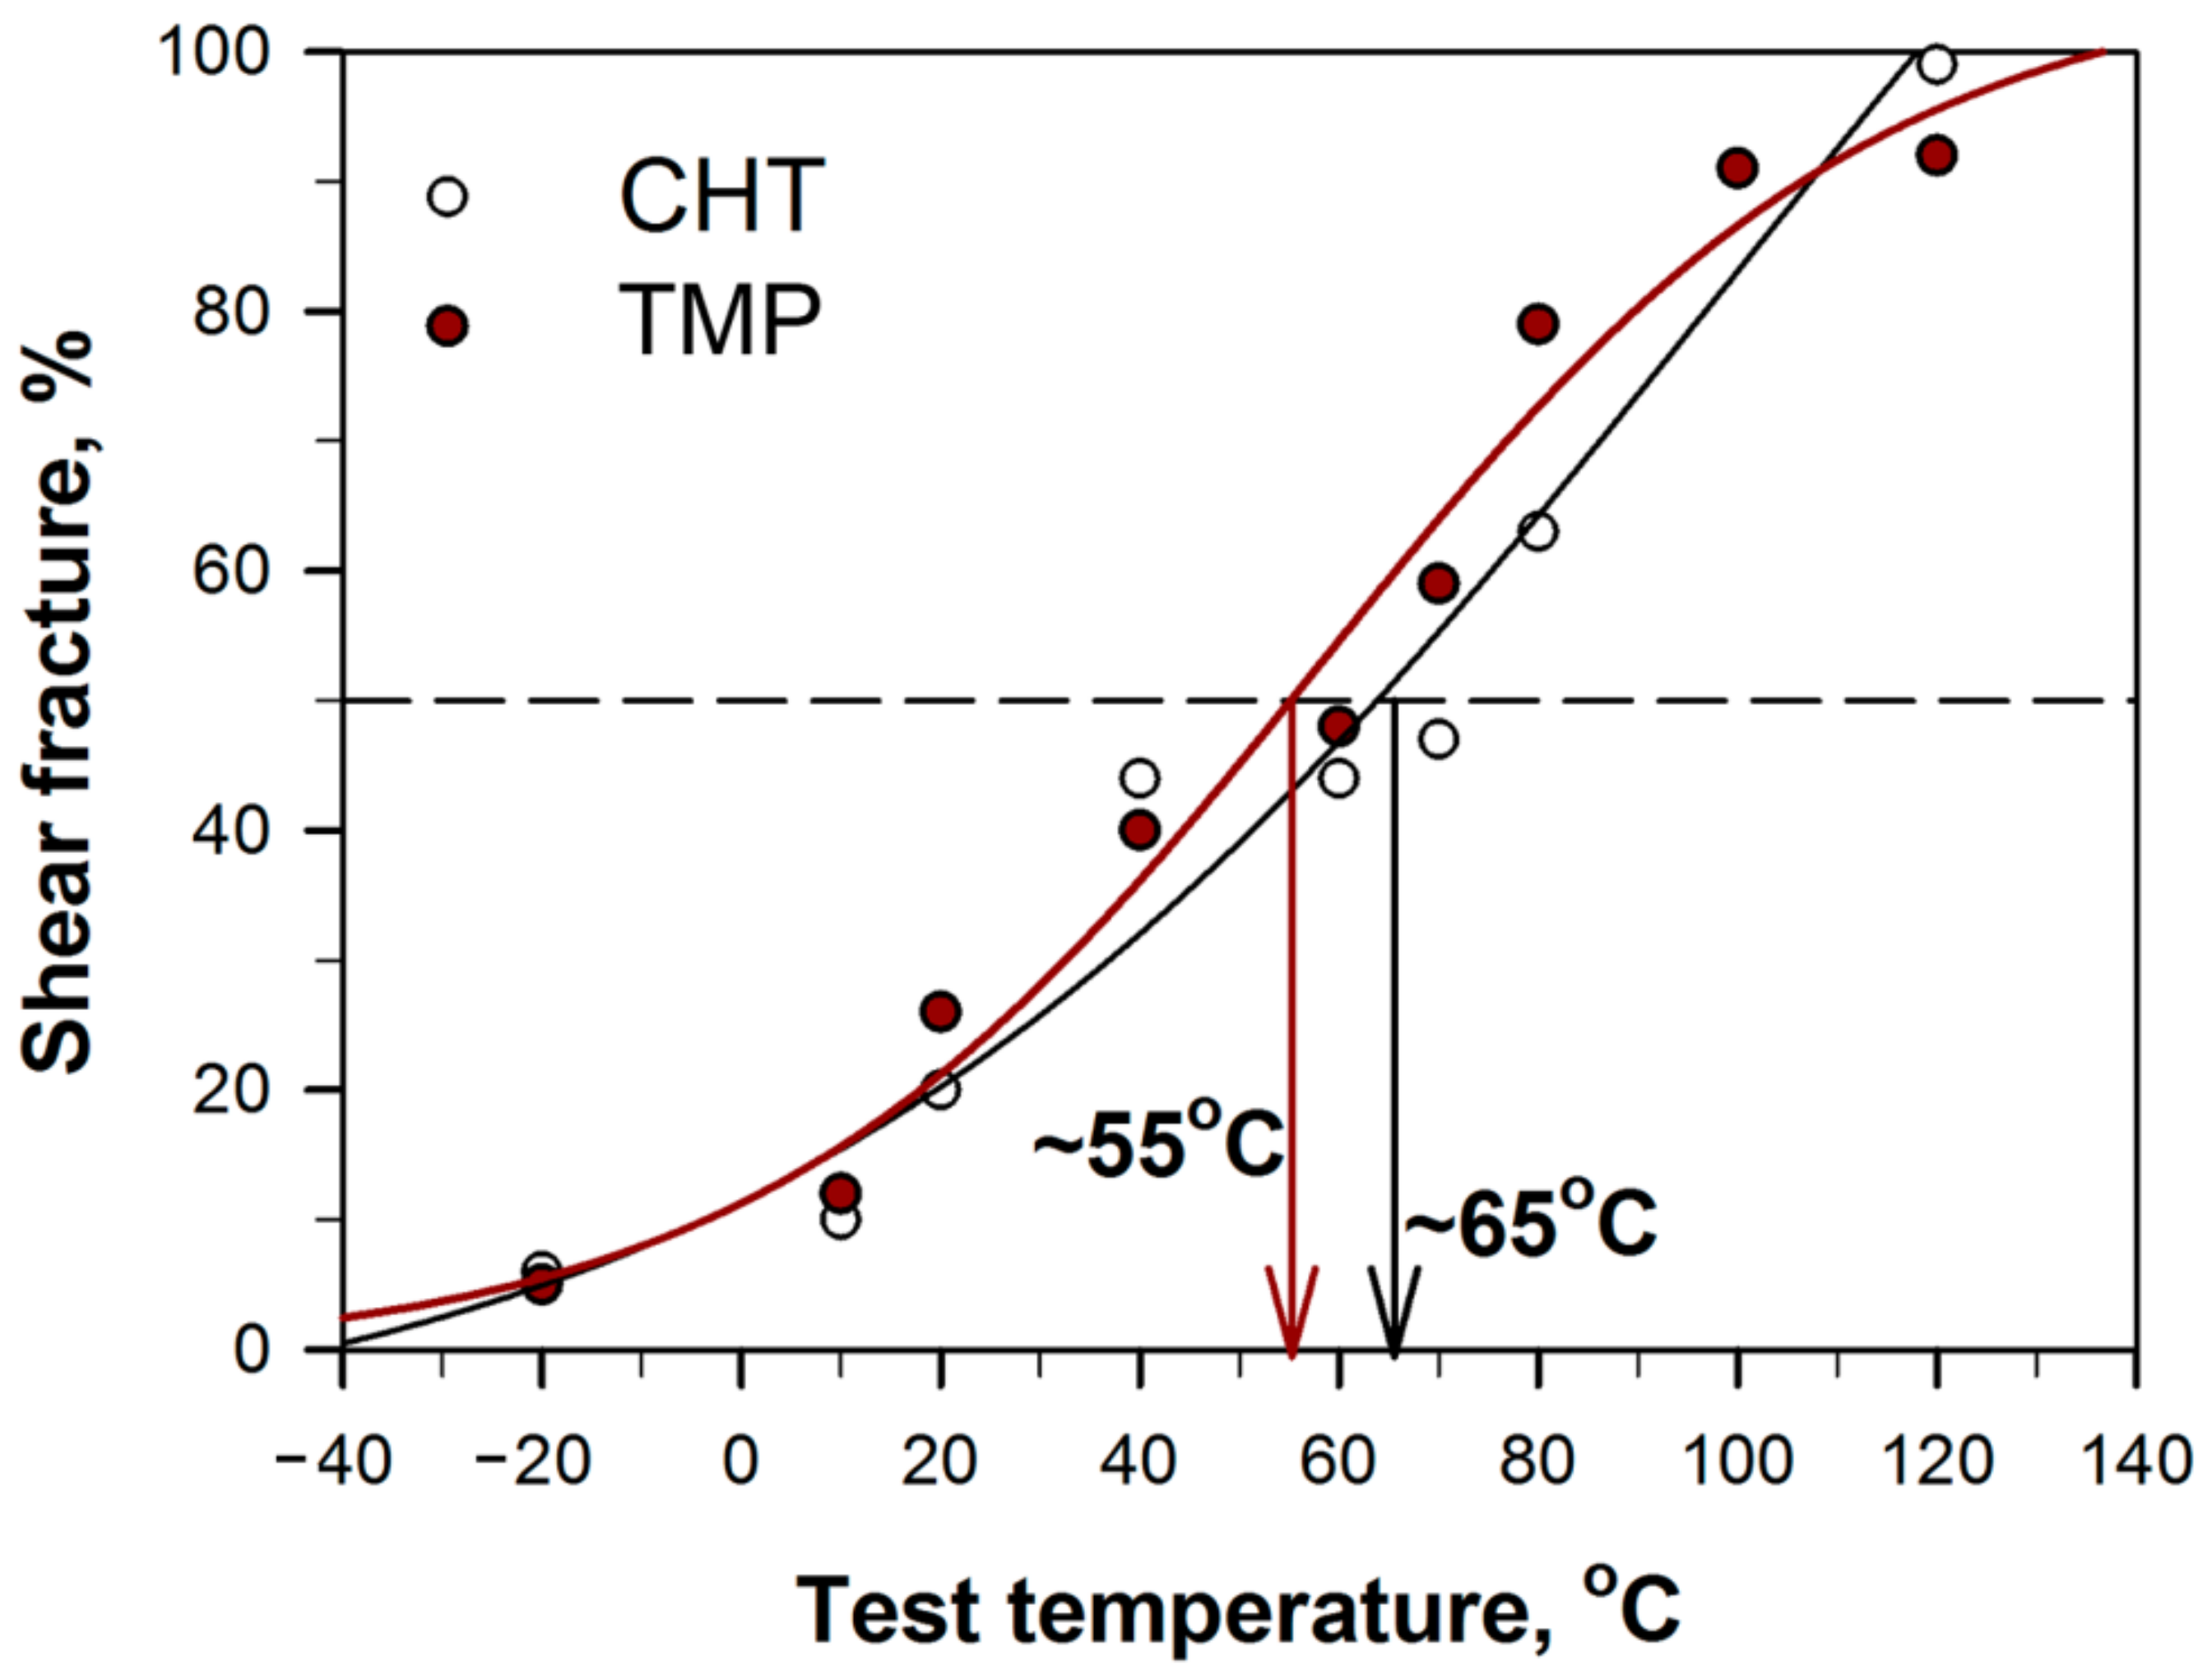
Figure 13 shows that the fracture appearance transition temperature (FATT) corresponding to the equal fractions of the brittle and ductile fracture surfaces [36] was similar with the DBTT after both the CHT and TMP regimens.
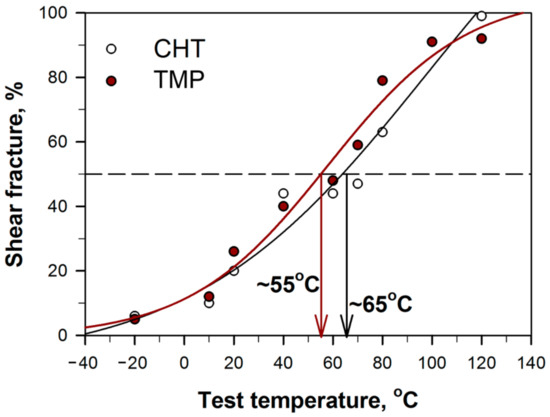
Figure 13.
Temperature dependence of the shear fracture in the present 12% Cr steel.
The FATT comprised ~65 °C and ~55 °C after the CHT and TMP routes, respectively (Figure 13). Thus, the TMP ceases brittle fracture and promotes ductile ones increasing the Charpy V-notch energy adsorbed at all temperatures. The DBTT decreases slightly, but the low shelf energy is high enough at T ≥ −20 °C.
4. Discussion
The inspection of microstructural characterization together with mechanical properties reveals that TMP significantly increases the Charpy energy at all test temperatures because of the reduced volume fraction and dimension of δ-ferrite by factors of ~3 and ~10, respectively, as well as the precipitation of the high fraction of the fine V-rich MX phase (Figure 7b and Figure 9, Table 3). In [11], it was mentioned that excess δ-ferrite is formed as a result of solid-phase transformation after solidification, and the δ-ferrite grains originate from the incomplete transformation of dendritic/cellular structure into austenite. In the present steel, the slow diffusion of excess of W, Ta and Nb atoms (Table 2) from δ-ferrite to austenite controls the transformation of δ-ferrite into austenite. The formation of the α/α boundaries provides the grain boundary diffusion path for these substitutional elements that accelerates the δ-ferrite → austenite + (Ta,Nb)(C,N) transformation. The precipitation of relatively coarse (Ta,Nb)(C,N) carbonitrides leads to depletion of these ferrite stabilizers from δ-ferrite which induces its transformation into austenite due to diffusion of interstitial solutes. As a result, the hot plastic deformation inducing the formation of the high-angle boundaries in δ-ferrite grains may accelerate this process. No evidence for the relationship between coarse (Ta,Nb)(C,N) carbonitrides and fracture toughness was found. At the same time, no precipitation of W-rich particles occurs and no depletion of W from δ-ferrite takes place, due to diffusion of W to austenite with a very low driving force.
Borisova et al. [19] concluded that the embrittlement of 12% Cr steels in the tempered condition is caused by the high M23C6 carbide density in packets, blocks, PAGs, and δ-ferrite boundaries. They obtained a DBTT of 40 °C for 12% Cr steel with a M23C6 carbide density of 0.85 μm−1 and the amount of δ-ferrite of 3.8% [19]. The increased amount of δ-ferrite of 10% and higher M23C6 carbide density of 2.5 μm−1 in the present 12% Cr steel subjected to CHT causes deterioration of the impact toughness and increases the DBTT to 70 °C. TMP leads to a decrease in the fraction of δ-ferrite to 3.8%, the same as in [19], but the particle density of M23C6 carbides remains relatively high (1.8 μm−1). As a result, the Charpy energies increase at all temperatures (Figure 10a). The increase in the DBTT is insignificant. Thus, M23C6 carbides along the boundaries of the TMLS as the embrittlement agents determine the DBTT, and the similar characteristics of this phase will provide similar values of the DBTT.
The δ-ferrite is a relatively soft phase due to its low carbon content and should increase the impact toughness and plasticity of steels [10,19,30]. However, the formation of almost continuous chains of carbides on the interfaces between the TMLS/δ-ferrite facilitates the formation of voids [19,23,24,25]. The δ-ferrite deteriorated by chains of boundary carbides plays the role of an embrittlement agent in 12% Cr steels containing 0.1% C [15,19,30,40]. An embrittlement at the low shelf of DBT in these steels is attributed to the promotion of crack propagation by the microvoids evolved on the semicontinuous or continuous chains of the boundary particles [19]. An increase in density of the boundary particles and the transition from the semicontinuous chains to continuous one causes embrittlement at low temperatures [19]. The boundary particles serve as effective barriers to the transmission of plastic deformation from δ-ferrite to the structural elements of the TMLS; hence the stress relaxation occurs by the nucleation of micro-cracks at the particle/matrix interface [19]. These agents restrict the plastic deformation during the stable crack propagation stage [19]. As a result, the onset of unstable crack propagation is attained at the small dimensions of the IZ + SPZ area [19]. TMP could not suppress the formation of carbide chains on the δ-ferrite interfaces during final tempering. However, TMP decreases the volume fraction and dimension of δ-ferrite grains that decrease the volume fraction of voids evolved on the interface carbides [19]. The reduced amount of δ-ferrite significantly increases the fracture propagation energy due to an increase in the distance between the embrittlement agents, resulting in an increased total Charpy energy (Table 4). It is apparent that the full disappearance of δ-ferrite with the continuous chains of the Cr-rich and W-rich carbides along the boundaries will have a more noticeable effect on the increase in the Charpy energy. However, the fracture initiation energy is almost independent of the amount of δ-ferrite. As a result, the dimension and number of such embrittlement agents, being continuous chains of carbides on δ-ferrite interfaces, determine the increase in fracture toughness.
The precipitation of V-rich MX carbonitrides in the ferritic matrix increases the general yield load and the maximum load stress. Superposition of these two structural factors provides a high value of the Charpy V-notch impact energy of 40 J cm−2 at the low shelf of DBT (Figure 10a). In contrast, the impact toughness is ~9 J cm−2 at T ≤ 0 °C after the CHT in the present steel and in the 12%Cr steel examined in [19]. Note that a cleavage mechanism of fracture at low temperatures was observed for both the present 12% Cr steel subjected to TMP and the steel from [19]. The energies of crack initiation and propagation for the present 12% Cr steel subjected to TMP were 4 times higher than those for the steel from [19], whereas the amount of δ-ferrite was the same in both steels. The difference between these two steels is in a dispersion of carbides and carbonitrides. V-rich MX carbonitrides in the present 12% Cr steel subjected to TMP reduce the particle number density of M23C6 carbides along the boundaries of the TMLS, which increases the Ei and Ep values (Table 3 and Table 4). Thus, the replacement of boundary carbides by matrix carbonitrides increases the Charpy V-notch impact energy at the low shelf of DBT. This conclusion is supported by work [41] reporting the beneficial effect of nanoscale (Nb,Ti,Mo)C precipitates on impact toughness at low temperatures.
5. Conclusions
The effect of thermo-mechanical processing on the structure and impact toughness of Co-modified 12% Cr steel with Cu and Ta doping and a low content of nitrogen and a high content of boron was studied. The main results can be summarized as follows:
- The thermo-mechanical processing, including several steps of annealing with following forging at 1200 °C and 1050 °C, normalizing at 1000 °C for 24 h and final tempering at 770 °C for 3 h, provides a lower amount of δ-ferrite (3.8% instead of 10%), a decreased number particle density of M23C6 carbides along the boundaries of the martensitic structure, and the precipitation of large numbers of nanoscale V-rich MX carbonitrides as compared with the conventional heat treatment.
- The thermo-mechanical processing positively affects impact toughness: it shifts the entire Charpy energy curve to higher values by 30–50 J cm−2, including the lower and upper shelf energies, while the DBTT decreases slightly from 70 to 65 °C and the FATT decreases from 65 to 55 °C, as compared with the conventional heat treatment.
- At lower temperatures (−20 °C to 25 °C) of impact test, the Charpy energy of the 12% Cr steel subjected to the thermo-mechanical processing comprises 40 J cm−2.
Author Contributions
A.F. and R.K. formulated the original problem, designed the study, provided direction, guidance and interpretation of data, developed the methodology and wrote the manuscript. A.F. and I.N. performed the experiment, collected data and assisted with data analysis. N.D. and J.H. assisted with data analysis. All authors have read and agreed to the published version of the manuscript.
Funding
This study was financially supported by the Ministry of Science and Higher Education of the Russian Federation, Grant No. 13.2251.21.0074 (agreement No. in SIIS “Electronic budget” 075-15-2021-984).
Institutional Review Board Statement
Not applicable.
Informed Consent Statement
Not applicable.
Data Availability Statement
The data presented in this study are available on request from the corresponding author. The data are not publicly available because the data also forms part of an ongoing study.
Acknowledgments
The work was carried out using the equipment of the Joint Research Center of Belgorod State National Research University «Technology and Materials».
Conflicts of Interest
The authors declare no conflict of interest.
References
- Di Gianfrancesco, A. (Ed.) Materials for Ultra-Supercritical and Advanced Ultra-Supercritical Power Plants; Woodhead Publishing: Sawston, UK, 2017; p. 845. [Google Scholar]
- Abe, F.; Kern, T.-U.; Viswanathan, R. Creep-Resistant Steels; Woodhead Publishing: Cambridge, MA, USA, 2008; p. 678. [Google Scholar]
- Abe, F. Precipitate design for creep strengthening of 9%Cr tempered martensitic steel for ultra-supercritical power plants. Sci. Techn. Adv. Mater. 2008, 9, 013002. [Google Scholar] [CrossRef] [PubMed] [Green Version]
- Maruyama, K.; Sawada, K.; Koike, J. Strengthening mechanisms of creep resistant tempered martensitic steel. ISIJ Int. 2001, 41, 641–653. [Google Scholar] [CrossRef]
- Knezevic, V.; Balun, J.; Sauthoff, G.; Inden, G.; Schneider, A. Design of martensitic/ferritic heat-resistant steels for application at 923 K with supporting thermodynamic modeling. Mater. Sci. Eng. A 2008, 477, 334–343. [Google Scholar] [CrossRef]
- Abe, F. Progress in creep-resistant steels for high efficiency coal-fired power plants. J Press. Vess. Techn. 2016, 138, 040804. [Google Scholar] [CrossRef]
- Kaibyshev, R.; Mishnev, R.; Fedoseeva, A.; Dudova, N. The role of microstructure in creep strength of 9–12%Cr steels. Mater. Sci. Forum 2016, 879, 36–41. [Google Scholar] [CrossRef]
- Fedoseeva, A.; Nikitin, I.; Dudova, N.; Kaibyshev, R. On effect of rhenium on mechanical properties of a high-Cr creep resistant steel. Mater. Lett. 2019, 269, 81–84. [Google Scholar] [CrossRef]
- Barrett, R.; O’Donoghue, P.; Leen, S. A physically-based high temperature yield strength model for 9Cr steels. Mater. Sci. Eng. A 2018, 730, 410–424. [Google Scholar] [CrossRef]
- Wang, P.; Lu, S.P.; Xiao, N.M.; Li, D.Z.; Li, Y.Y. Effect of delta ferrite on impact properties of low carbon 13Cr–4Ni martensitic stainless steel. Mater. Sci. Eng. A 2010, 527, 3210–3216. [Google Scholar] [CrossRef]
- Niessen, F.; Tiedje, N.; Hald, J. Kinetics modeling of delta-ferrite formation and retainment during casting of supermartensitic stainless steel. Mater. Des. 2017, 118, 138–145. [Google Scholar] [CrossRef] [Green Version]
- Hald, J. Microstructure and long-term creep properties of 9–12% Cr steels. Int. J. Press. Vessels Pip. 2008, 85, 30–37. [Google Scholar] [CrossRef]
- Danielsen, H.K.; Di Nunzio, P.E.; Hald, J. Kinetics of Z-phase precipitation in 9 to 12 pct Cr steels. Metall. Mater. Trans. A 2013, 44, 2445–2452. [Google Scholar] [CrossRef] [Green Version]
- Fedoseeva, A.; Nikitin, I.; Dudova, N.; Kaibyshev, R. Strain-induced Z-phase formation in a 9% Cr-3% Co martensitic steel during creep at elevated temperature. Mater. Sci. Eng. A 2018, 724, 29–36. [Google Scholar] [CrossRef]
- Anderko, K.; Schäfer, L.; Materna-Morris, E. Effect of the delta-ferrite phase on the impact properties of martensitic chromium steels. J. Nucl. Mater. 1991, 179–181, 492–495. [Google Scholar] [CrossRef]
- Fedoseeva, A.; Nikitin, I.; Dudova, N.; Kaibyshev, R. Analysis of mechanical properties of heat resistant Co-modified 12%Cr and 9%Cr steels. Phys. Met. Metallogr. 2020, 121, 1233–1239. [Google Scholar] [CrossRef]
- Nikitin, I.; Fedoseeva, A.; Kaibyshev, R. Strengthening Mechanisms of creep-Resistant 12%Cr-3%Co steel with low N and high B contents. J. Mater. Sci. 2020, 55, 7530–7545. [Google Scholar] [CrossRef]
- Dudko, V.; Fedoseeva, A.; Kaibyshev, R. Ductile-Brittle transition in a 9% Cr heat-resistant steel. Mater. Sci. Eng. A 2017, 682, 73–84. [Google Scholar] [CrossRef]
- Borisova, J.; Dudko, V.; Mishnev, R.; Kaibyshev, R. Effect of Laves Phase on Ductile-Brittle Transition of 12 Pct Cr Steel. Metall. Mater. Trans. A 2019, 50, 3528–3543. [Google Scholar] [CrossRef]
- Fedoseeva, A.; Dudova, N.; Kaibyshev, R. Role of Tungsten in the Tempered Martensite Embrittlement of a Modified 9%Cr Steel. Metall. Mater. Trans. A 2017, 48, 982–998. [Google Scholar] [CrossRef]
- Odnobokova, M.V.; Kipelova, A.Y.; Belyakov, A.N.; Kaibyshev, R.O. Mechanical behavior and brittle–ductile transition of high-chromium martensitic steel. Phys. Met. Metallogr. 2016, 117, 390–398. [Google Scholar] [CrossRef]
- Chatterjee, A.; Chakrabarti, D.; Moitra, A.; Mitra, R.; Bhaduri, A. Effect of normalization temperatures on ductile–brittle transition temperature of a modified 9Cr–1Mo steel. Mater. Sci. Eng. A. 2014, 618, 219–231. [Google Scholar] [CrossRef]
- Cui, C.; Gao, X.; Su, G.; Gao, C.; Liu, Z.; Misra, R.D.K. Effect of thermal treatment on the evolution of delta ferrite in 11Cr–3Co–2.3W steel. Mater. Sci. Technol. 2018, 34, 2087–2096. [Google Scholar] [CrossRef]
- Liu, Y.; Sun, J.; Li, J.; Jiang, B.; Zhang, C. Investigation of forging process for eliminating delta ferrites in USC unites last stage blades steel 10Cr12Ni3Mo2VN. Procedia Eng. 2017, 207, 1797–1802. [Google Scholar] [CrossRef]
- Li, J.; Cheng, L.; Zhang, P.; Wang, L.; Li, H. Effect of delta ferrites on the anisotropy of impact toughness in martensitic heat-resistant steel. J. Mater. Res. Technol. 2019, 8, 1781–1788. [Google Scholar] [CrossRef]
- Pandey, C.; Mahapatra, M.; Kumar, P.; Saini, N.; Thakare, J.; Vidyathy, R.S.; Narang, H.K. A brief study on δ-ferrite evolution in dissimilar P91 and P92 steel weld joint and their effect on mechanical properties. Arch. Civ. Mech. Eng. 2018, 18, 713–722. [Google Scholar] [CrossRef]
- Bashu, S.A.; Singh, K.; Rawat, M.S. Effect of heat treatment on mechanical properties and fracture behaviour of a 12CrMoV steel. Mater. Sci. Eng. A 1990, 127, 7–15. [Google Scholar] [CrossRef]
- Carrouge, D.; Bhadeshia, H.K.D.H.; Woollin, P. Effect of δ-ferrite on impact properties of supermartensitic stainless steel heat affected. Sci. Technol. Weld. Join. 2004, 9, 377–389. [Google Scholar] [CrossRef]
- Alkan, G.; Chae, D.; Kim, S.-J. Effect of δ ferrite on impact property of hot-rolled 12Cr–Ni steel. Mater. Sci. Eng. A 2013, 585, 39–46. [Google Scholar] [CrossRef]
- Schäfer, L. Influence of delta ferrite and dendritic carbides on the impact and tensile properties of a martensitic chromium steel. J. Nucl. Mater. 1998, 262, 1336–1339. [Google Scholar] [CrossRef]
- Fedoseeva, A.E.; Nikitin, I.S.; Fedoseev, A.E.; Tkachev, E.S.; Kaibyshev, R.O. Effect of tantalum on short-term creep of a 12%Cr-3%Co-0.07%Ta martensitic steel for steam blades. In IOP Conference Series: Materials Science and Engineering; IOP Publishing: Bristol, UK, 2020; Volume 848, p. 012020. [Google Scholar] [CrossRef]
- Tkachev, E.; Belyakov, A. Effect of heat treatment on microstructure and mechanical properties of an advanced Ta-alloyed 9%Cr steel. In Joint EPRI-123HiMAT International Conference on Advances in High-Temperature Materials; ASM International: New York, NY, USA, 2019; pp. 116–122. [Google Scholar]
- Zherebtsov, S.; Murzinova, M.; Salishchev, G.; Semiatin, S.L. Spheroidization of the lamellar microstructure in Ti–6Al–4V alloy during warm deformation and annealing. Acta Mater. 2011, 59, 4138–4150. [Google Scholar] [CrossRef]
- Humphreys, F.J.M. Hatherly, Recrystallization, Related Annealing Phenomena, 2nd ed.; Elsevier: Oxford, UK, 2004; p. 658. [Google Scholar]
- Fedoseeva, A.; Nikitin, I.; Tkachev, E.; Mishnev, R.; Dudova, N.; Kaibyshev, R. Effect of alloying on the nucleation and growth of Laves phase in the 9–10%Cr-3%Co martensitic steels during creep. Metals 2021, 11, 60. [Google Scholar] [CrossRef]
- Bergquist, E.-L. Consumable and Welding Modified 9Cr-1Mo Steel. Svetsaren 1999, 54, 22–25. [Google Scholar]
- ASM. Handbook: Mechanical Testing and Evaluation 8; ASM International: New York, NY, USA, 2000; p. 2235. [Google Scholar]
- ASTM. E 23-12c: Standards; ASTM: West Conshohocken, PA, USA, 2013; Volume I, pp. 1–25. [Google Scholar]
- Chaouadi, R.; Fabry, A. On the utilization of the instrumented Charpy impact test for characterizing the flow and fracture behavior of reactor pressure vessel steels. Eur. Struct. Integr. Soc. 2002, 30, 103–117. [Google Scholar] [CrossRef]
- Harrelson, K.J.; Rou, S.H.; Wilcox, R.C. Impurity element effects on the toughness of 9Cr-1Mo steel. J. Nucl. Mater. 1986, 141–143, 508–512. [Google Scholar] [CrossRef]
- Hu, J.; Liu, K.; Ma, L.; Misra, R.D.K.; Zhang, W.; Du, H.; Xu, W. Significant Improvement in Strength and Toughness of Nanoscale Precipitate–Strengthened Steel by Direct Quenching and Tempering Process. Steel Res. Int. 2021, 92, 2000331. [Google Scholar] [CrossRef]


Publisher’s Note: MDPI stays neutral with regard to jurisdictional claims in published maps and institutional affiliations. |
© 2021 by the authors. Licensee MDPI, Basel, Switzerland. This article is an open access article distributed under the terms and conditions of the Creative Commons Attribution (CC BY) license (https://creativecommons.org/licenses/by/4.0/).