Simple Summary
Global warming caused by the increase in atmospheric CO2 concentration is becoming a major environmental issue. Lipaphis erysimi is one of the most damaging pests of cruciferous crops worldwide, and L. erysimi has strong adaptability to the environment and reproductive capacity. The age-stage, two-sex life table is currently used by many researchers in place of the traditional age-specific life table, providing many details such as fitness and potential damage. In this study, the individual fitness and population dynamics parameters of three successive generations of L. erysimi were analyzed using the age-stage, two-sex life table. The results show that a high CO2 concentration had a cumulative effect on the survival rate and fecundity of L. erysimi, and elevated CO2 had a negative effect on the individual fitness parameters of L. erysimi. The life expectancy (exj) is significantly lower in elevated CO2 than that in ambient CO2 treatment in the three successive generations, indicating that L. erysimi was more sensitive to CO2 concentration and the life of L. erysimi was shortened under elevated CO2. Additionally, we can find that elevated CO2 has a short-term effect on the population parameters, including the intrinsic rate of increase (r) and finite rate of increase (λ) in L. erysimi. Through the data from this experiment, we believe that the individual and population fitness of L. erysimi will be decreased under elevated CO2, which indicates that the damage caused by L. erysimi may be reduced in the future with increasing CO2 levels.
Abstract
To assess the effect of elevated CO2 on the development, fecundity, and population dynamic parameters of L. erysimi, the age-stage, two-sex life table was used to predict the individual fitness and population parameters of three successive generations of L. erysimi in this study. The results show that a significantly longer total pre-adult stage before oviposition (TPOP) was observed in the third generation compared with the first generation of L. erysimi under the 800 μL/L CO2 treatment. The fecundity is significantly lower in the 800 μL/L CO2 treatment than that in the 400 μL/L CO2 treatment in the third generation of L. erysimi, which indicates that elevated CO2 had a negative effect on the individual fitness parameters of L. erysimi. Additionally, the life expectancy (exj) is significantly lower under the 800 μL/L CO2 treatment than that under the 400 μL/L CO2 treatment in the three successive generations. A significantly higher intrinsic rate of increase (r) and finite rate of increase (λ) were found in the second generation compared with those in the first and third generations of L. erysimi under the 800 μL/L CO2 treatment. Moreover, significantly lower r and λ were observed under the 800 μL/L CO2 treatment compared with those under the 400 μL/L and 600 μL/L CO2 treatments in the first generation of L. erysimi, which indicates that elevated CO2 has a short-term effect on the population parameters (r and λ) of L. erysimi. Our experiment can provide the data for the comprehensive prevention and control of L. erysimi in the future with increasing CO2 levels.
1. Introduction
The atmospheric CO2 concentration is increasing year on year due to the use of fossil fuels such as coal, farmland, and factory waste discharge, and the improper utilization of land, alongside human deforestation, especially widespread in tropical forests, causing the concentration of greenhouse gases such as CO2 to become higher and higher [1,2]. Global climate change has aroused widespread concern worldwide. NOAA (2021) reported that the atmospheric CO2 concentration has risen from 280 μL/L before the Industrial Revolution to 415 μL/L at present, with an annual growth rate of approximately 2.5 ppm in the past five years, and it is expected to reach twice the current level by the end of the 21st century [3].
Since carbon is the key element in the structure of plants, an increased CO2 concentration enables faster growth due to rapid carbon assimilation [4]. In general, elevated CO2 concentration affects foliar protein [5], leaf biomass [6], water use efficiency (WUE) [7], yield [8,9], and, in turn, the production of carbon (C)-based secondary metabolites [10,11]. After analyzing 122 studies, Robinson et al. [12] concluded that elevated CO2 increased the relative consumption rate of arthropods (+14%) but reduced the relative growth rate (−4.5%), as well as the pupal and adult weights (−5.5%). As a vital limiting factor for phytophagous arthropods, the changes in foliar secondary metabolites may have major effects on arthropod performance [13]. Most published documents reported that elevated CO2 indirectly influenced arthropod performance via the changes in plant chemical composition [13,14,15,16]. Under the condition of high CO2 concentration, the population of Sitobion avenae and Aphis gossypii increased greatly after feeding on spring wheat [17]. Wen et al. [18] found that elevated CO2 can enhance the population parameters of Nilaparvata lugens, including the intrinsic rate of increase (r), finite rate (λ), and net reproductive rate (R0). Whittaker [19] summarized more than 30 papers and found phloem sap-suckers to have a complex response to elevated CO2. For example, there was a phenomenon of positive responses of piercing–sucking insects to elevated CO2, such as higher compensation consumption and lower interspecific competition [20]. Newman et al. [21] considered that sucking pests’ responses to elevated CO2 are frequently “species-specific”, being negative, positive, or neutral.
Lipaphis erysimi (Kaltenbach) is one of the most damaging pests of cruciferous crops worldwide, particularly of vegetable Brassicae including cabbage, broccoli, collard, kale, mustard, rape, and turnip [22]. L. erysimi has strong adaptability to the environment and reproductive capacity. Adults and nymphs of L. erysimi pierce and suck the juice of host plants, leading to the loss of plant nutrients and water imbalance, which reduces the yield of crops and the nutritional value of vegetables. Honeydew secreted by L. erysimi can also cause coal stain disease, affecting the quality of products. High aphid densities distort actively growing leaves, causing them to curl, forming pockets and folds that offer shelter to the aphids, thus enabling them to escape insecticide treatments. L. erysimi is also an important vector of several different viral diseases [22].
Most published documents focused mainly on the short-term or single-generation responses of L. erysimi to CO2 enrichment [22,23,24]. However, few of these experiments examined multiple generations of this herbivorous pest with regard to their response to elevated CO2. In this study, three successive generations of L. erysimi were reared in current/ambient (400 μL/L), medially elevated (600 μL/L) and highly elevated (800 μL/L) levels of CO2 concentrations. The developmental time, survival, and fecundity of L. erysimi were analyzed using an age-stage, two-sex life table to predict the fitness and potential population damage of L. erysimi, which can provide a valuable reference for the effective integrated control of L. erysimi with the increasing atmospheric CO2 concentrations anticipated in the future.
2. Materials and Methods
2.1. Closed-Dynamics CO2 Chamber
All experiments were performed in controlled environment growth chambers (PRX-450D-30; Haishu Safe Apparatus, Ningbo, China). The growth chambers were maintained at 70 ± 10% RH, 27 ± 1 °C, and a 14L:10D photoperiod with 30,000 LX provided by thirty-nine 26 W fluorescent bulbs. Three levels of CO2 concentration were continuously applied, 400 μL/L (the current ambient CO2 concentration level), 600 μL/L (medially elevated CO2 concentration level, representing the mid-century CO2 concentration), and 800 μL/L (double the current ambient CO2 concentration level, representing the predicted level by the end of this century), respectively. The growth chambers were equipped with an automatic control system to monitor and adjust the CO2 concentration every 20 min, as described in detail in Chen et al. [25].
2.2. Host Plants and L. erysimi Stock
Seeds of Brassica pekinensis, a cabbage cultivar susceptible to L. erysimi, were planted in the field. L. erysimi were obtained from greenhouses at the Huazhong Agriculture University and reared more than 50 generations in Hubei Insect Resources Utilization and Sustainable Pest Management Key Laboratory, Wuhan, China. After the seeds sprouted, three-leaf cabbages were put into each closed-dynamics CO2 chamber for L. erysimi feeding. No chemical fertilizers or insecticides were applied throughout the period of the experiment.
2.3. L. erysimi Feeding
Under each CO2 concentration level, 60 aphids were observed in each generation. Observing them at 8:00 and 20:00 each day, the ecdysis, and survival of L. erysimi were recorded in detail until reaching adulthood. After the emergence of adults, the litter size was observed and recorded every day until all of the test insects died. The ecdysis and newly produced aphids were removed every time. If it was observed that the leaves were yellow and wilting, it was necessary to replace the leaves in time.
2.4. Life Table Analysis and Population Projection of L. erysimi
The growth rate, developmental time, and survival of L. erysimi were analyzed based on the age-stage, two-sex life table theory. After the emergence of L. erysimi adults, the fecundity of L. erysimi was calculated by counting the number of nymphs every day. All raw data of life history were analyzed by a computer program, TWOSEX-MSChart [26]. The age-stage-specific survival rate (sxj) (x = age, j = stage), the age-specific survival rate (lx), the female age-stage fecundity (f (x, female)), the age-specific fecundity (mx), age-specific maternity (lx*mx), the age-stage life expectancy (exj), the age-stage-specific reproductive value (vxj), and the population parameters (including the net reproductive rate (R0), the intrinsic rate of increase (r), the finite rate of increase (λ), and the mean generation time (T)) were calculated. The age-stage-specific survival rate (sxj) means the survival rate of L. erysimi at age x and stage j. The age-specific survival rate (lx) means the total survival rate at age x. The age-stage female fecundity (f(x, female)) represented the fecundity of females at age x, and the age-specific fecundity (mx) was the fecundity at age x. The age-stage life expectancy (exj) means that the individual would live until age x and stage j. The age-stage-specific reproductive value (vxj) was defined as the contribution of an individual of age x and stage j to the future population. All of the values above were described in detail in Chi and Liu [27] and Chi [28]. In this study, the means and standard errors of the life table parameters were estimated using the bootstrap technique with 100,000 bootstrap replicates, and the differences among three CO2 treatments were compared using the paired bootstrap test at the 5% significance level. The bootstrap technique and the paired bootstrap test are both embedded in the computer program TWOSEX-MSChart. All graphs were created by Sigmaplot 12.0 (Systat Software, SAN Jose, CA, USA).
3. Results
3.1. Life History Parameters of L. erysimi
Table 1 shows that a significantly longer TPOP of L. erysimi was found in the third generation compared with the first generation under the 800 μL/L treatment (p < 0.05). However, A significantly lower survival rate of L. erysimi was observed in the third generation compared with the first generation under the 800 μL/L treatment (p < 0.05). The fecundity of L. erysimi increased significantly in the second generation compared with the third generation under the 800 μL/L treatment (p < 0.05). A significantly higher fourth instar period of L. erysimi was found in the third generation under the 800 μL/L treatment relative to the 400 μL/L and 600 μL/L treatments (p < 0.05). Meanwhile, TPOP in the third generation of L. erysimi decreased significantly under the 600 μL/L treatment relative to 800 μL/L treatment (p < 0.05). In addition, significantly lower adult longevity and survival rate in the third generation of L. erysimi were observed for the 800 μL/L treatment relative to the 400 μL/L and 600 μL/L treatments (p < 0.05) (Table 1).

Table 1.
Life history parameters of three successive generations of L. erysimi under three CO2 treatments (mean ± SE).
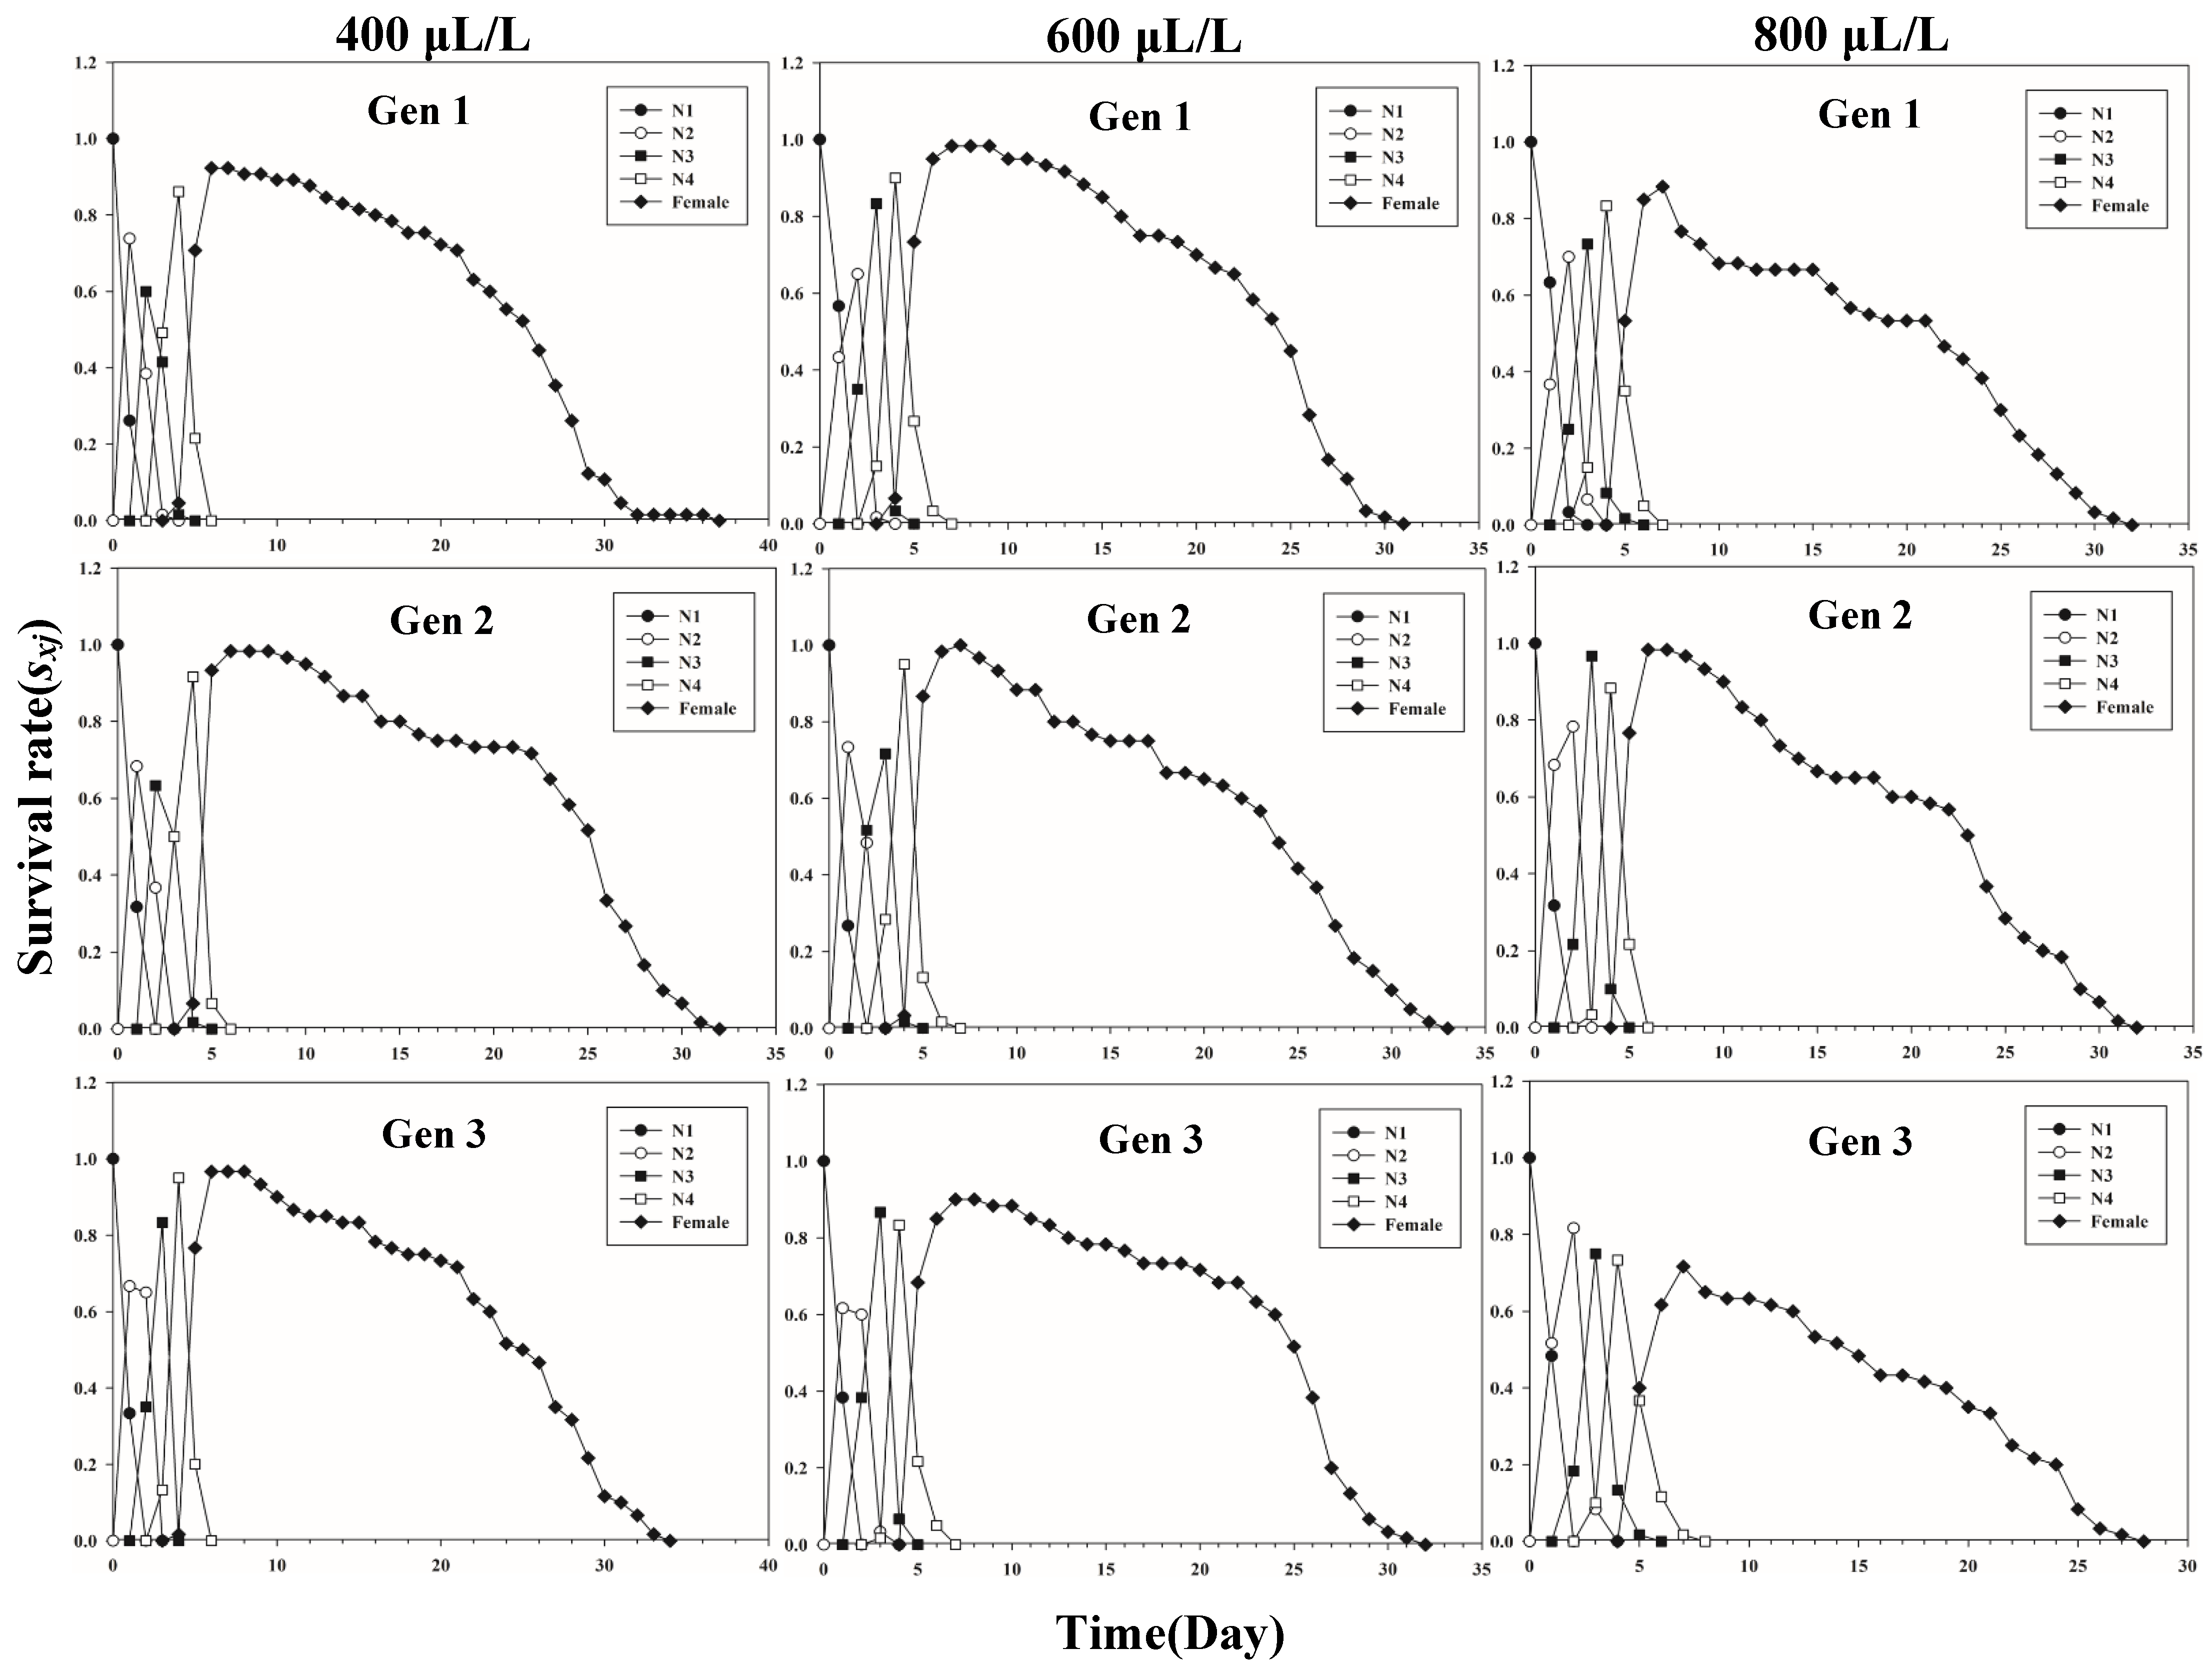
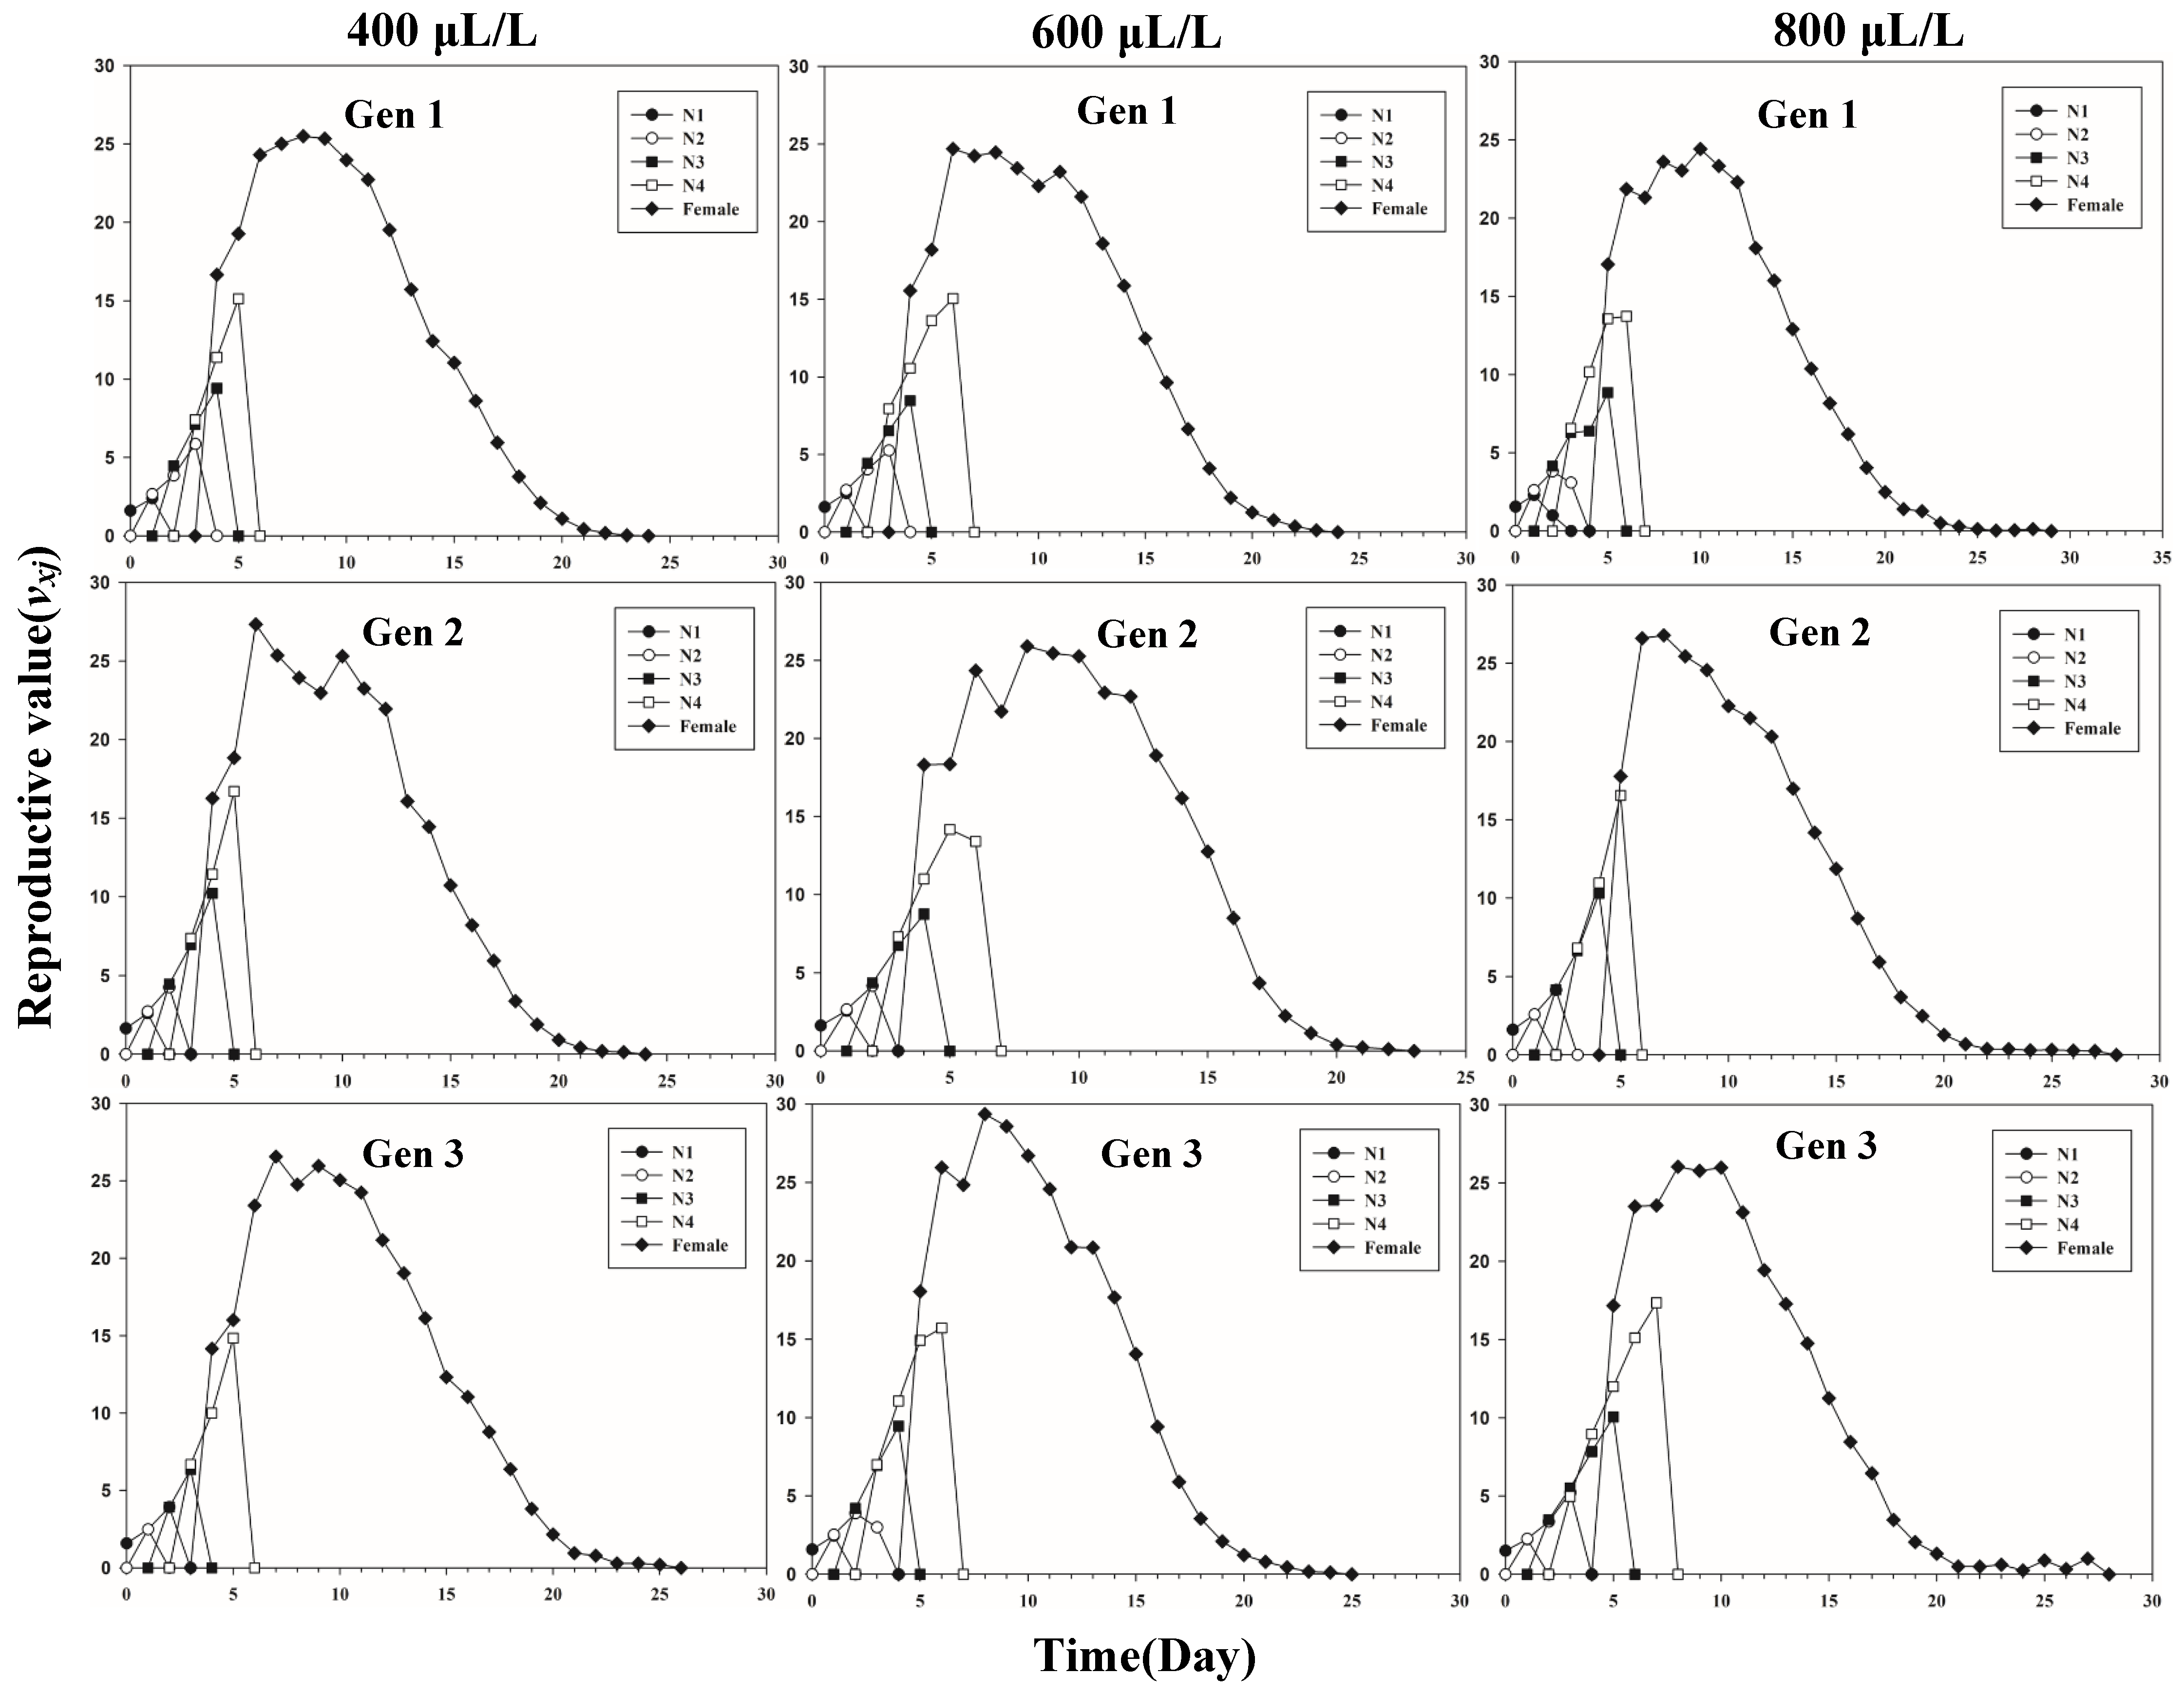
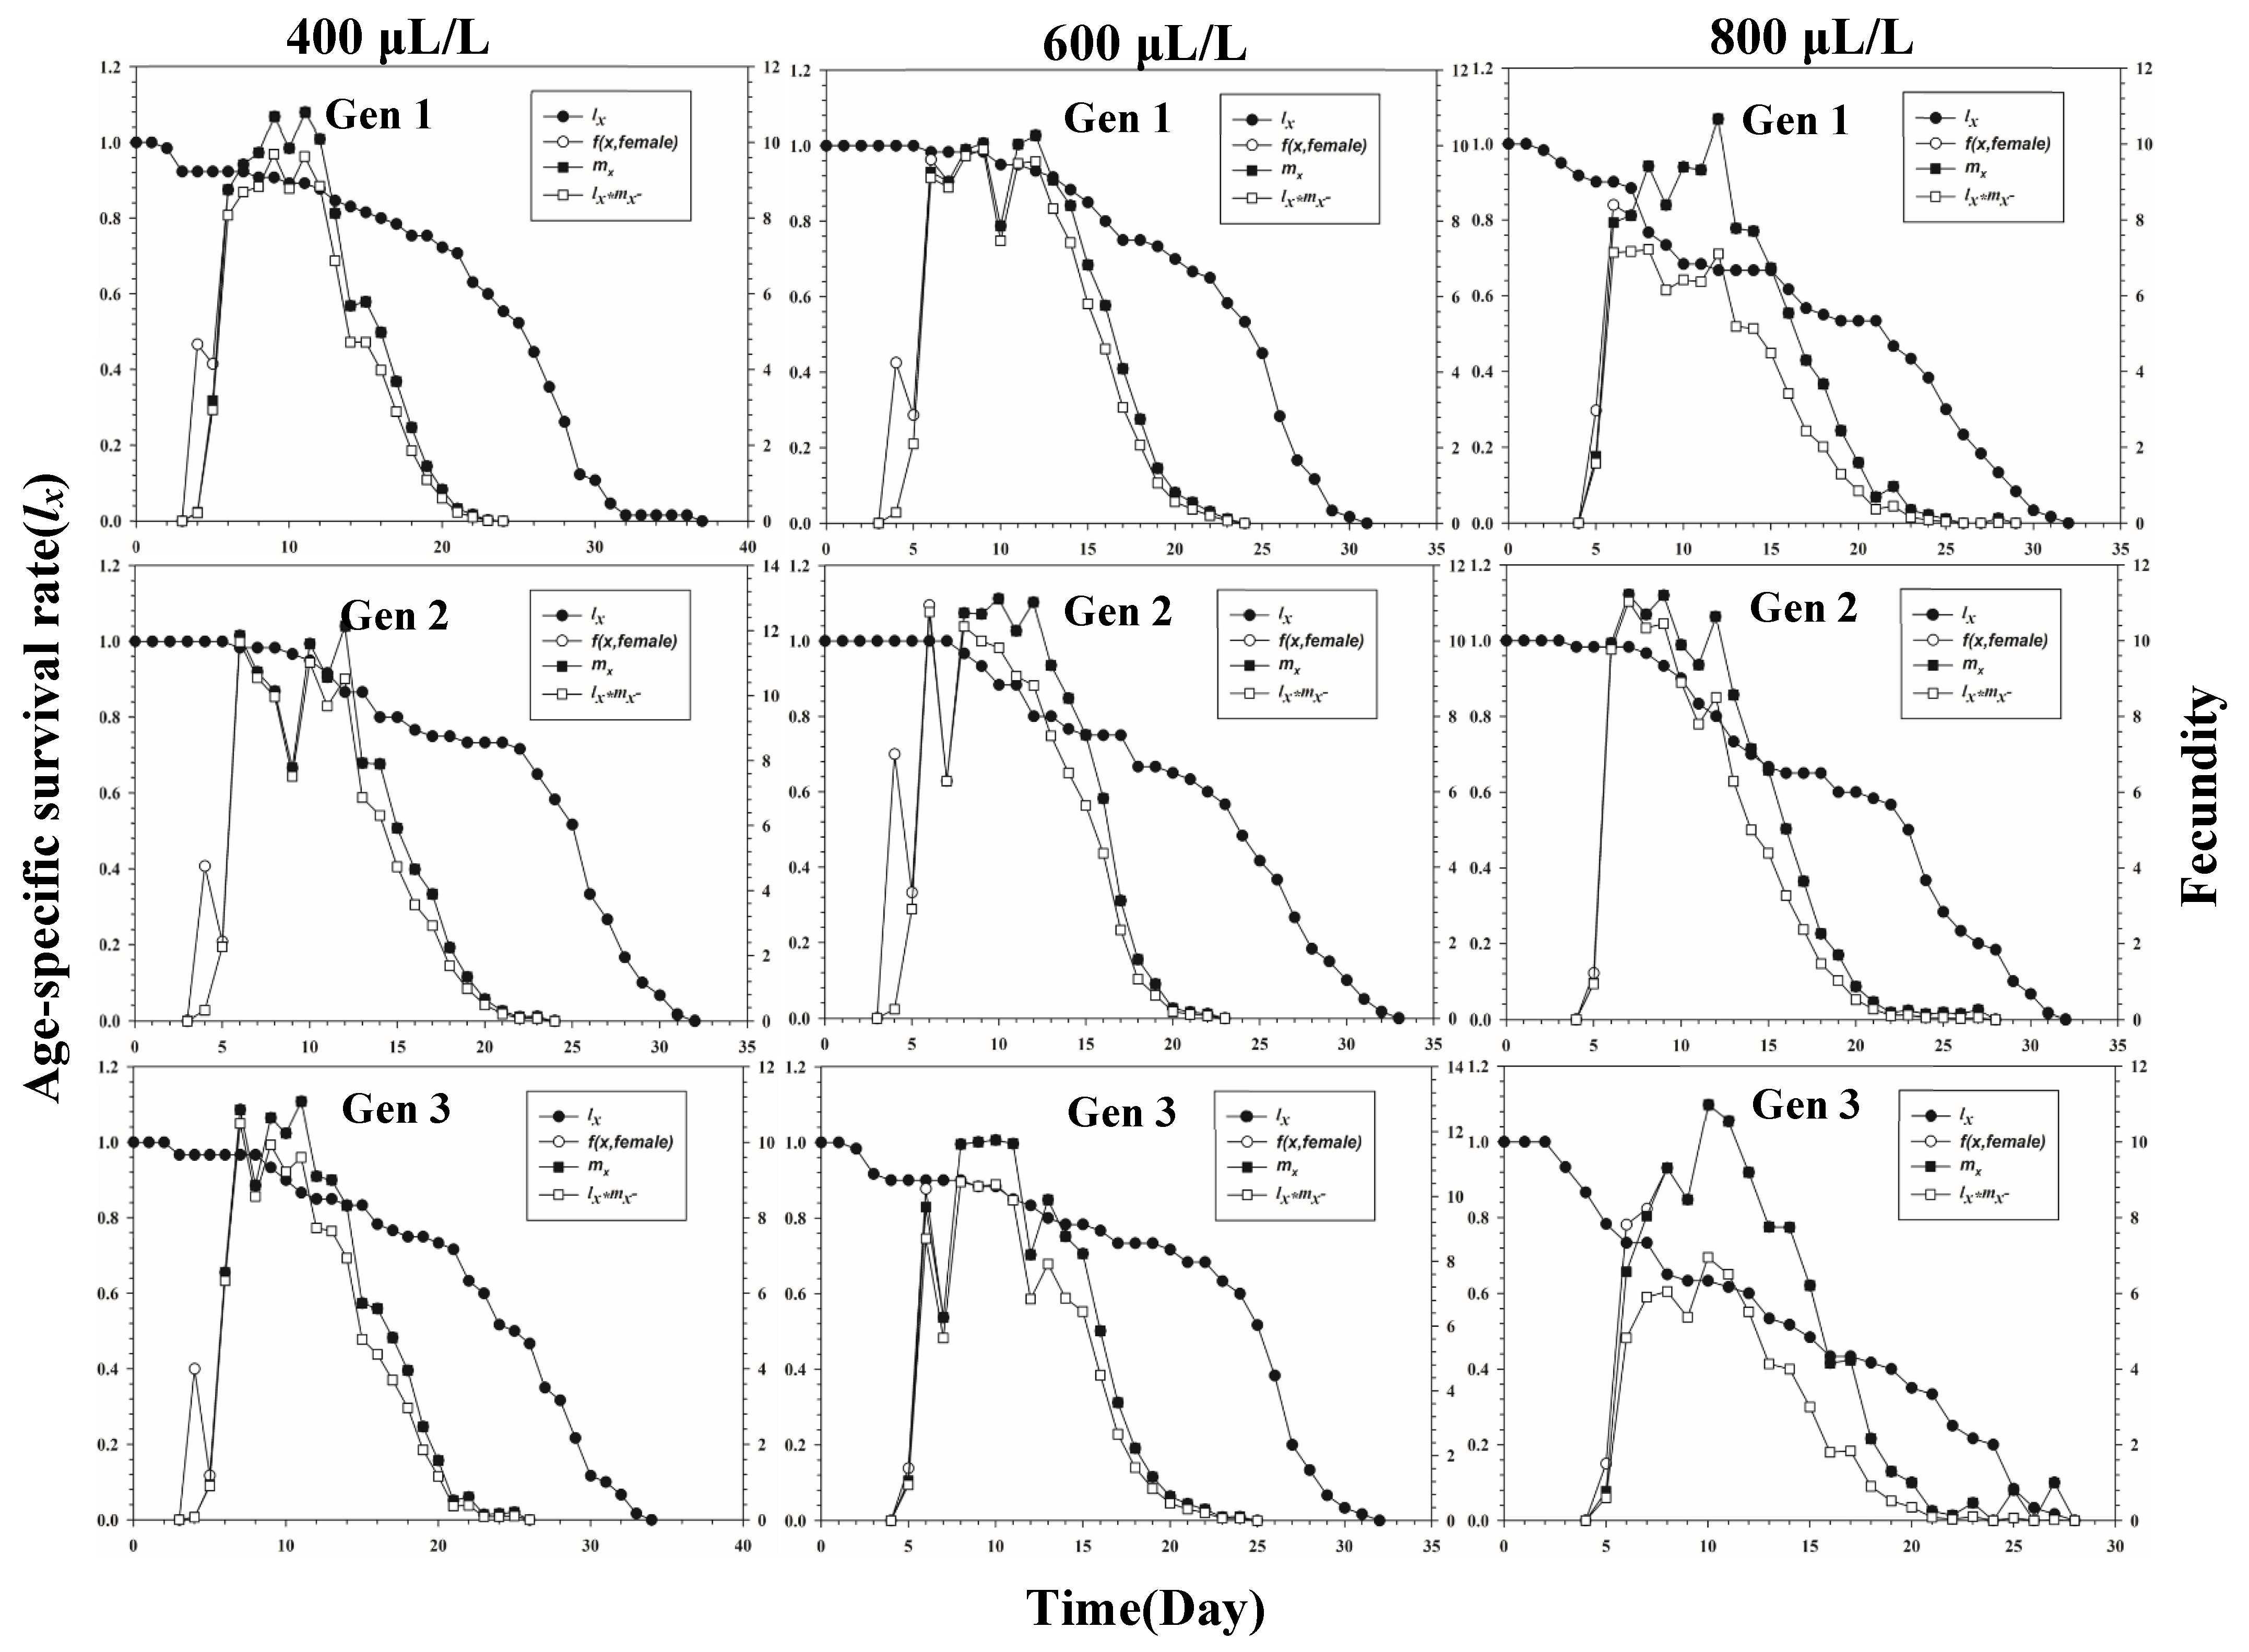
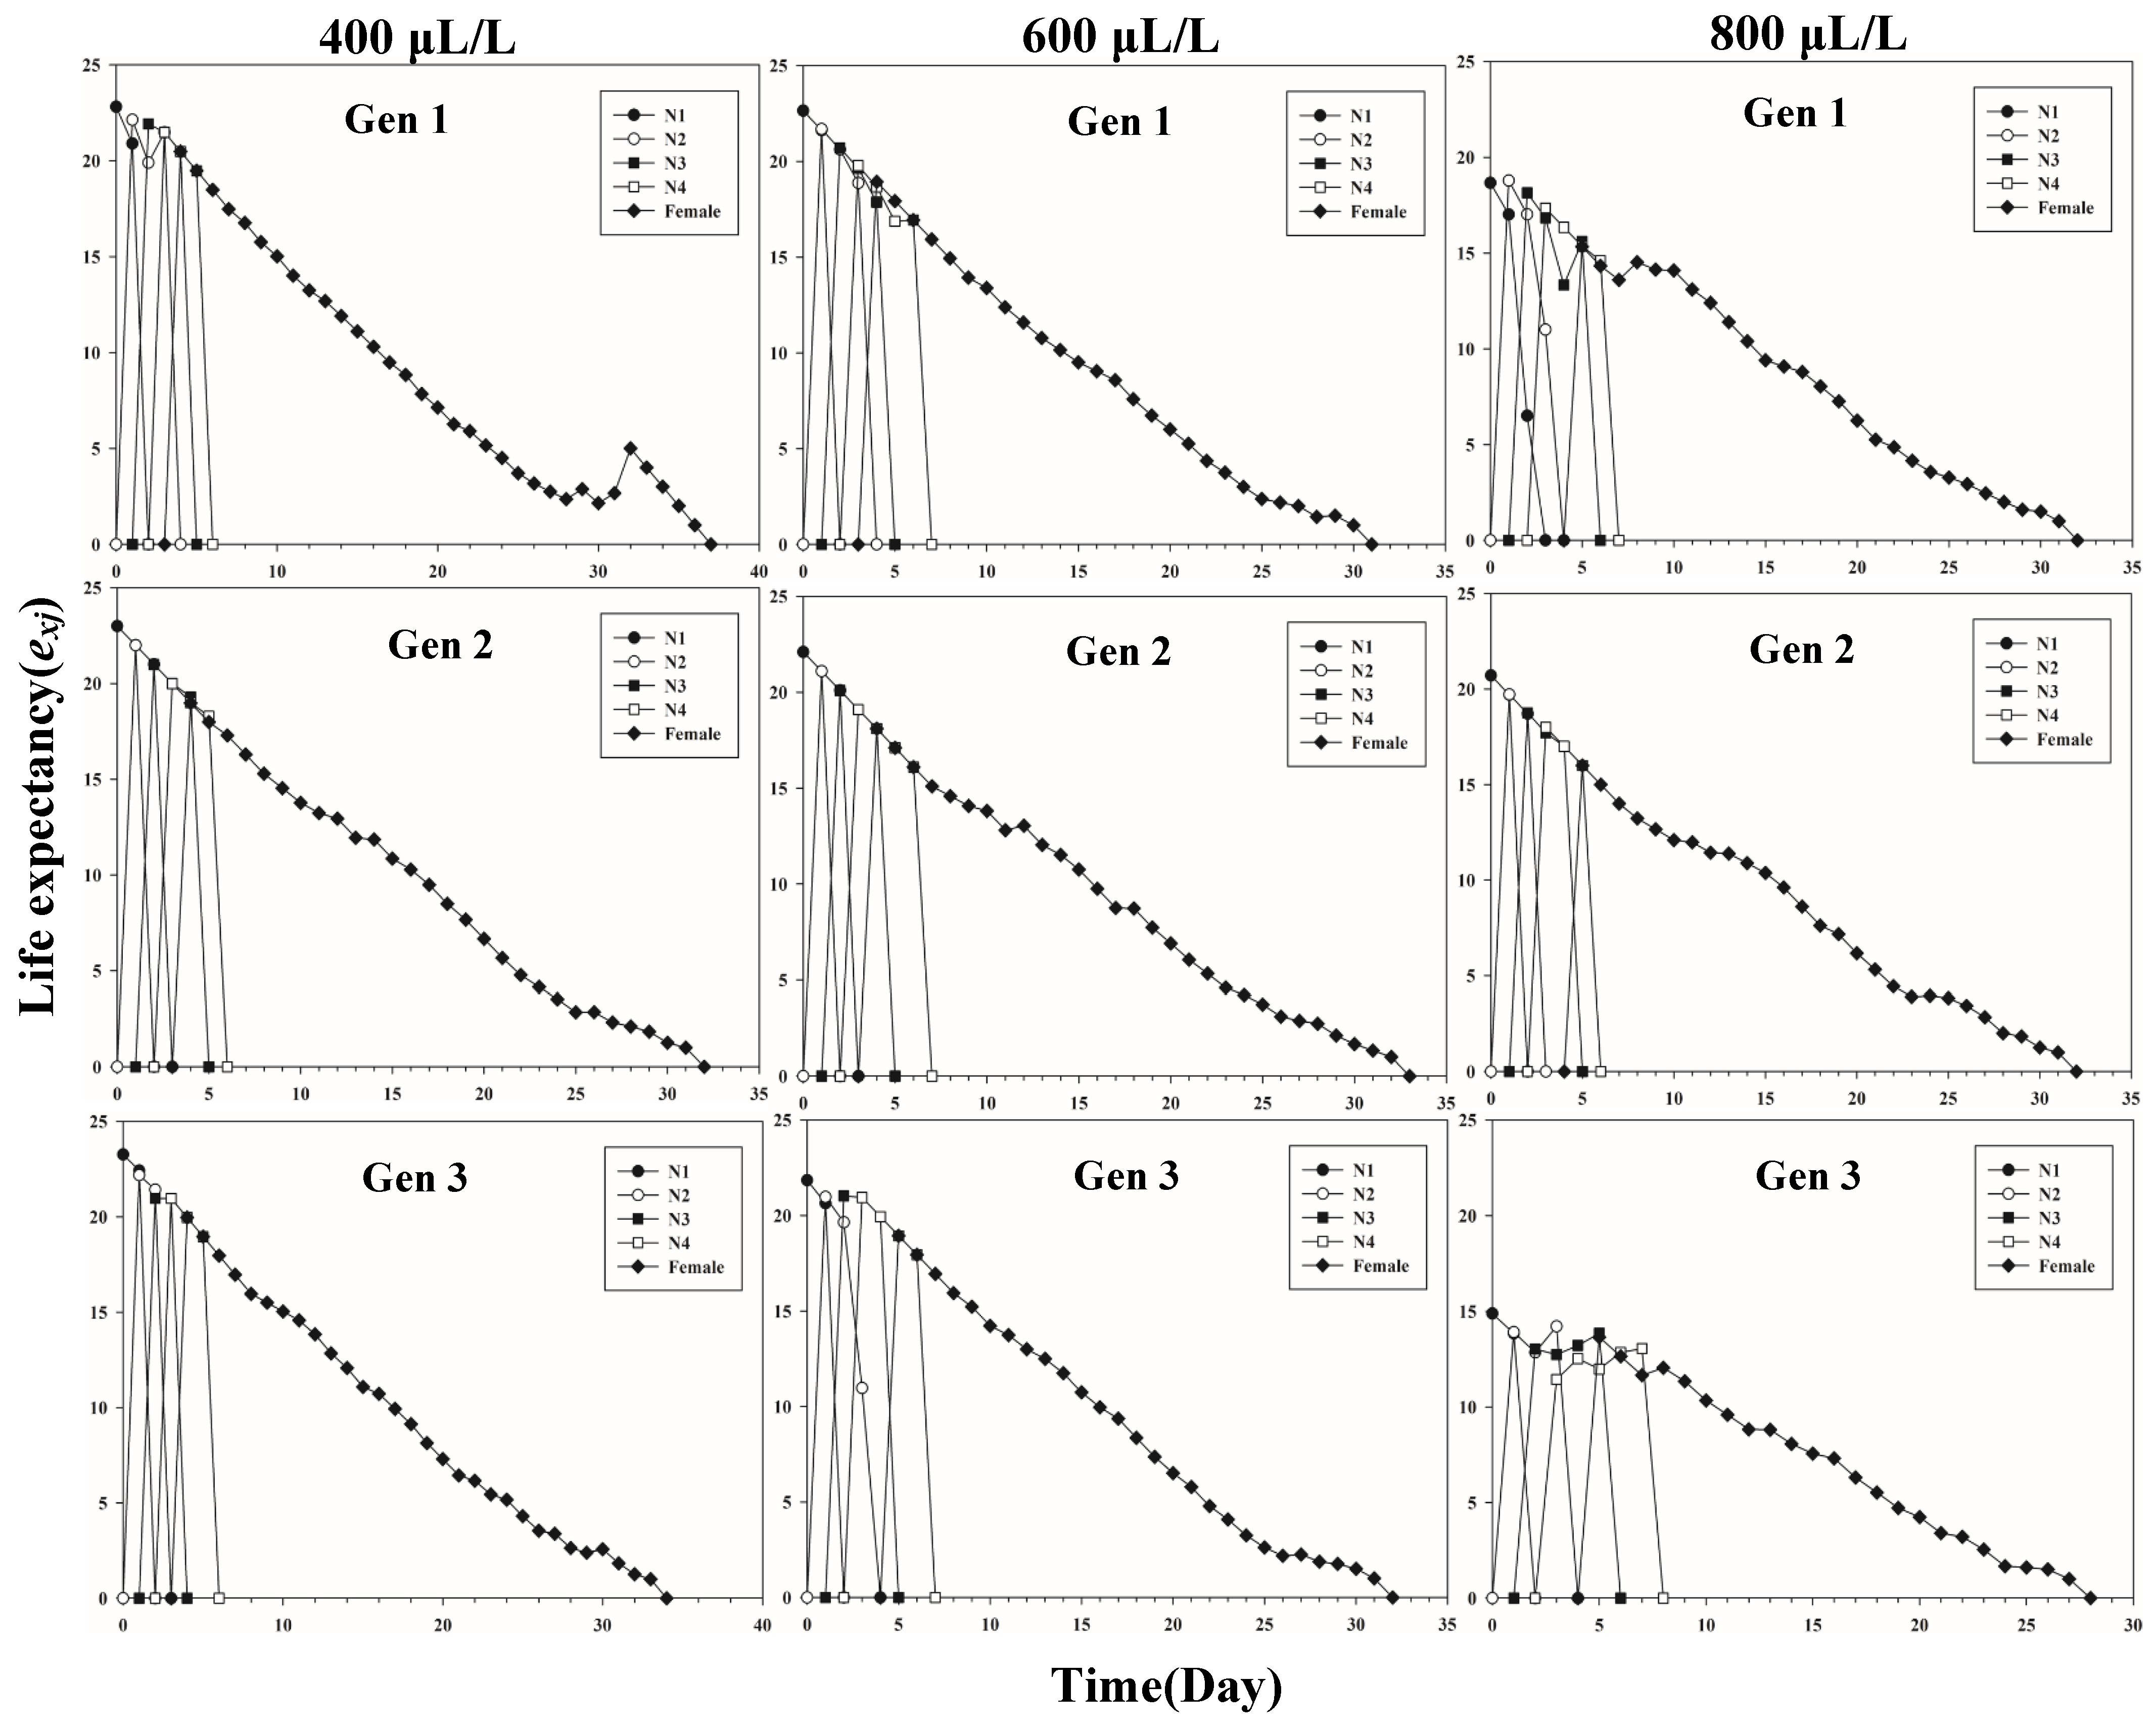
Figure 1 shows the age-stage-specific survival rate (sxj) of three successive generations of L. erysimi in response to three CO2 concentrations. The results show that the lowest survival rate was found in the third instar of the first generation under the 400 μL/L treatment relative to the 600 μL/L and 800 μL/L CO2 treatments (Figure 1). In Figure 2, the largest reproductive contribution (vxj) (vxj ≥ 29) of the third generation can be observed under the 600 μL/L CO2 treatment during the reproductive peak of L. erysimi (Figure 2). The age-specific survival rate (lx) and age-specific fecundity (fxj) reflected the growth of L. erysimi with age (days), survival, and its fecundity (Figure 3). The results show that the age-specific survival rate (lx) declined rapidly in the first and third generations under the 800 μL/L CO2 treatment, and the survival rate under the 800 μL/L CO2 treatment is significantly lower than those for the 400 μL/L and 600 μL/L CO2 treatments (Figure 3). Significantly, lower peaks of age-specific fecundity (mx) were found for the first and third generations under the 800 μL/L treatment compared with the 400 μL/L and 600 μL/L CO2 treatments, which indicates that 800 μL/L CO2 treatment had an inhibitory effect on the fecundity of L. erysimi (Figure 3). Figure 4 shows that the highest age-stage-specific life expectancy (exj) of L. erysimi was under the 400 μL/L CO2 treatment, followed by the 600 μL/L CO2 treatment. The lowest age-stage-specific life expectancy (exj) of L. erysimi was under the 800 μL/L CO2 treatment, and the exj value is 15.02 (Figure 4). The results indicate that the life span of L. erysimi tends to be shortened under the 800 μL/L CO2 treatment relative to the other two CO2 treatments (Figure 4).
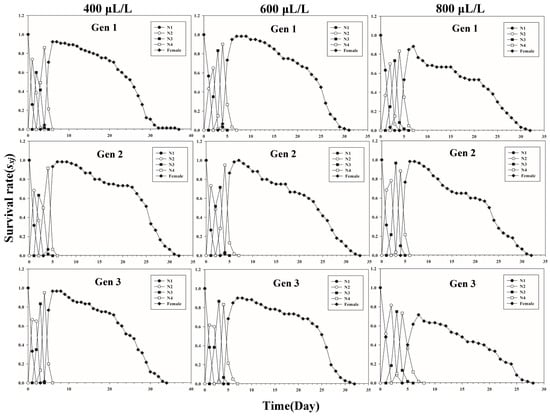
Figure 1.
Age-stage-specific survival rates (sxj) of three successive generations of L. erysimi under three CO2 treatments.
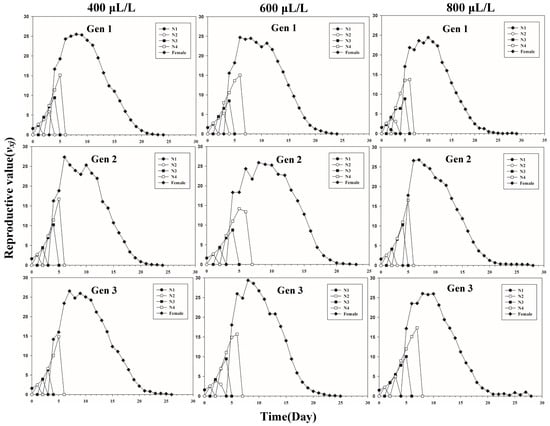
Figure 2.
Age-stage-specific reproductive value (vxj) of three successive generations of L. erysimi under three CO2 treatments.
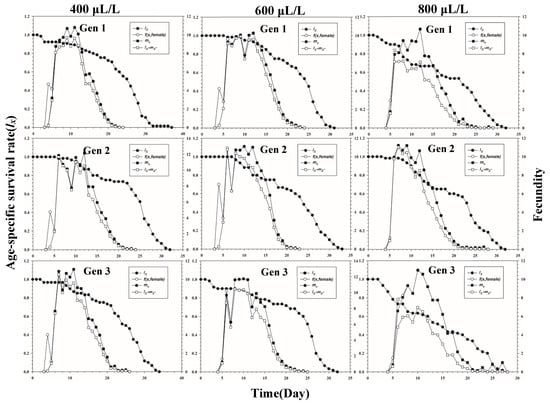
Figure 3.
Age-specific survival rate (lx) (left y-axis), age-stage-specific fecundity (f(x, female)) (right y-axis), age-specific fecundity (mx) (right y-axis), and age-specific maternity (lxmx) (right y-axis) of three successive generations of L. erysimi under three CO2 treatments.
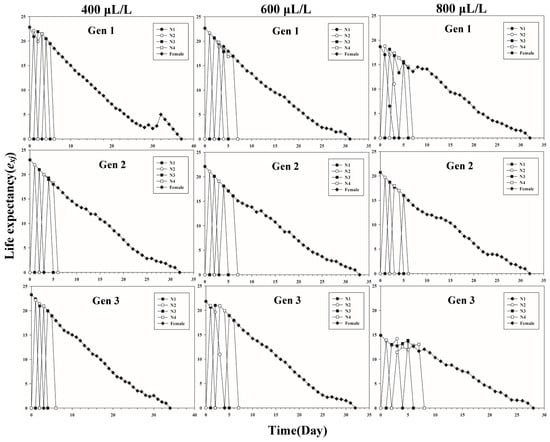
Figure 4.
Age-stage-specific life expectancy (exj) of three successive generations of L. erysimi under three CO2 treatments.
3.2. Population Parameters of L. erysimi
Table 2 shows that a significantly higher intrinsic rate of increase (r) and finite rate of increase (λ) of L. erysimi were found in the second generation relative to the first and third generations under the 800 μL/L treatment (p < 0.05). The r and λ values in the third generation of L. erysimi under the 800 μL/L treatment were significantly lower than those for the 400 μL/L and 600 μL/L treatments (p < 0.05). A significantly higher net reproductive rate (R0) of L. erysimi was found in the second generation relative to the first and third generations under the 800 μL/L treatment (p < 0.05). Additionally, the R0 value decreased significantly in the third generation of L. erysimi under the 800 μL/L treatment compared with the 400 μL/L and 600 μL/L CO2 treatments (p < 0.05). A significantly higher mean generation time (T) of L. erysimi was found in the third generation relative to the second generation under three CO2 concentrations (p < 0.05). However, there were no differences in T value in the second and third generations among three CO2 concentrations (p < 0.05) (Table 2).
Table 2.
Population parameters of successive three generations of L. erysimi under three CO2 treatments (mean ± SE).
4. Discussion
Life table data can provide a comprehensive understanding of the development, survivorship, and fecundity of a population cohort of herbivorous insects, revealing the fitness of a population in variable biotic and abiotic conditions. Compared with the traditional age-specific life table, the two-sex life table incorporates the male component of a population as well as the stage differentiation of population individuals [14]. The present study measured the effect of elevated CO2 on the individual life history and population dynamics parameters of three successive generations of L. erysimi. The results show that a significantly longer TPOP was observed in the third generation compared with the first generation of L. erysimi under the 800 μL/L CO2 treatment, which indicates that elevated CO2 can lengthen the TPOP duration and lead to the aggravation of the damage caused by L. erysimi larvae. The fecundity is significantly lower under the 800 μL/L CO2 treatment than under the 400 μL/L CO2 treatment in the third generation of L. erysimi. The results indicate that a high CO2 concentration had a cumulative effect on the fecundity of L. erysimi, and elevated CO2 had a negative effect on the production of L. erysimi. In addition, a significantly lower survival rate was found under the 800 μL/L CO2 treatment compared with that under the 400 μL/L CO2 treatment in the third generation of L. erysimi, which shows that elevated CO2 had an adverse effect on the survival rate of L. erysimi. The fecundity and survival rate results indicate that elevated CO2 has a negative effect on the fitness of L. erysimi. The life expectancy (exj) was significantly lower under the 800 μL/L CO2 treatment than that under the 400 μL/L CO2 treatment in the three successive generations, indicating that the life of L. erysimi was shortened under elevated CO2 conditions. The results show that the L. erysimi was more sensitive to a high CO2 concentration, and the survival rate was lower in the third generation under the 800 μL/L CO2 treatment. Chi and Liu [27] pointed out that neglecting the variable developmental rate and male population may cause errors in calculating demographic parameters, such as the intrinsic rate of increase, net reproductive rate, and the mean generation time [27]. Chi and Liu [27] and Chi [28] developed a two-sex life table to take the stage differentiation and the male population into consideration. Based on the age-stage, two-sex life table [27,28], Chi and Getz (1988) constructed a mass-rearing program for stage-structured populations [29]. Furthermore, mathematical proofs demonstrating the correctness of applying the age-stage, two-sex life table to insect populations were provided by Yu et al. [30] and Chi and Su (2006) [31]. Although aphids develop parthenogenetically during the growing season, the life table of aphids with parthenogenetic development can also be analyzed based on the two-sex life table theory, such as in Seo et al. [32] and Wang et al. [33]. So, the data from the two-sex life table in this present experiment can partially clarify the response of aphids to elevated CO2.
The population projections based on the age-stage, two-sex life table are essential for realistic population growth predictions, which provide many details, such as fitness and potential damage. The raw data obtained from the two-sex life table are meaningful compared to the data from the traditional age-specific life table [27]. Because development rates vary widely in a population, stage differentiation is critical to understanding the population ecology of insect herbivores. Thus, the stage structure is essential in projecting the population and the in-population ecology of herbivorous pests at different stages and ages [14]. In the present study, the population parameters, including the intrinsic rate of increase (r) and finite rate of increase (λ), were significantly higher in the second generation than those in the first and third generations of L. erysimi under the 800 μL/L CO2 treatment. We can see that the population parameters (such as r and λ) of L. erysimi were different from other population parameters, such as in the mean generation time (T) for 800 μL/L CO2 between different generations. The reason for this may be that this experiment only examined three generations of L. erysimi with regard to their response to elevated CO2. Therefore, in future research, we should carry out long-term generations (such as more than ten successive generations) of L. erysimi to study their response to elevated CO2. Additionally, a significantly higher net reproductive rate (R0) was found in the second generation compared with those in the first and third generations of L. erysimi under the 800 μL/L CO2 treatment. However, Fallahpour et al. [34] studied the impact of nitrogen fertilization on the nutritional quality of three canola (Brassica napus L.) cultivars (Zarfam, Okapi, and Modena) and on the performance of L. erysimi. The net reproductive rate (R0) in our experiment is higher than that recorded by Fallahpour et al. [34], indicating that there are differences in R0 between our experiment (climate change factor) and this study (host plants and fertilization factors). The results indicate that there are significant differences in the r and λ of three successive generations of L. erysimi among the three CO2 treatments. Additionally, a high CO2 concentration will have a cumulative effect on the population parameters (r and λ) of L. erysimi, and an 800 μL/L CO2 concentration has a more negative effect on the r and λ of the third generation than on those in the first generation of L. erysimi. Moreover, significantly lower r and λ were observed in insects undergoing the 800 μL/L CO2 treatment compared with those undergoing the 400 μL/L and 600 μL/L CO2 treatments in the first generation of L. erysimi, which indicates that elevated CO2 has a short-term instantaneous effect on the population parameters (r and λ) of L. erysimi.
5. Conclusions
Our studies provide a profile to exemplify the effect of elevated CO2 on the life table, consumption rate, population parameters, and population projection of three successive generations of L. erysimi using the age-stage, two-sex life table rather than the traditional age-specific life table. The results show that high CO2 concentration had a cumulative effect on the survival rate and fecundity of L. erysimi, and elevated CO2 had a negative effect on the individual fitness parameters of L. erysimi. Combined with the population dynamics parameters, we can conclude that elevated CO2 has a short-term instantaneous effect on the population parameters (r and λ) of L. erysimi. Based on the data from this study, we believe that the individual and population fitness of L. erysimi will decrease under elevated CO2, which can provide a data reference for the comprehensive prevention and control of L. erysimi under the future increasing CO2 levels.
Author Contributions
Conceptualization, G.W.; writing—original draft, X.-M.L.; formal analysis, M.-H.Z.; investigation, X.-M.L., M.-H.Z., F.-G.S., Y.-H.Z., C.-M.L. and S.-J.H.; project administration, G.W.; writing—review and editing, F.H. and G.W. All authors have read and agreed to the published version of the manuscript.
Funding
This research was funded by the National Modern Agricultural Industrial Technology System of the Ministry of Finance and the Ministry of Agriculture and Rural Affairs (CARS-23-C10), and the Hubei Province Biodiversity Background Survey, Observation and Evaluation Project.
Institutional Review Board Statement
Not applicable.
Data Availability Statement
Data are contained within the article.
Conflicts of Interest
The authors declare no conflict of interest.
References
- Fukayama, H.; Sugino, M.; Fukude, T.; Masumoto, C.; Taniguchi, Y.; Okada, M.; Sameshima, R.; Hatanaka, T.; Misso, S.; Hasegawa, T.; et al. Gene expression profiling of roce grown in free air CO2 enrichment. Oecologia 2011, 104, 454–466. [Google Scholar]
- Seneweera, S.; Makino, A.; Hirotu, N.; Norton, R.; Suzuki, Y. New insight into photosynthetic acclimation to elevated CO2: The role of leaf nitrogen and ribulose-1, 5-bisphosphate carboxylase/oxygenase content in rice leaves. Environ. Exp. Bot. 2011, 71, 128–136. [Google Scholar] [CrossRef]
- Integovernmental Panel on Climate Change. The Physical Science Basis; IPCC Fifth Assessment Report; IPCC, 2013; Available online: http://www.ipcc.ch/report/ar5/wg1/ (accessed on 20 March 2022).
- Woodward, F.I. Global change: Translating plant ecophysiological responses to ecosystems. Trends Ecol. Evol. 1990, 5, 308–311. [Google Scholar] [CrossRef]
- Hartley, S.E.; Jones, C.G.; Couper, G.C.; Jones, T.H. Biosynthesis of plant phenolic compounds in elevated atmospheric CO2. Glob. Chang. Biol. 2000, 6, 497–506. [Google Scholar] [CrossRef]
- Kitao, M.S.; Komatsu, M.; Yazaki, K.C.; Kitaoka, S.S.; Tobita, H. Growth overcompensation against O3 exposure in two Japanese oak species, Quercus mongolica var. crispula and Quercus serrata, grown under elevated CO2. Environ. Pollut. 2015, 206, 133–141. [Google Scholar] [CrossRef]
- Novriyanti, E.; Watanabe, M.; Kitao, M.S.; Utsugi, H.; Uemura, A.; Koike, T.S. High nitrogen and elevated [CO2] effects on the growth, defense and photosynthetic performance of two eucalypt species. Environ. Pollut. 2012, 170, 124–130. [Google Scholar] [CrossRef] [Green Version]
- Wu, G.; Chen, F.J.; Ge, F. Impacts of early-season square abscission on the growth and yield of transgenic Bt cotton under elevated CO2. Field Crops Res. 2007, 102, 239–243. [Google Scholar] [CrossRef]
- Fitzgerald, G.J.; Tausz, M.; O’Leary, G.J.; Mollah, M.R.; Tausz-Posch, S.; Seneweera, S.; Mock, I.; Löw, M.; Partington, D.L.; Mcneil, D.; et al. Elevated atmospheric [CO2] can dramatically increase wheat yields in semi-arid environments and buffer against heat waves. Glob. Chang. Biol. 2016, 22, 2269–2284. [Google Scholar] [CrossRef] [PubMed] [Green Version]
- Zhao, M.H.; Zheng, X.X.; Liu, J.P.; Zeng, Y.Y.; Yang, F.L.; Wu, G. Time-dependent stress evidence in dynamic allocation of physiological metabolism of Nilaparvata lugens in response to elevated CO2. Environ. Pollut. 2020, 265, 114767. [Google Scholar] [CrossRef]
- Yan, H.Y.; Guo, H.G.; Sun, Y.C.; Ge, F. Plant phenolics mediated bottom-up effects of elevated CO2 on Acyrthosiphon pisum and its parasitoid Aphidius avenae. Insect Sci. 2020, 27, 170–184. [Google Scholar] [CrossRef]
- Robinson, E.A.; Ryan, G.D.; Newman, J.A. A meta-analytical review of the effects of elevated CO2 on plant–arthropod interactions highlights the importance of interacting environmental and biological variables. New Phytol. 2012, 194, 321–336. [Google Scholar] [CrossRef] [PubMed] [Green Version]
- Zheng, X.X.; Wu, G. How does the arthropod-plant system respond to abrupt and gradual increases in atmospheric CO2? J. Integr. Agric. 2020, 4, 1156–1160. [Google Scholar] [CrossRef]
- Liu, J.P.; Huang, W.K.; Chi, H.; Wang, C.H.; Hua, H.X.; Wu, G. Effects of elevated CO2 on the fitness and potential population damage of Helicoverpa armigera based on two-sex life table. Sci. Rep. 2017, 7, 1119. [Google Scholar] [CrossRef] [PubMed] [Green Version]
- Liu, J.P.; Zhuang, J.; Huang, W.K.; Chi, H.; Wang, C.H.; Hua, H.X.; Wu, G. Different adaptability of the brown planthopper Nilaparvata lugens (Stål), to gradual and abrupt increases in atmospheric CO2. J. Pest Sci. 2020, 93, 979–991. [Google Scholar] [CrossRef]
- Sun, Y.C.; Guo, H.J.; Yuan, E.Y.; Ge, F. Elevated CO2 increases R gene-dependent resistance of Medicago truncatula against the pea aphid by up-regulating a heat shock gene. New Phytol. 2018, 217, 1697–1711. [Google Scholar] [CrossRef] [PubMed] [Green Version]
- Chen, F.J.; Wu, G.; Ge, F. Impacts of elevated CO2 on the population abundance and reproductive activity of aphid Sitobion avenae Fabricius feeding on spring wheat. J. Appl. Entomol. 2004, 128, 723–730. [Google Scholar] [CrossRef]
- Wen, D.; Liu, J.; Fan, S.; Zhang, Z.Y.; Wu, G. Evaluation on the fitness and population projection of Nilaparvata lugens in response to elevated CO2 using two-sex life table. Int. J. Pest Manag. 2019, 66, 368–377. [Google Scholar] [CrossRef]
- Whittaker, J.B. Insects and plants in a changing atmosphere. J. Ecol. 2001, 89, 507–518. [Google Scholar] [CrossRef]
- Sun, Y.C.; Ge, F. How do aphids respond to elevated CO2? J. Asia-Pac. Entomol. 2011, 14, 217–220. [Google Scholar] [CrossRef]
- Newman, J.A.; Gibsons, A.J.; Thornley, J.H.M. How predictable are aphid population responsesto elevated CO2? J. Anim. Ecol. 2003, 72, 556–566. [Google Scholar] [CrossRef]
- Liu, T.X.; Yue, B.S. Host selection, development, survival, and reproduction of turnip Aphid (Homoptera: Aphididae) on green and red cabbage varieties. J. Econ. Entomol. 2000, 93, 1308–1314. [Google Scholar]
- Qayyum, A.; Aziz, M.A.; Iftikhar, A.; Hafeez, F.; Atlihan, R. Demographic Parameters of Lipaphis erysimi (Hemiptera: Aphididae) on Different Cultivars of Brassica Vegetables. J. Econ. Entomol. 2018, 111, 1885–1894. [Google Scholar] [CrossRef] [PubMed]
- Yue, B.S.; Zou, F.D.; Sun, Q.Z. The occurrence of alate turnip aphid Lipaphis erysimi (Homoptera: Aphididae) and its development and reproduction. J. Southwest Agric. Univ. 2002, 24, 17–20. (In Chinese) [Google Scholar]
- Chen, F.J.; Ge, F.; Su, J.W. An improved open-top chamber for research on the effects of elevated CO2 on agricultural pests in field. Chin. J. Ecol. 2005, 24, 585–590. (In Chinese) [Google Scholar]
- Chi, H. TWOSEX-MSChart: A Computer Program for the Age-Stage, Two-Sex Life Table Analysis; Nation Chung Hsing University: Taichung, Taiwan, 2017; Available online: http://140.120.197.173/Ecology/prod02.htm (accessed on 20 March 2022).
- Chi, H.; Liu, H. Two new methods for study of insect population ecology. Bull. Inst. Zool. Acad. Sin. 1985, 24, 225–240. [Google Scholar]
- Chi, H. Life-table analysis incorporating both sexes and variable development rates among individuals. Environ. Entomol. 1988, 17, 26–34. [Google Scholar] [CrossRef]
- Chi, H.; Getz, W.M. Mass rearing and harvesting based on an age-stage, two-sex life table: A potato tuber worm (Lepidoptera: Gelechiidae) case study. Environ. Entomol. 1988, 17, 18–25. [Google Scholar] [CrossRef]
- Yu, J.Z.; Chi, H.; Chen, B.H. Life table and predation of Lemnia biplagiata (Coleoptera: Coccinellidae) fed on Aphis gossypii (Homoptera: Aphididae) with a proof on relationship among gross reproduction rate, net reproduction rate, and preadult survivorship. Ann. Entomol. Soc. Am. 2005, 98, 475–482. [Google Scholar] [CrossRef] [Green Version]
- Chi, H.; Su, H.Y. Age-stage, two-sex life tables of Aphidius gifuensis (Ashmead) (Hymenoptera: Braconidae) and its host Myzus persicae (Sulzer) (Homoptera: Aphididae) with mathematical proof of the relationship between female fecundity and the net reproductive rate. Environ. Entomol. 2006, 35, 10–21. [Google Scholar] [CrossRef]
- Seo, B.Y.; Kim, E.Y.; Ahn, J.J.; Kim, Y.; Kang, S.; Jung, J.K. Development, Reproduction, and Life Table Parameters of the Foxglove Aphid, Aulacorthum solani Kaltenbach (Hemiptera: Aphididae), on Soybean at Constant Temperatures. Insects 2020, 11, 296. [Google Scholar] [CrossRef]
- Wang, L.; Wang, Q.; Wang, Q.; Rui, C.; Cui, L. The feeding behavior and life history changes in imidacloprid-resistant Aphis gossypii glover (Homoptera: Aphididae). Pest Manag. Sci. 2020, 76, 1402–1412. [Google Scholar] [CrossRef] [PubMed]
- Fallahpour, F.; Ghorbani, R.; Mahallati, M.N.; Hosseini, M. Demographic parameters of Lipaphis erysimi on canola cultivars under different nitrogen fertilization regimes. J. Agric. Sci. Technol. 2015, 17, 35–47. [Google Scholar]
Publisher’s Note: MDPI stays neutral with regard to jurisdictional claims in published maps and institutional affiliations. |
© 2022 by the authors. Licensee MDPI, Basel, Switzerland. This article is an open access article distributed under the terms and conditions of the Creative Commons Attribution (CC BY) license (https://creativecommons.org/licenses/by/4.0/).